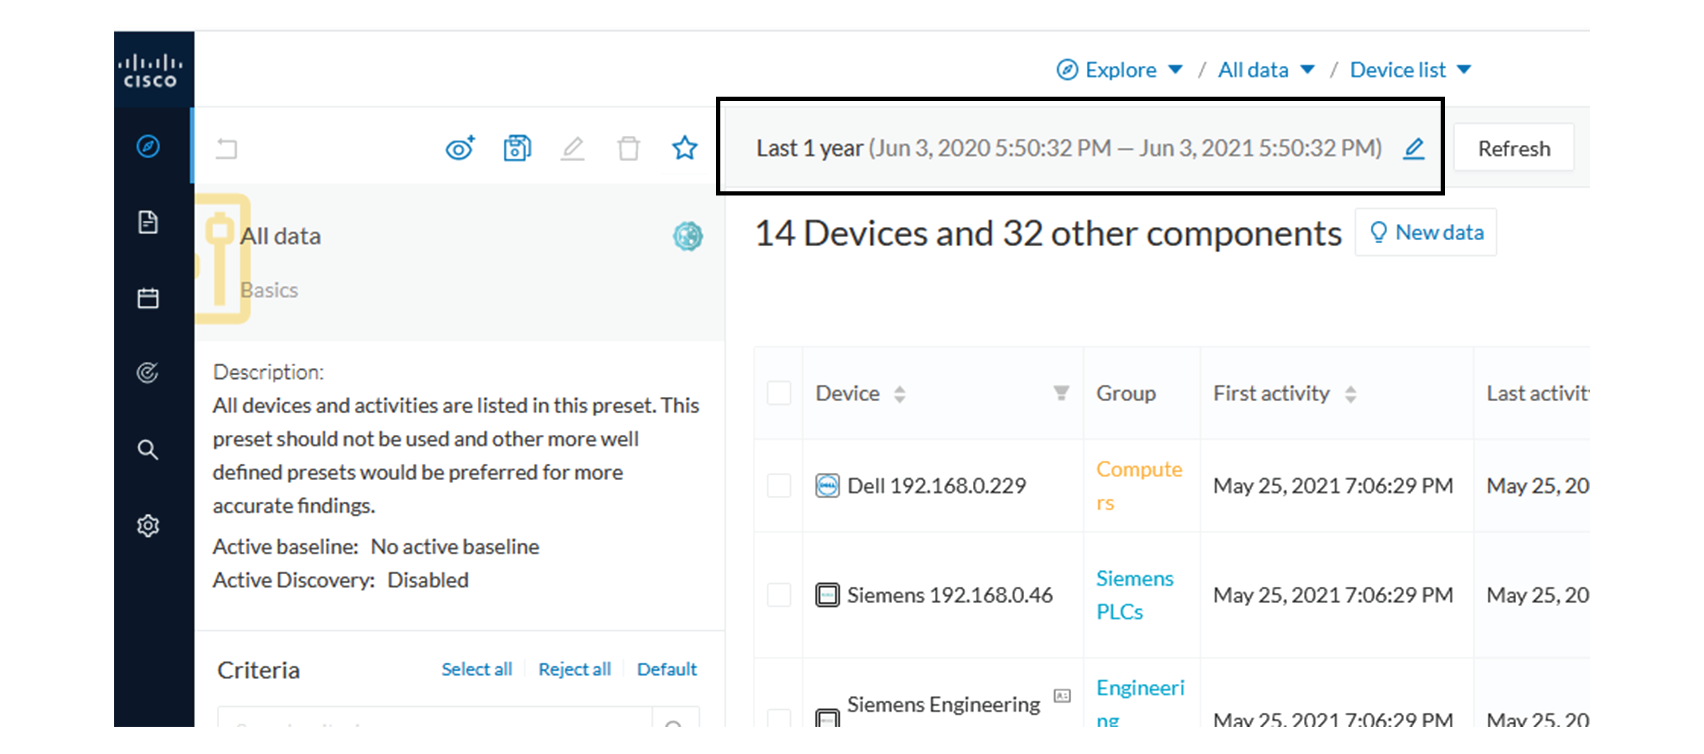
Cyber Vision data can be filtered to build a preset per:
-
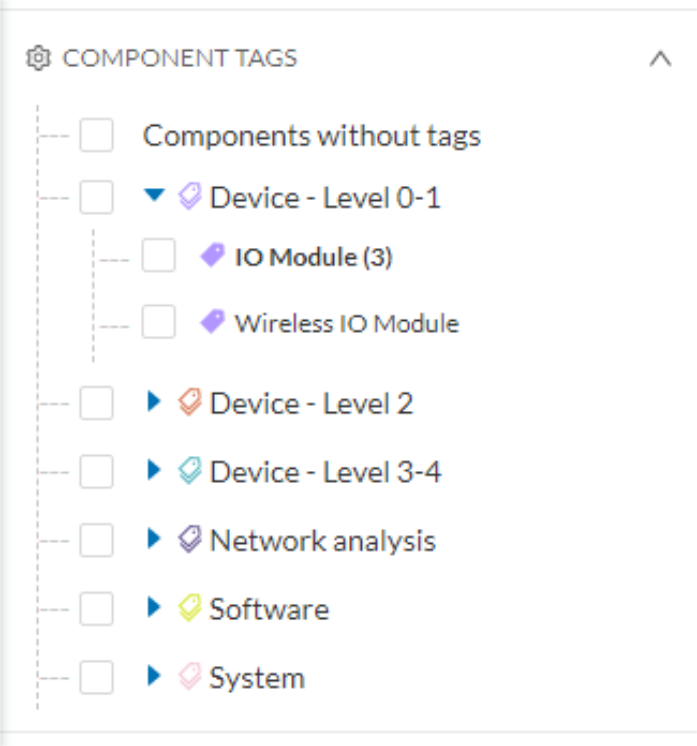
Device tags: devices
-
Risk score: device individual risk
-
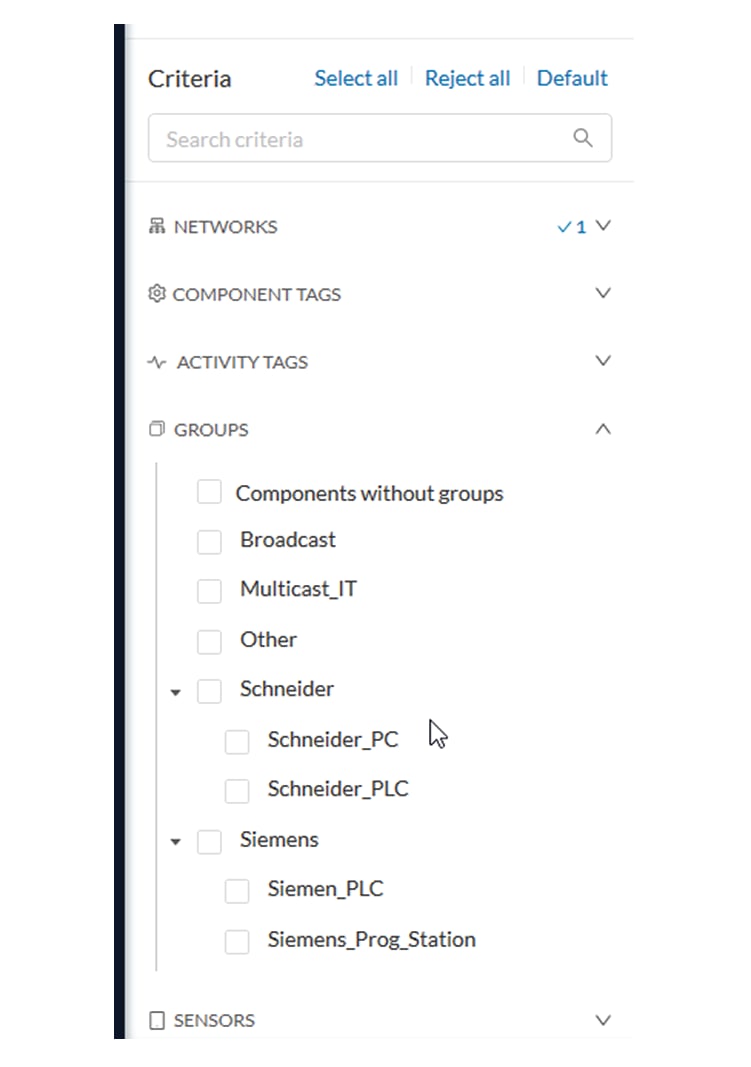
Groups: devices
-
Activity tags: activities
-
Sensors: device “location”
-
Networks: device IPs
-
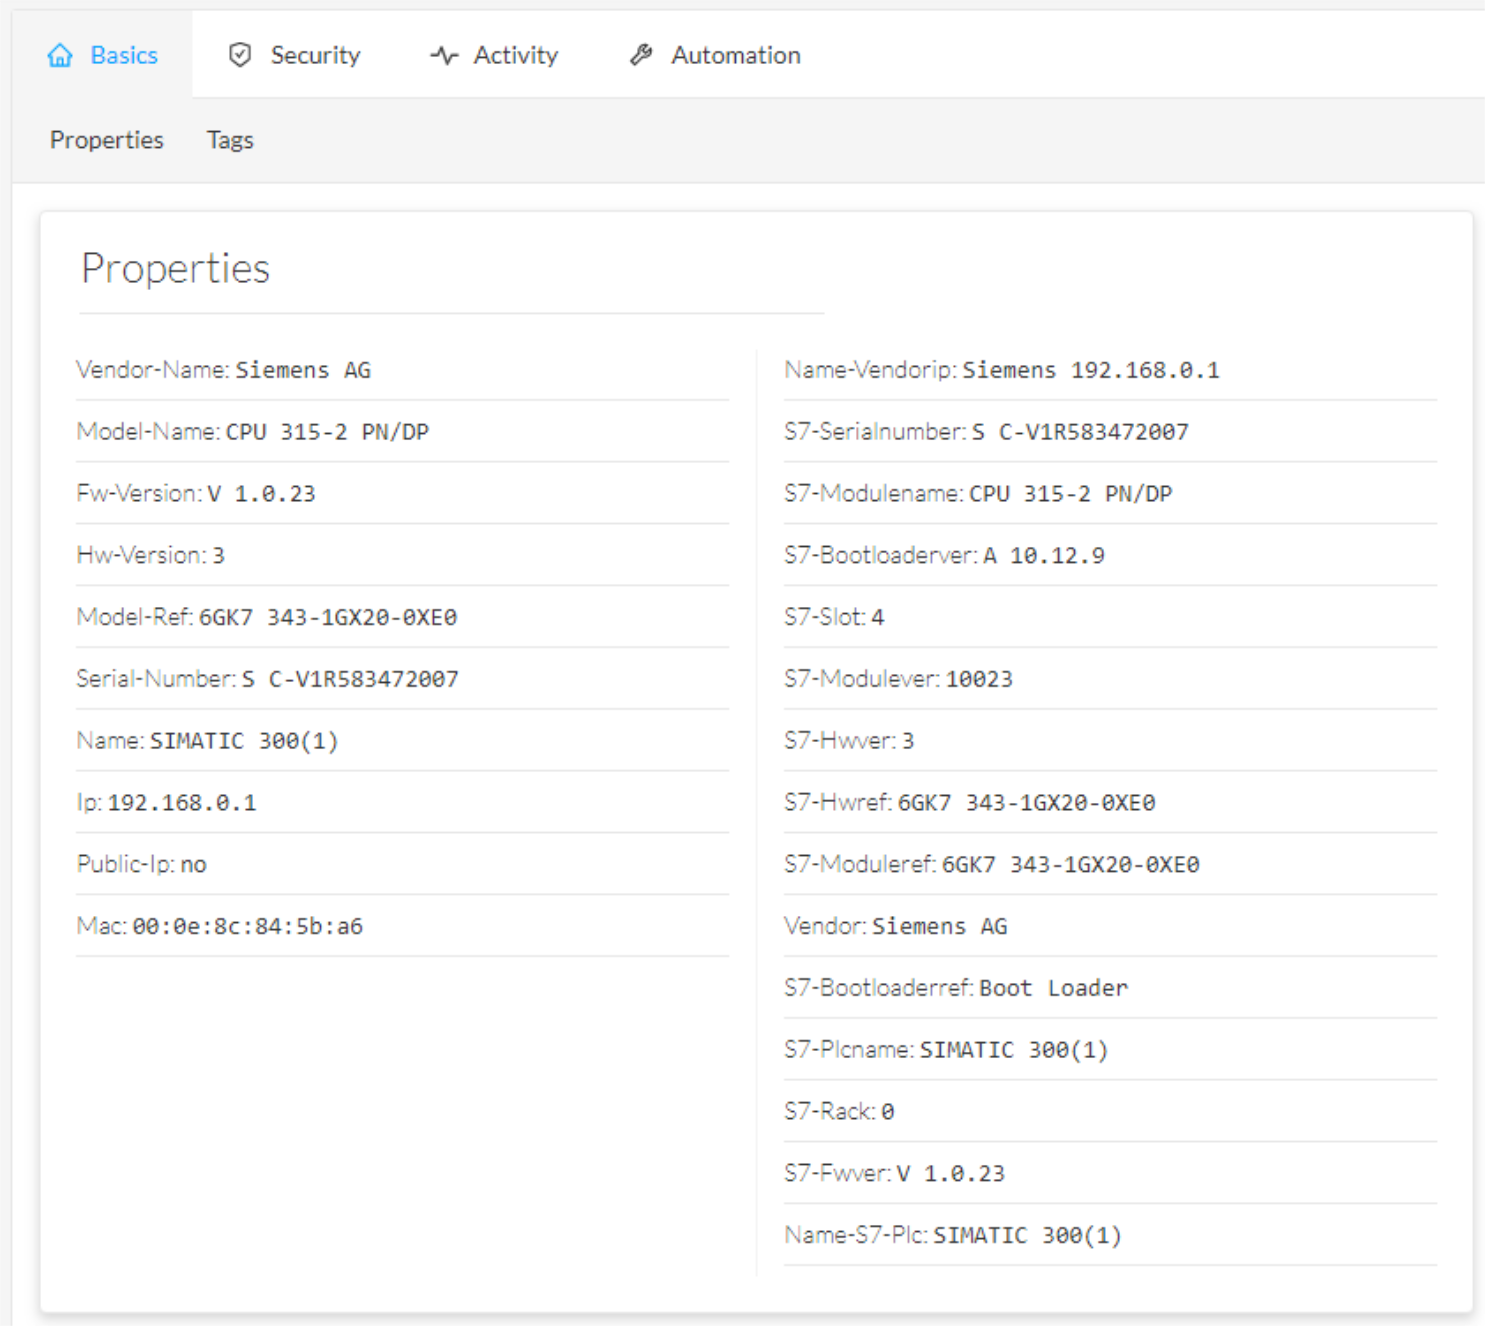
Keyword: device properties including IP, MAC, names, vendor, etc…
Filters work differently whether they are affecting devices and/or activities. Their combination will limit the scope of data
visualized in the different views for a preset:
Each category allows to define a subset of the components, or activities for the Activity filter.
If filters are defined by several categories, the resulting dataset is the intersect of the selections for each category.
The way each parameter can be used in filters is explained in the next sections.
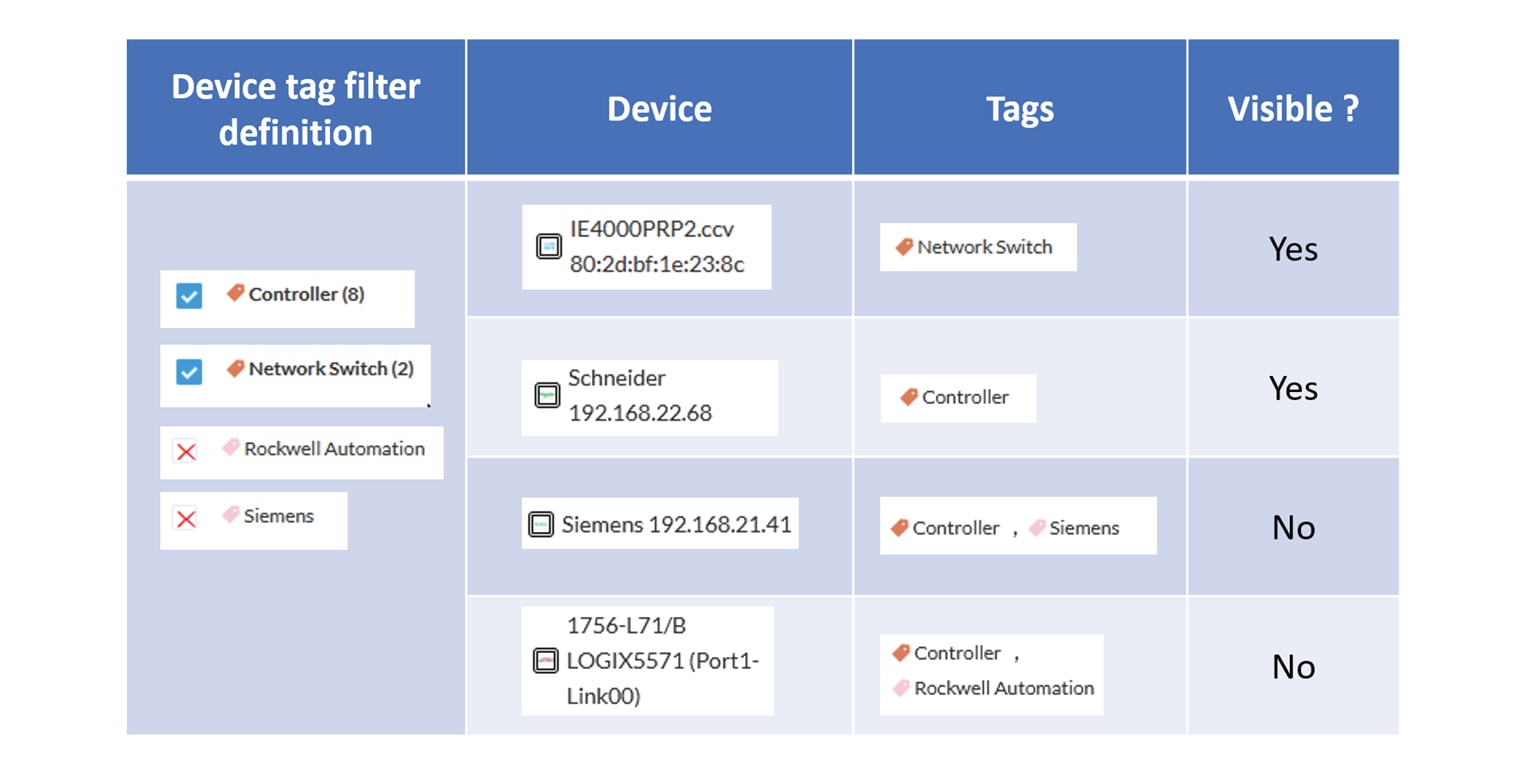
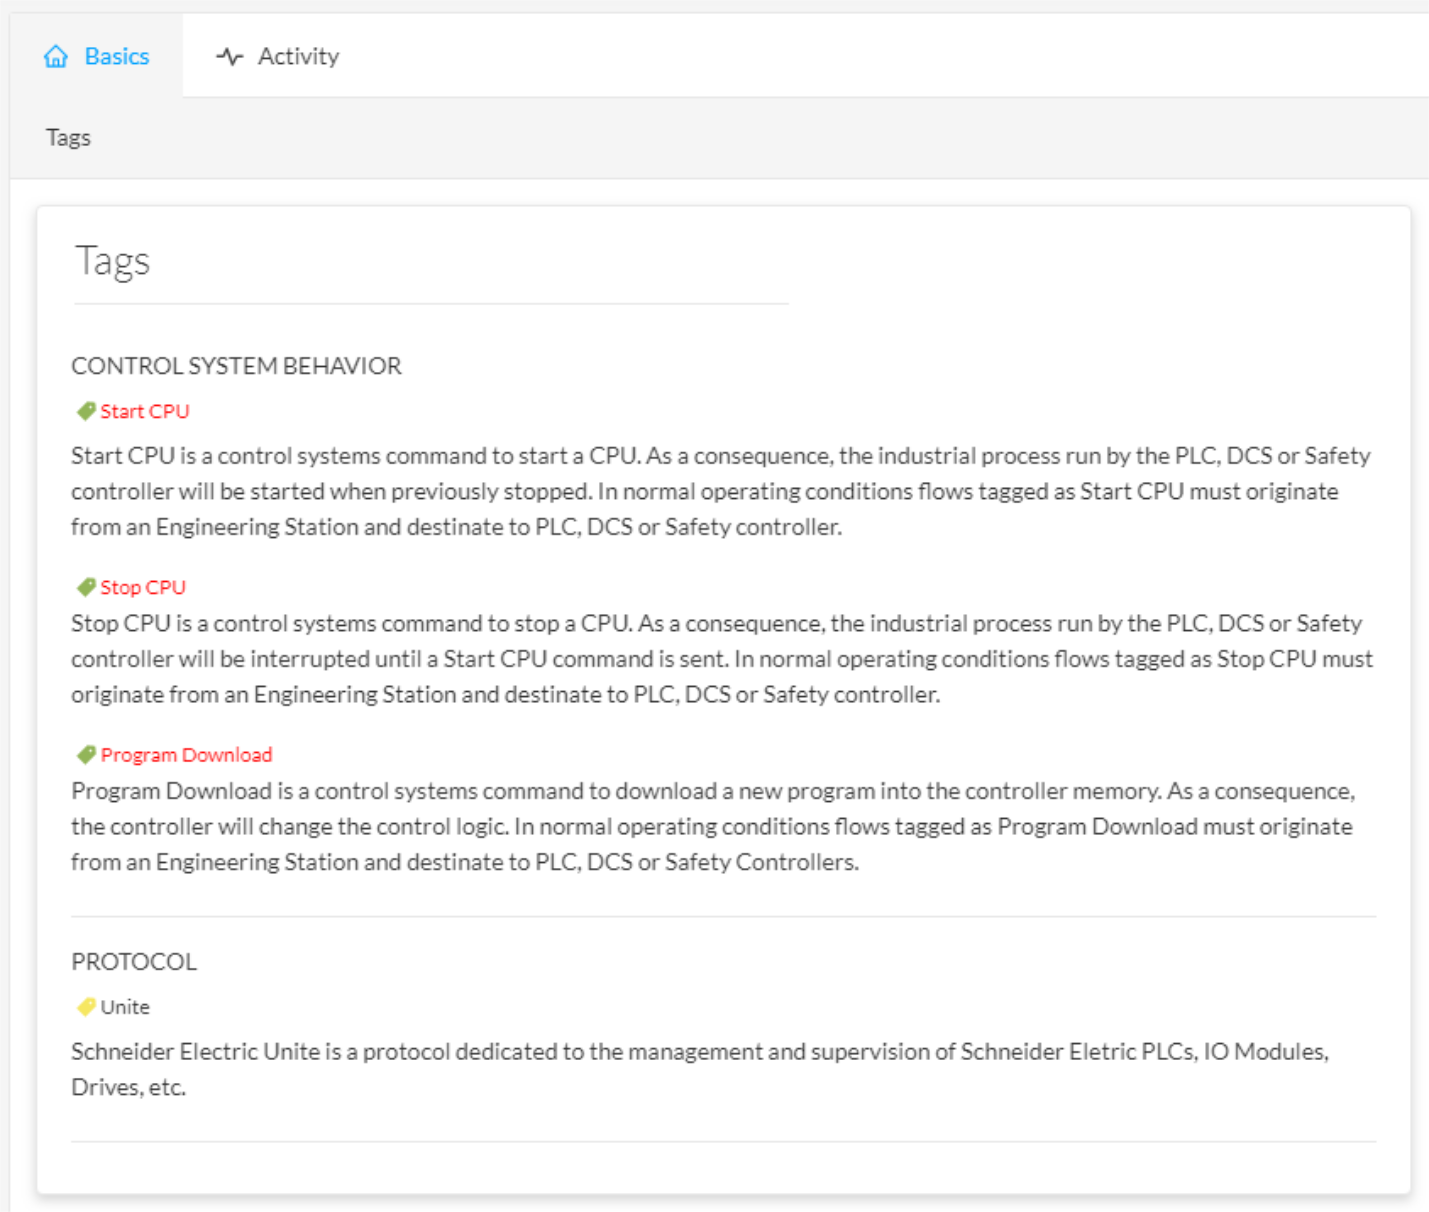
Device tags
Device tags can be used to select components. Device tag filters can be inclusive or exclusive. The combination of several
device tags will select all the components with at least one of the selected device tags. If the device tag filter is exclusive,
the system will ignore all components with the selected device tags. For example:
Device tag filters
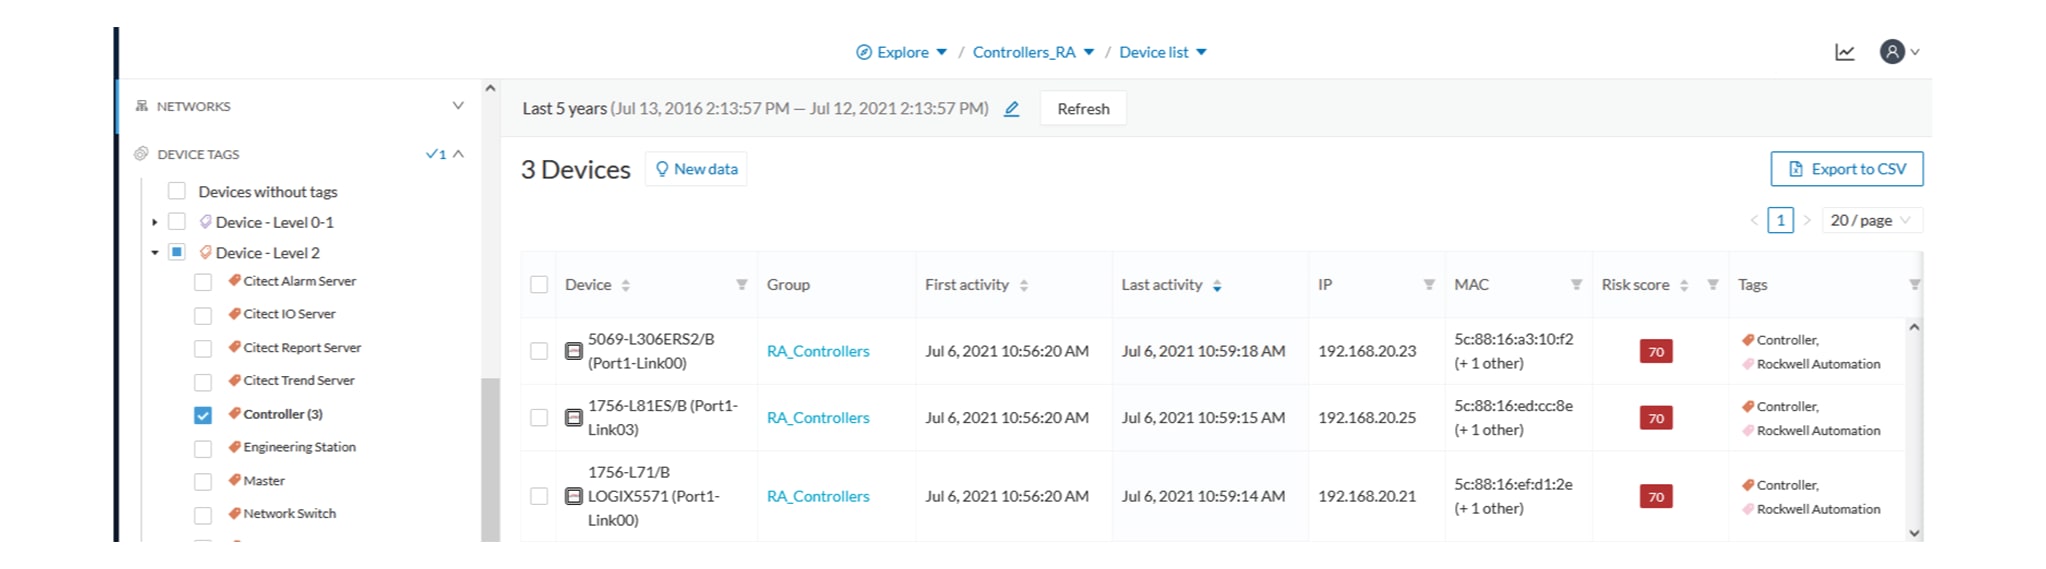
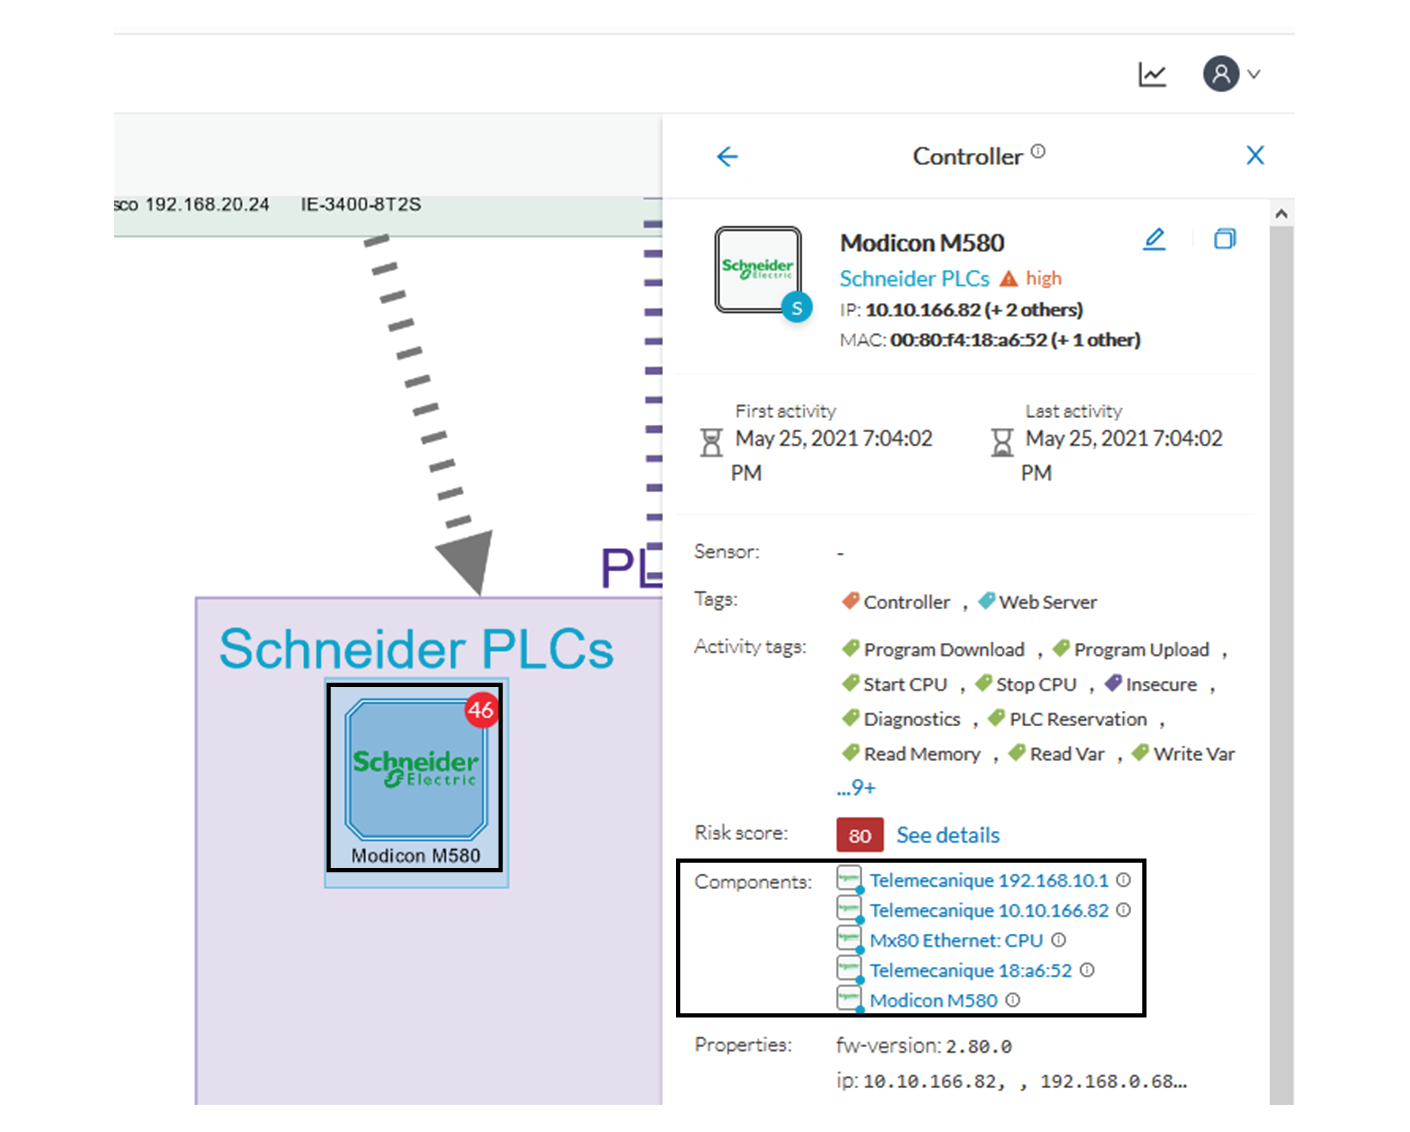
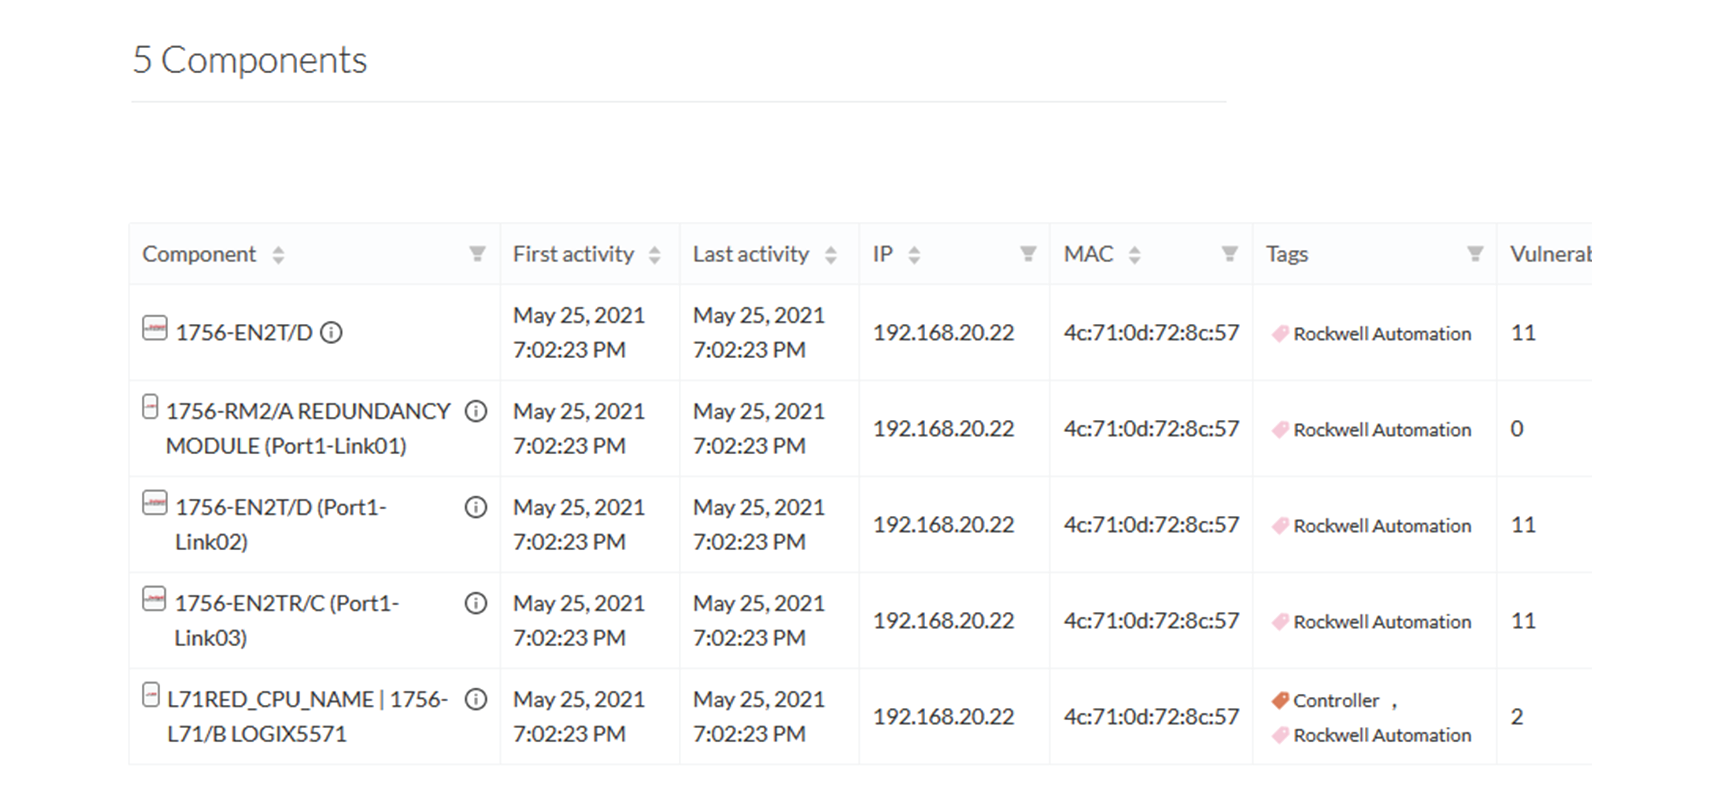
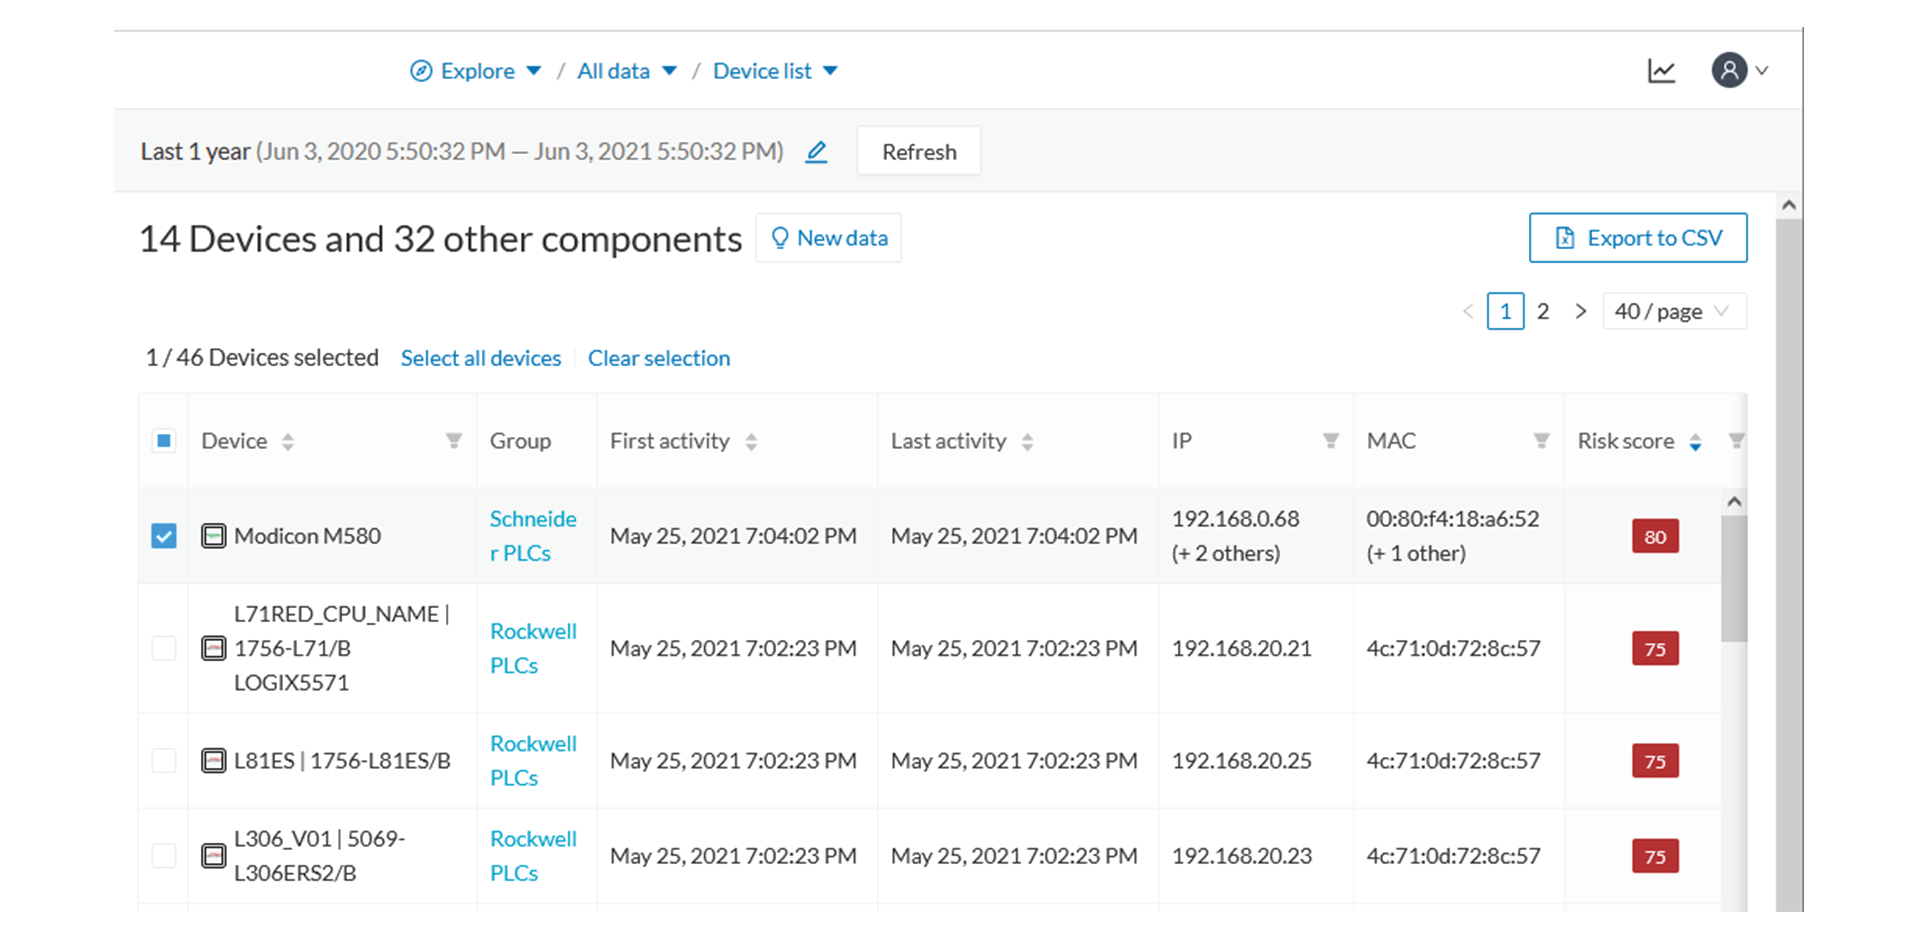
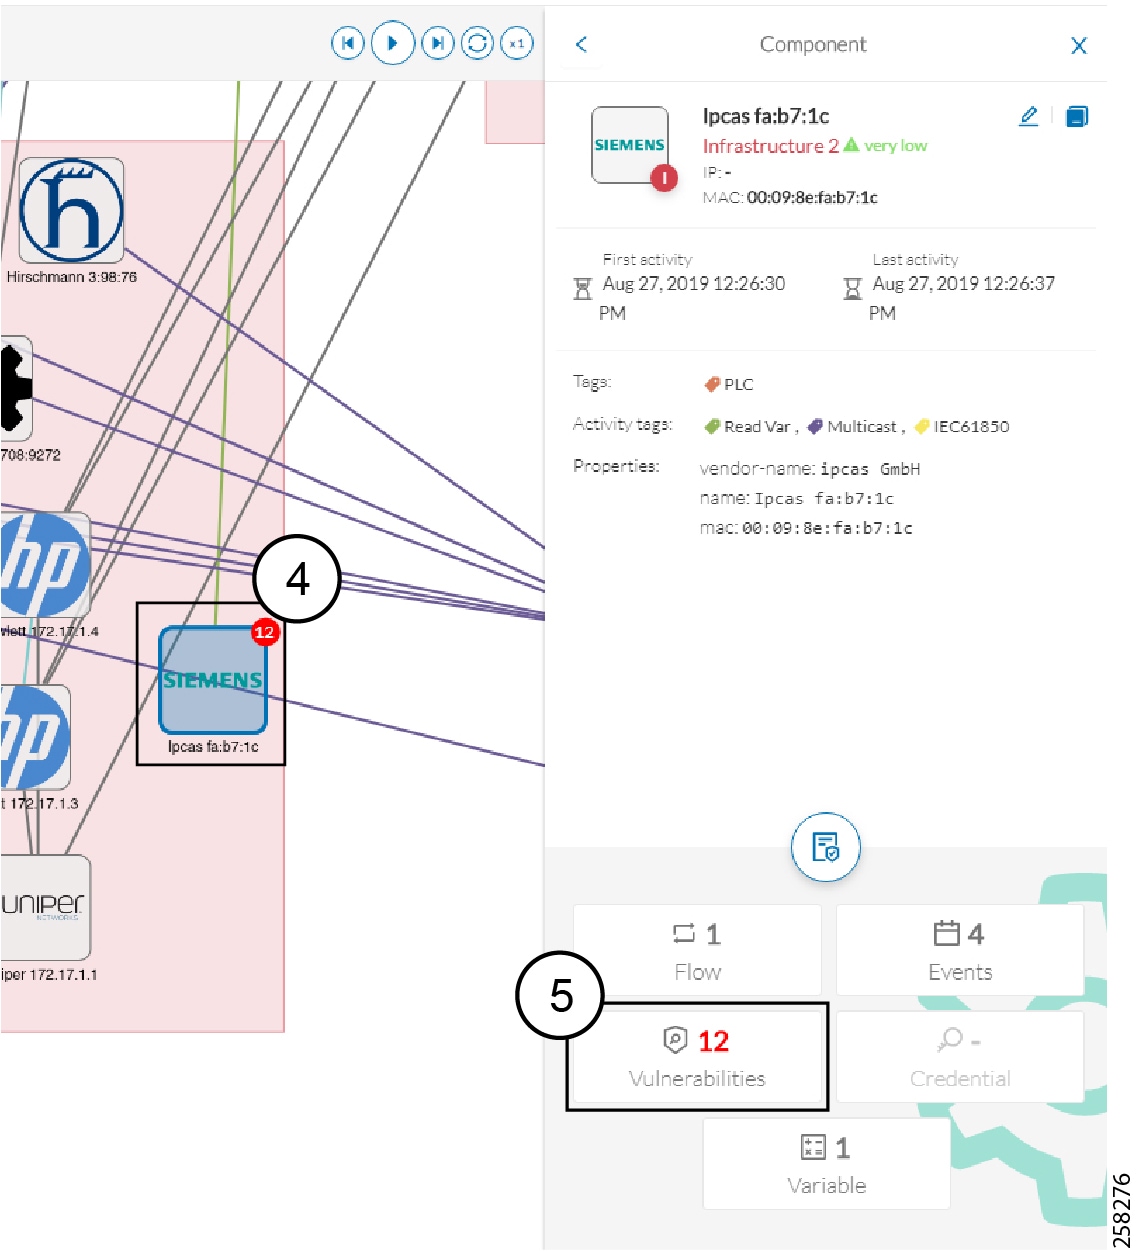
When devices are filtered the “Device view” only presents the devices corresponding to the filter. For example, only the Controllers
if the tag “Controller” is selected.
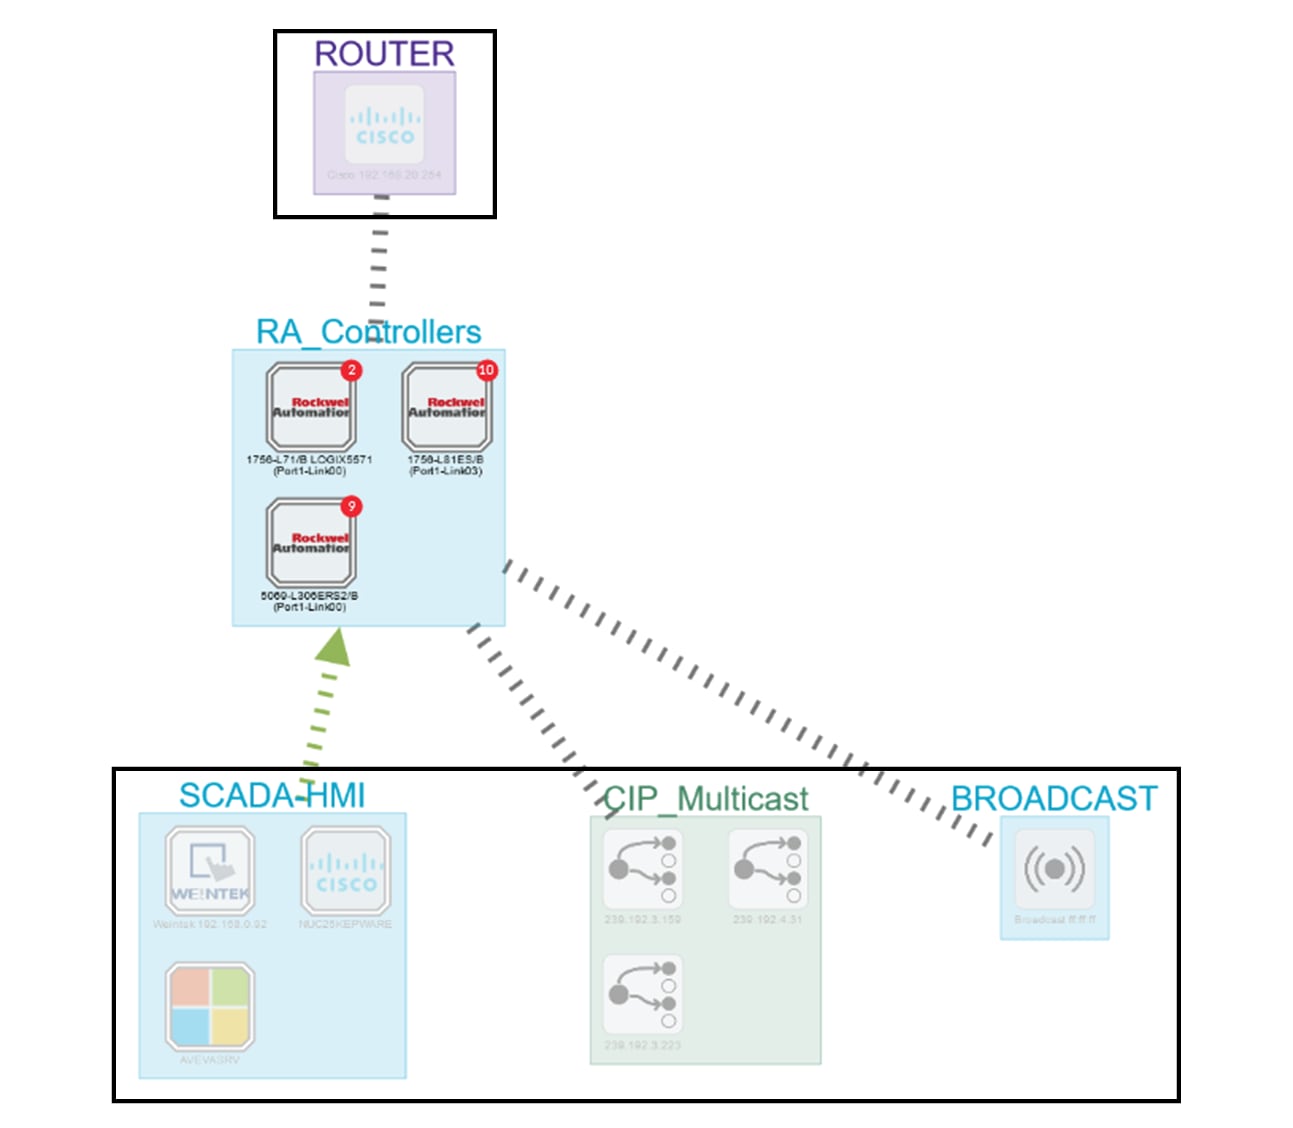
For the other displays like activity list or map, the devices which are communicating with the selected devices will be displayed
too (all engineering stations or HMI in our example).
It will give the following results:
Device tag filter, example of Controllers – list of devices
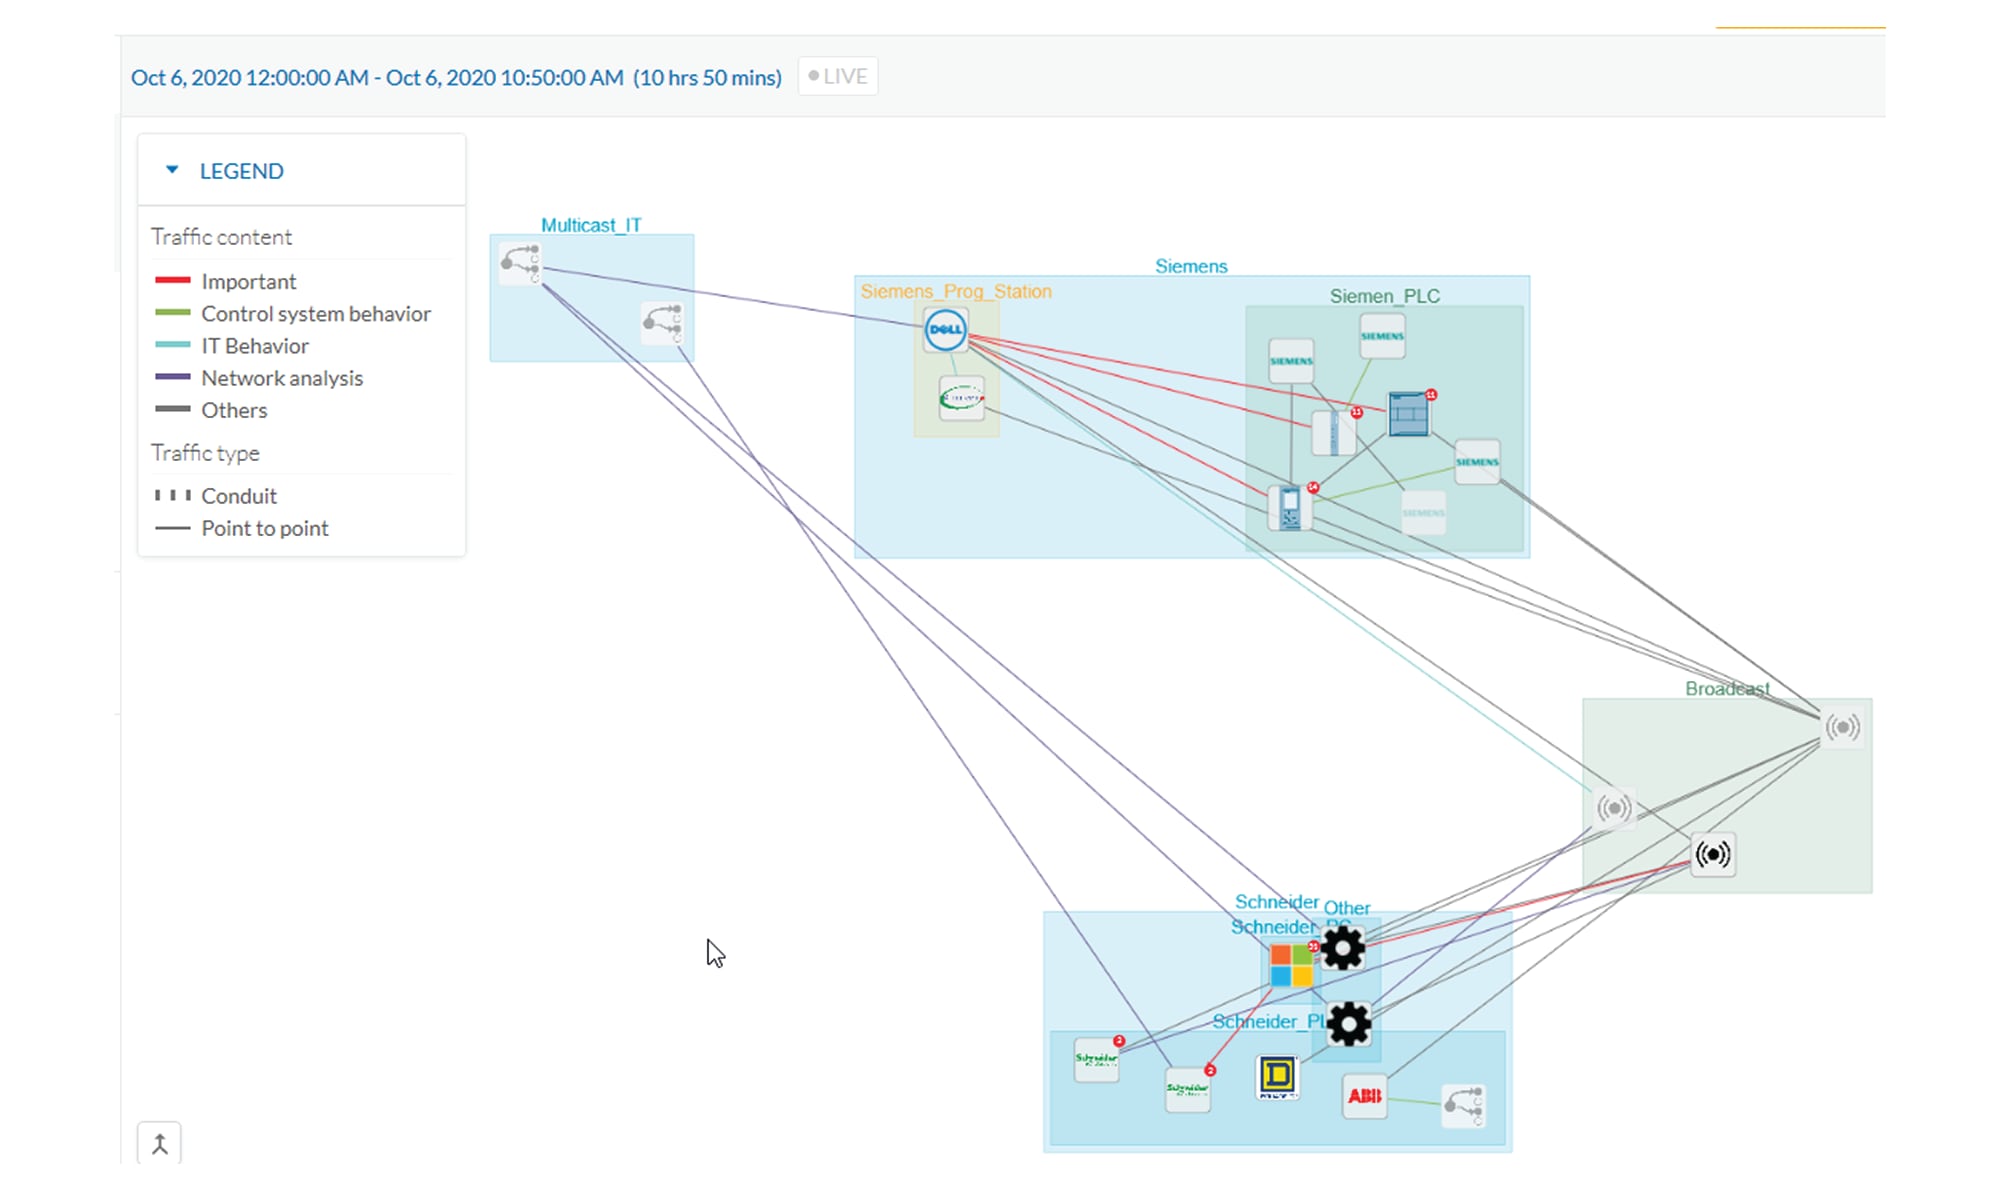
In the associated map all the components which communicate with the controllers will also be displayed. These other components
are shadowed to be recognized:
Device tag filter, example of Controllers - map
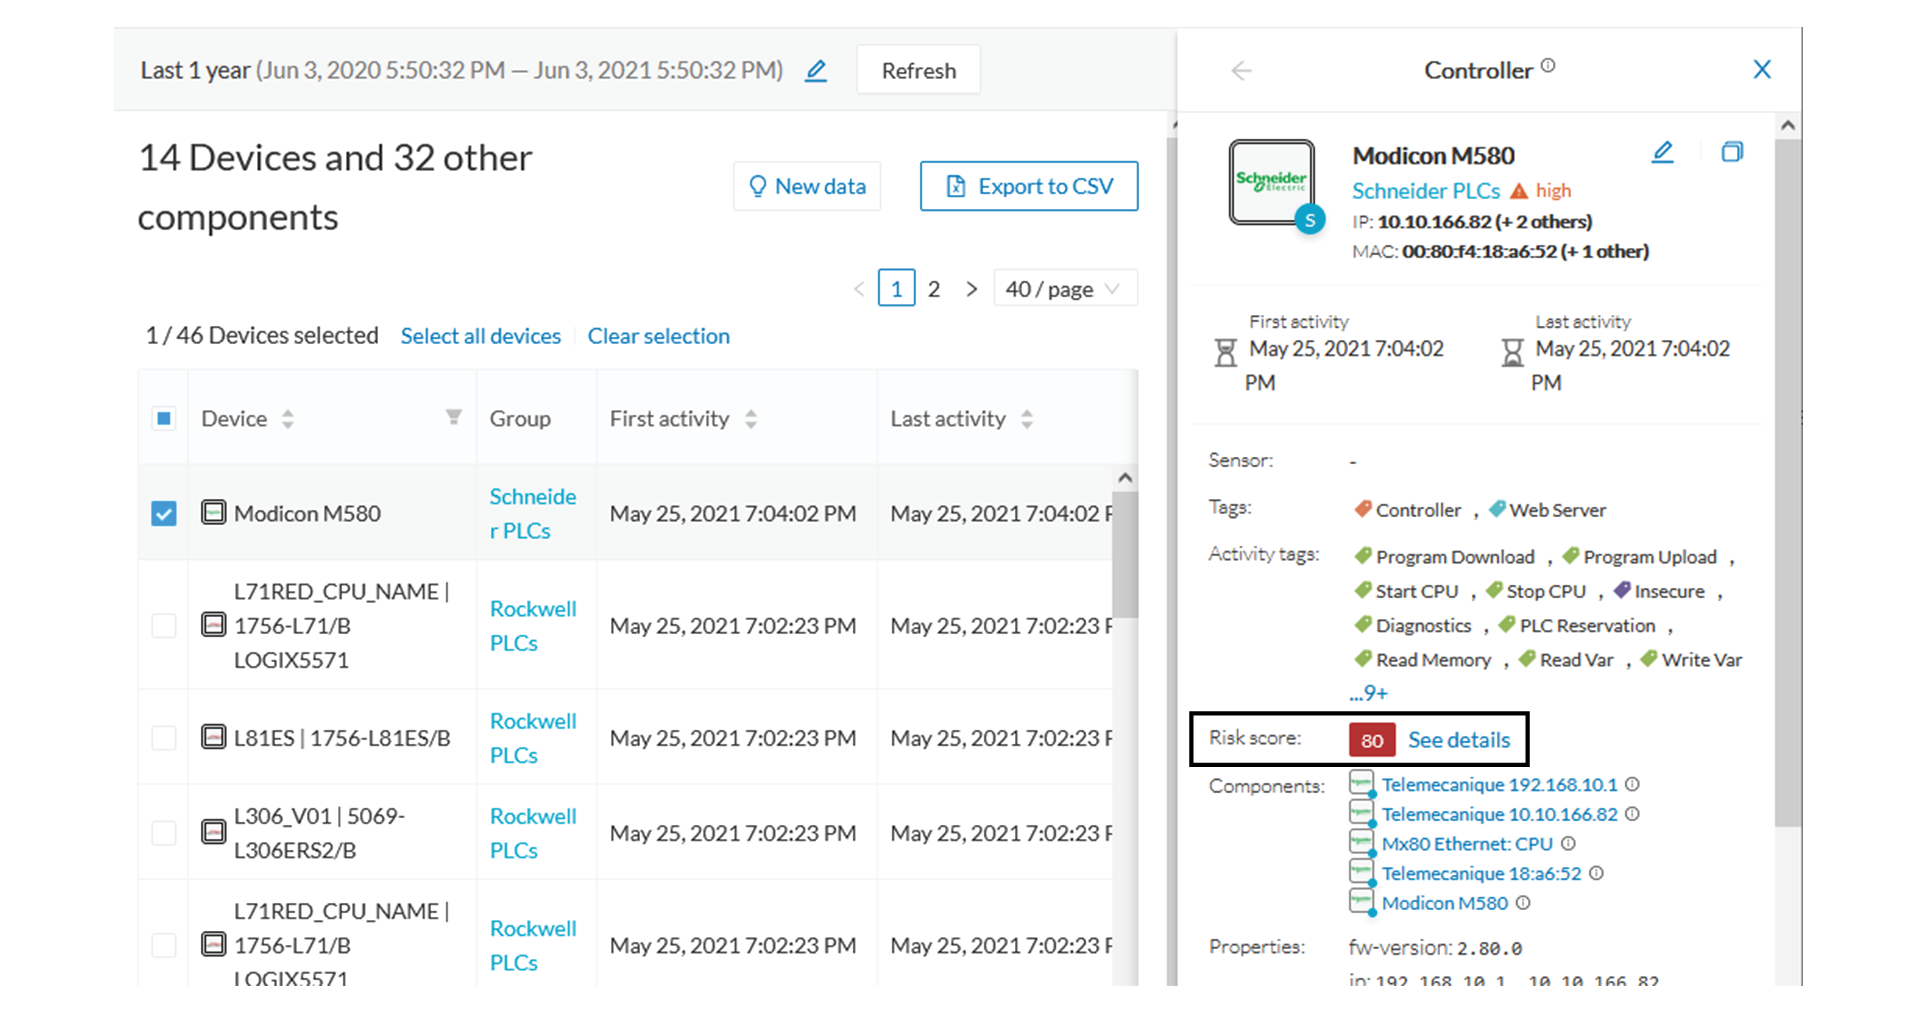
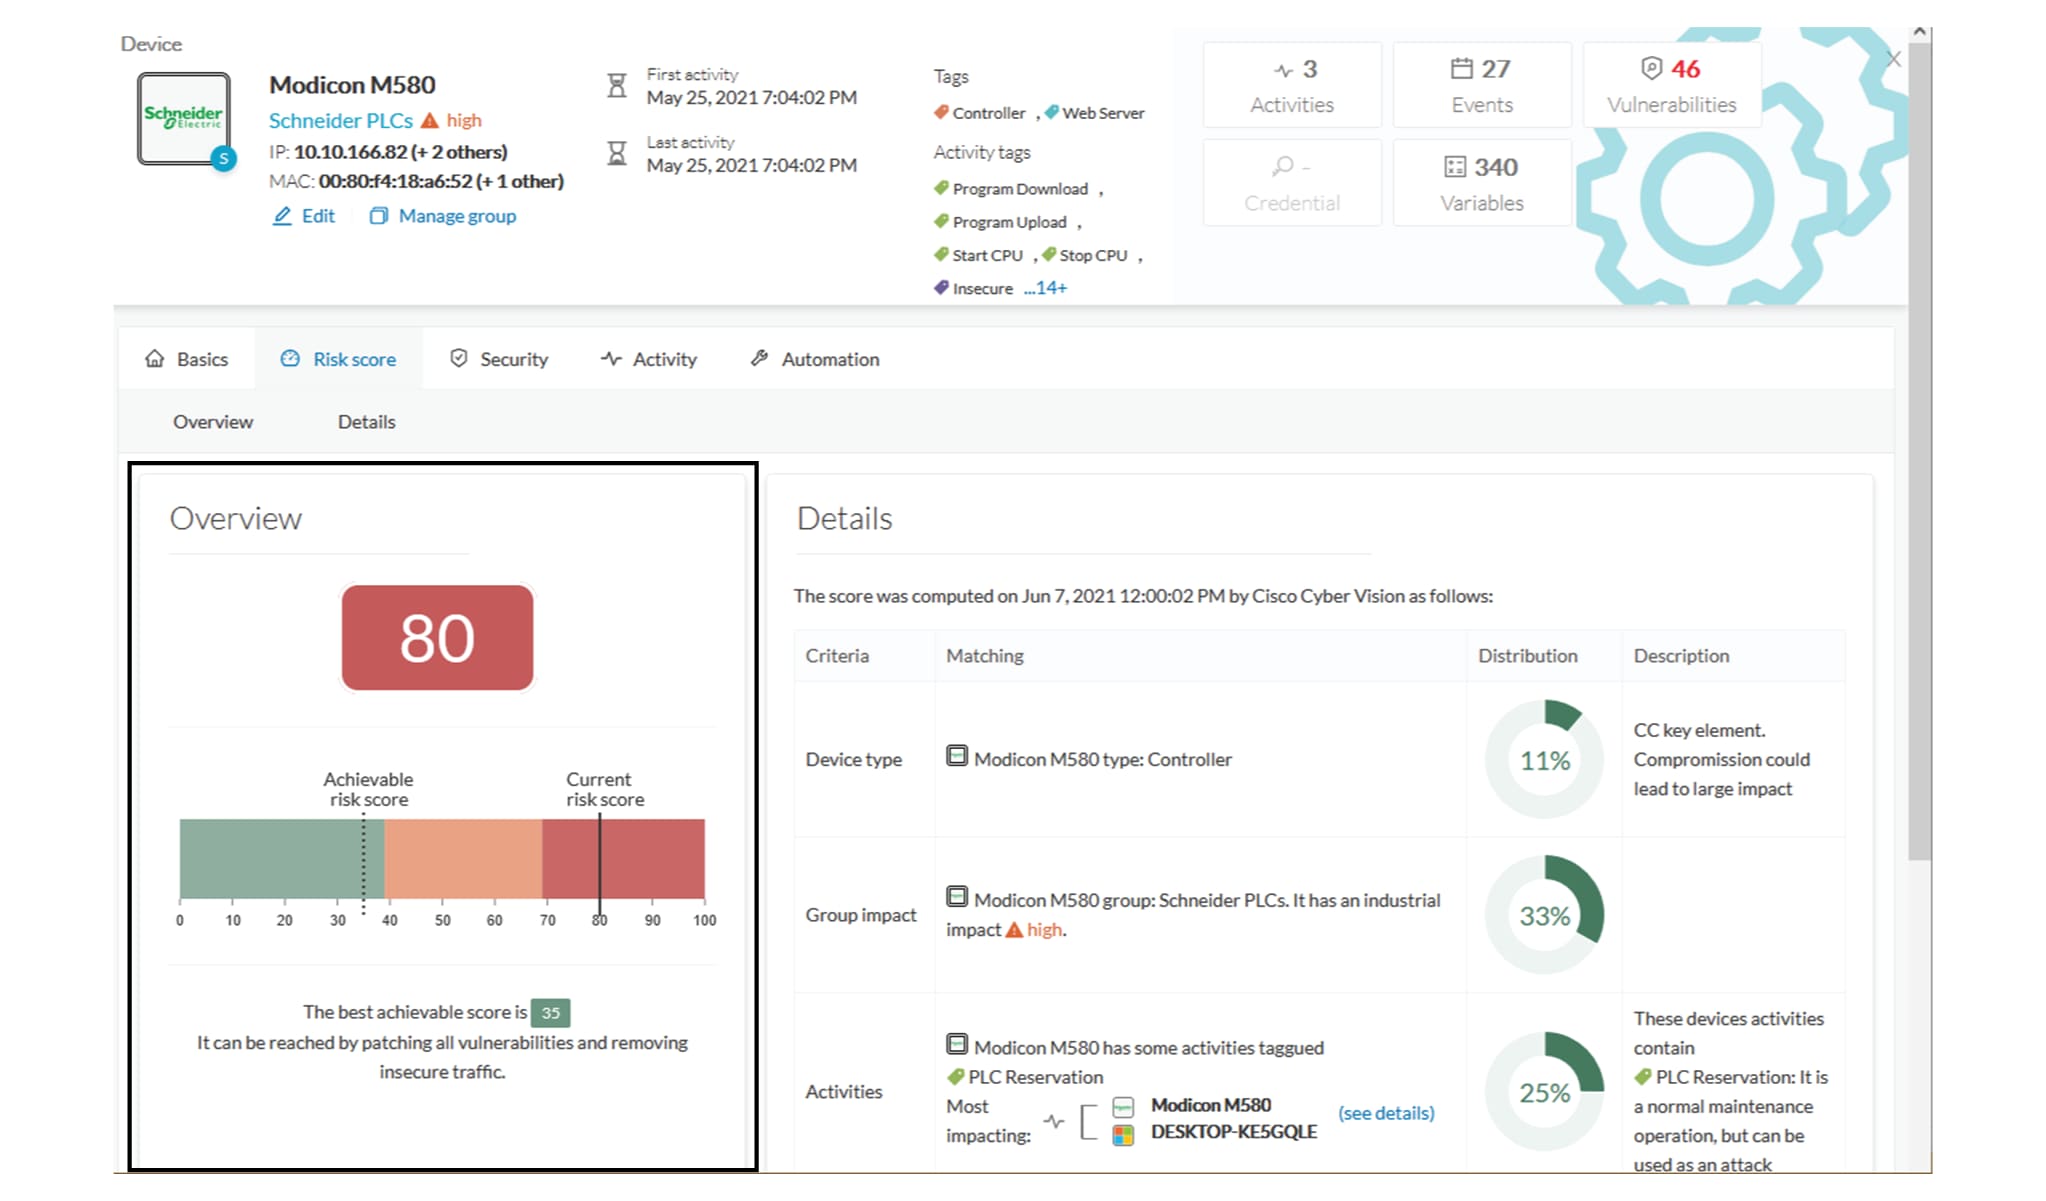
Risk score
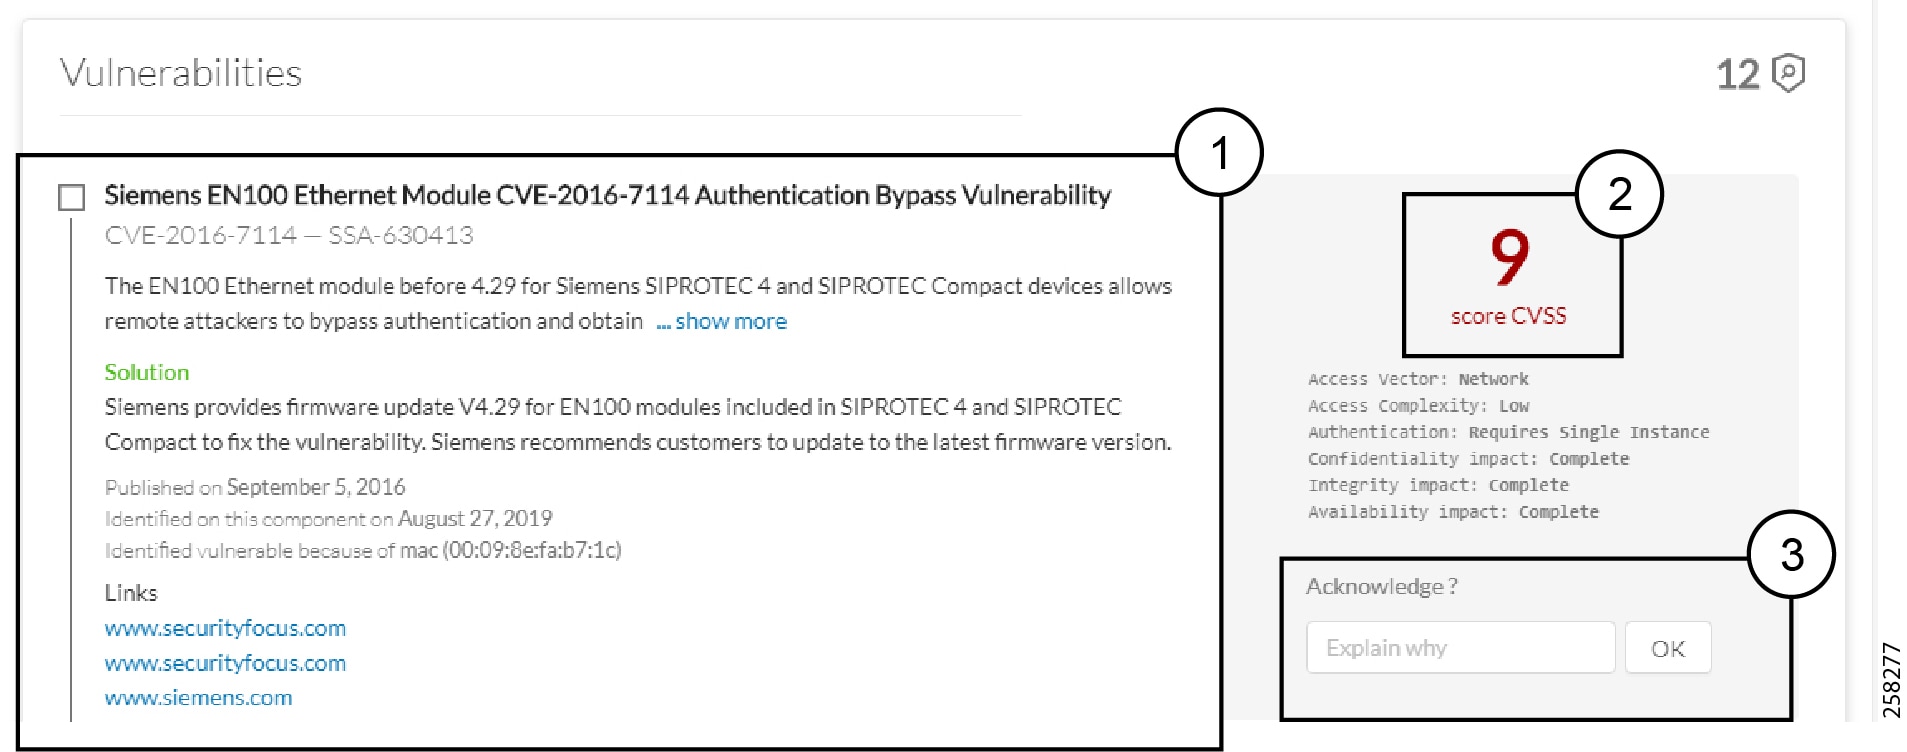
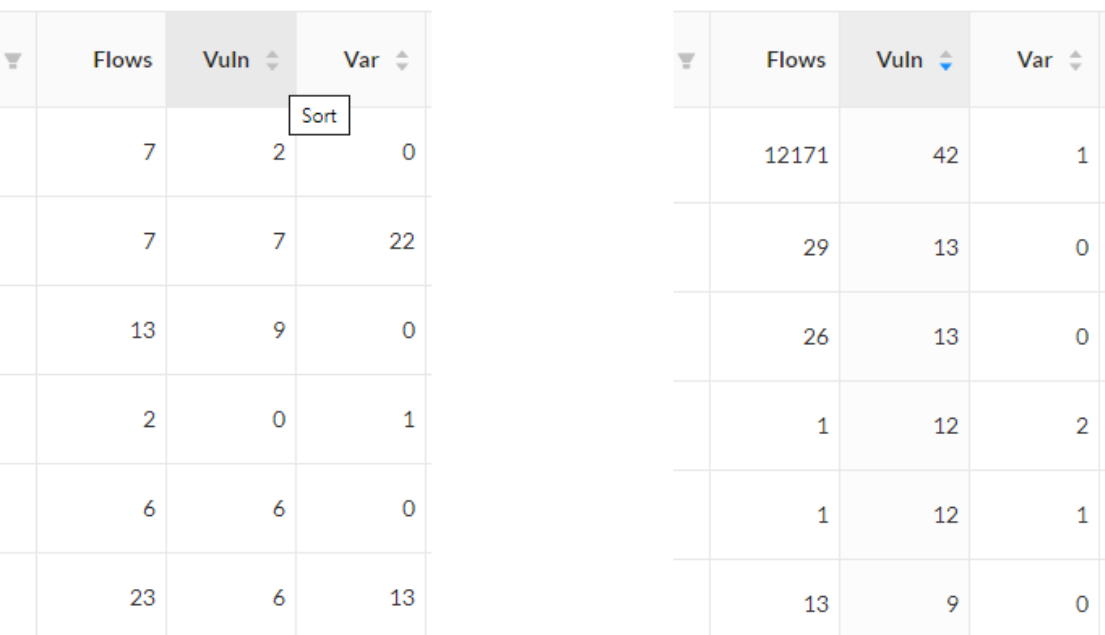
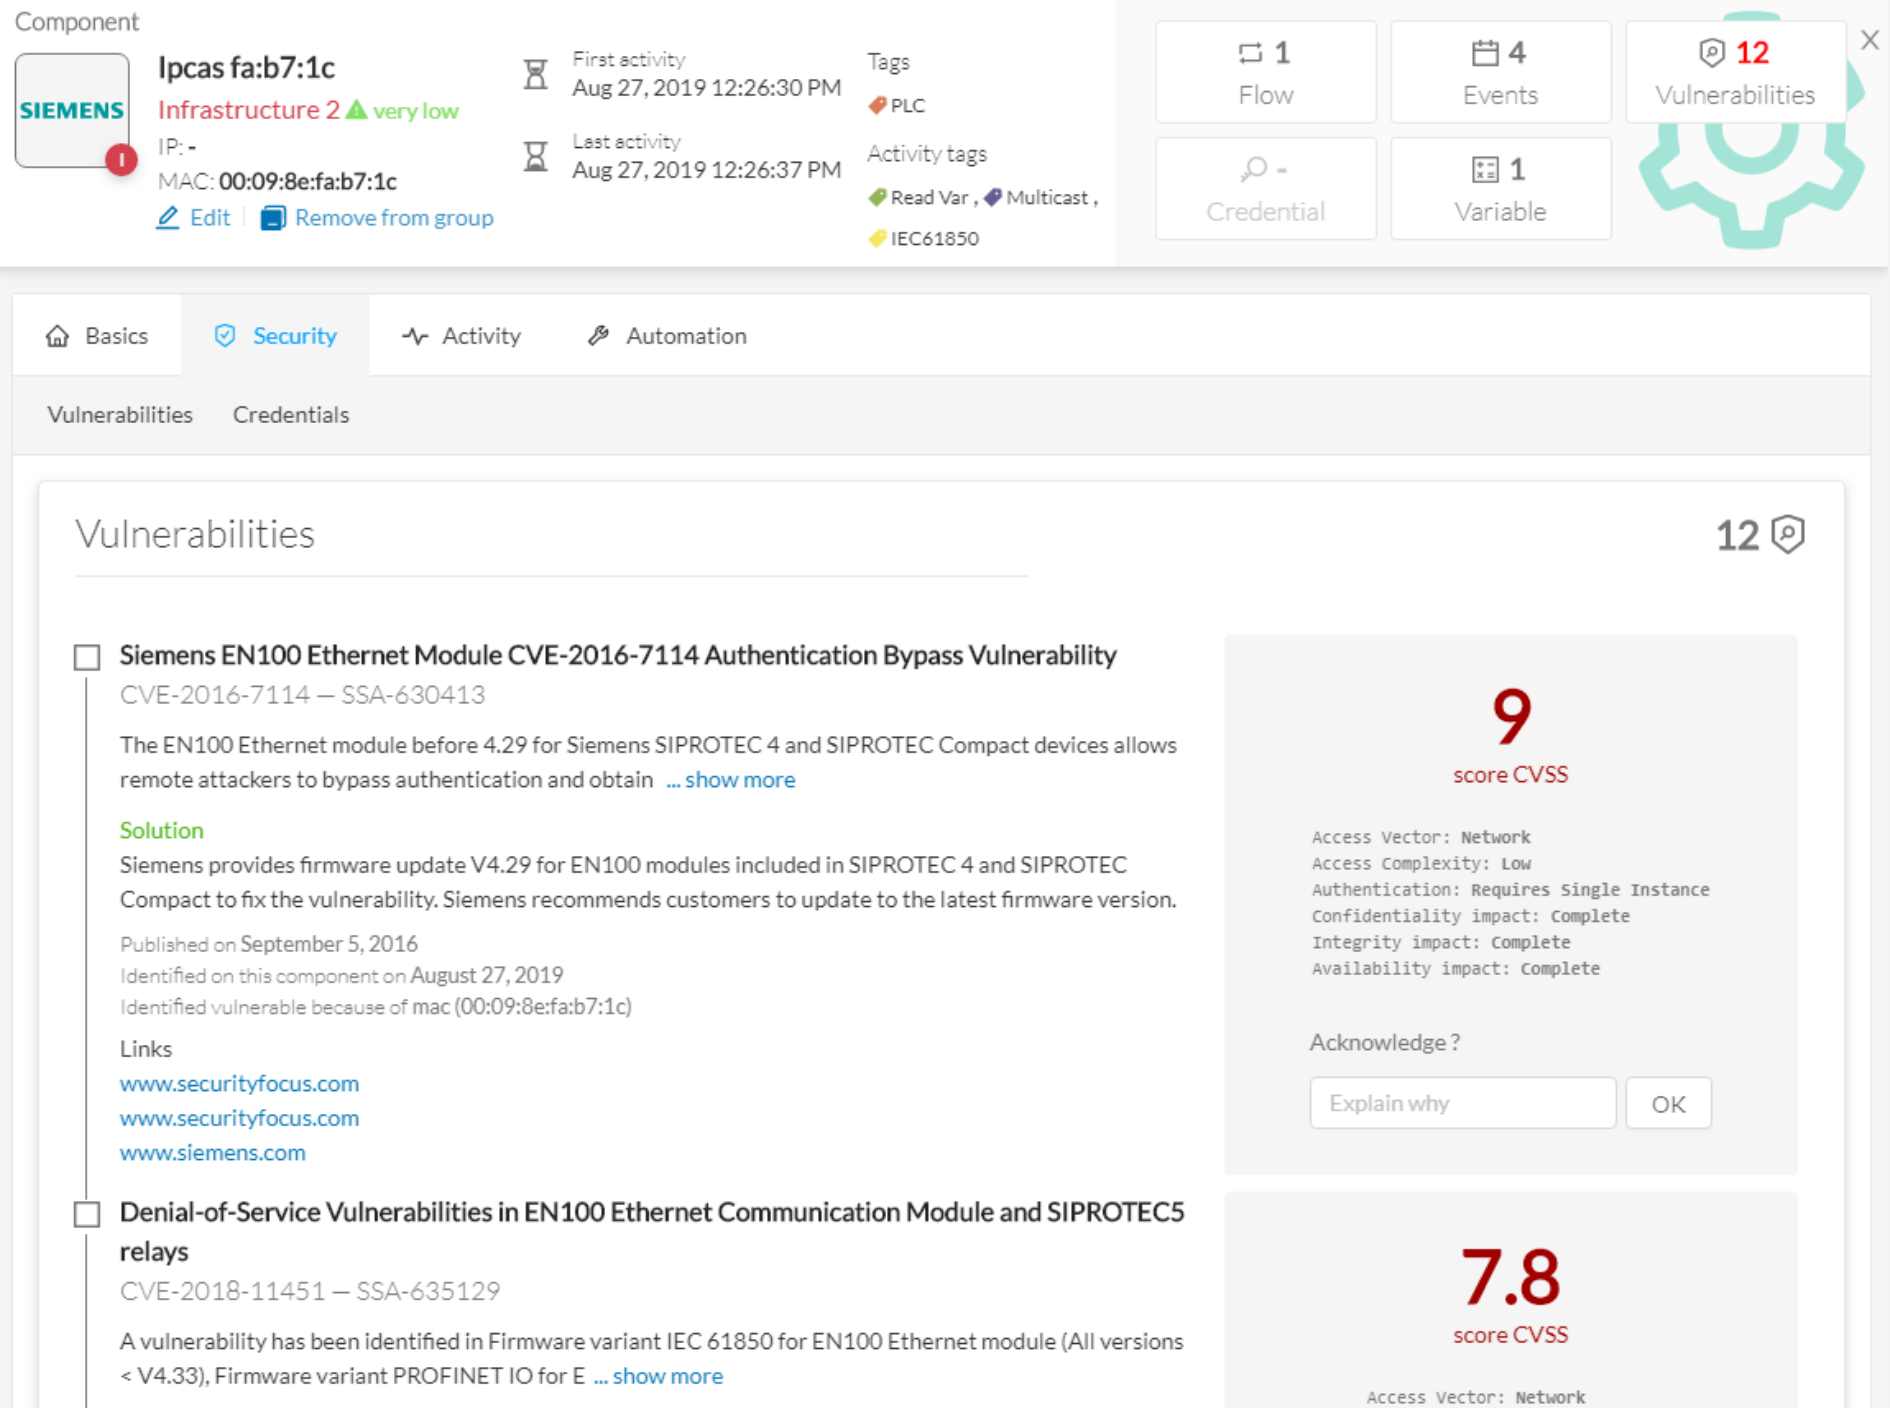
The risk score will be used to filter devices based on their score. A range of Risk score can be defined and used as inclusive
or exclusive filter. All devices will be filtered based on this range.
Risk score, filter definition
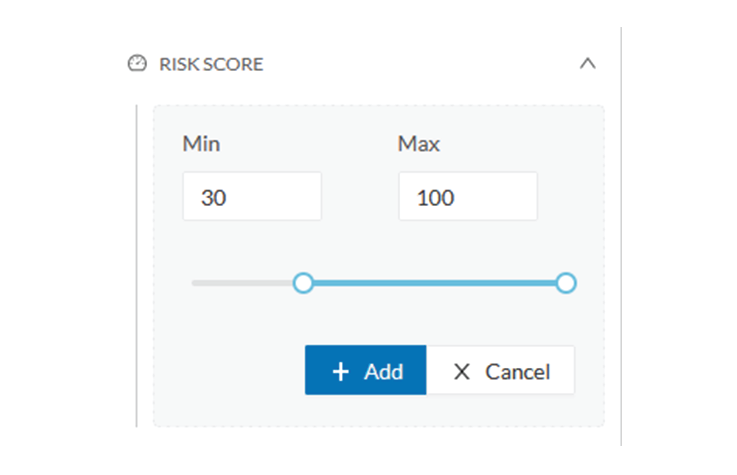
Risk score – inclusive filter
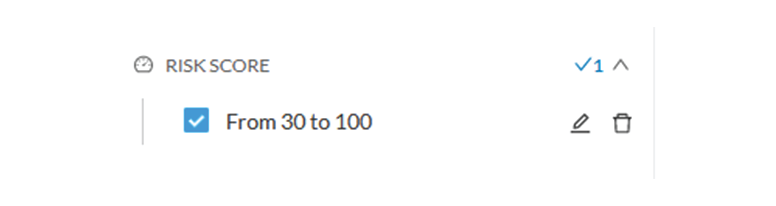
In the example above, only the devices with a risk score in the selected range will be selected.
Groups
Groups can be used to filter devices. Each group or sub-group could be added as inclusive or exclusive filter:
Group filter
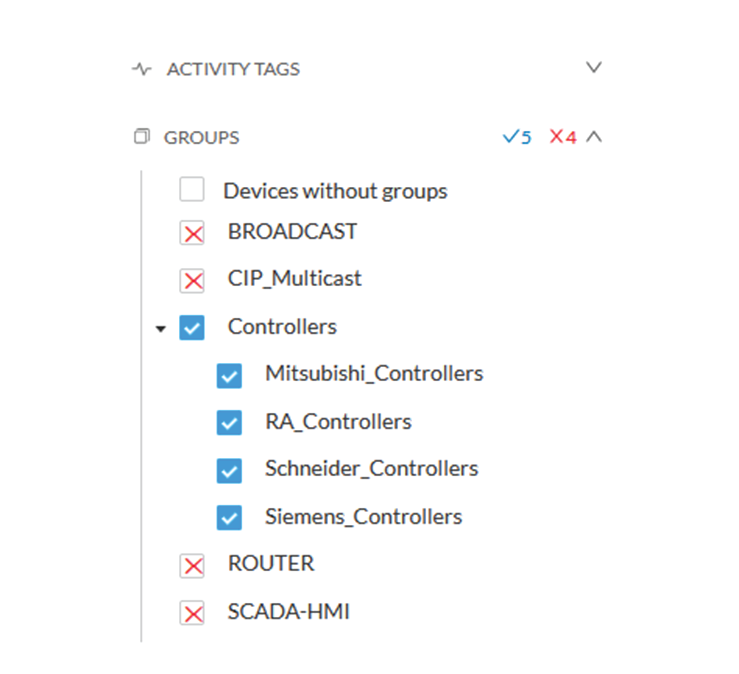
In the example above, only the devices belonging to the selected groups will be selected.
Activities always involve two end points and are selected if either end point is part of a selected group, and none are part
of an excluded group.
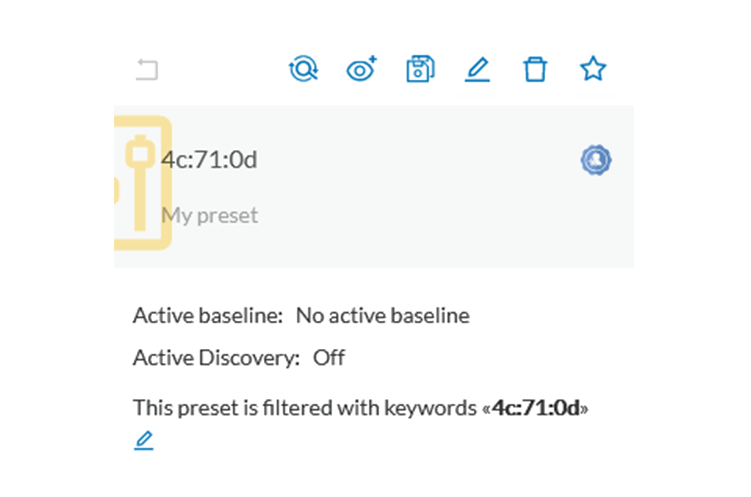
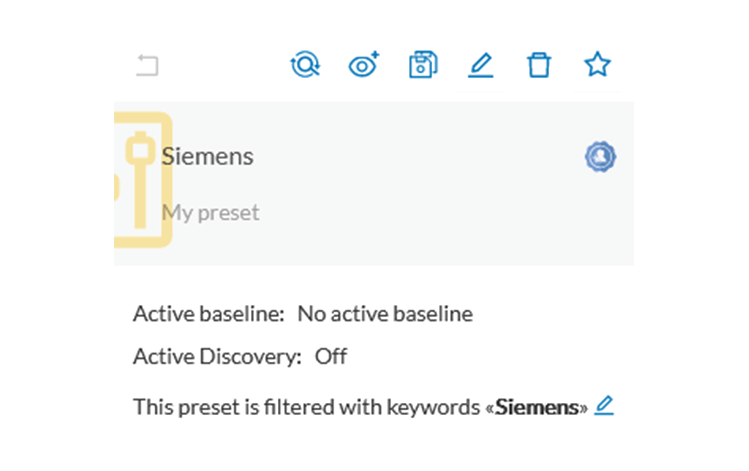
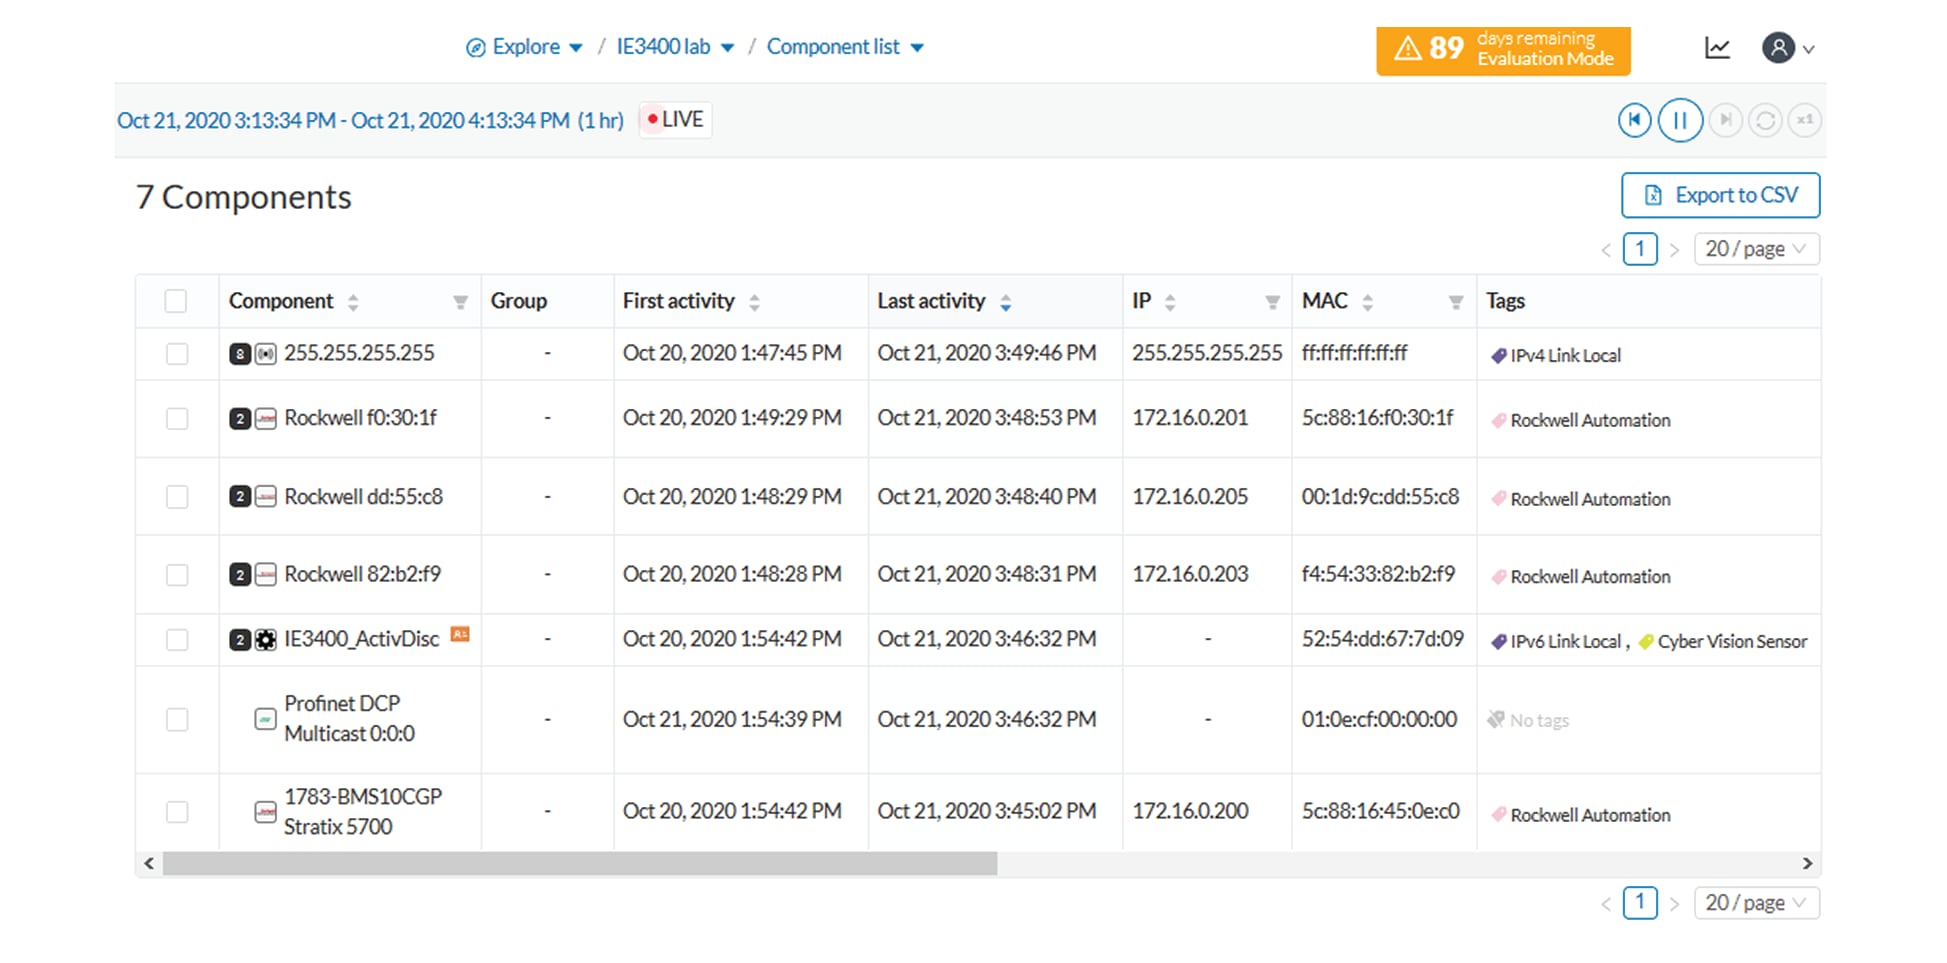
Keyword
A keyword can be used to filter devices using the “Search” section of the GUI. This keyword will be used to select devices
based on their name, properties, IP, MAC and tags.
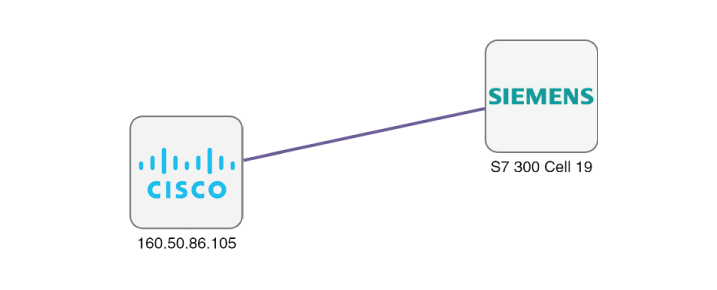
Keyword = 4c:71:0d
Keyword =siemens
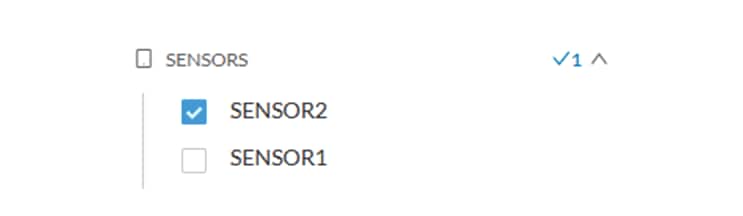
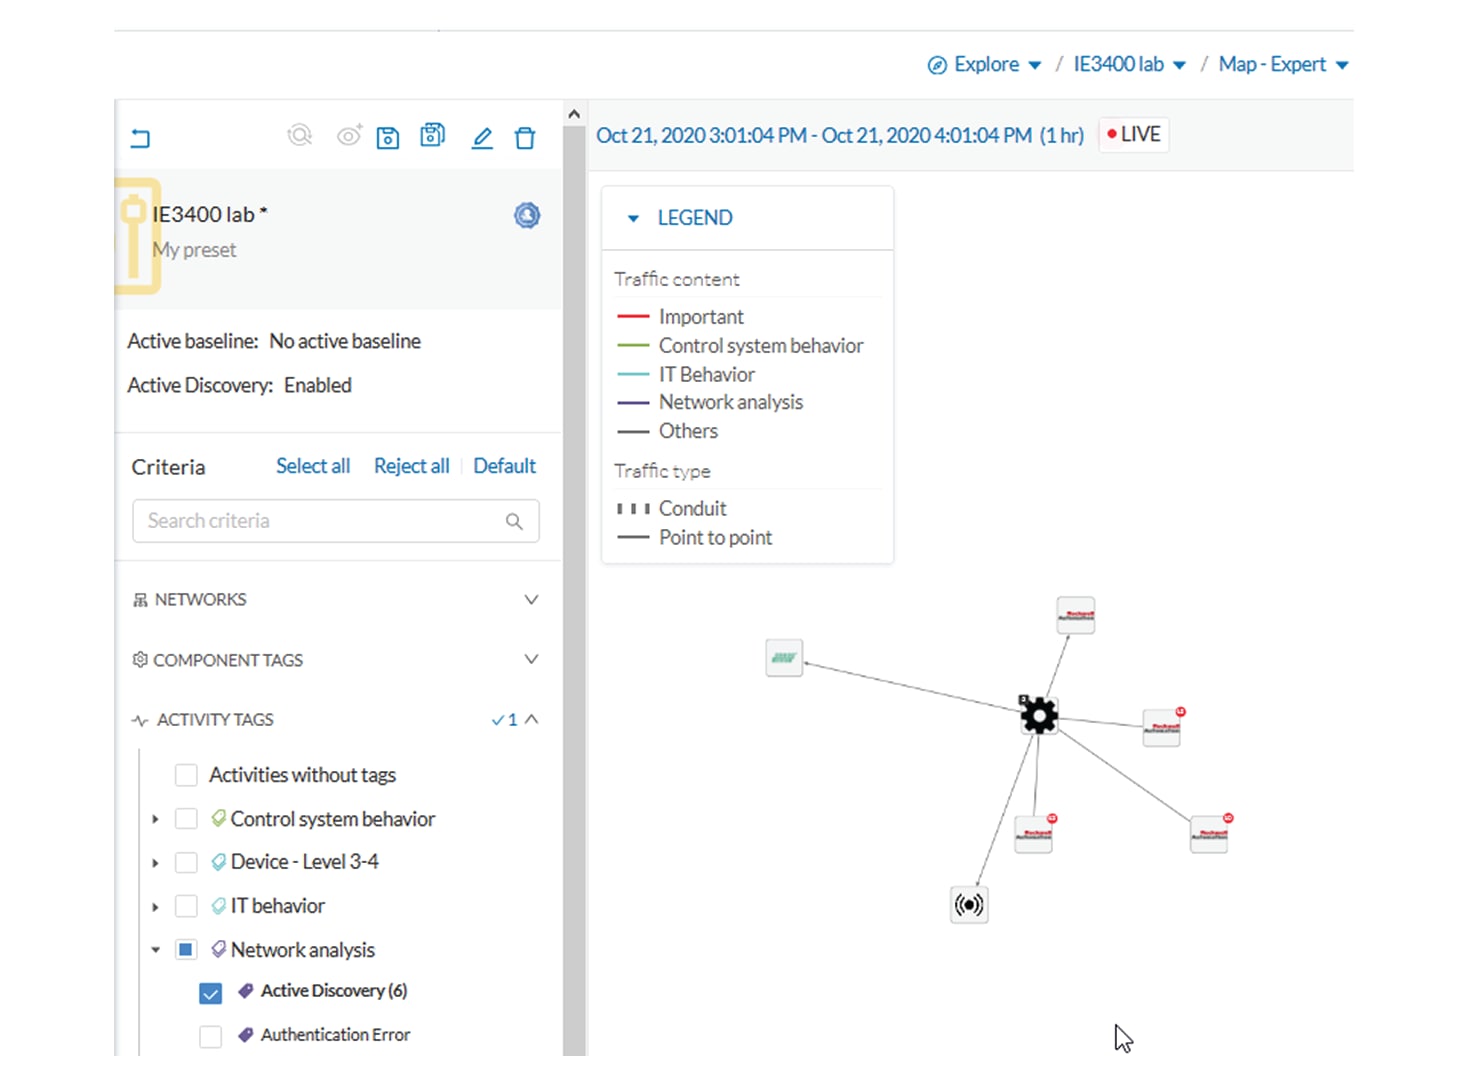
Sensors
Activities can also be filtered based on the sensor that analyzed the associated packets. As for tags, inclusive and exclusive
filters can be used. Usually either option is used, inclusive only to select data coming from a set of sensors, or exclusive
only, to ignore the data from a set of sensors.
Sensor filter
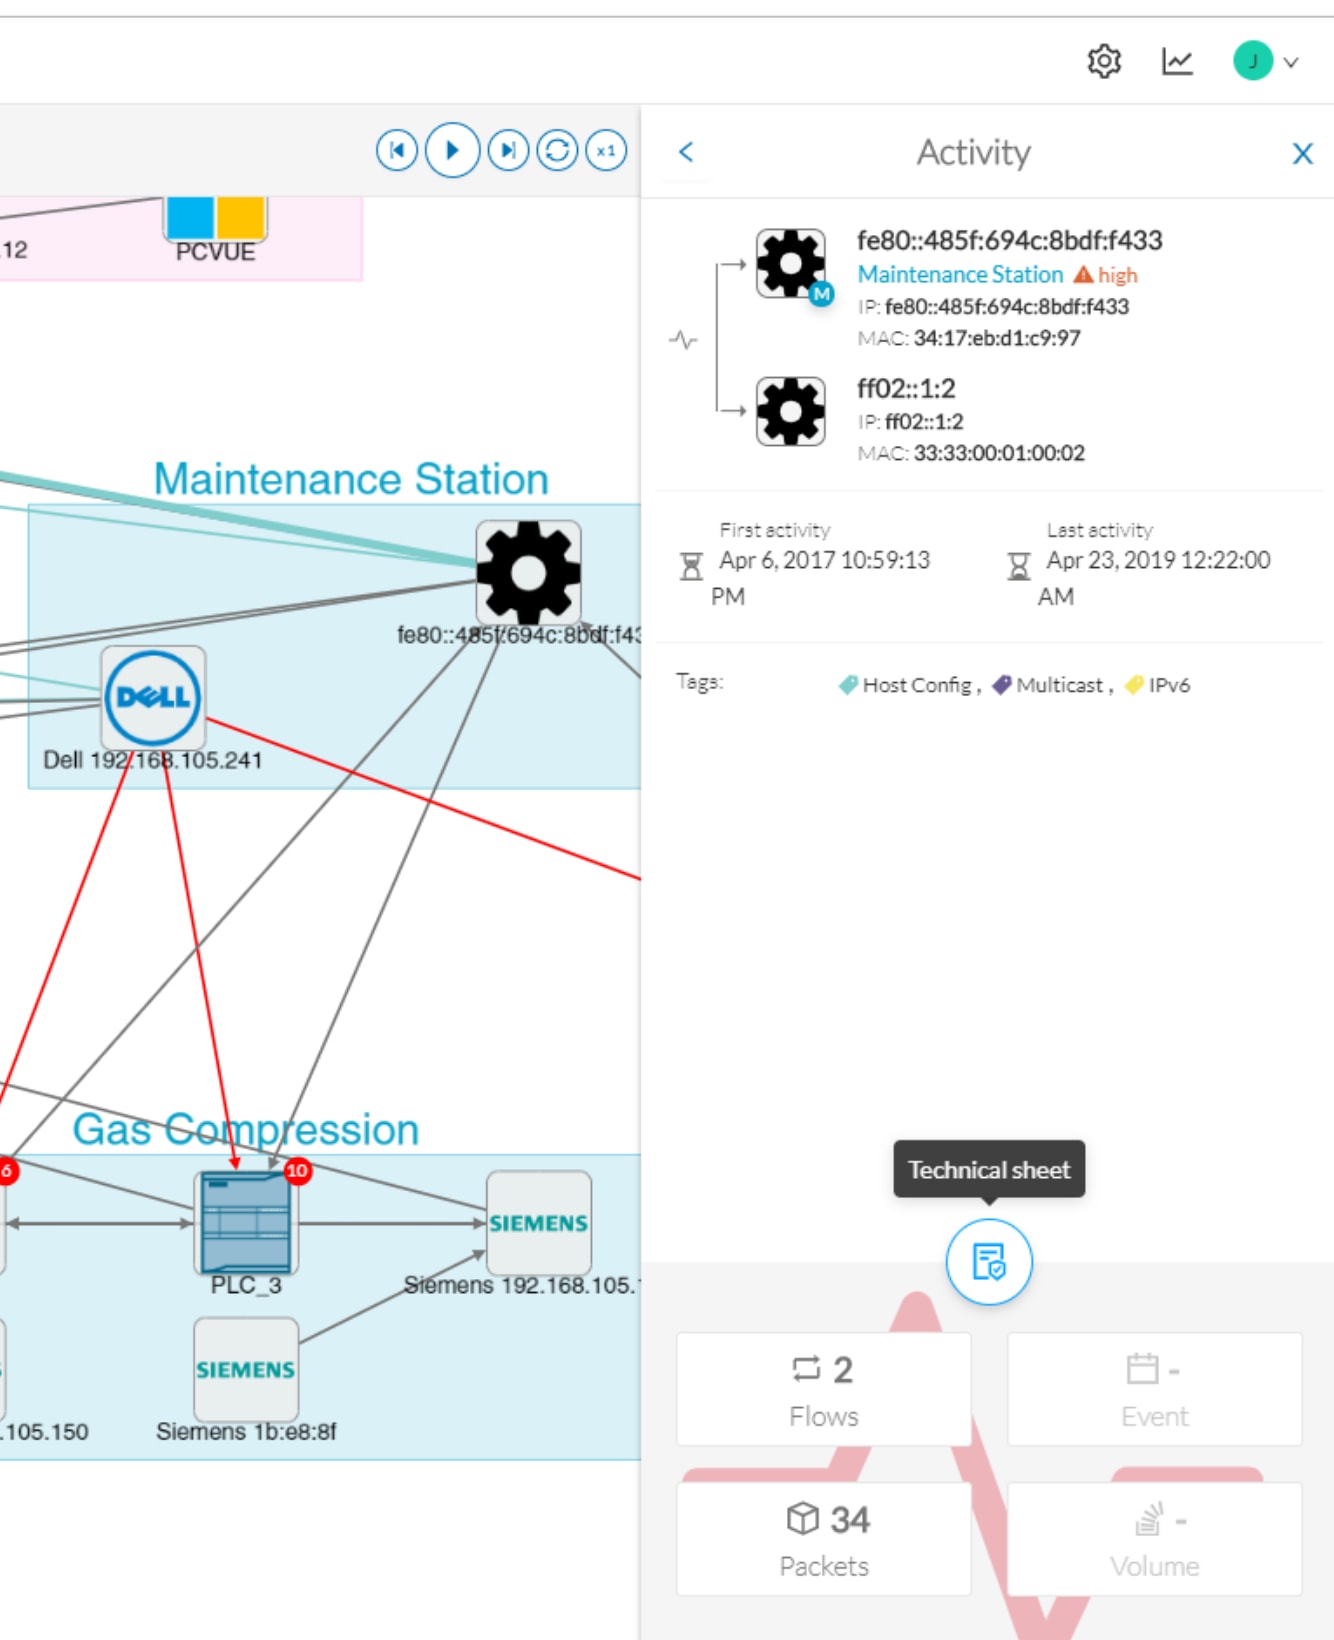
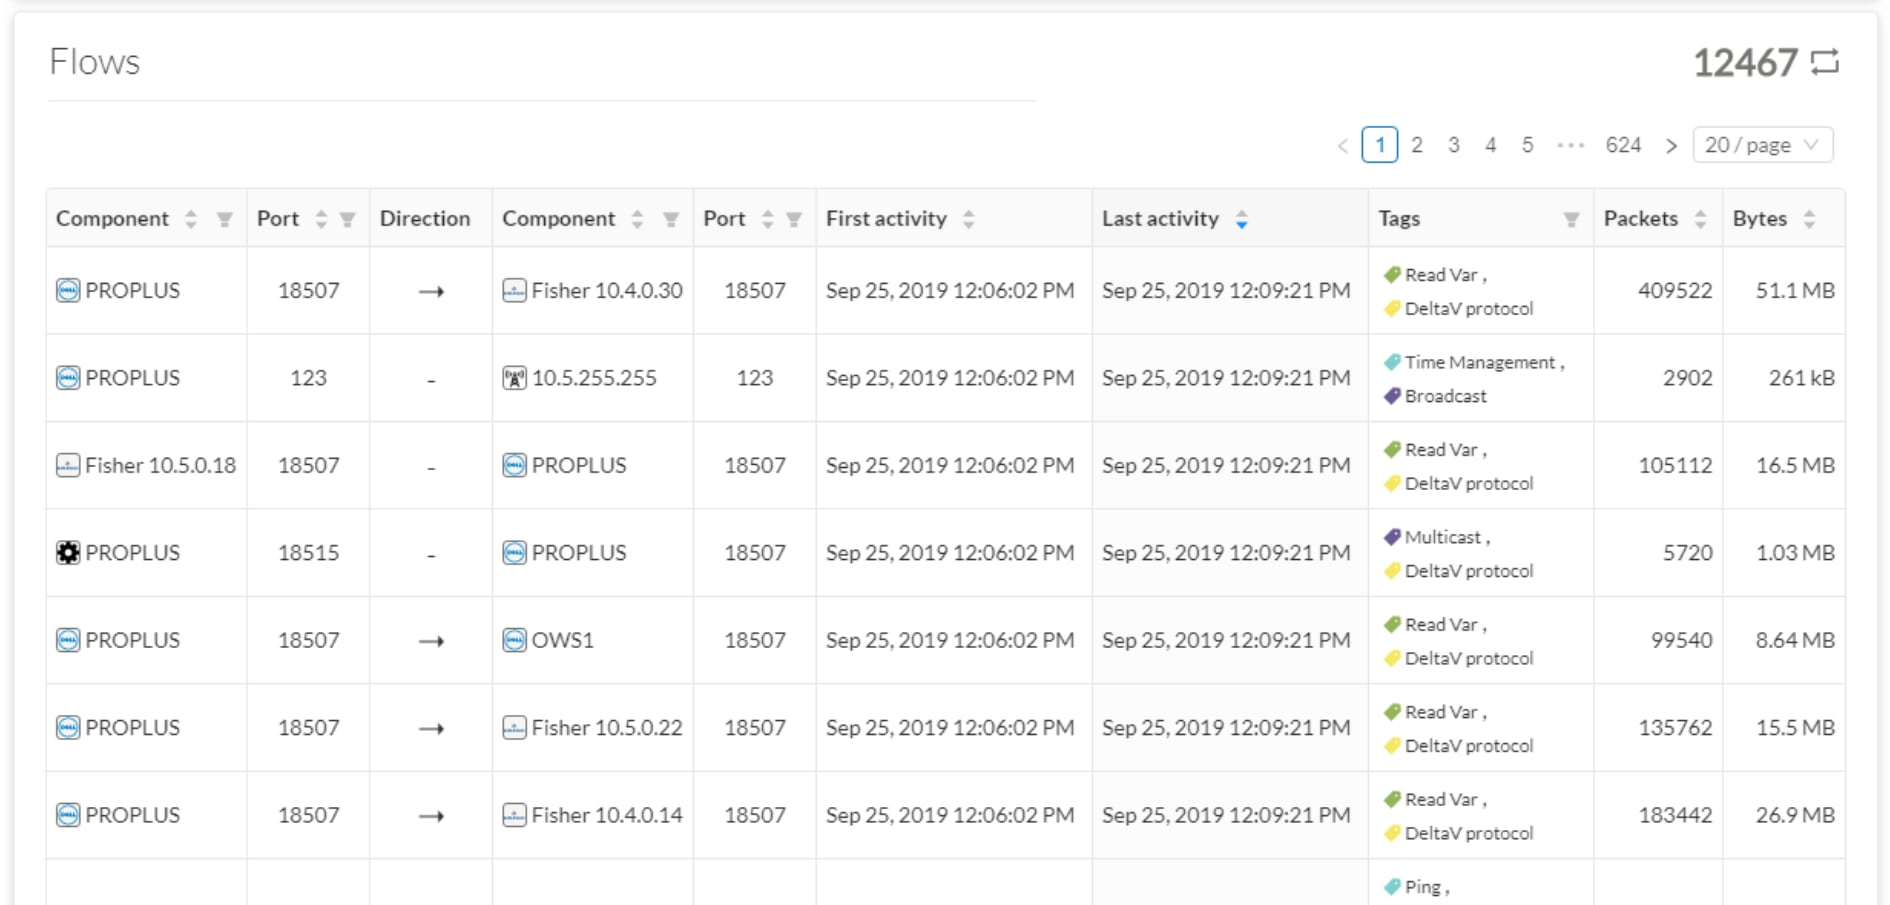
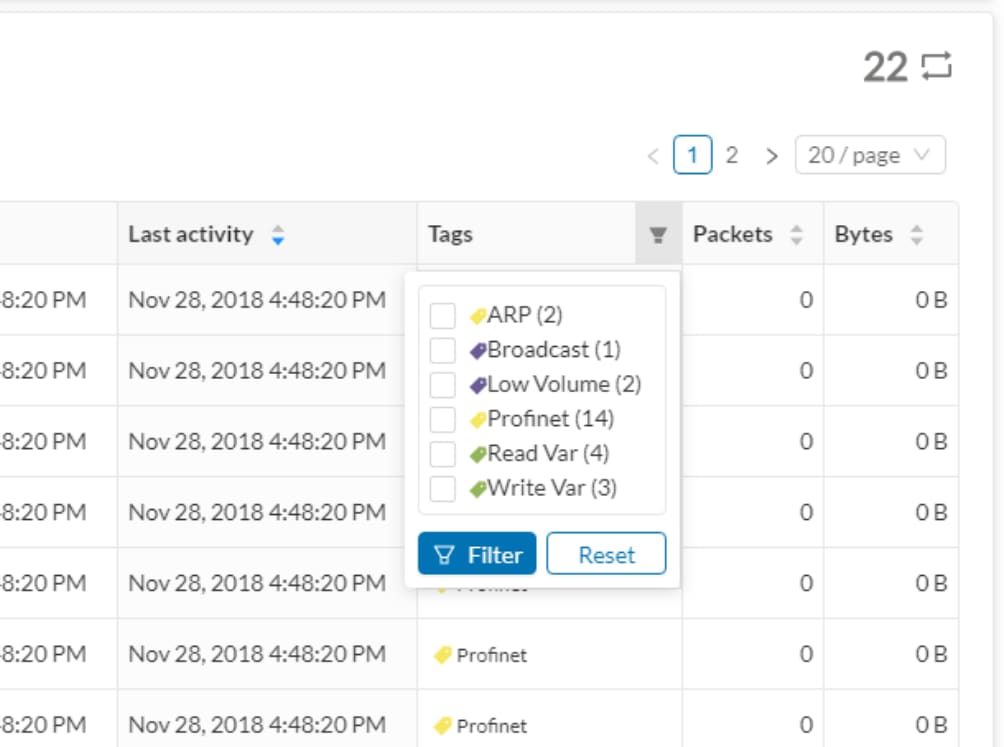
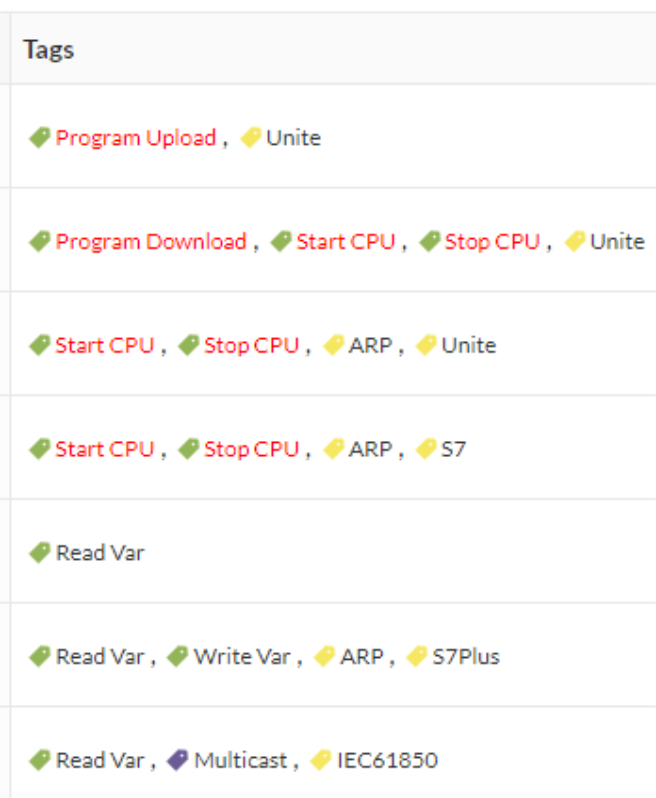
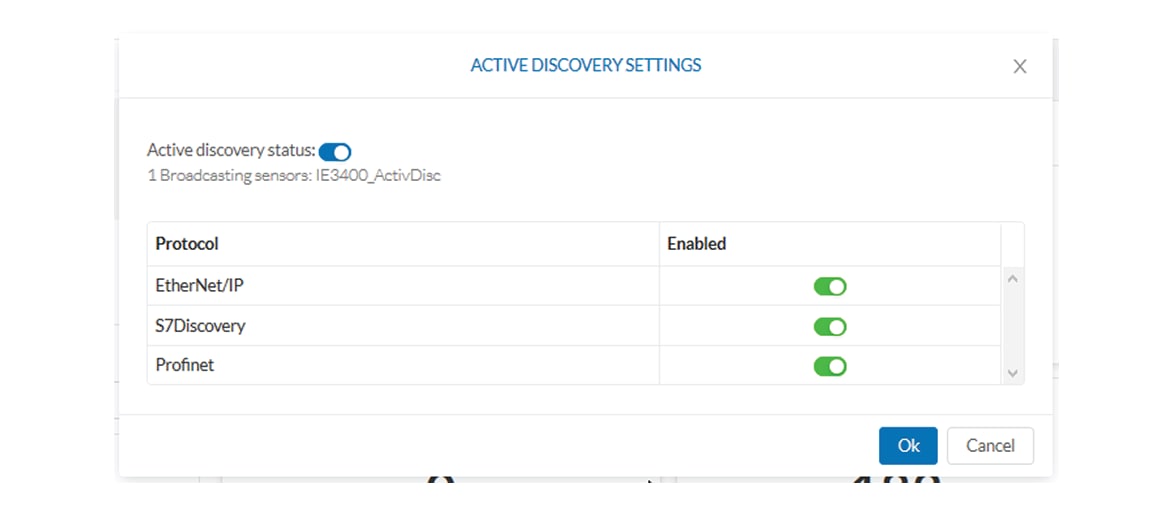
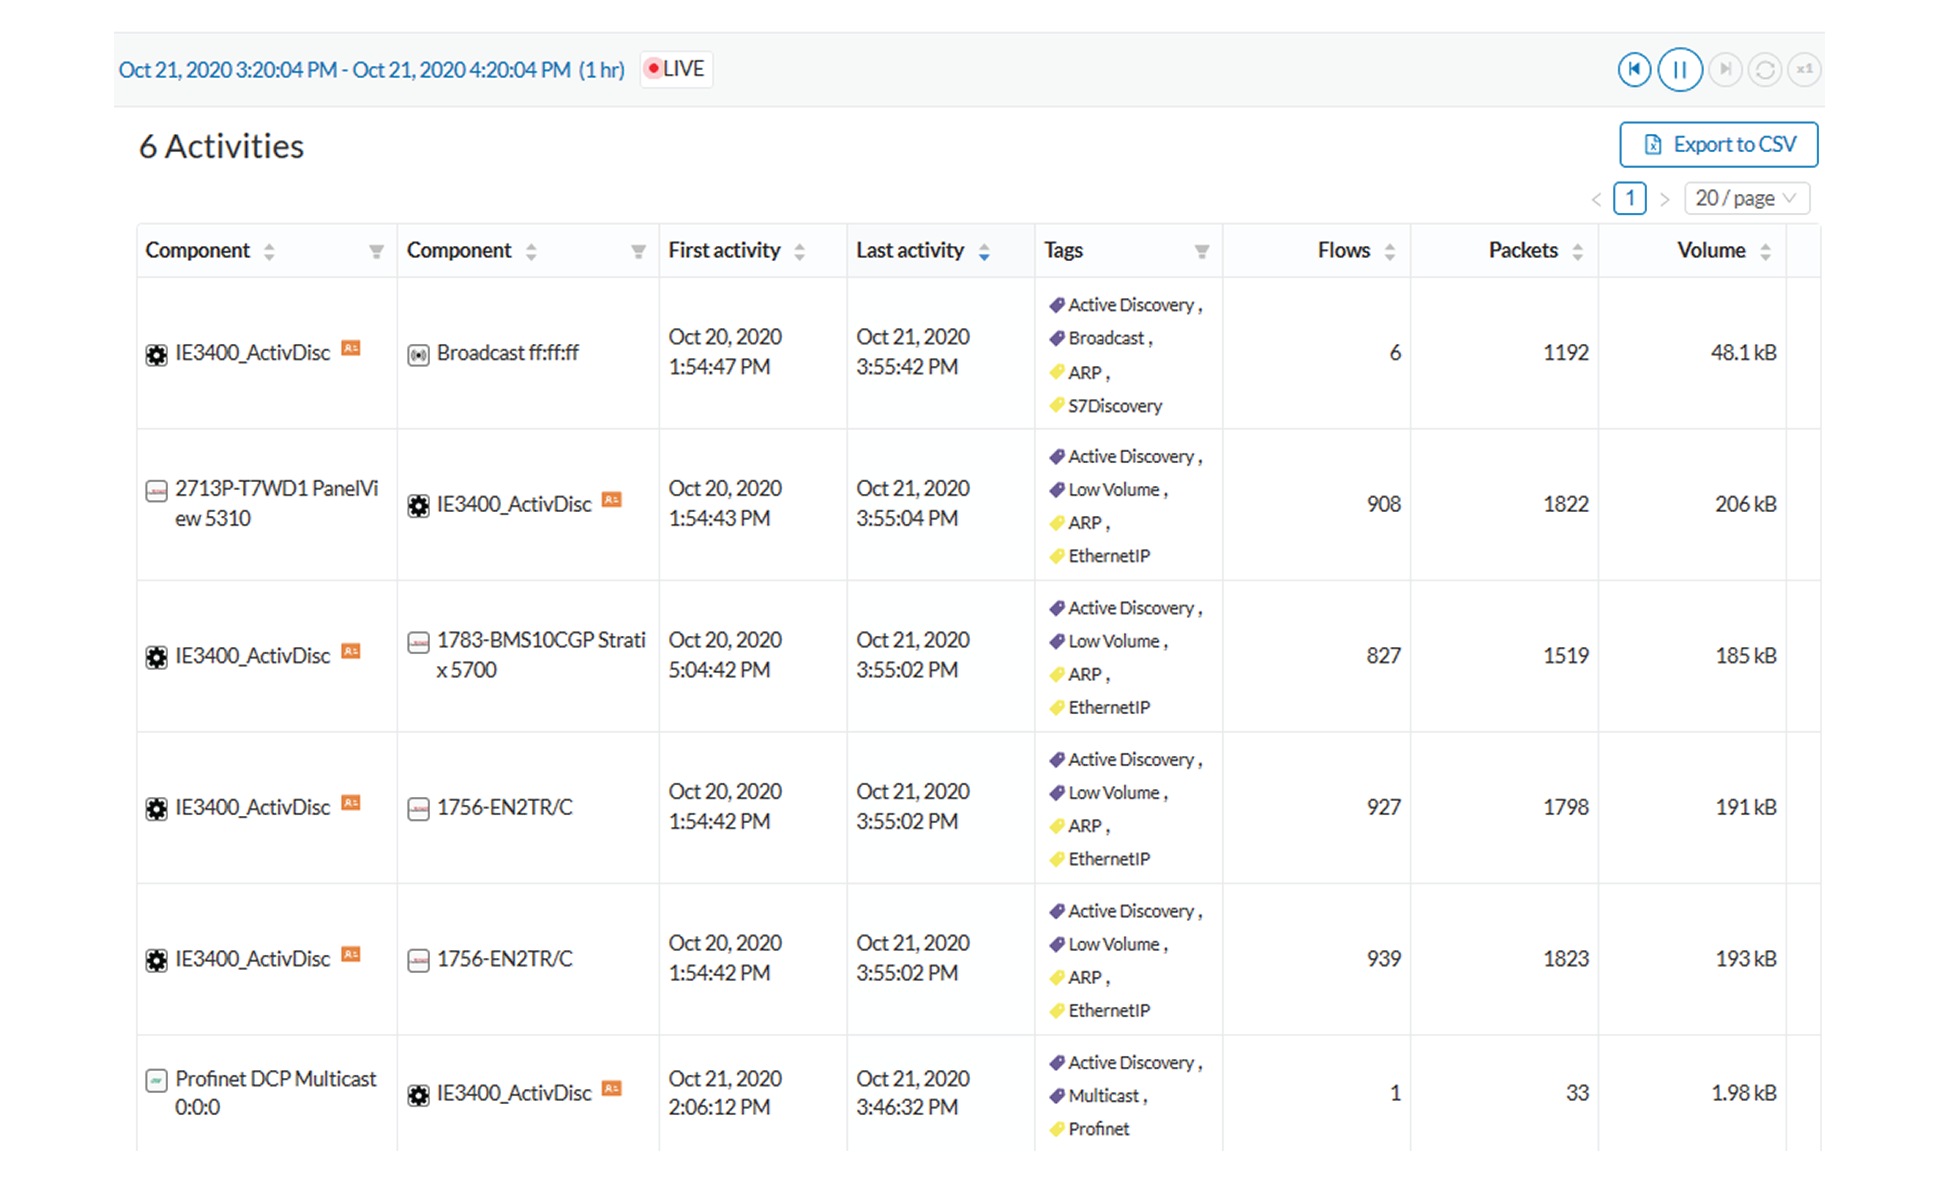
Activity tags
Filtering on activity tag will not have the same behavior than a filter based on devices. Inclusive activity tag filters will
be the same, but exclusive will remove activities only when all activity tags are included in the set of excluded tags.
For example, if an activity has two tags, both tags need to be excluded to hide the activity.
Activity filter – negative filter 1
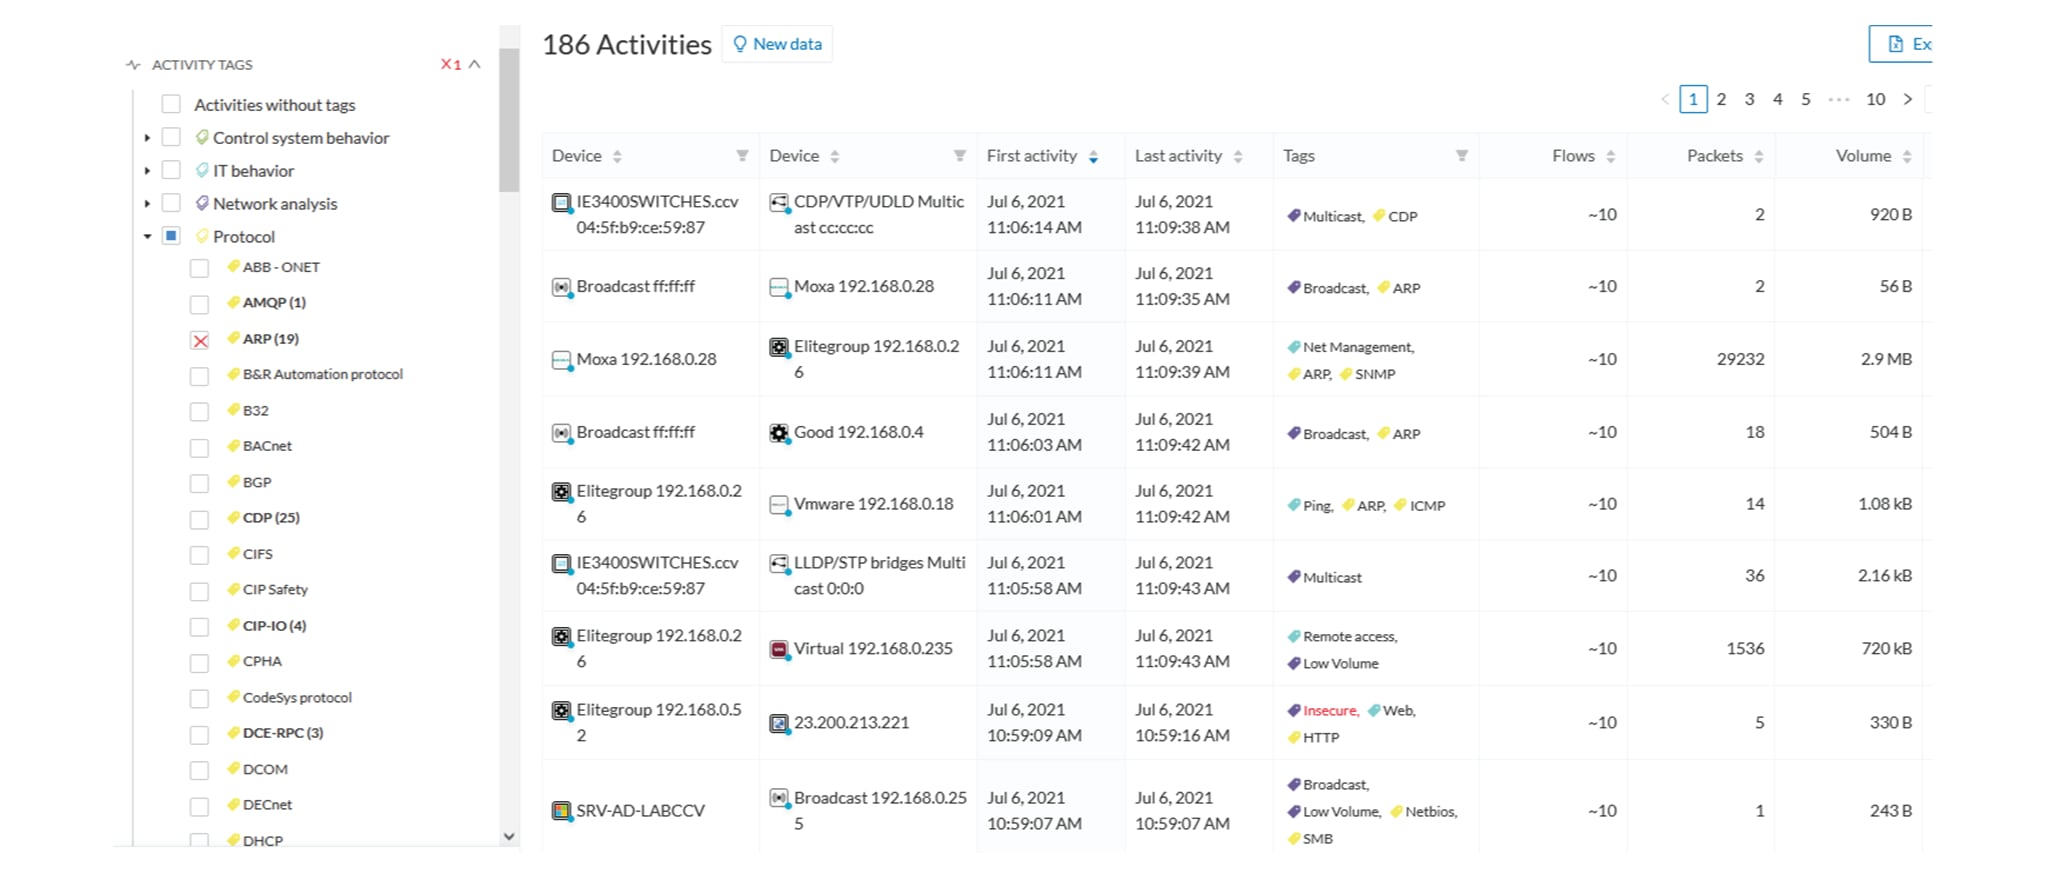
In the example above, several activities are kept because the ARP tag is present as well as other activity tags. There is
no exact match. But the activity below is hidden:
filter 2
To remove broadcast and ARP activities, both activity tags need to be selected like below:
Activity filter – negative filter 3
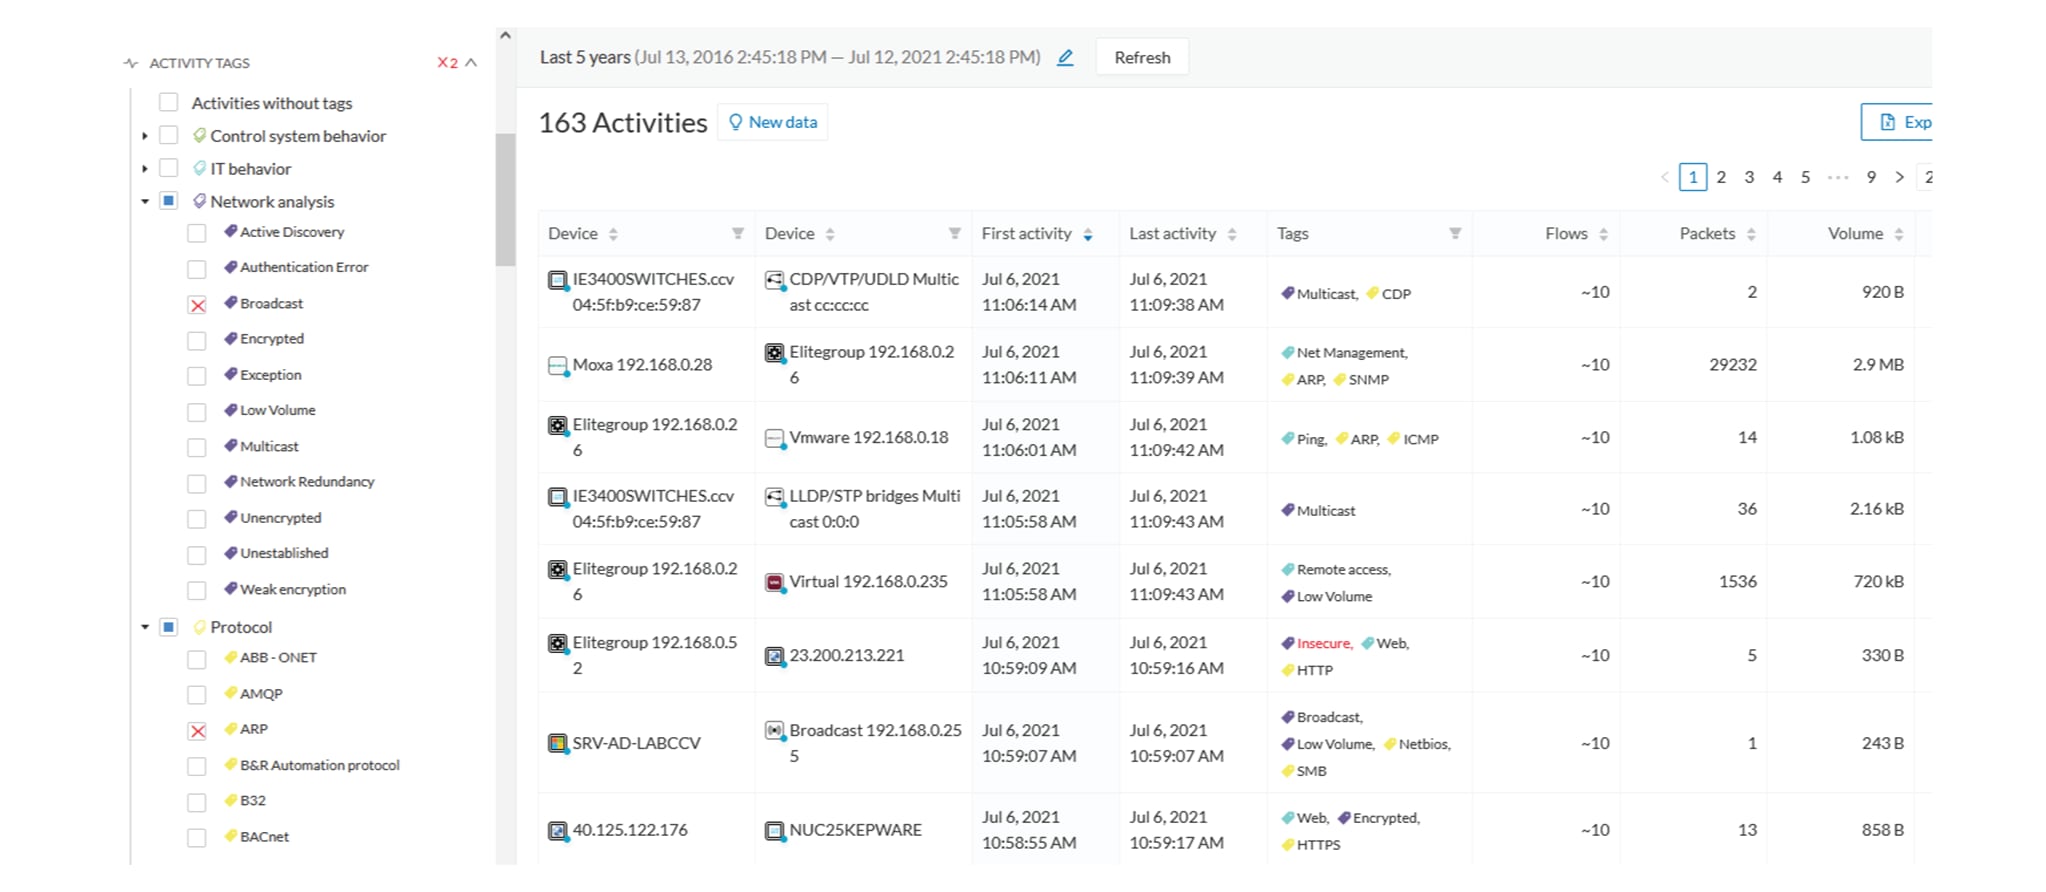
Combined inclusive and exclusive tags are seldom used, but for very specific use cases.
Above rules, for positive and negative selection, are combined, resulting in the following logic:
-
Activities are selected as soon as at least one tag is in the set of included tags
-
From this selection, activities which all tags are in the set of included AND excluded tags are hidden
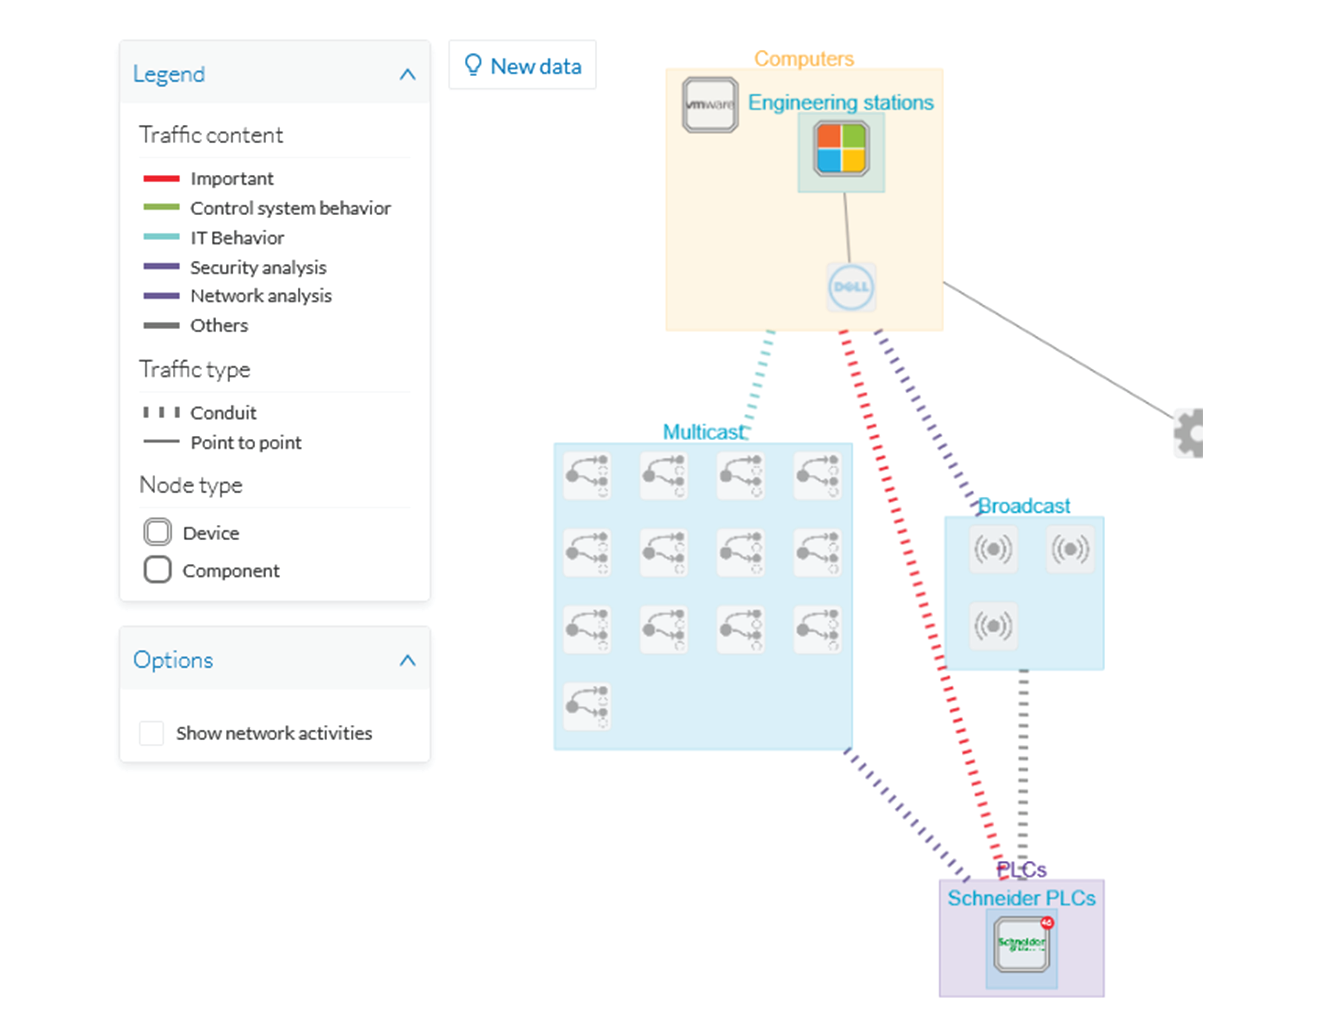
Networks
A filter can be defined based on network settings: IP range or VLAN ID can be used. This filter will have an impact on the
activity list, the result will be “all activities with one end belonging to this network”. Activities with at least one device
in the corresponding network will be selected.
Regarding the Device list, only the devices with at least one IP address in the corresponding network range are selected.
Exclusion and combination also can be used, for instance:
Network filter – negative filter
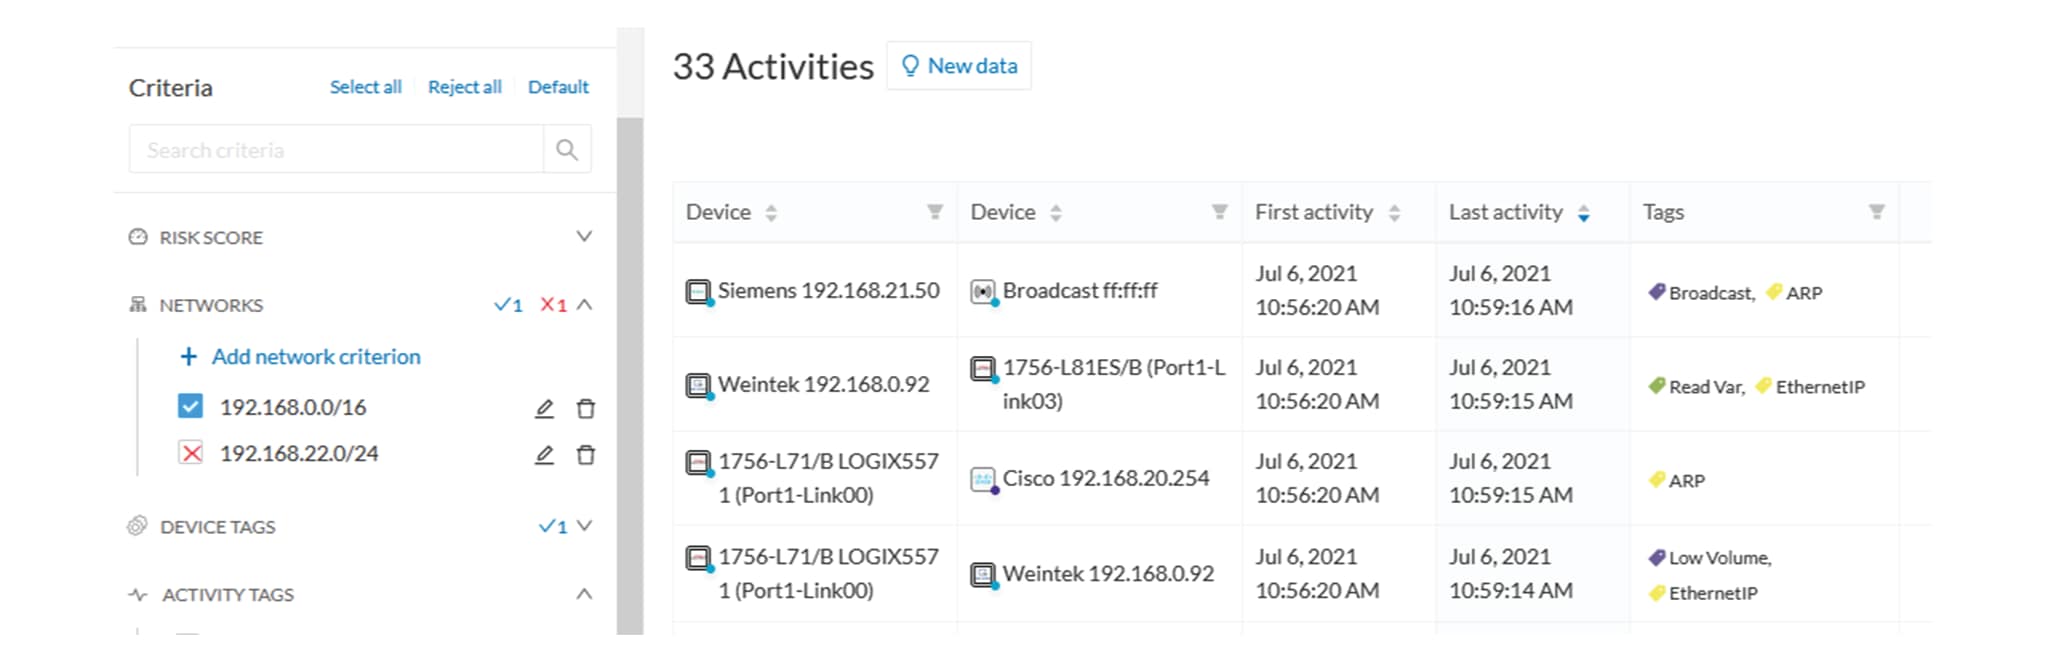
Multiple negative selections are not supported on 4.0.0.
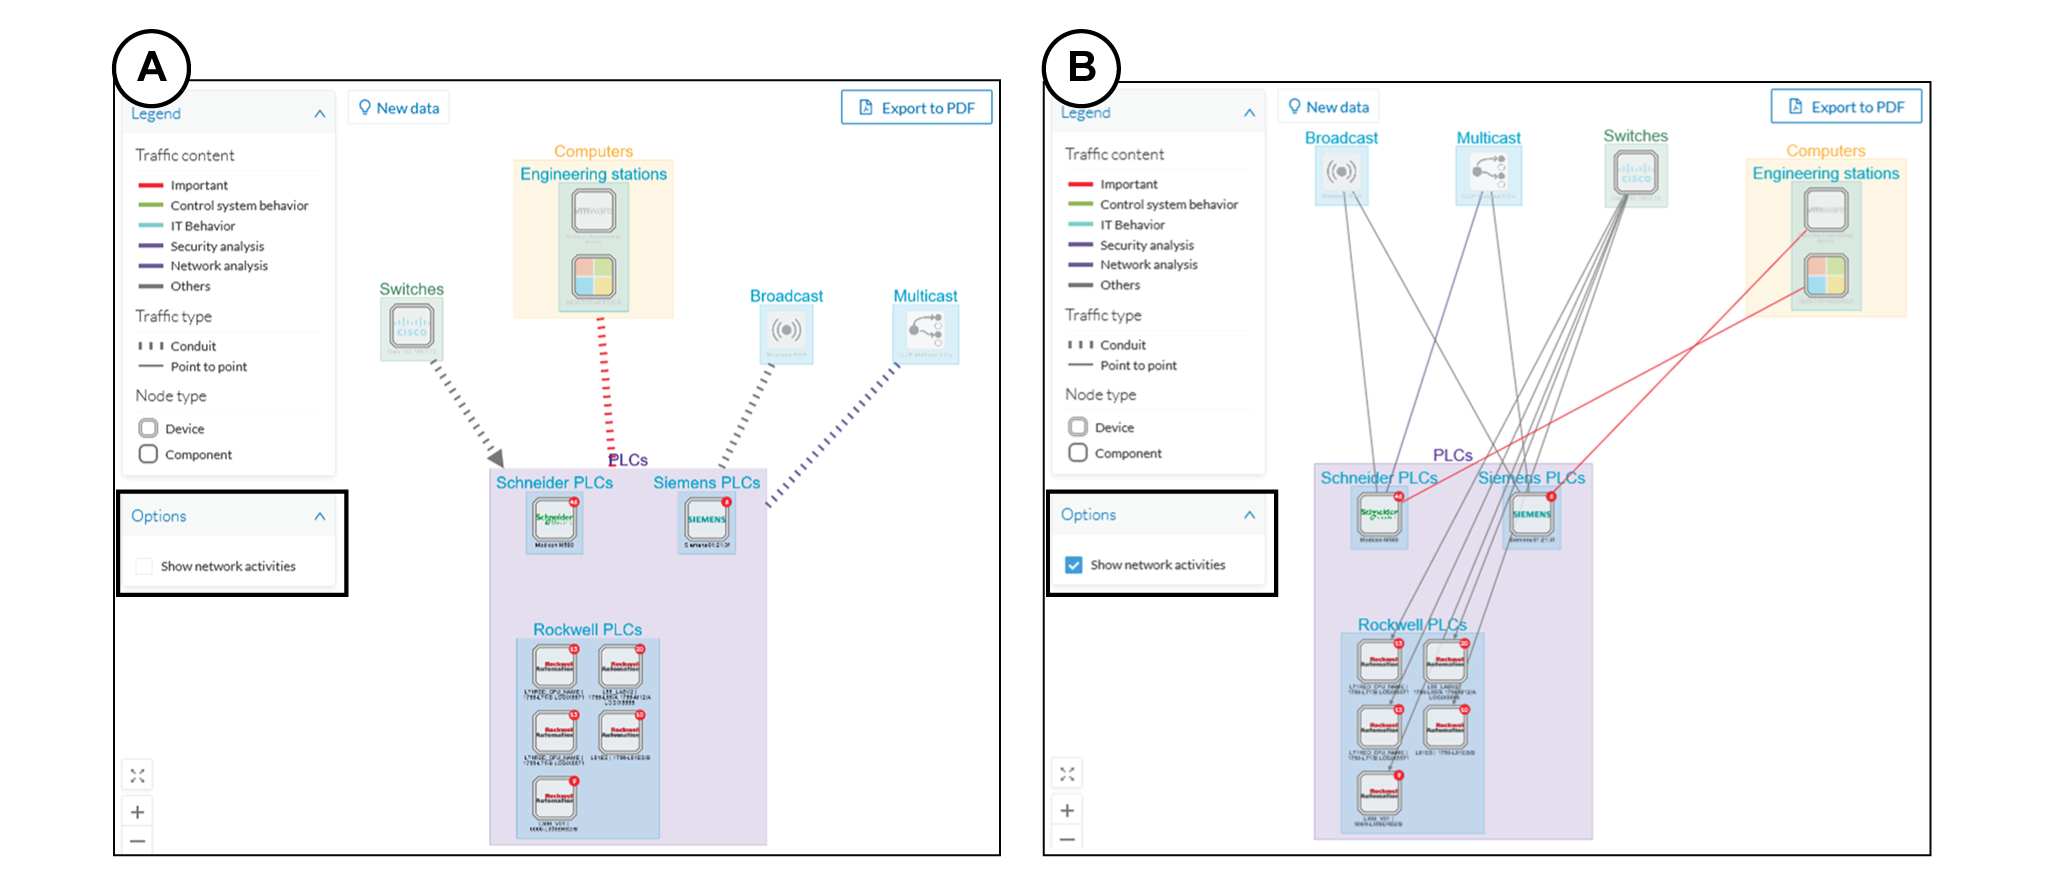
Filter combination
The user can define filters in several categories simultaneously. The preset will be calculated first by filtering the activities
with all the activity-based filters. Then, the devices will be filtered with their own filter criteria. The result is the
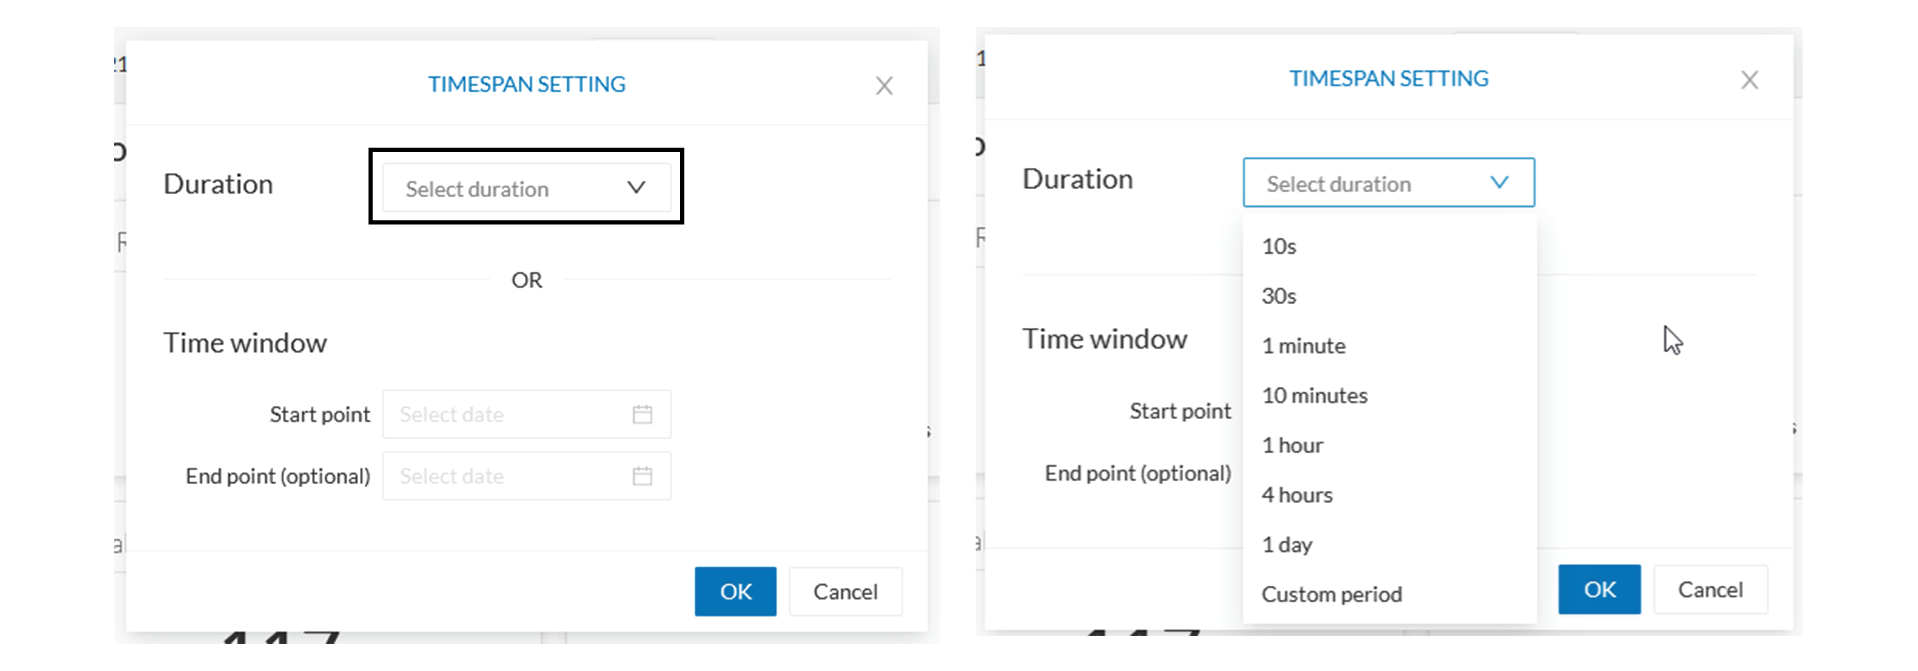
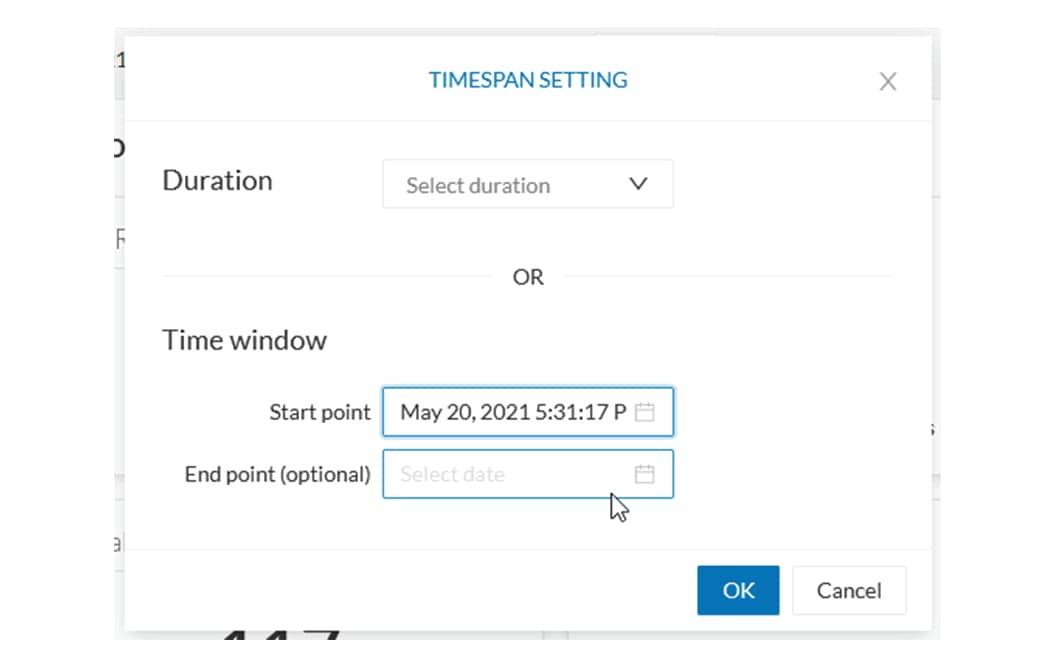
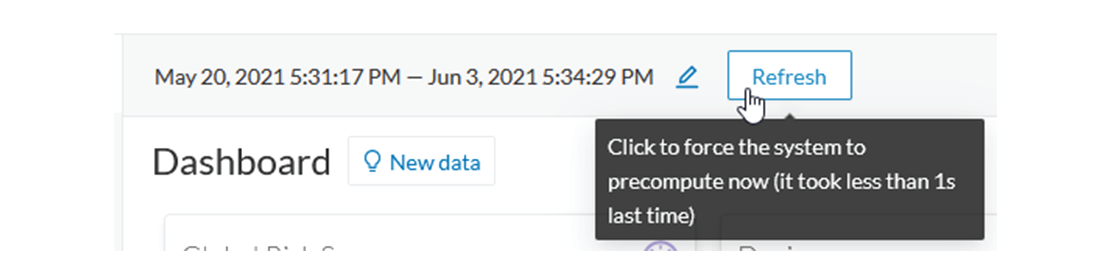
preset dataset. This preset dataset is used to precompute the view that is proposed to the user. The user can select a time
frame to further filter the preset dataset.


 Feedback