A basic use case in Cisco Cyber Vision is to detect if and when a new equipment connects to the industrial network being monitored. However, the first thing to
do when using Cisco Cyber Vision is to organize components in an intelligible way. In this use case, we choose to organize components according to the network's
topology, that is, per production chain. In fact, a network can be divided into several areas, such as several production
chains with different criticality levels, where a Cisco Cyber Vision Sensor is placed to capture and monitor its traffic. This topology can be reflected in Cisco Cyber Vision by creating groups which represent a production chain and contain its components. In clear, here we intend to detect a new
component and its related activities within a specific area. Thus, it will be possible to see whether a component connects
with this production chain. Its related activities will also be highlighted in the Monitor mode.
Key Differences: New components and their related activities on the network
Aim: Monitor the production line 2 of the industrial network.
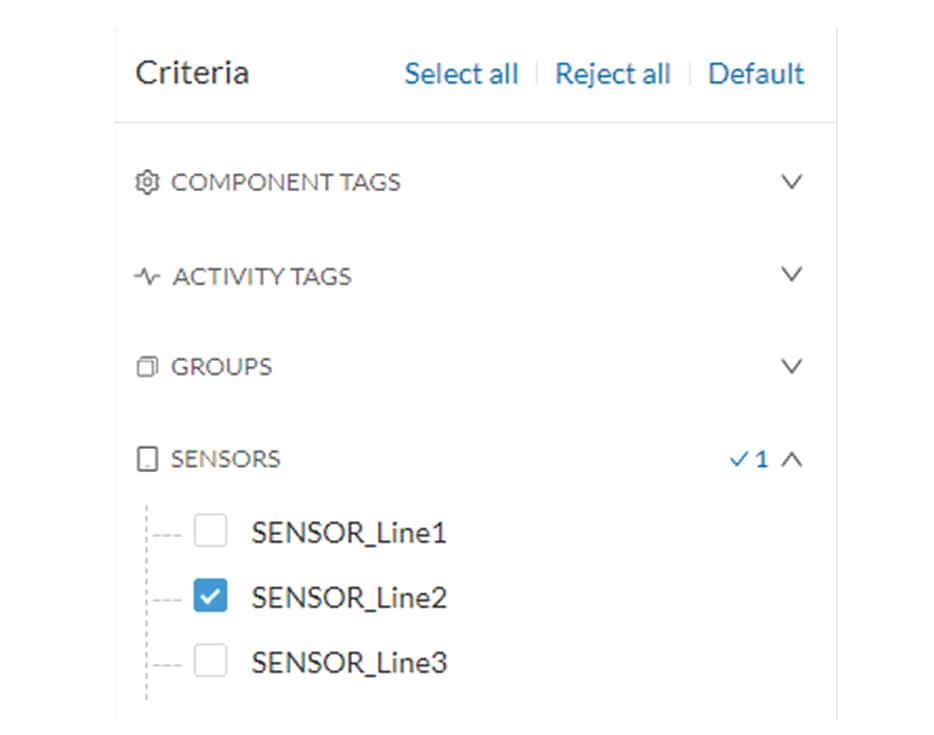
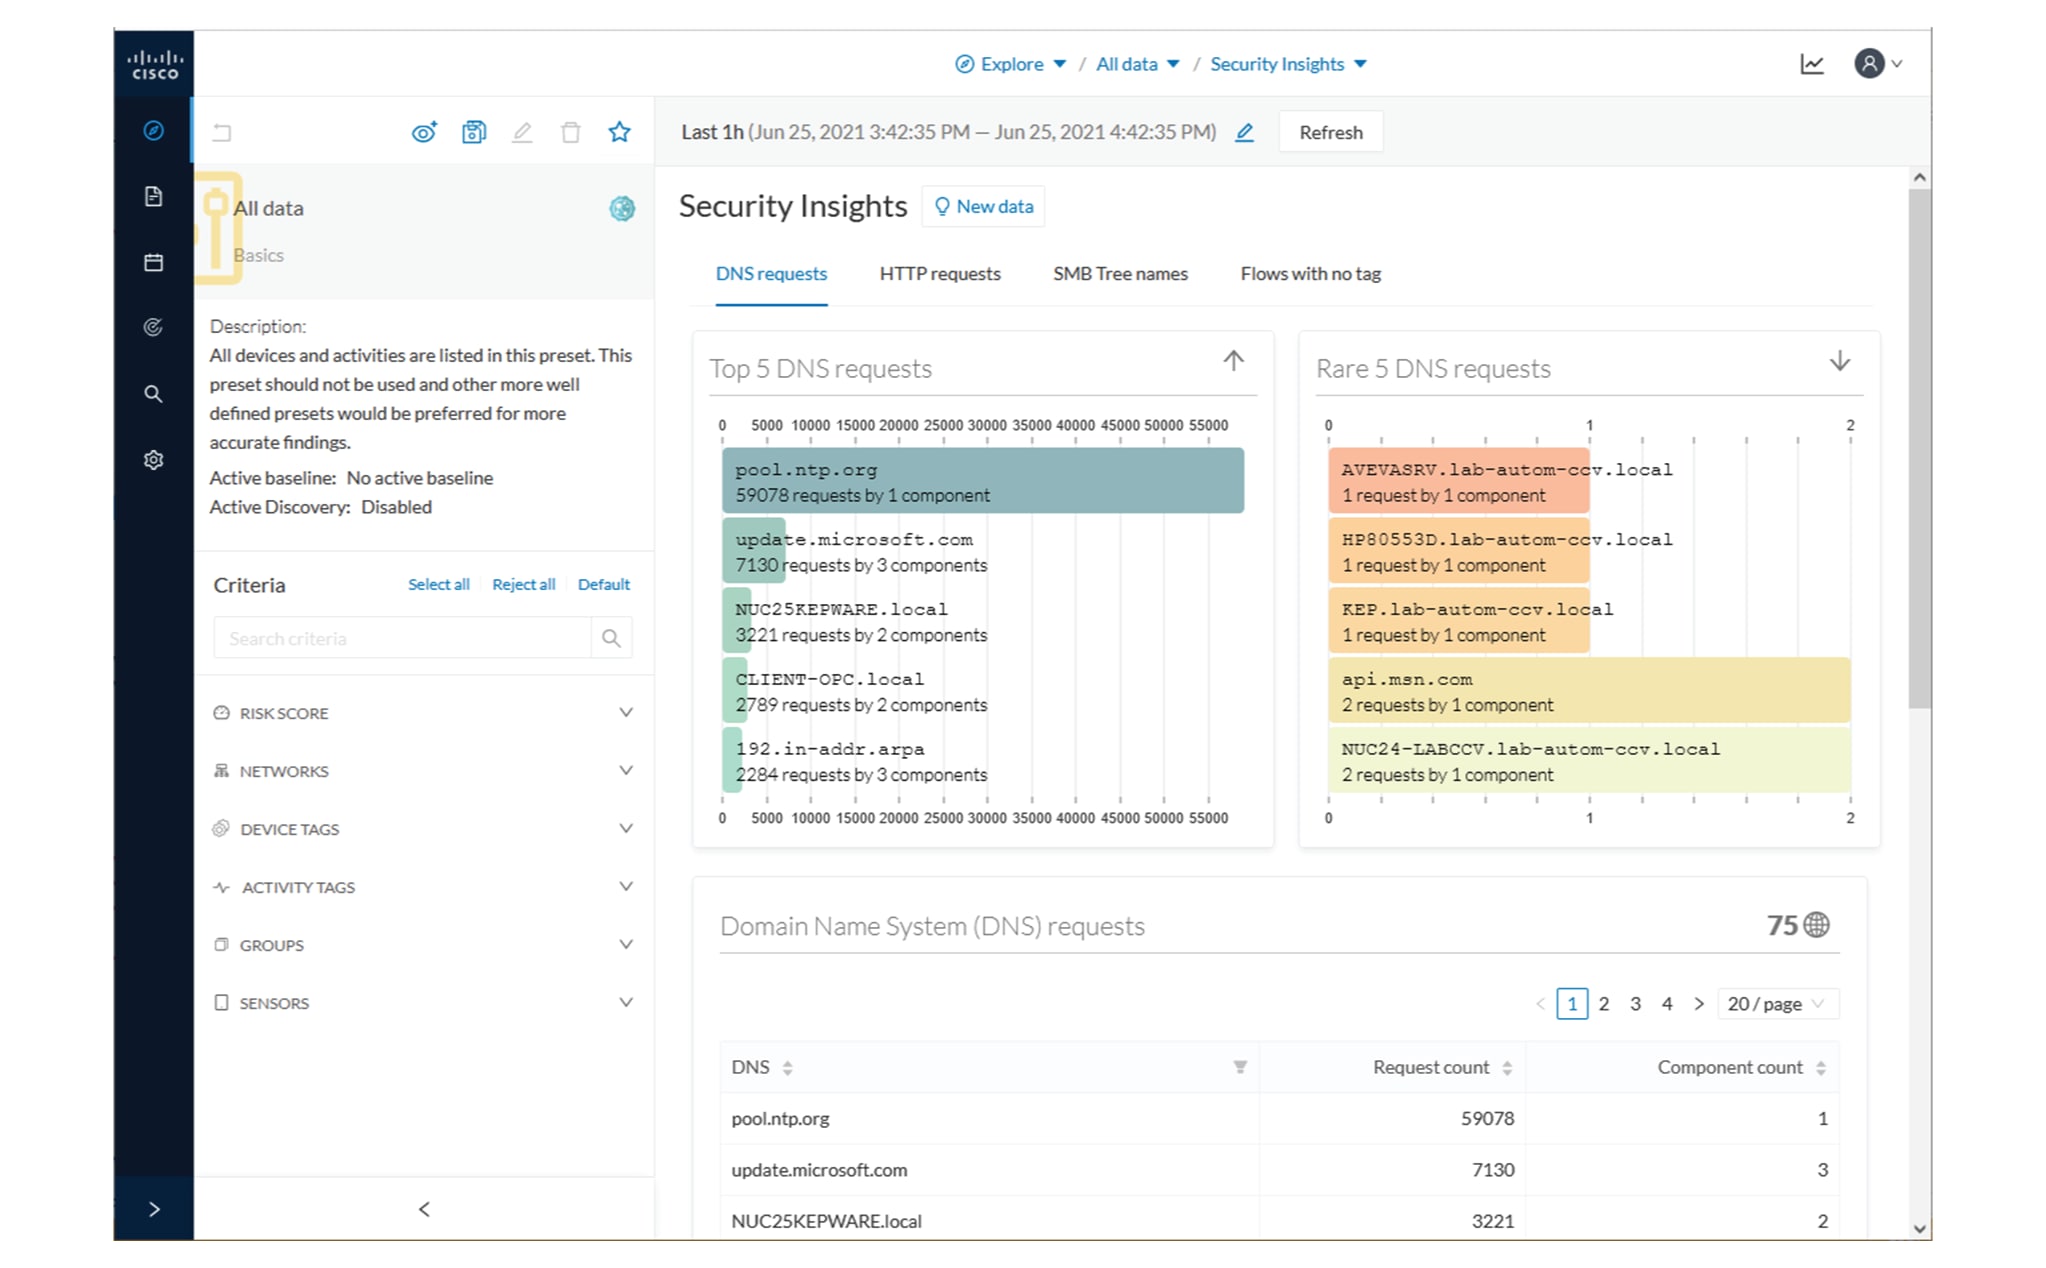
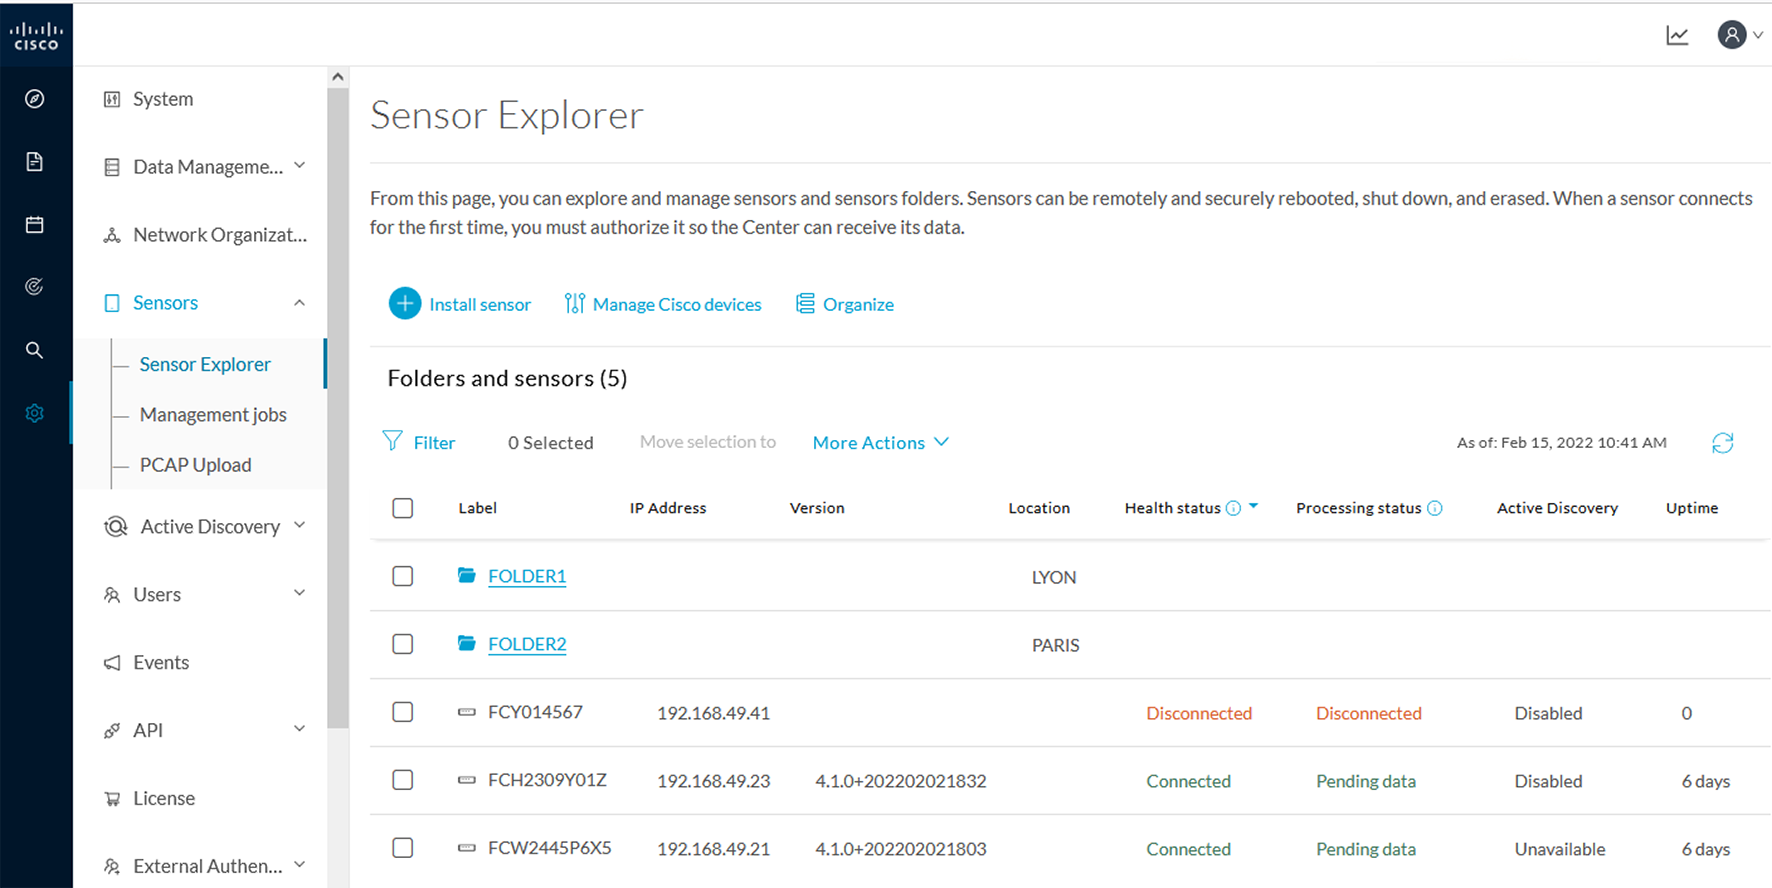
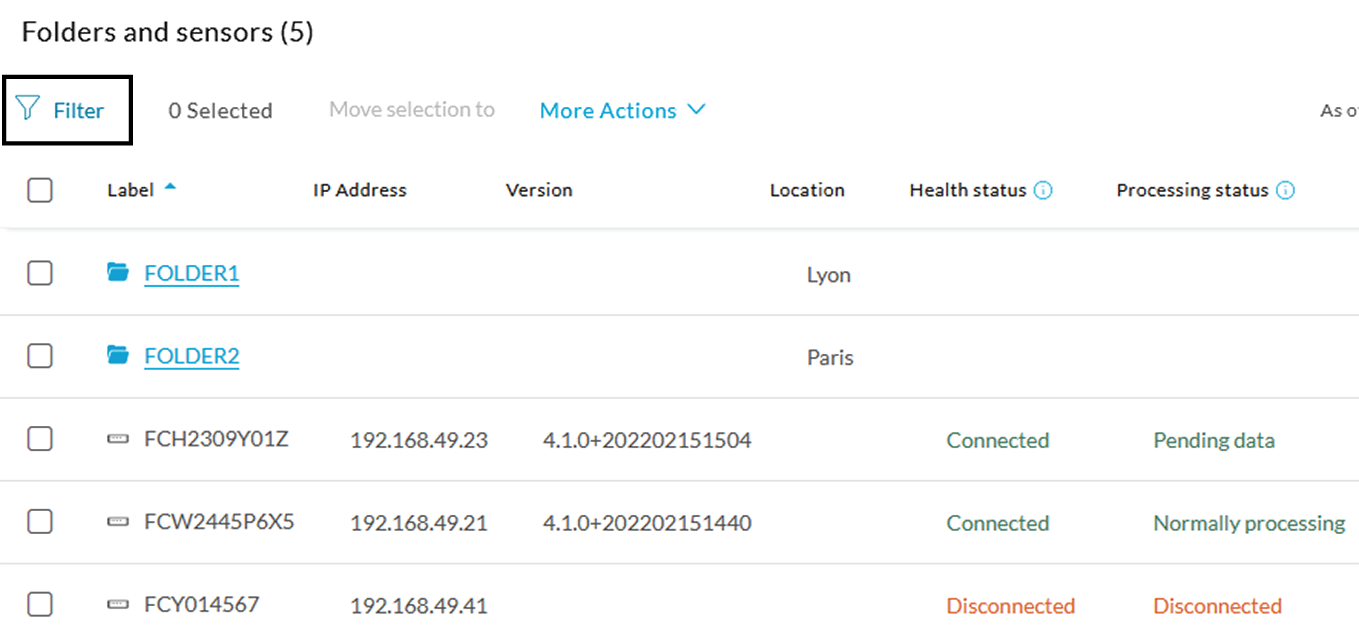
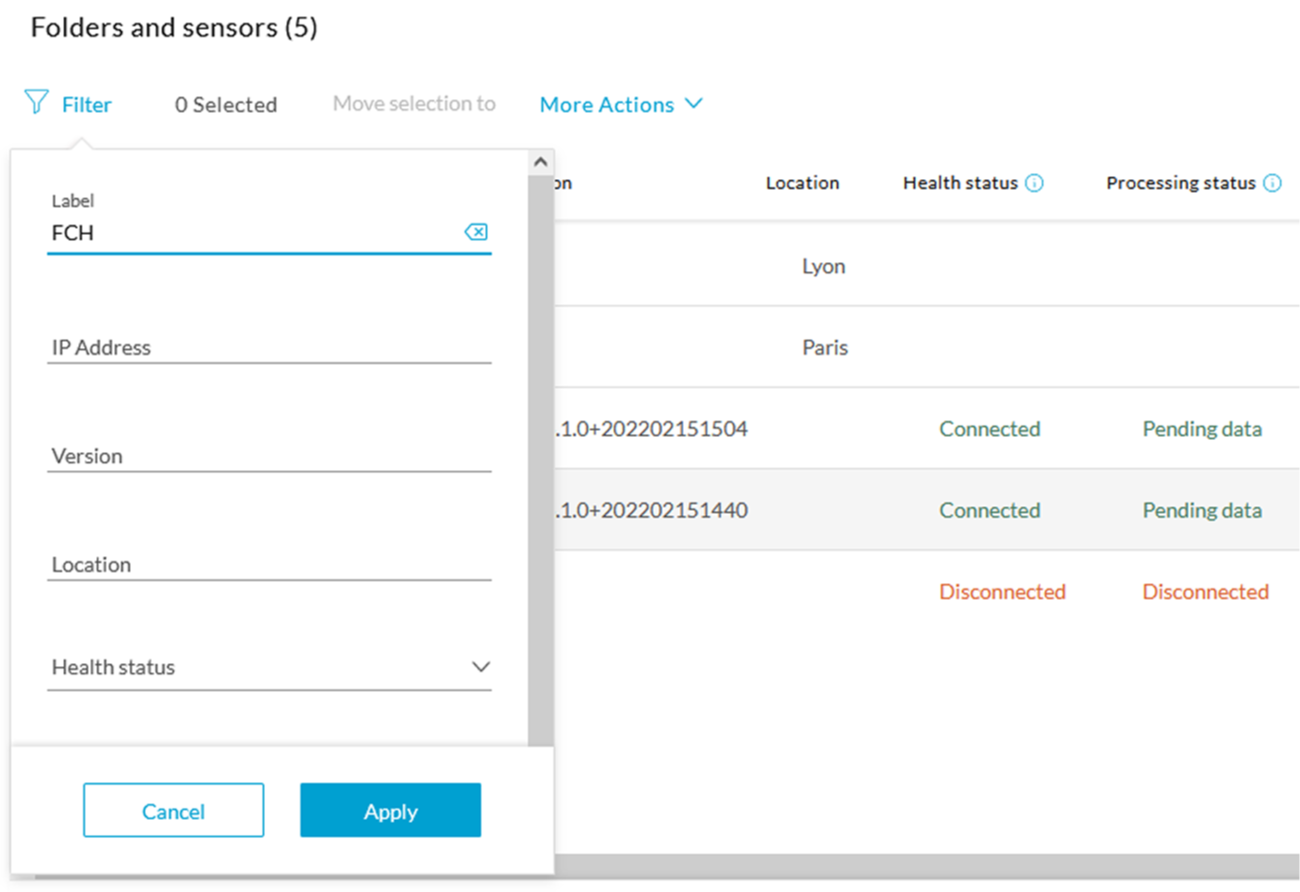
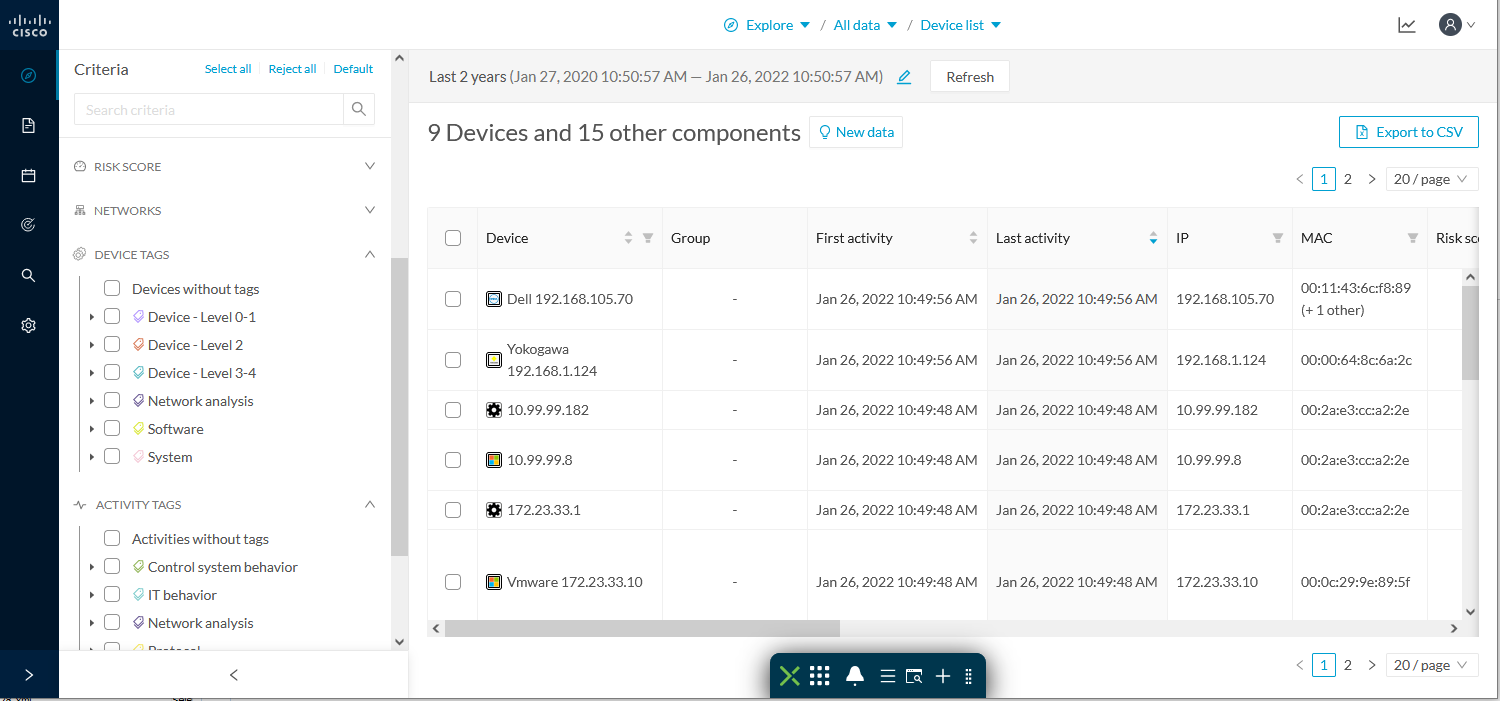
Since a sensor is placed on each production chain, we use the sensor filter to display each production chain. In our example,
the industrial network we're monitoring has 3 production lines on which we have positioned a sensor. We want to see and monitor
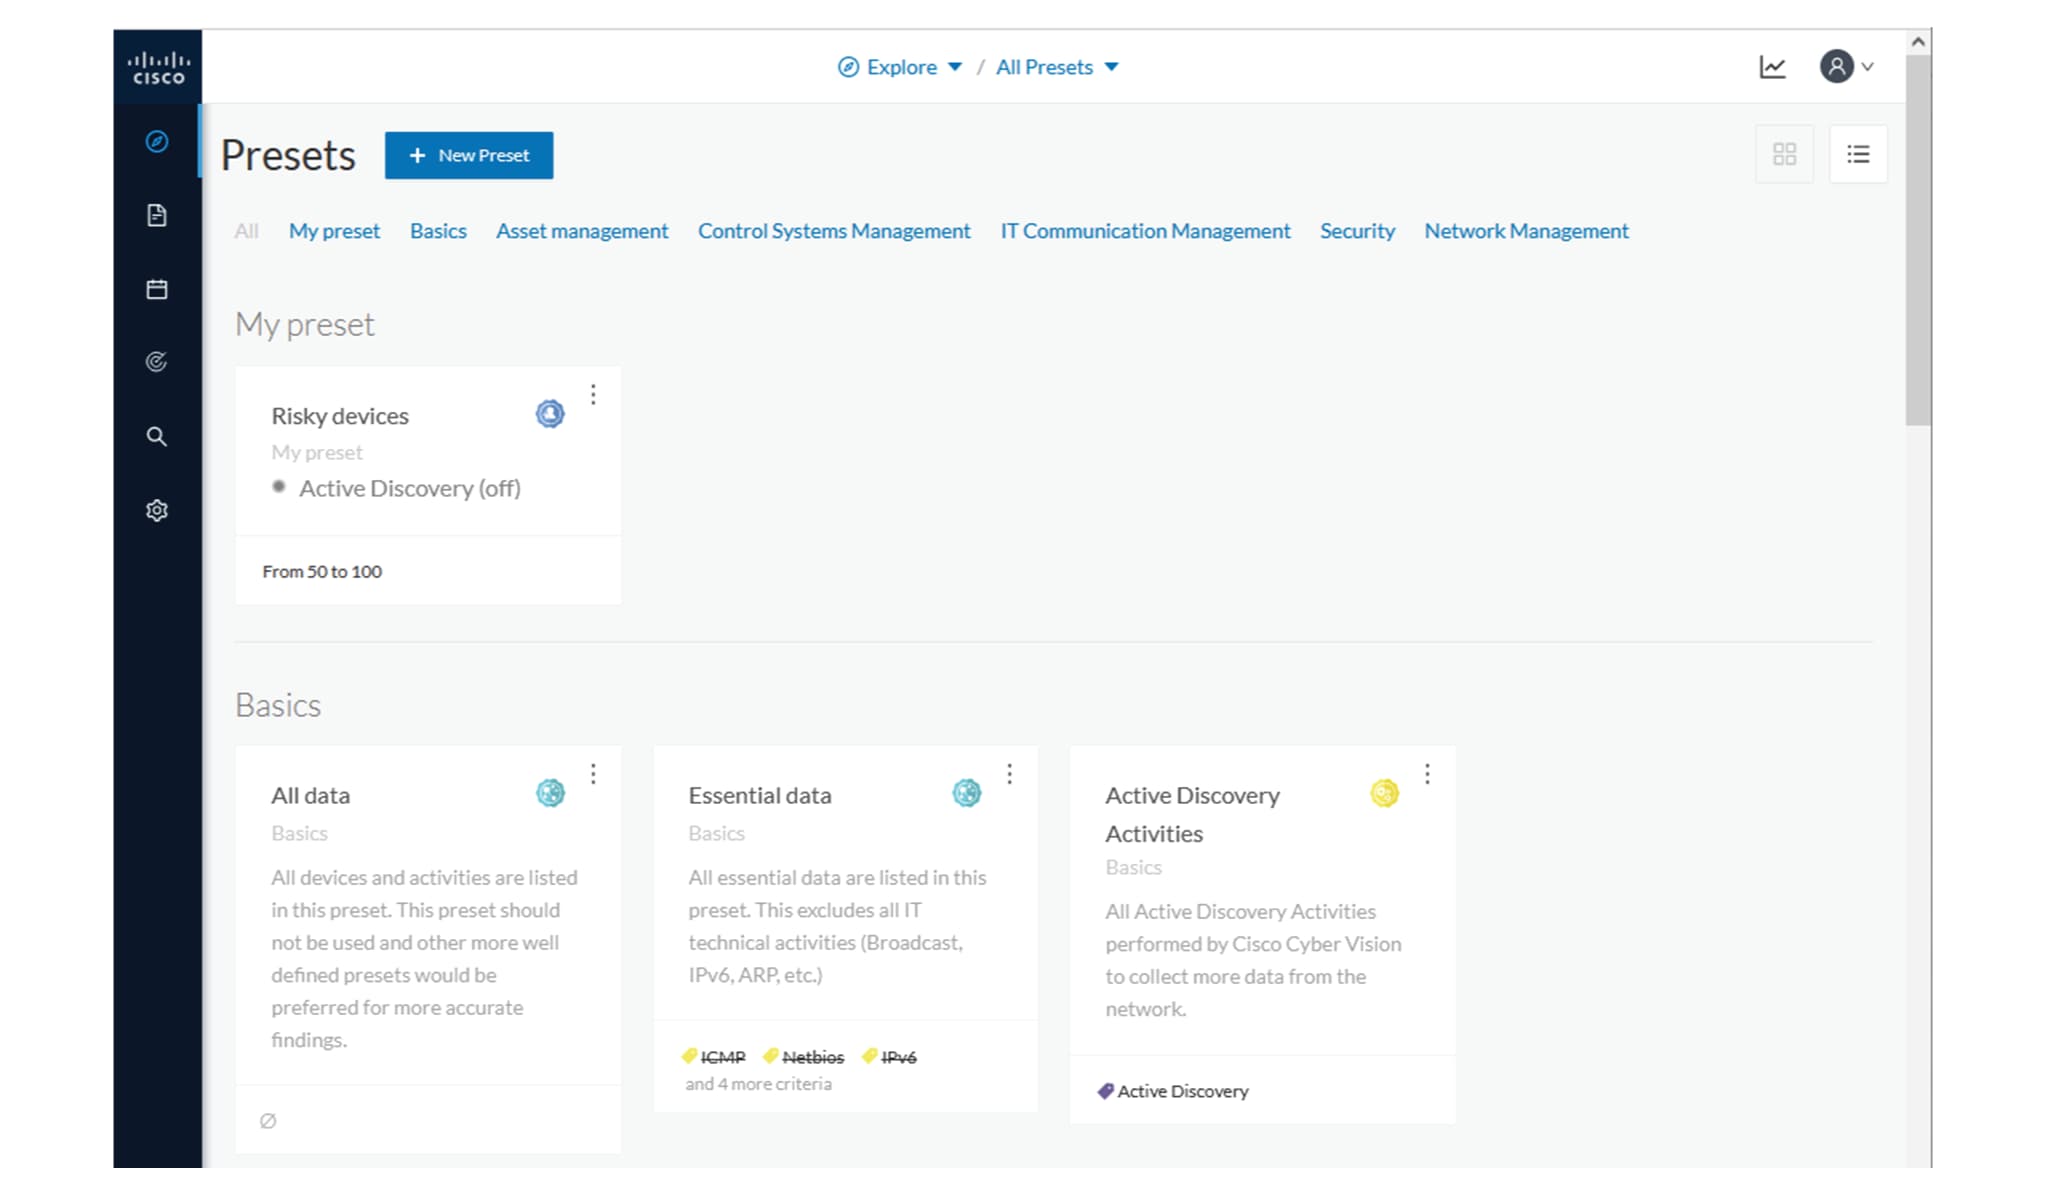
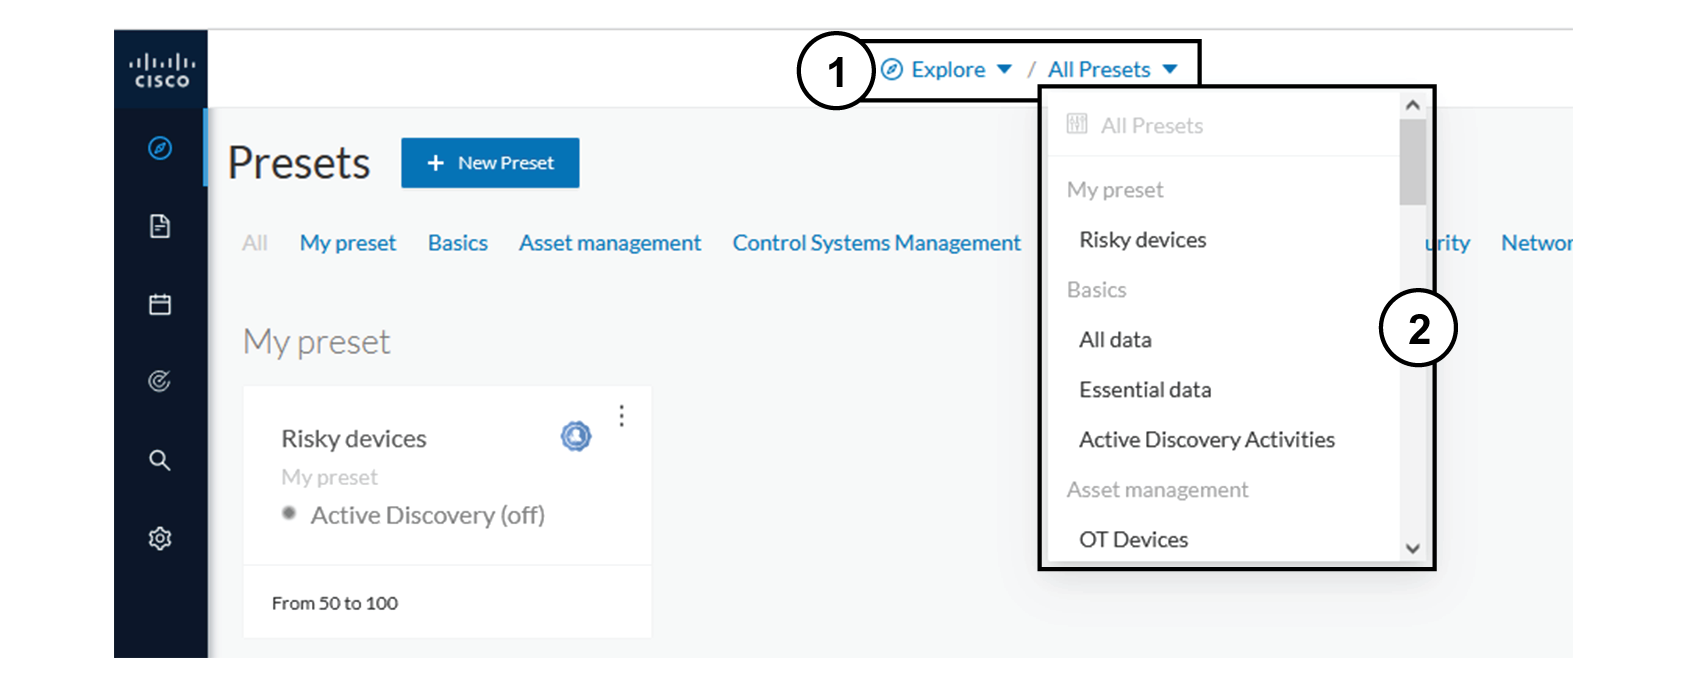
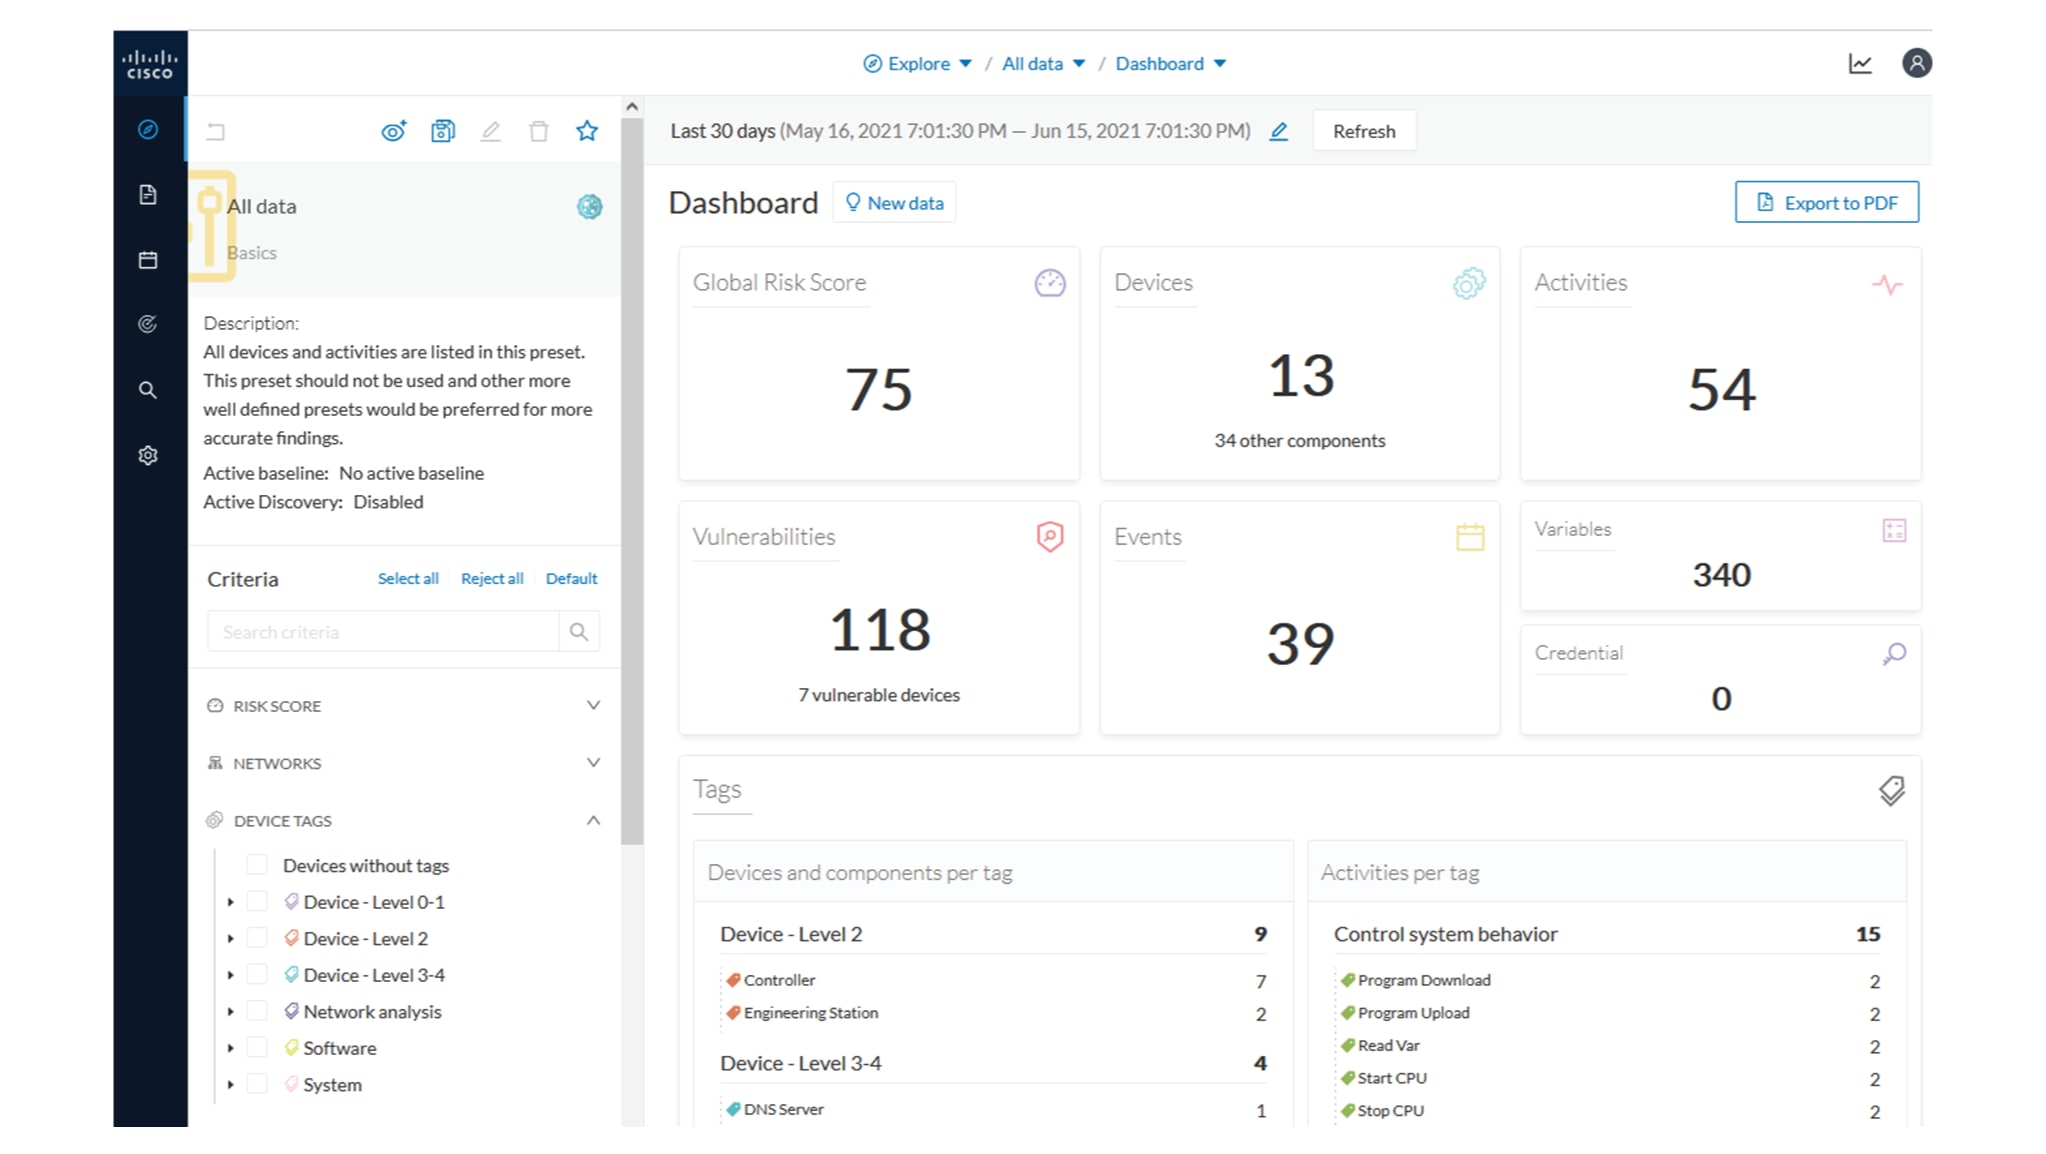
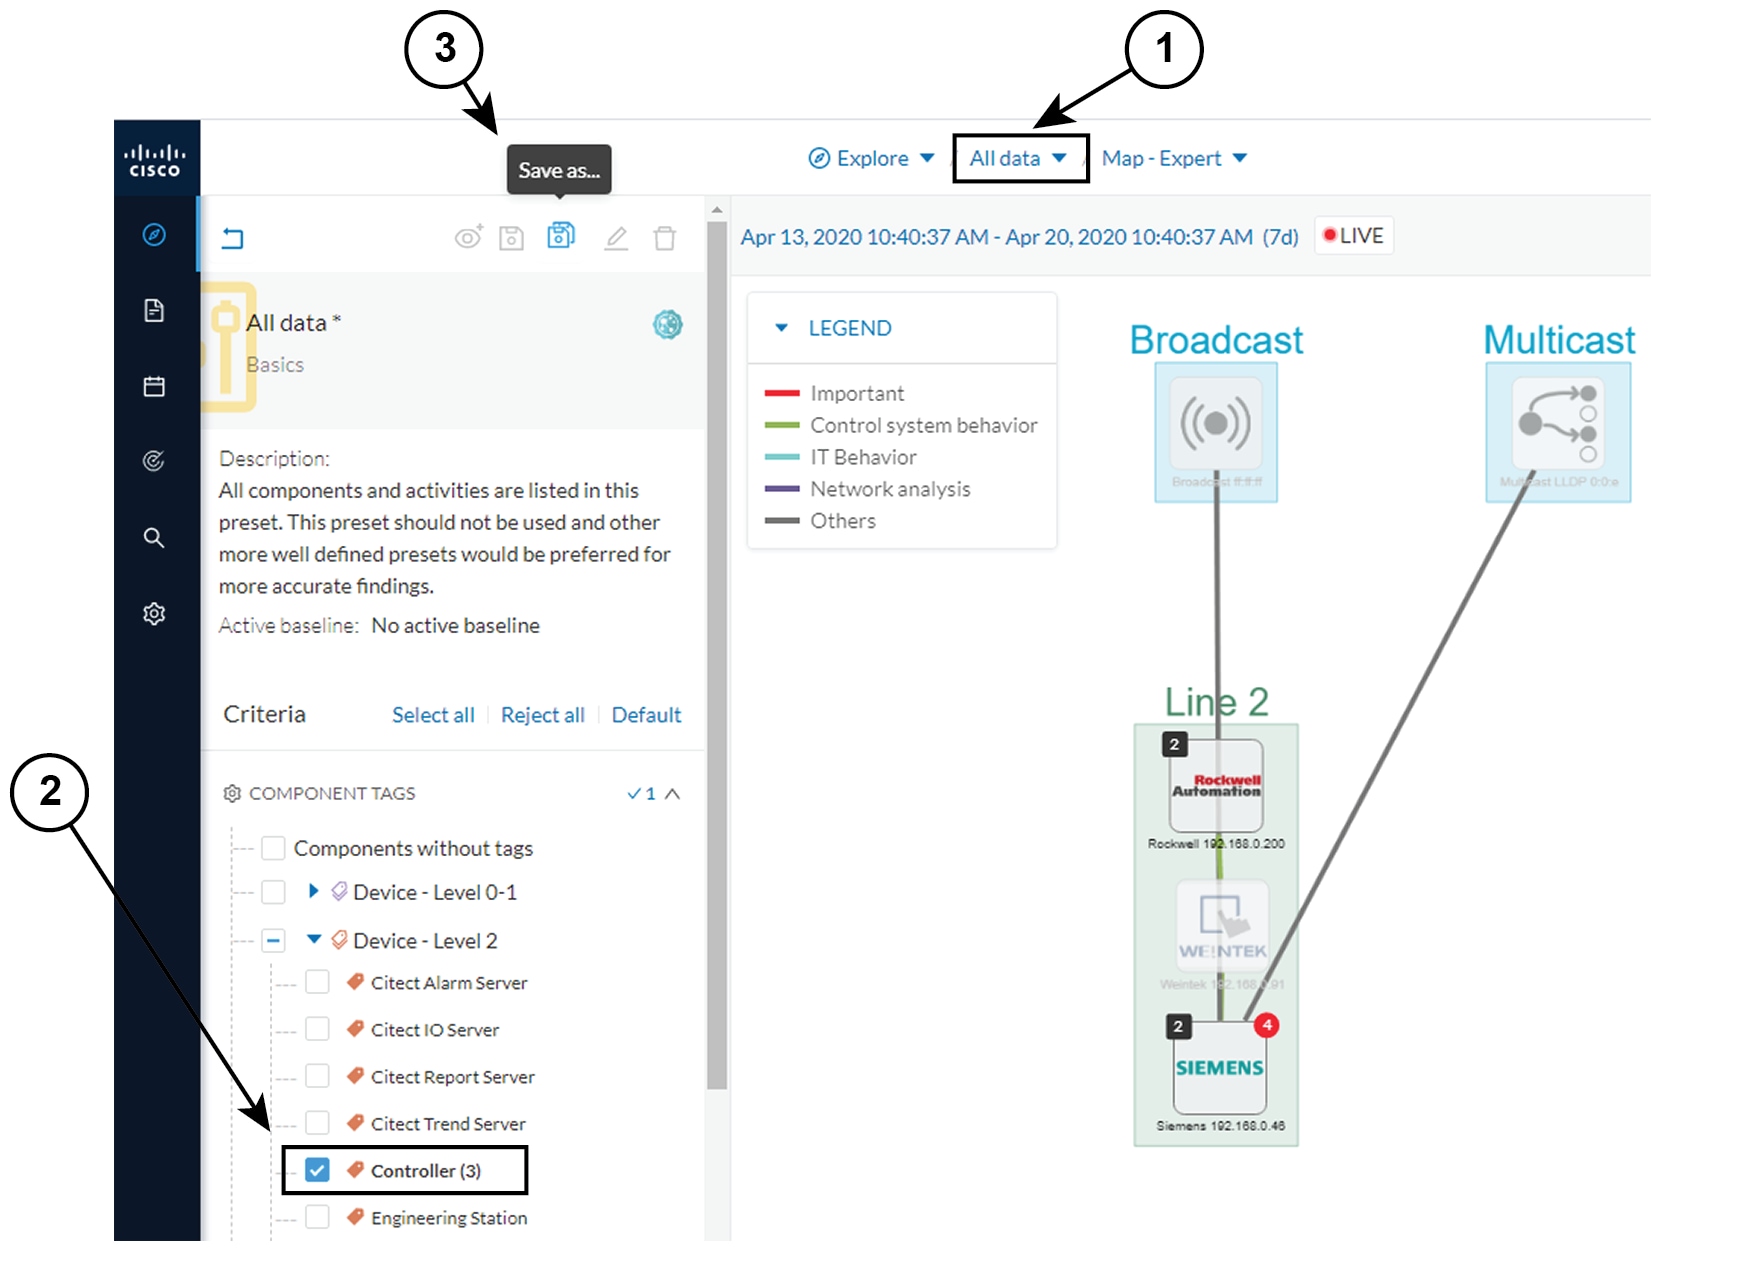
what is happening on production line 2. To do so, we access the Preset All data in the Explore mode and we select the filter
SENSOR_Line2 (it is possible to rename sensors to identify which area of the network they're monitoring) so only traffic captured
on Production Line 2 appears.
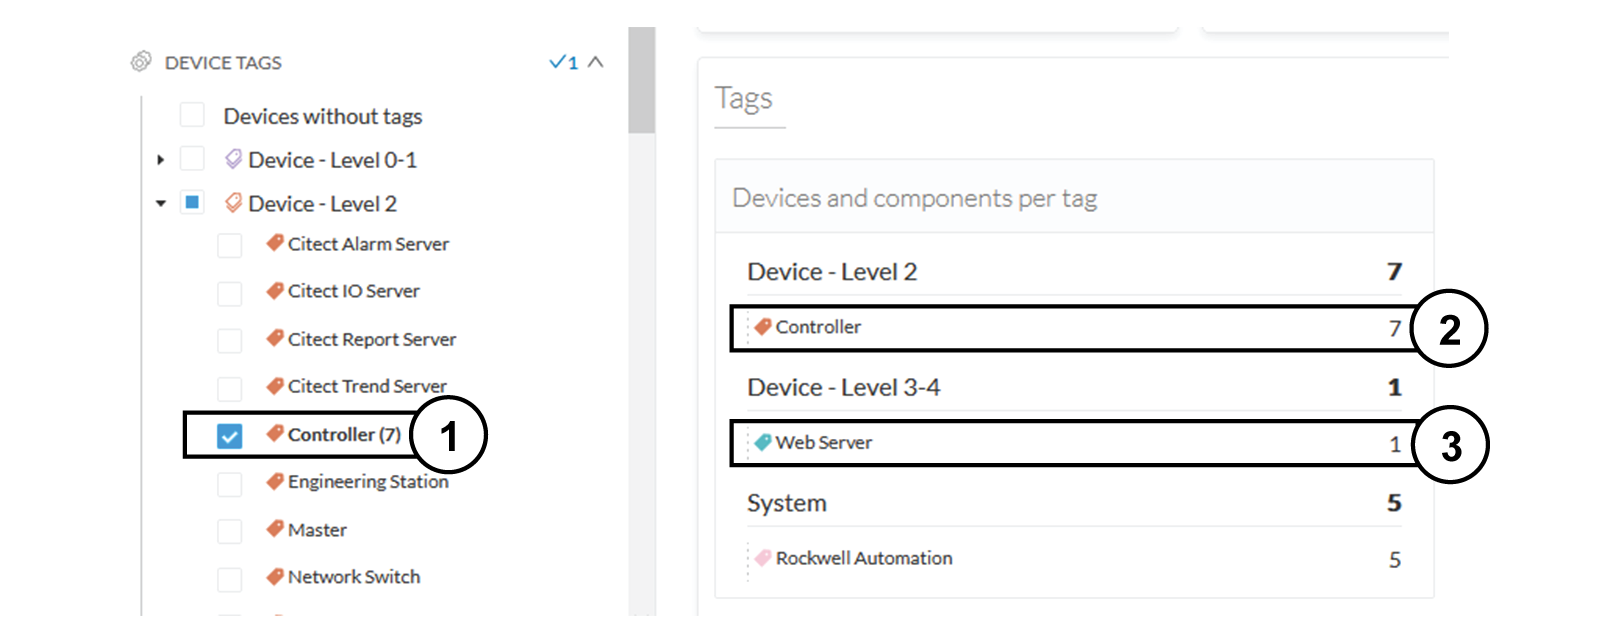
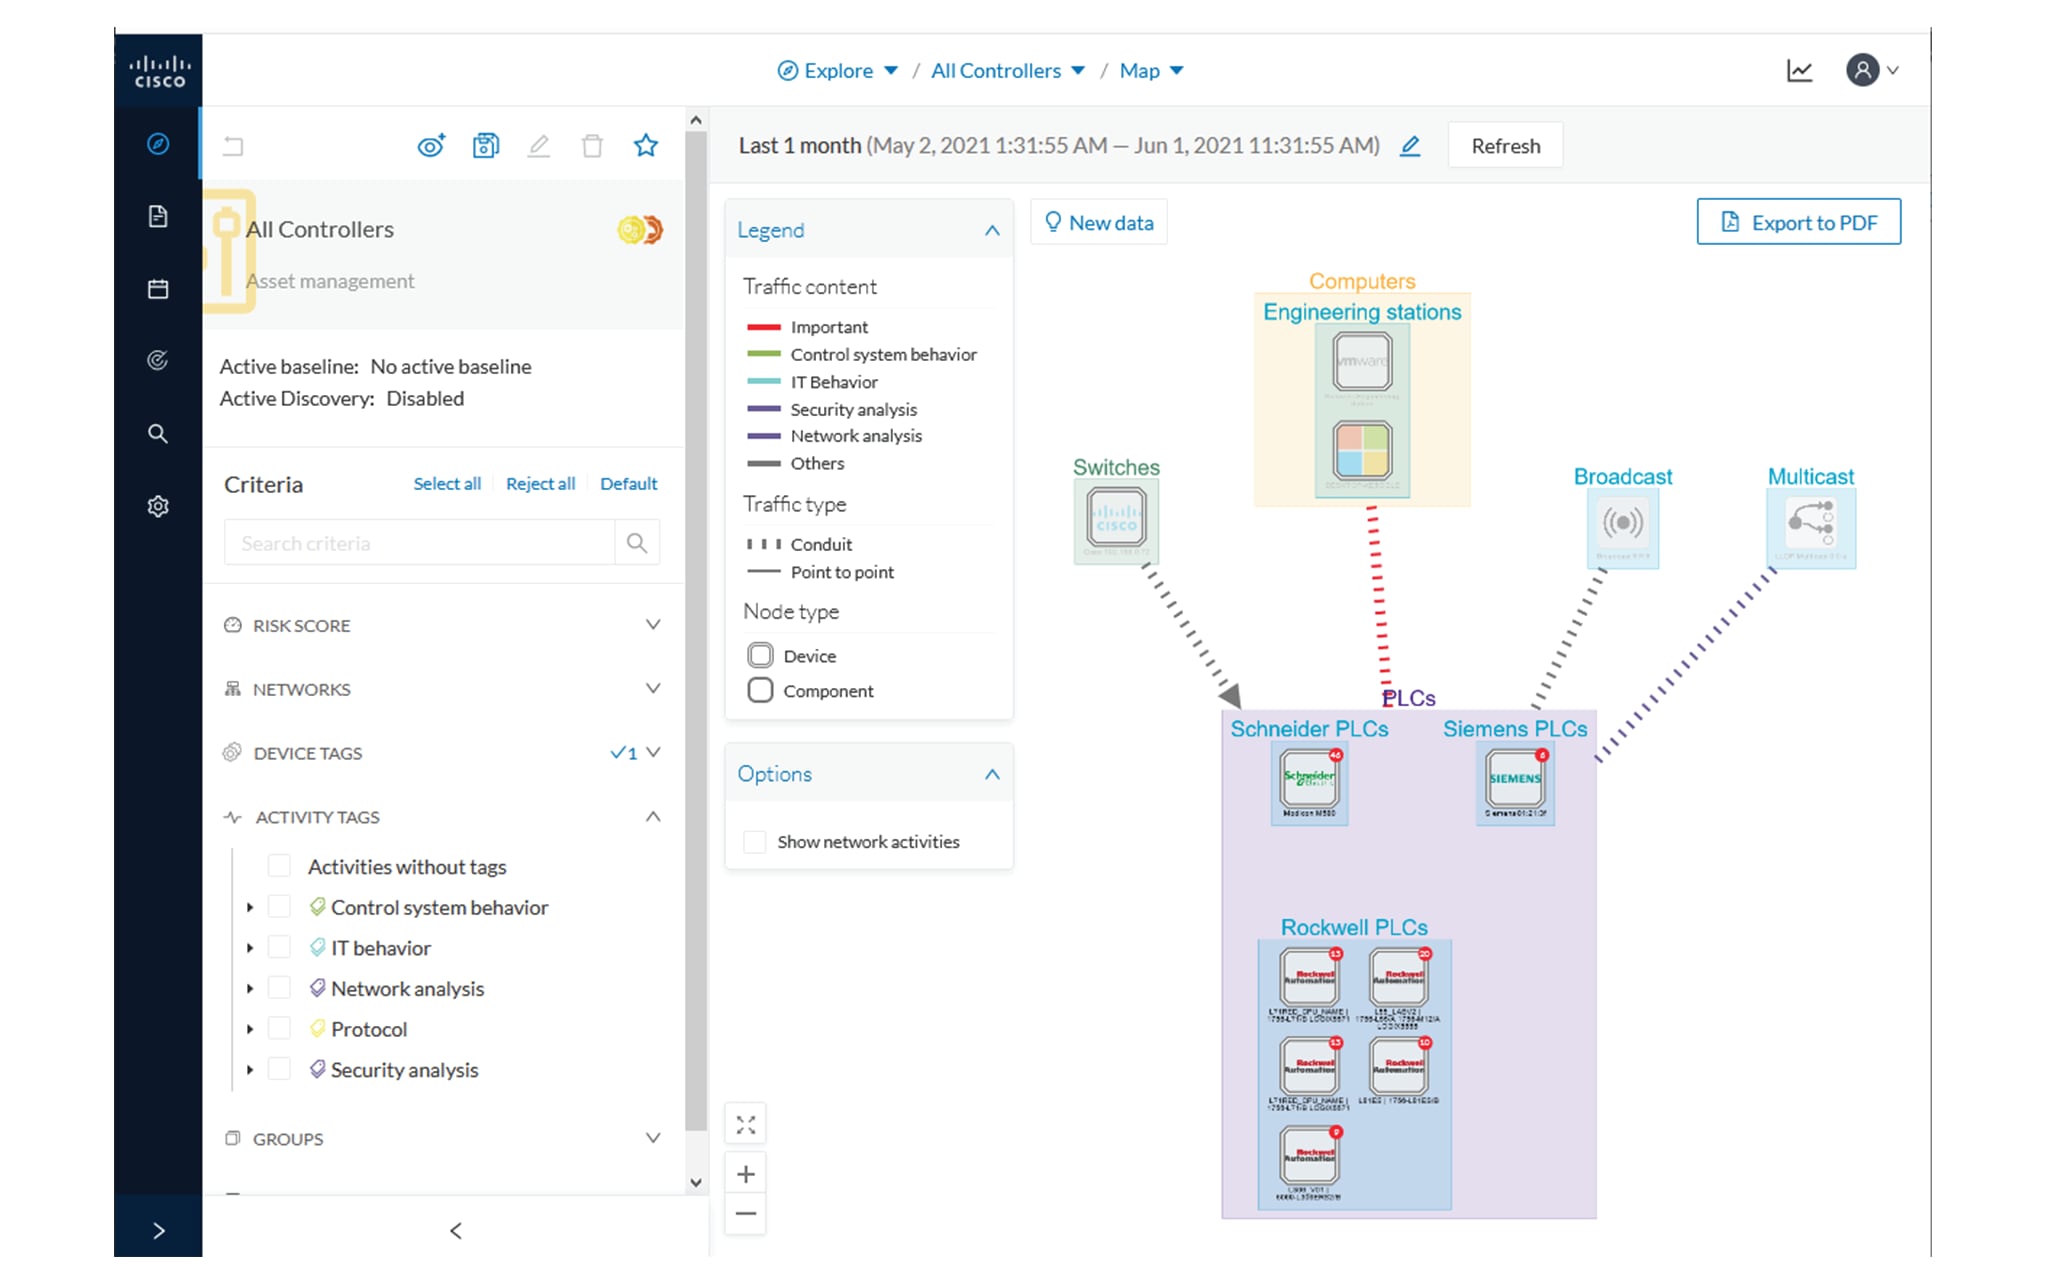
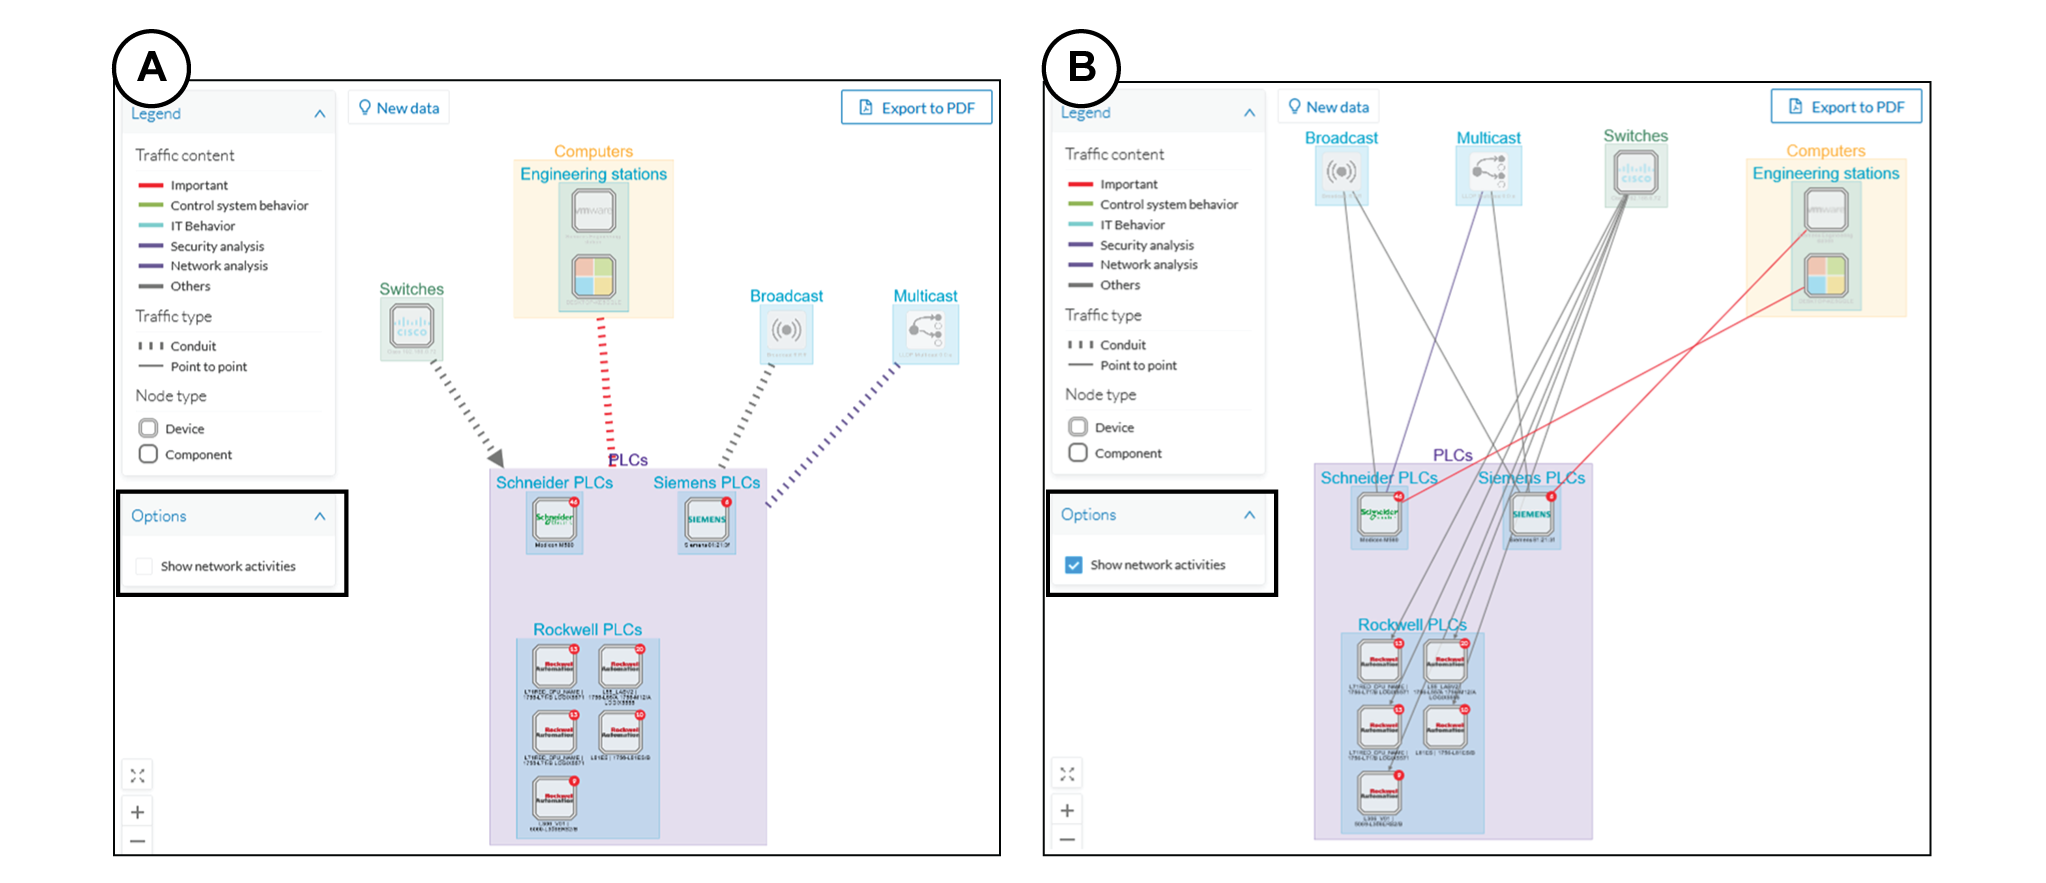
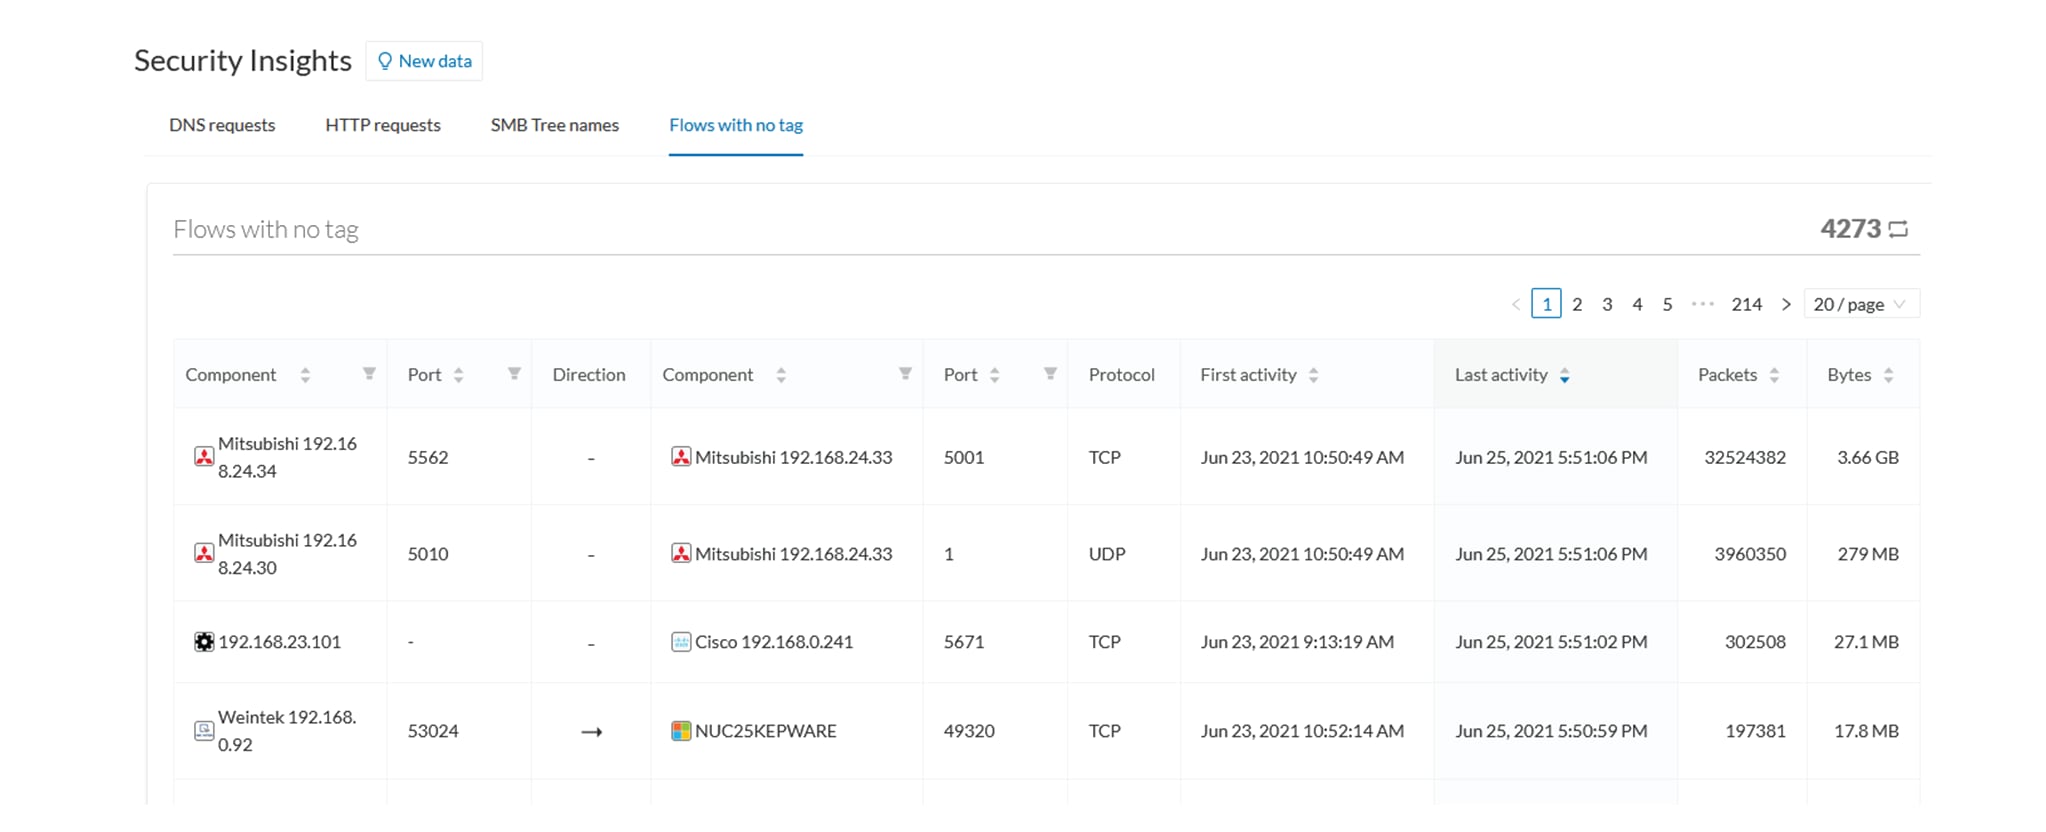
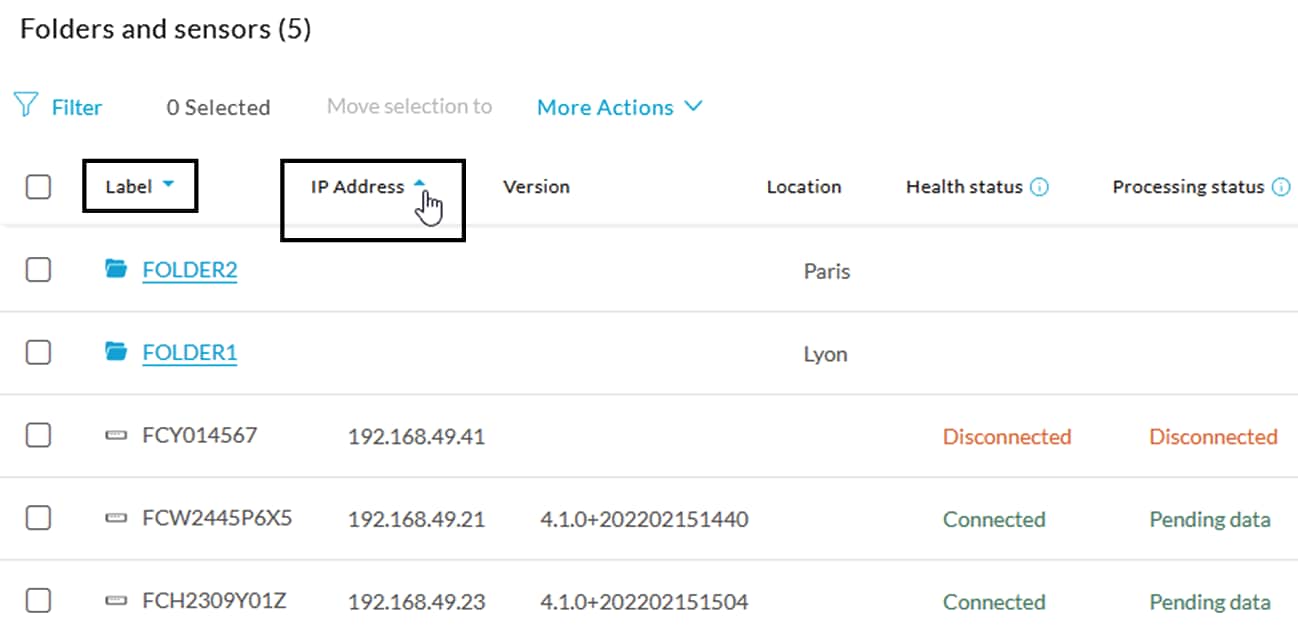
What we need to do then, is to organize the components into groups, per function:
-
PLCs in Line 2
-
IT
-
Broadcast
-
Multicast
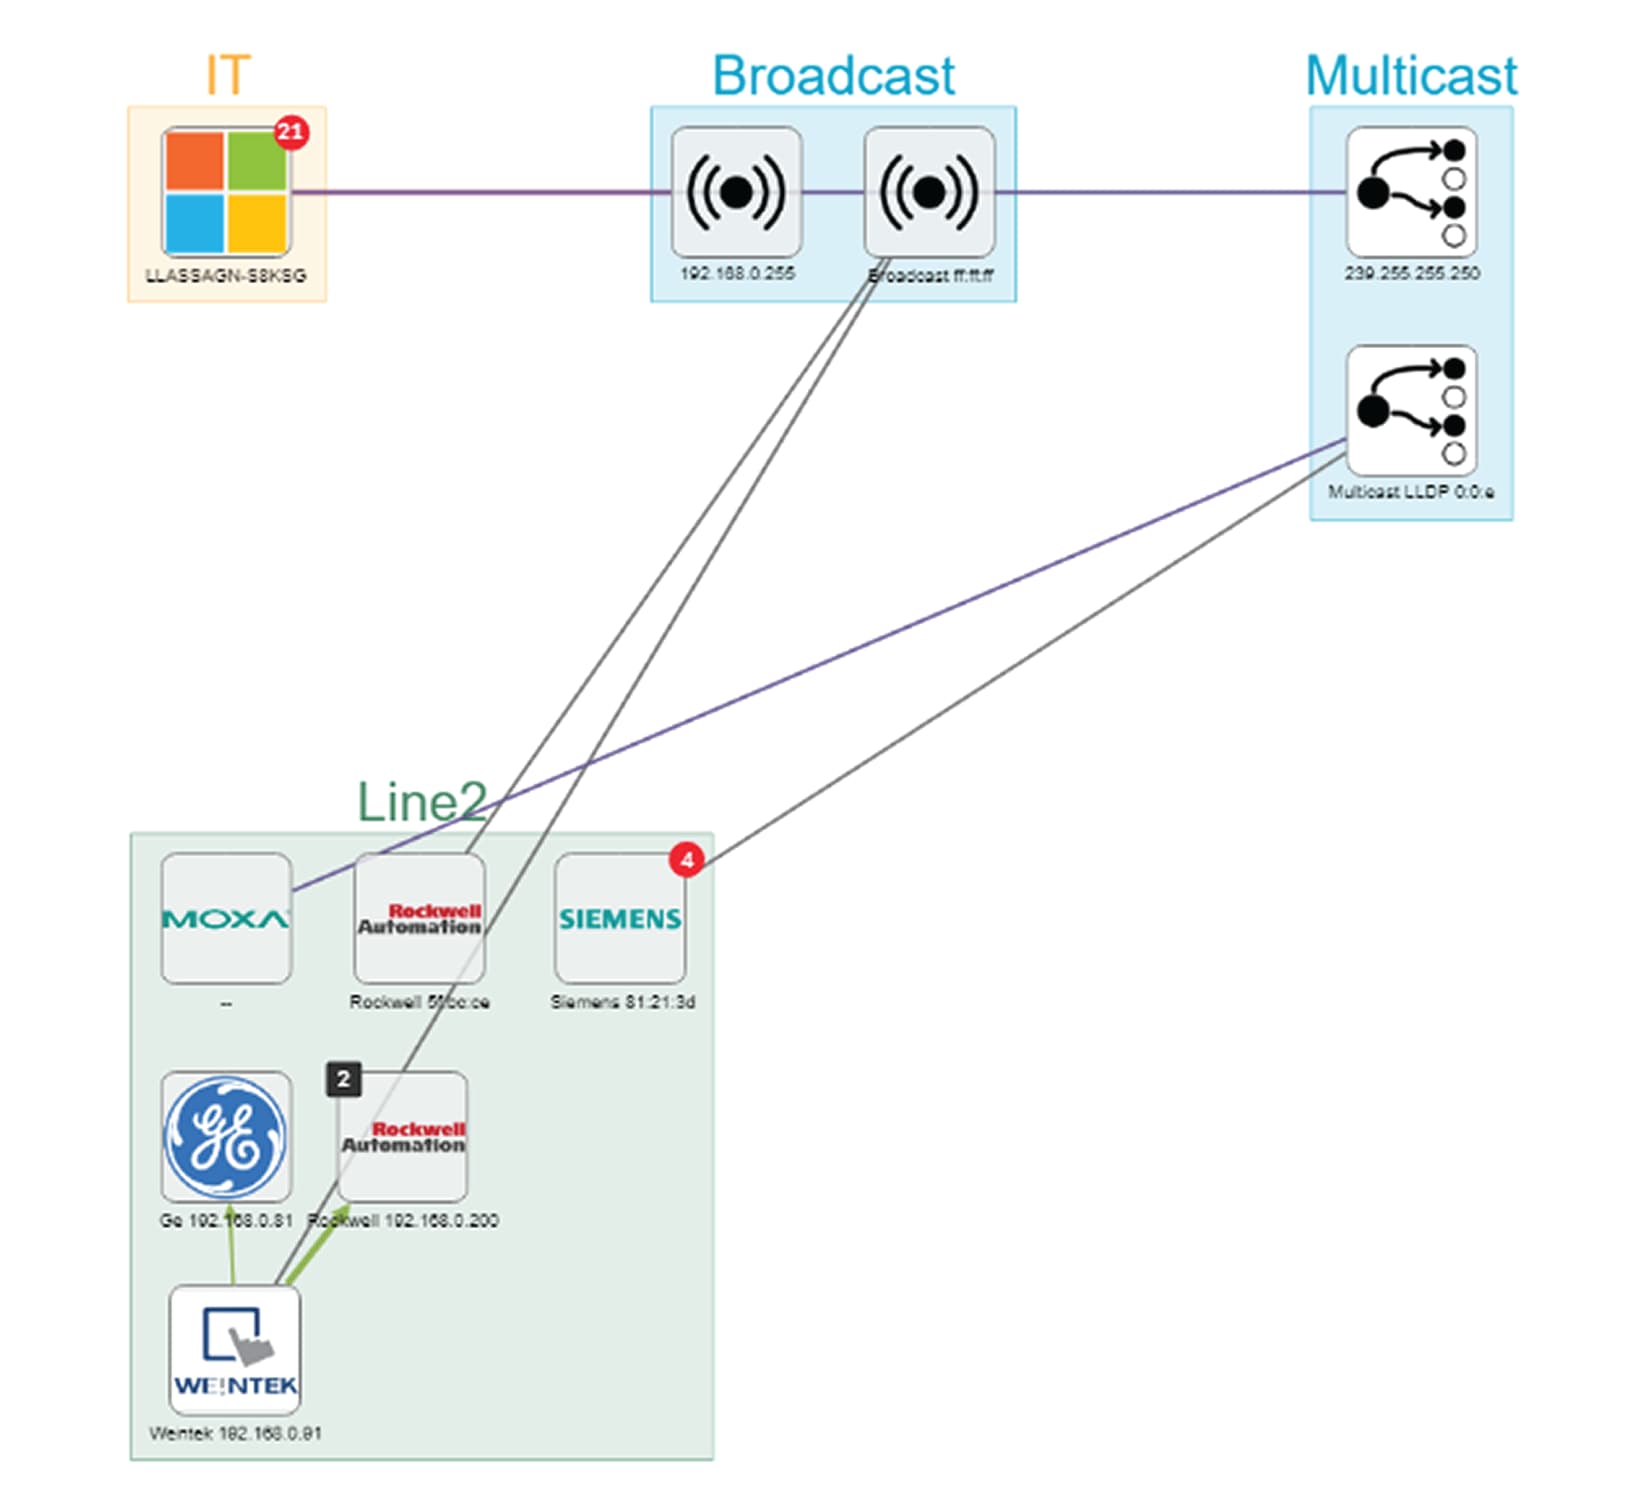
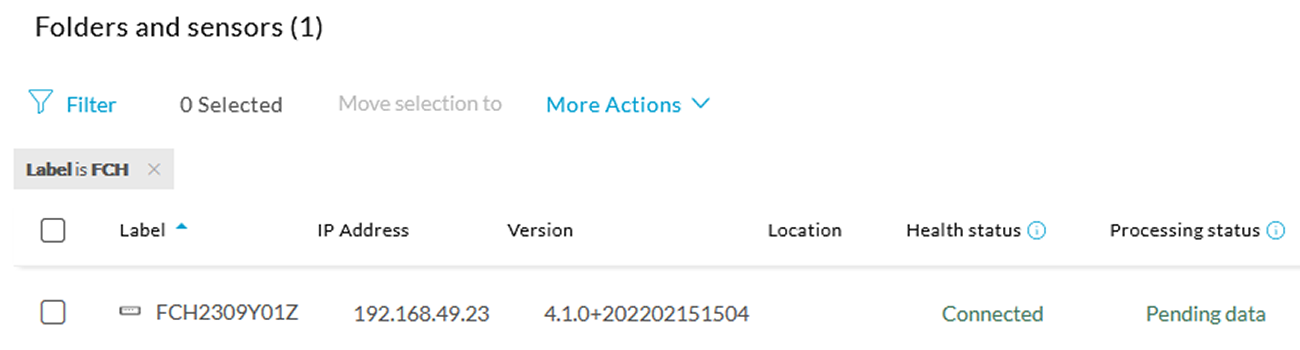
As a result, we have a filtered and organized view of production chain 2.
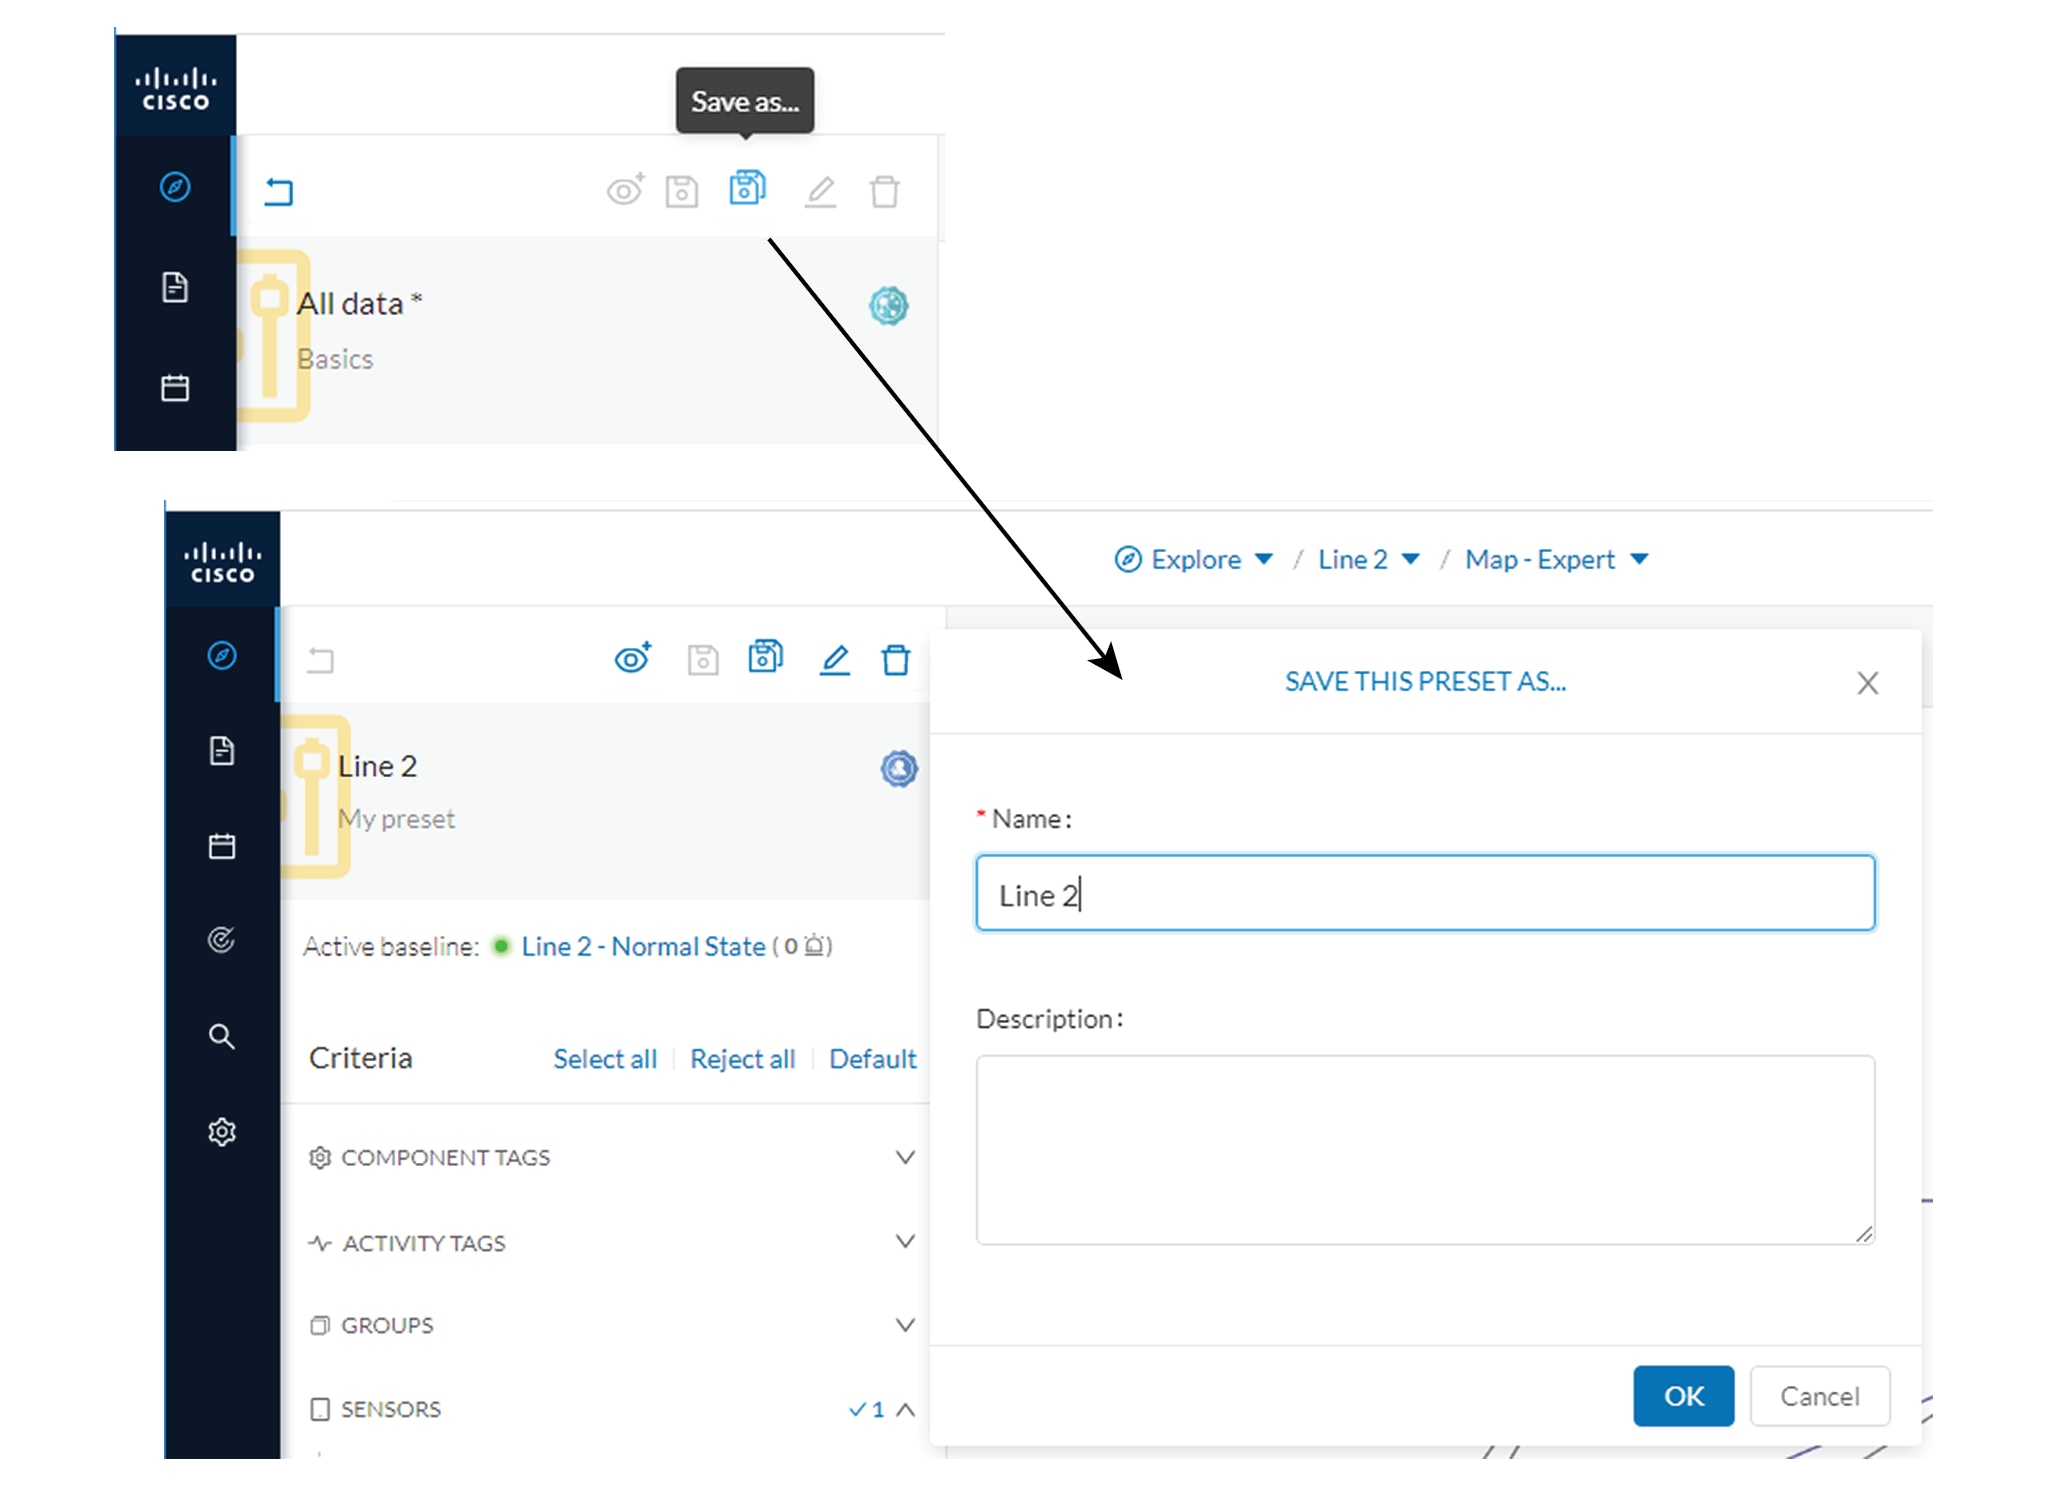
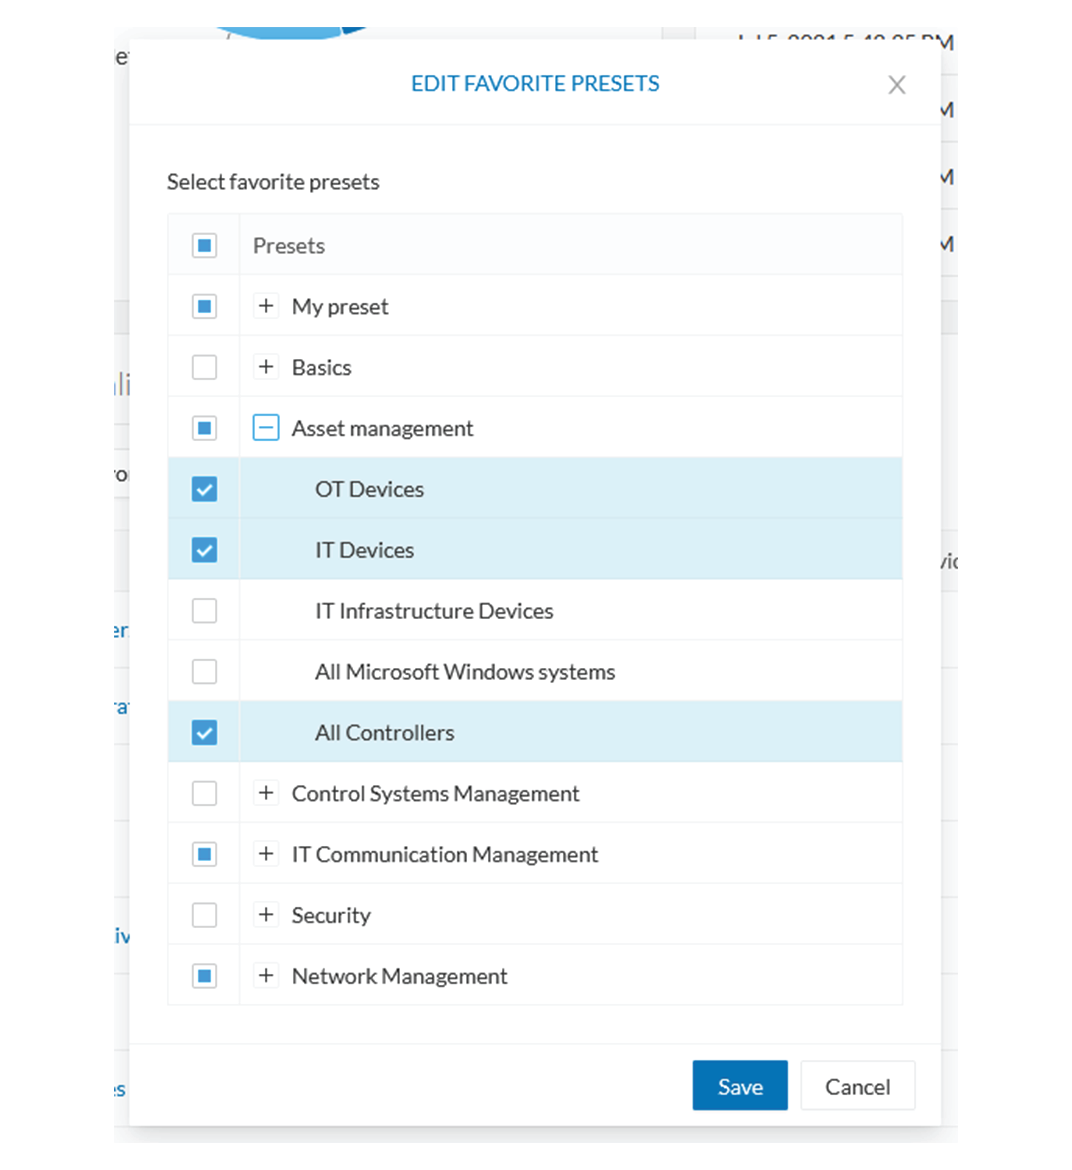
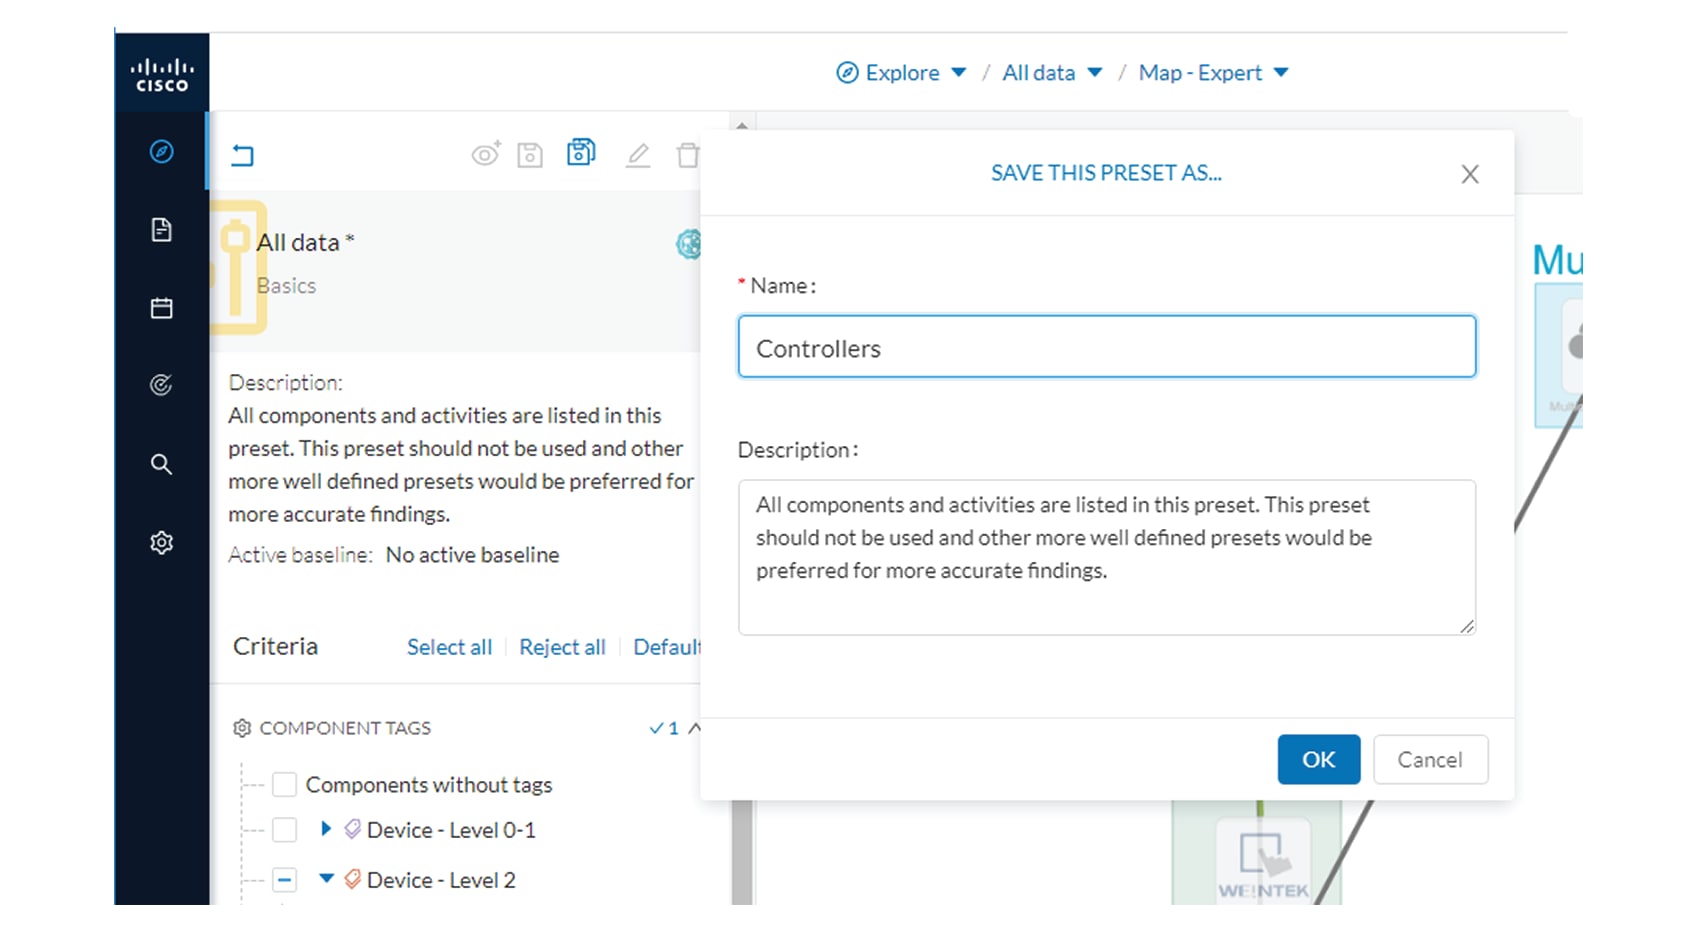
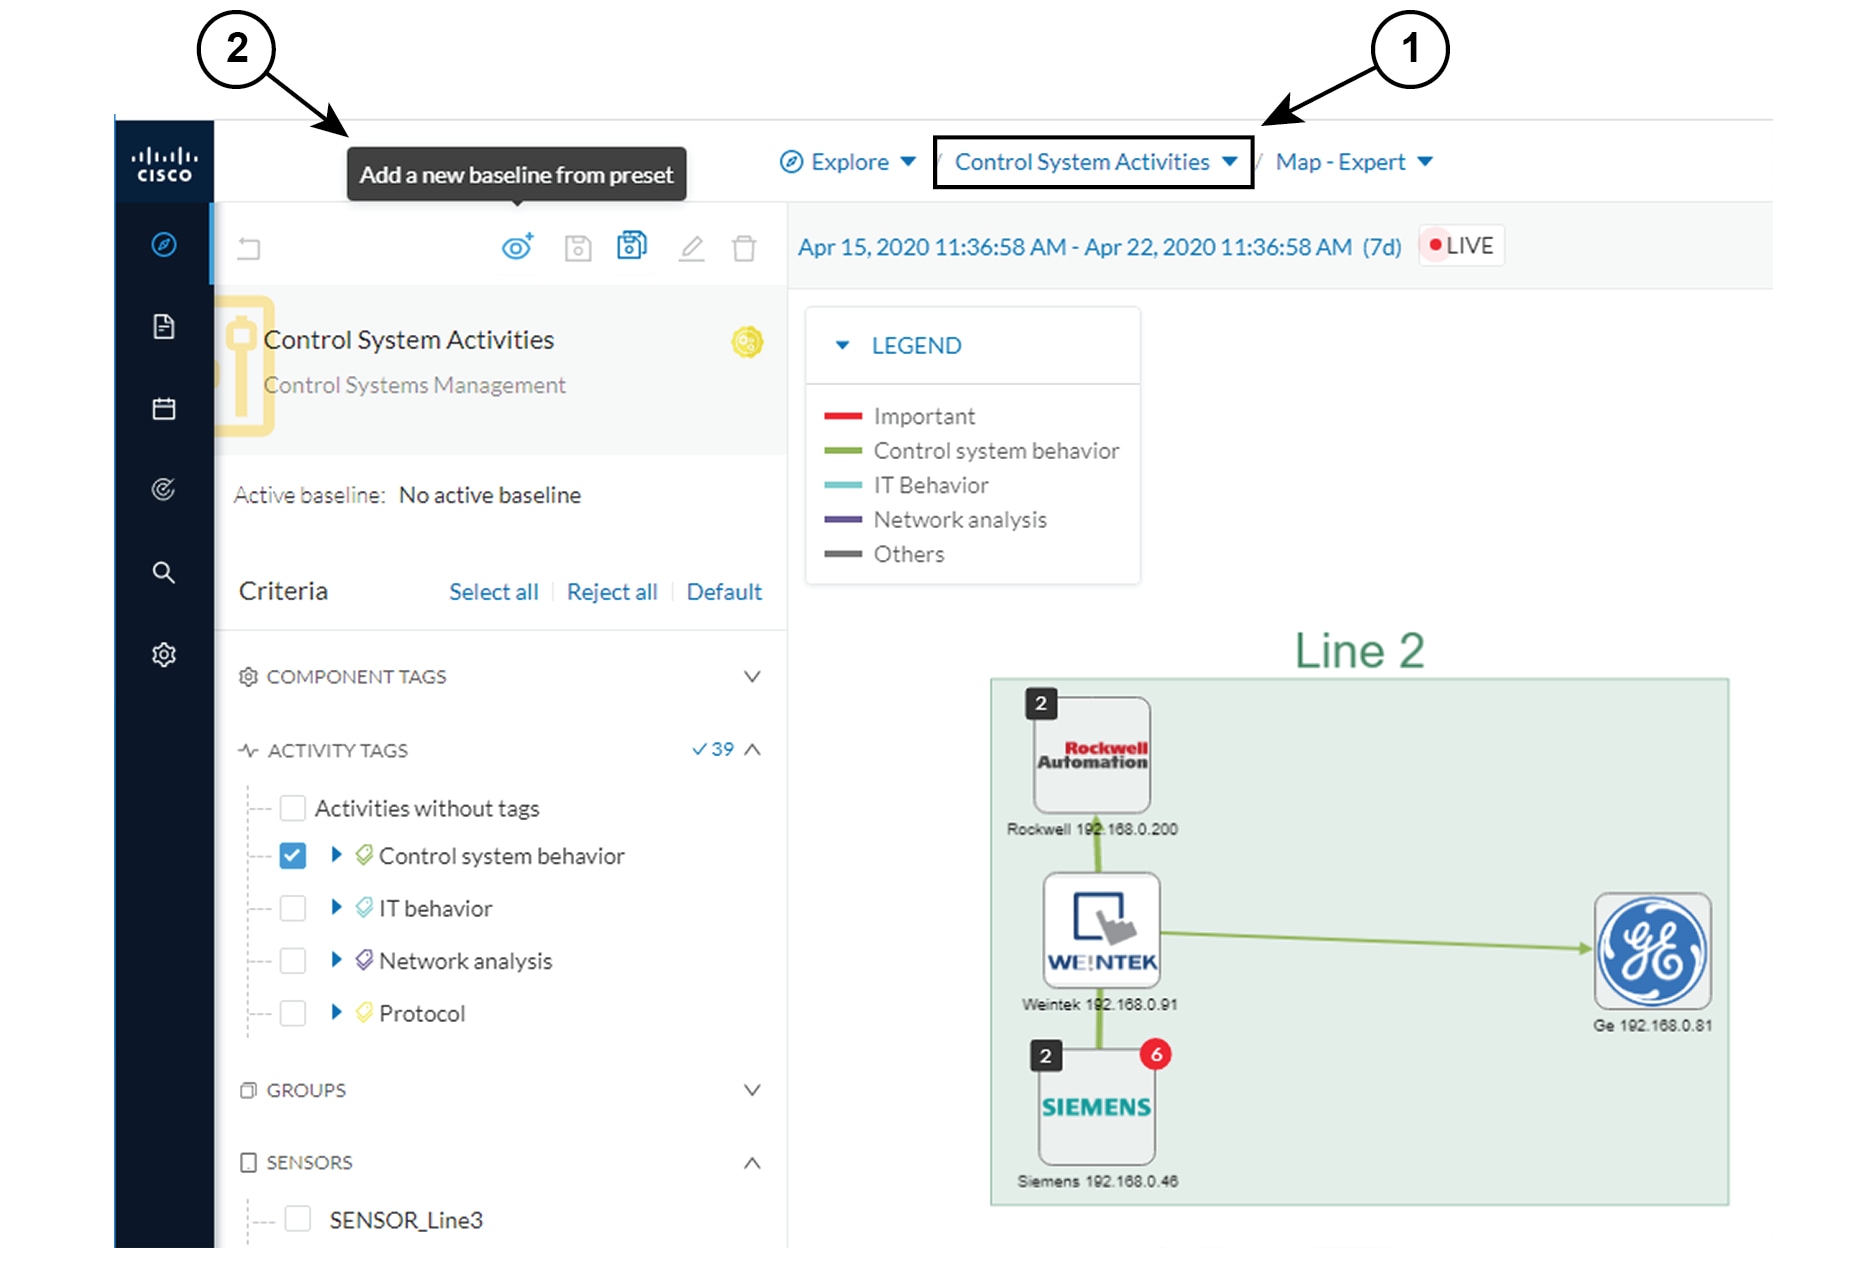
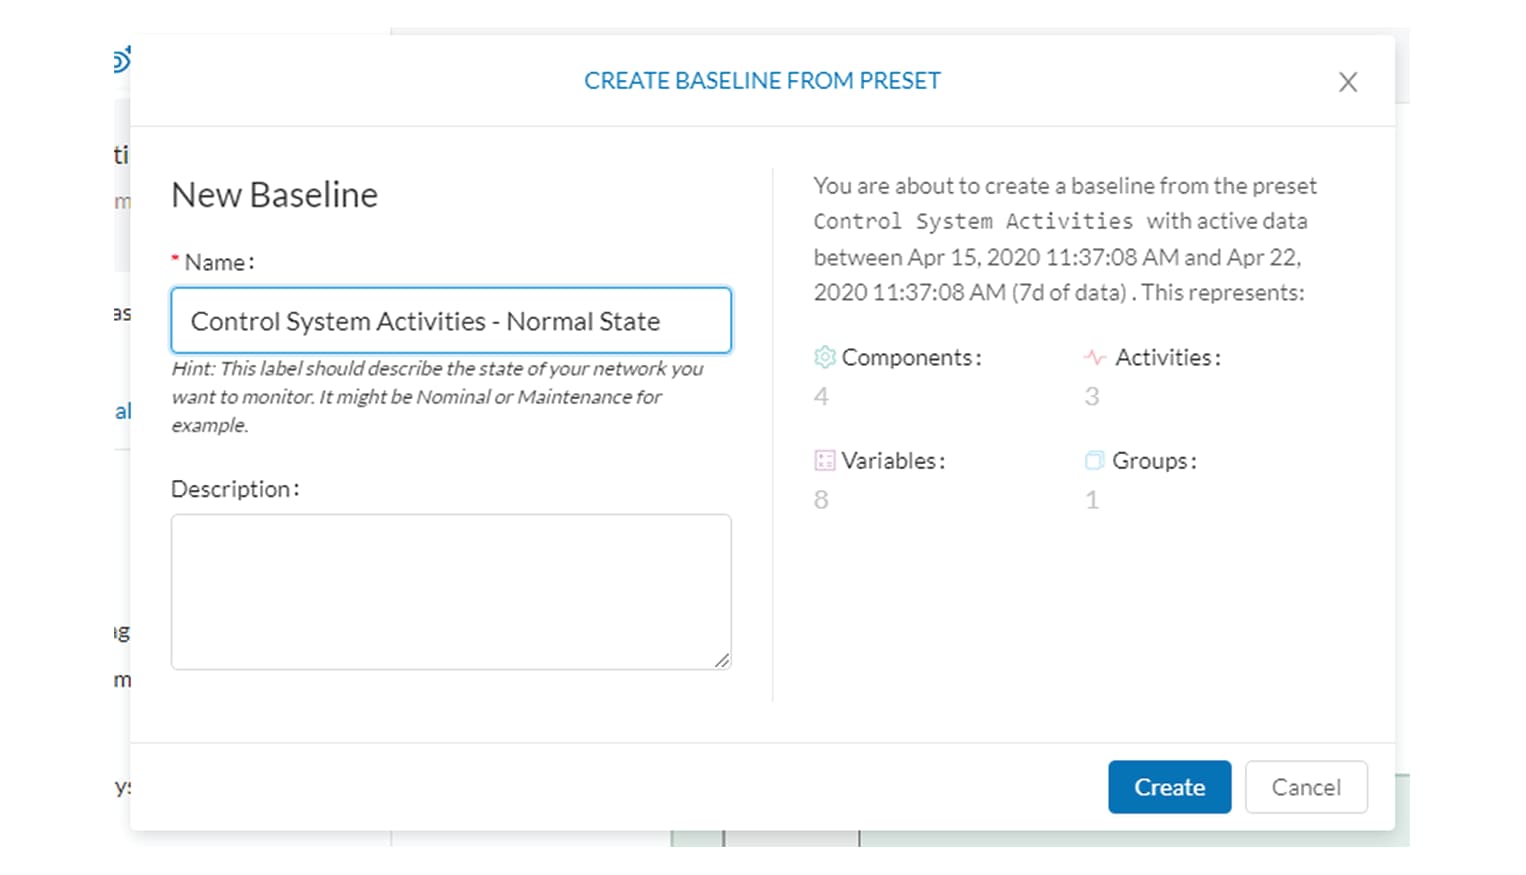
Now that the network data is filtered and grouped, we save the selection as a new preset that we name Line 2.
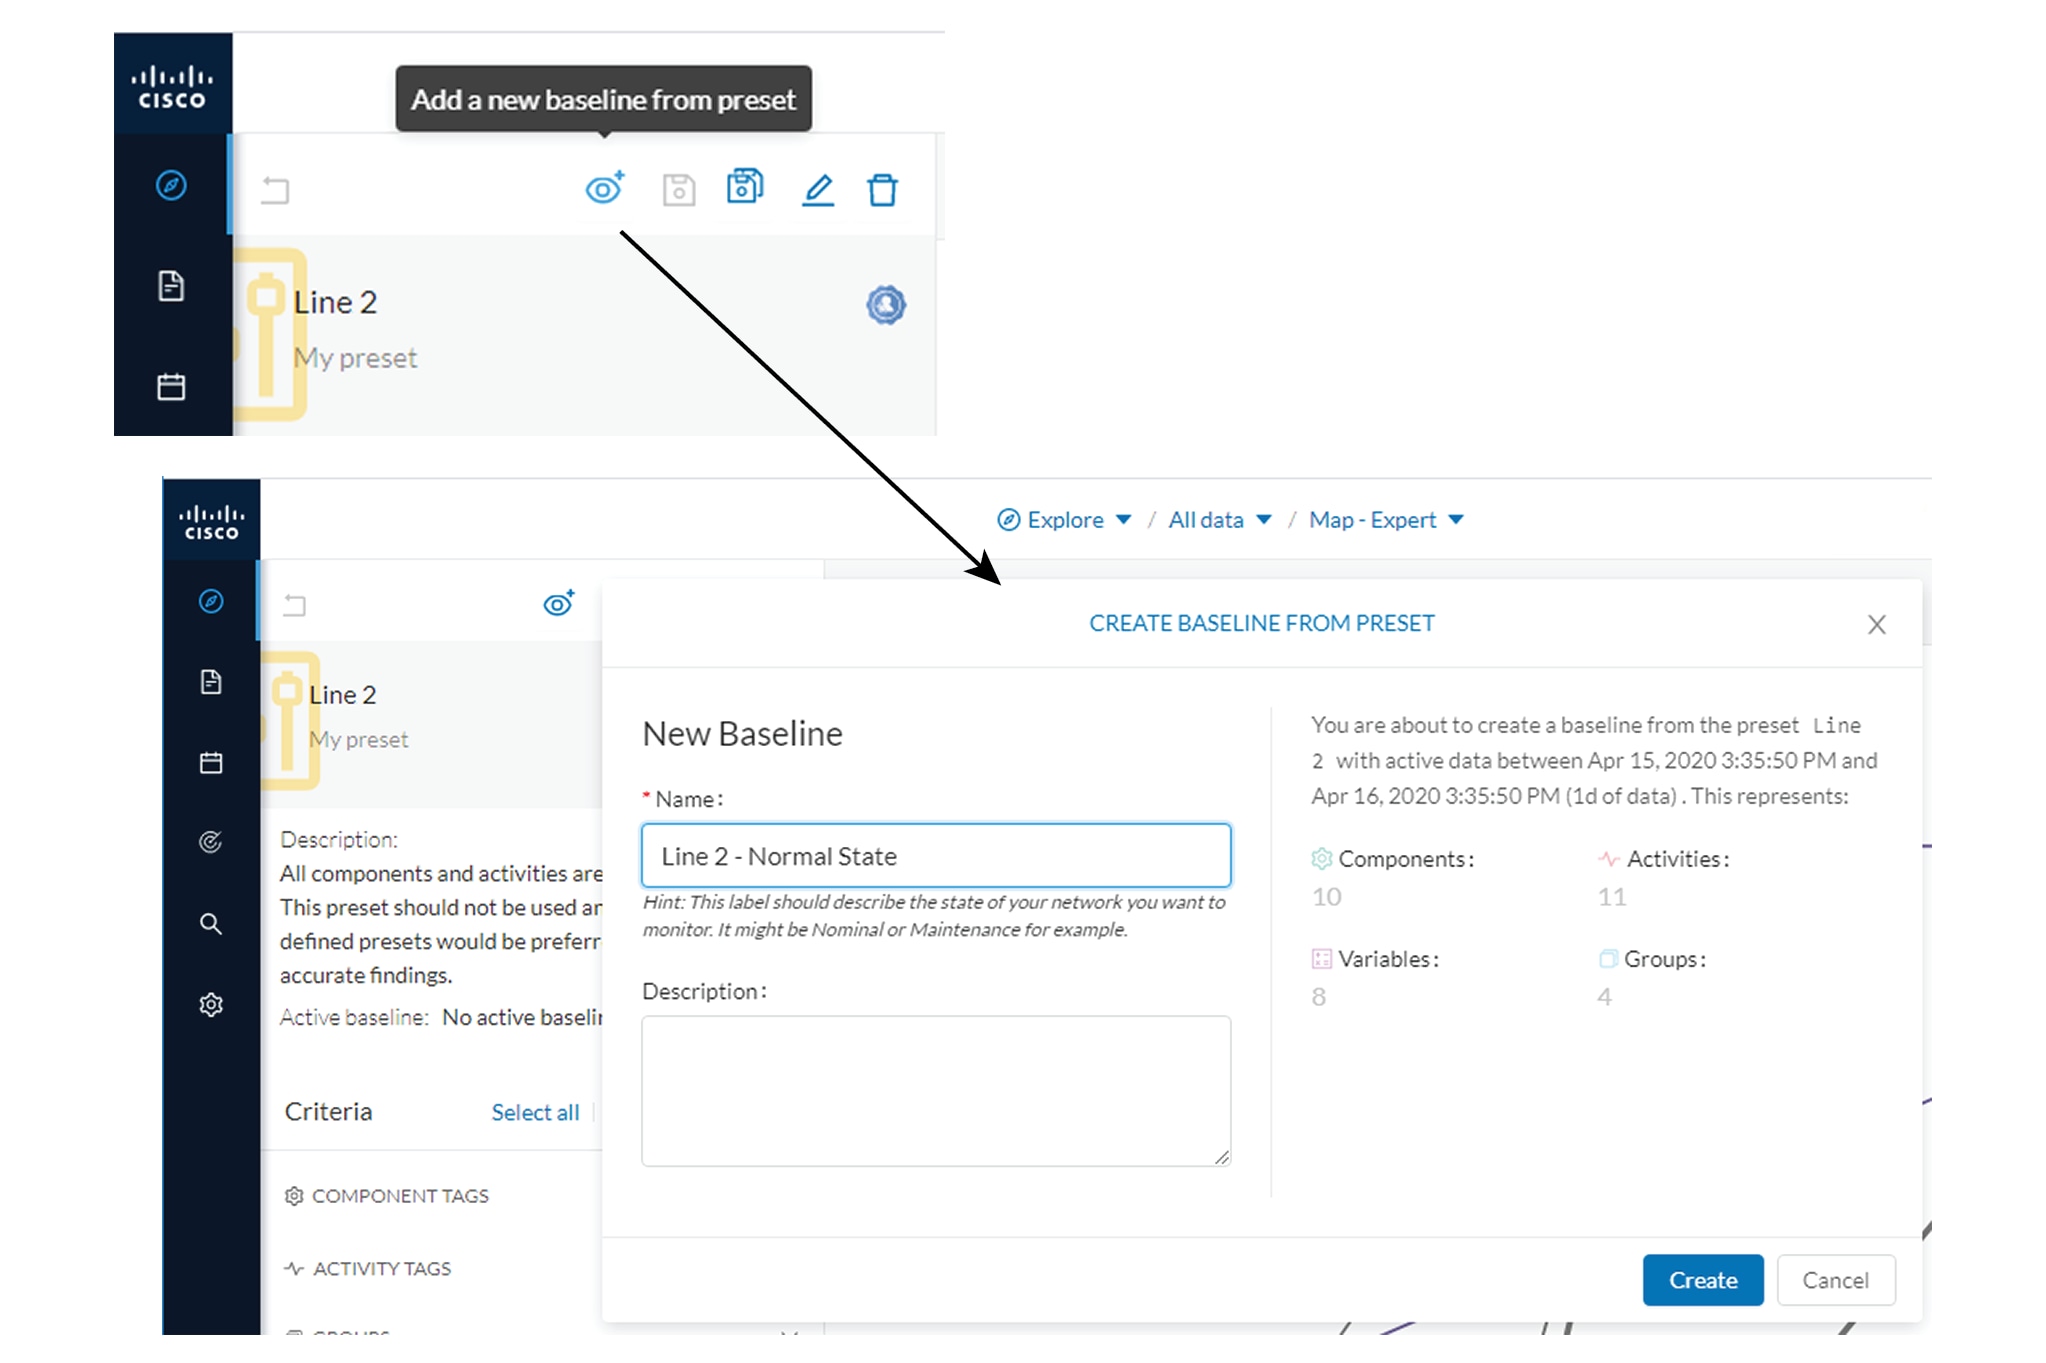
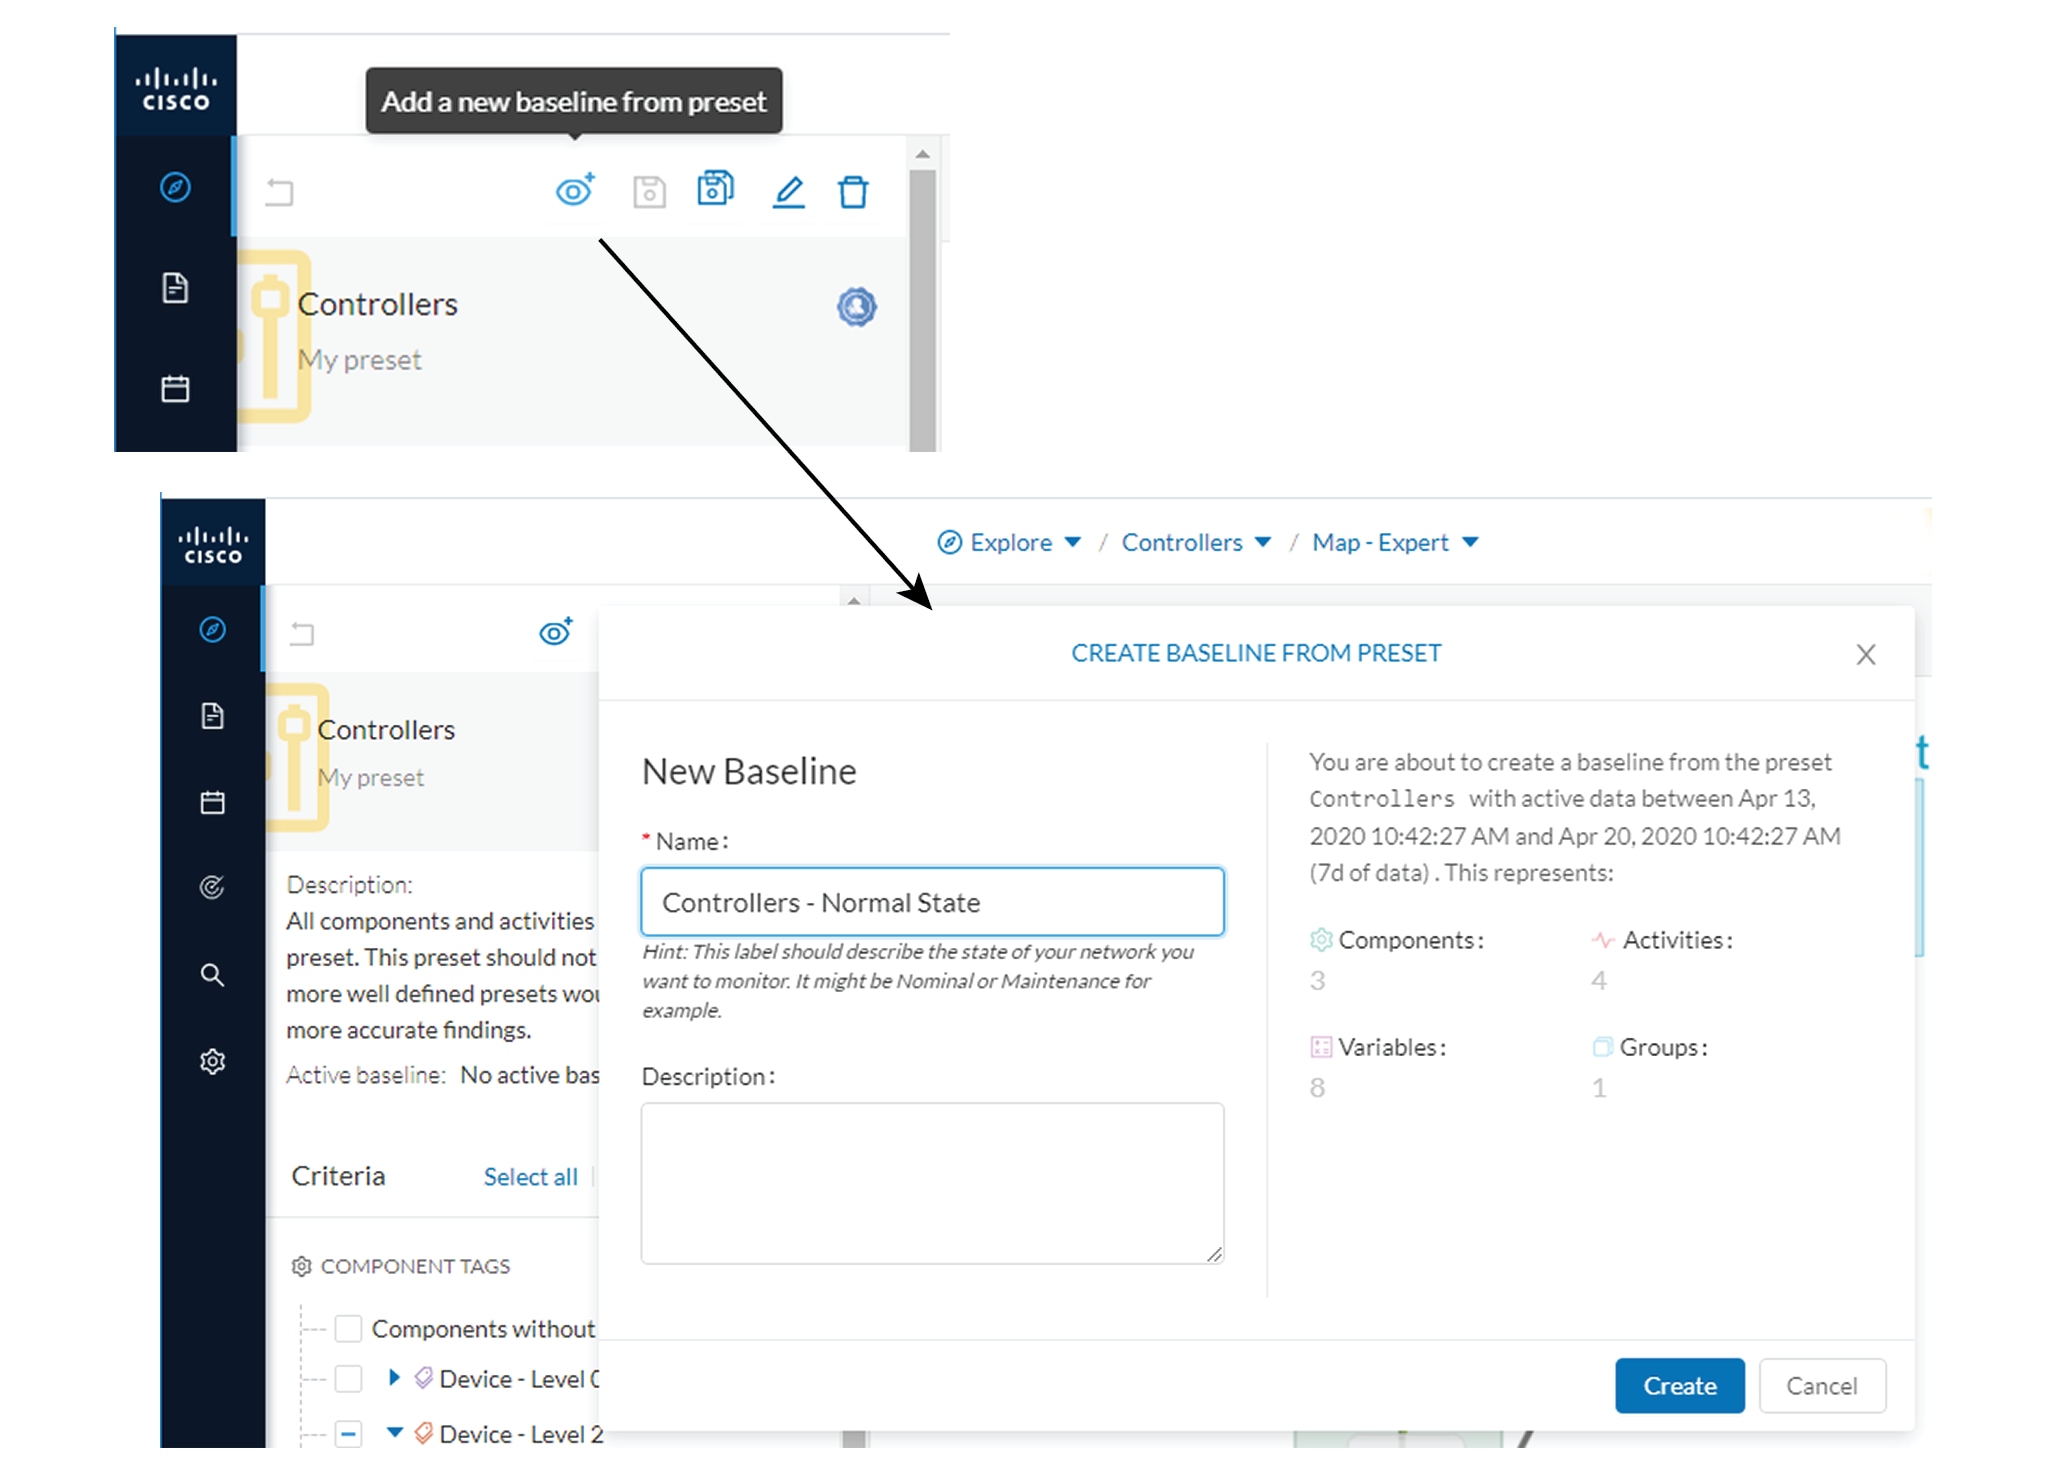
The preset Line 2 contains components and activities we consider to be interacting in a normal way, that is, production line
2 is in normal operating state. We save the preset's normal state as a baseline that we name Line 2 - Normal State.
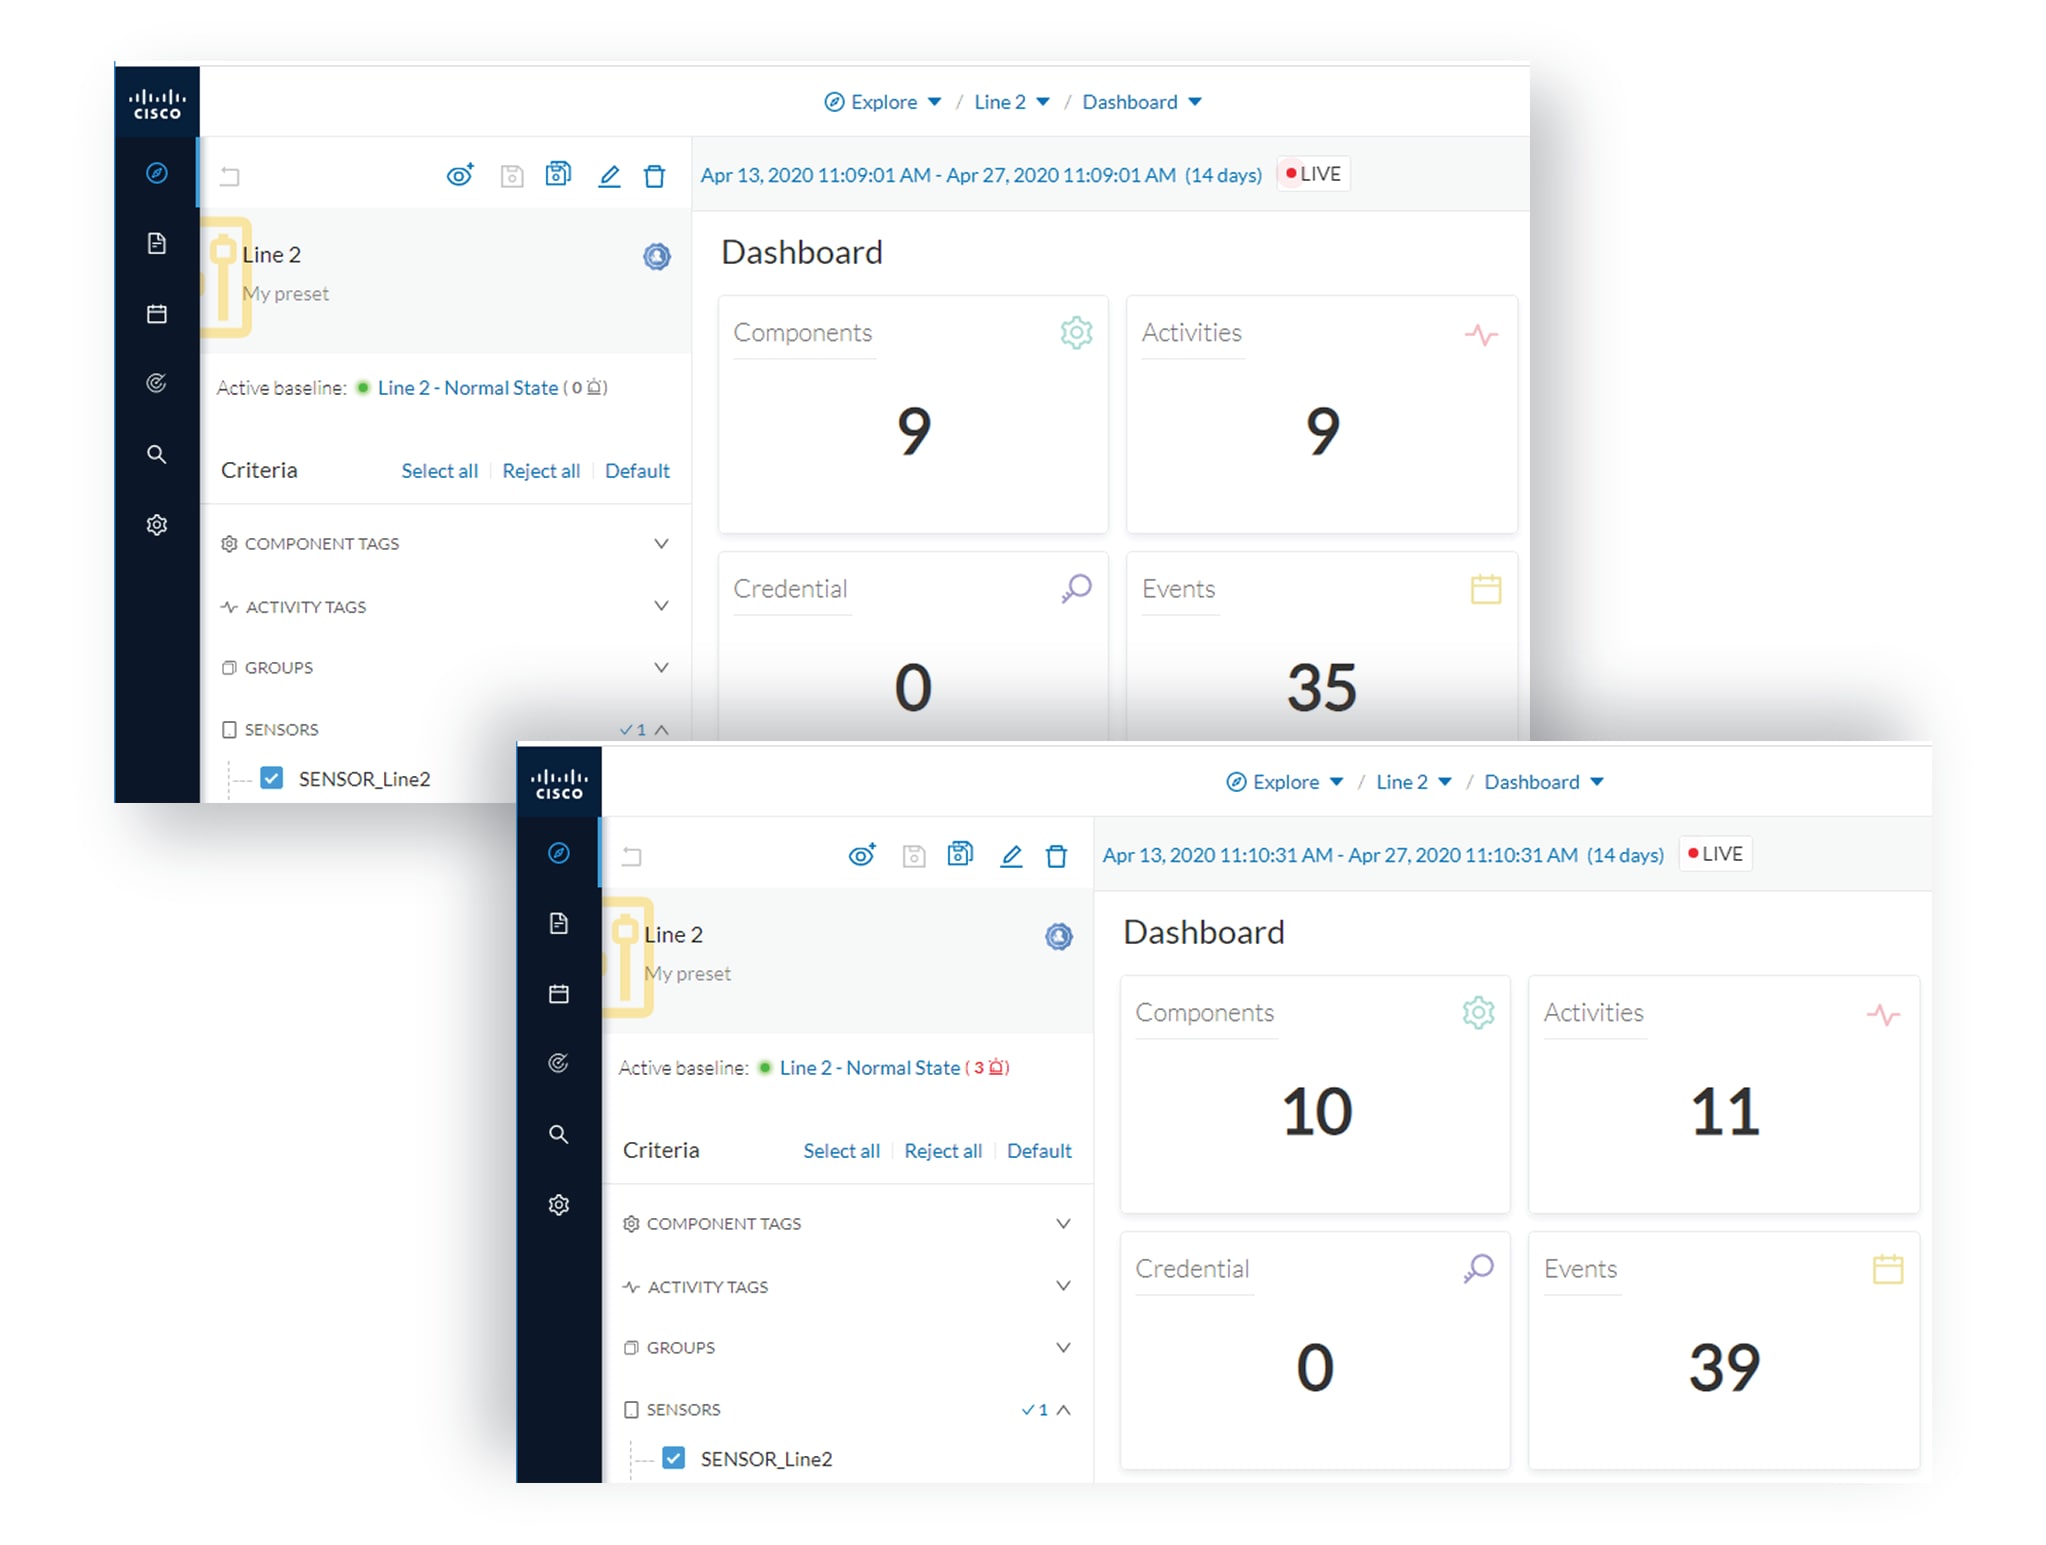
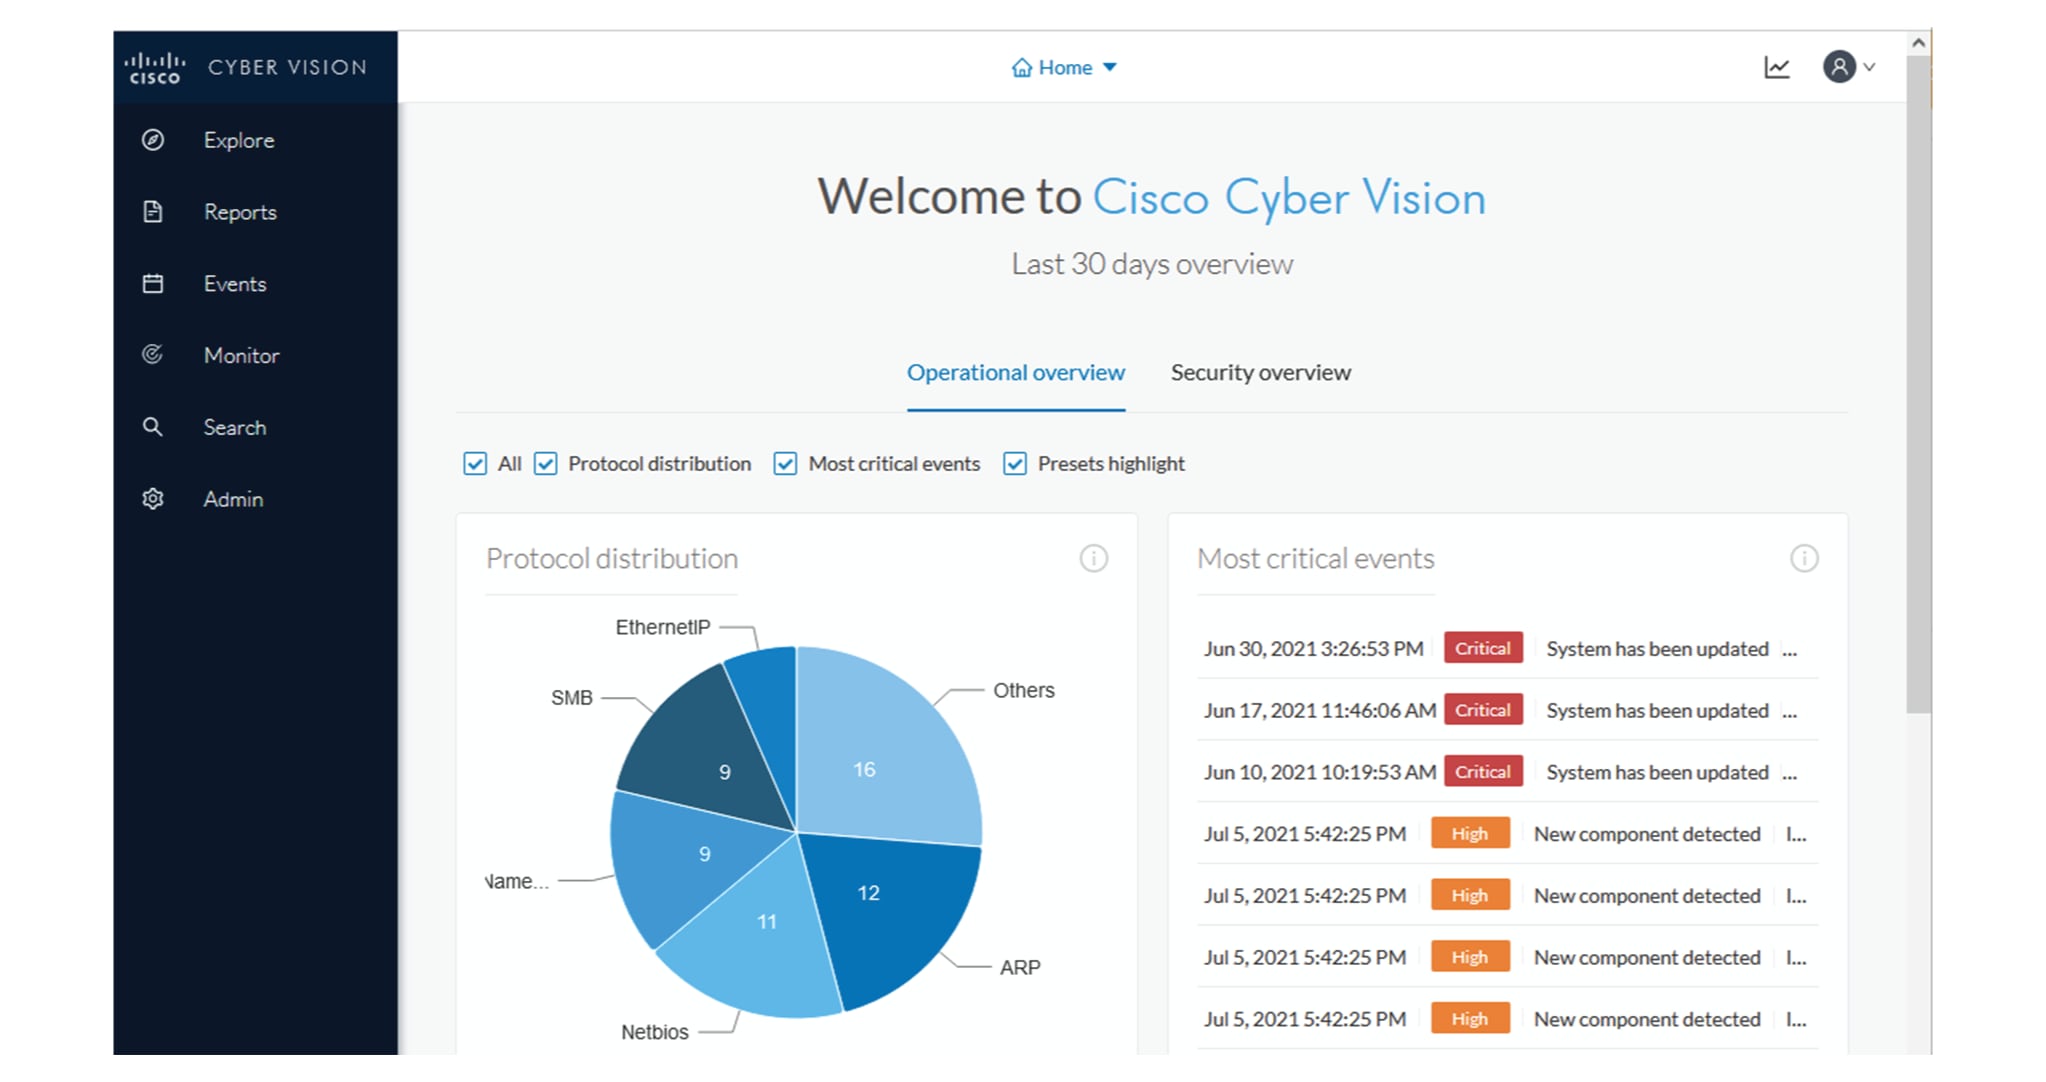
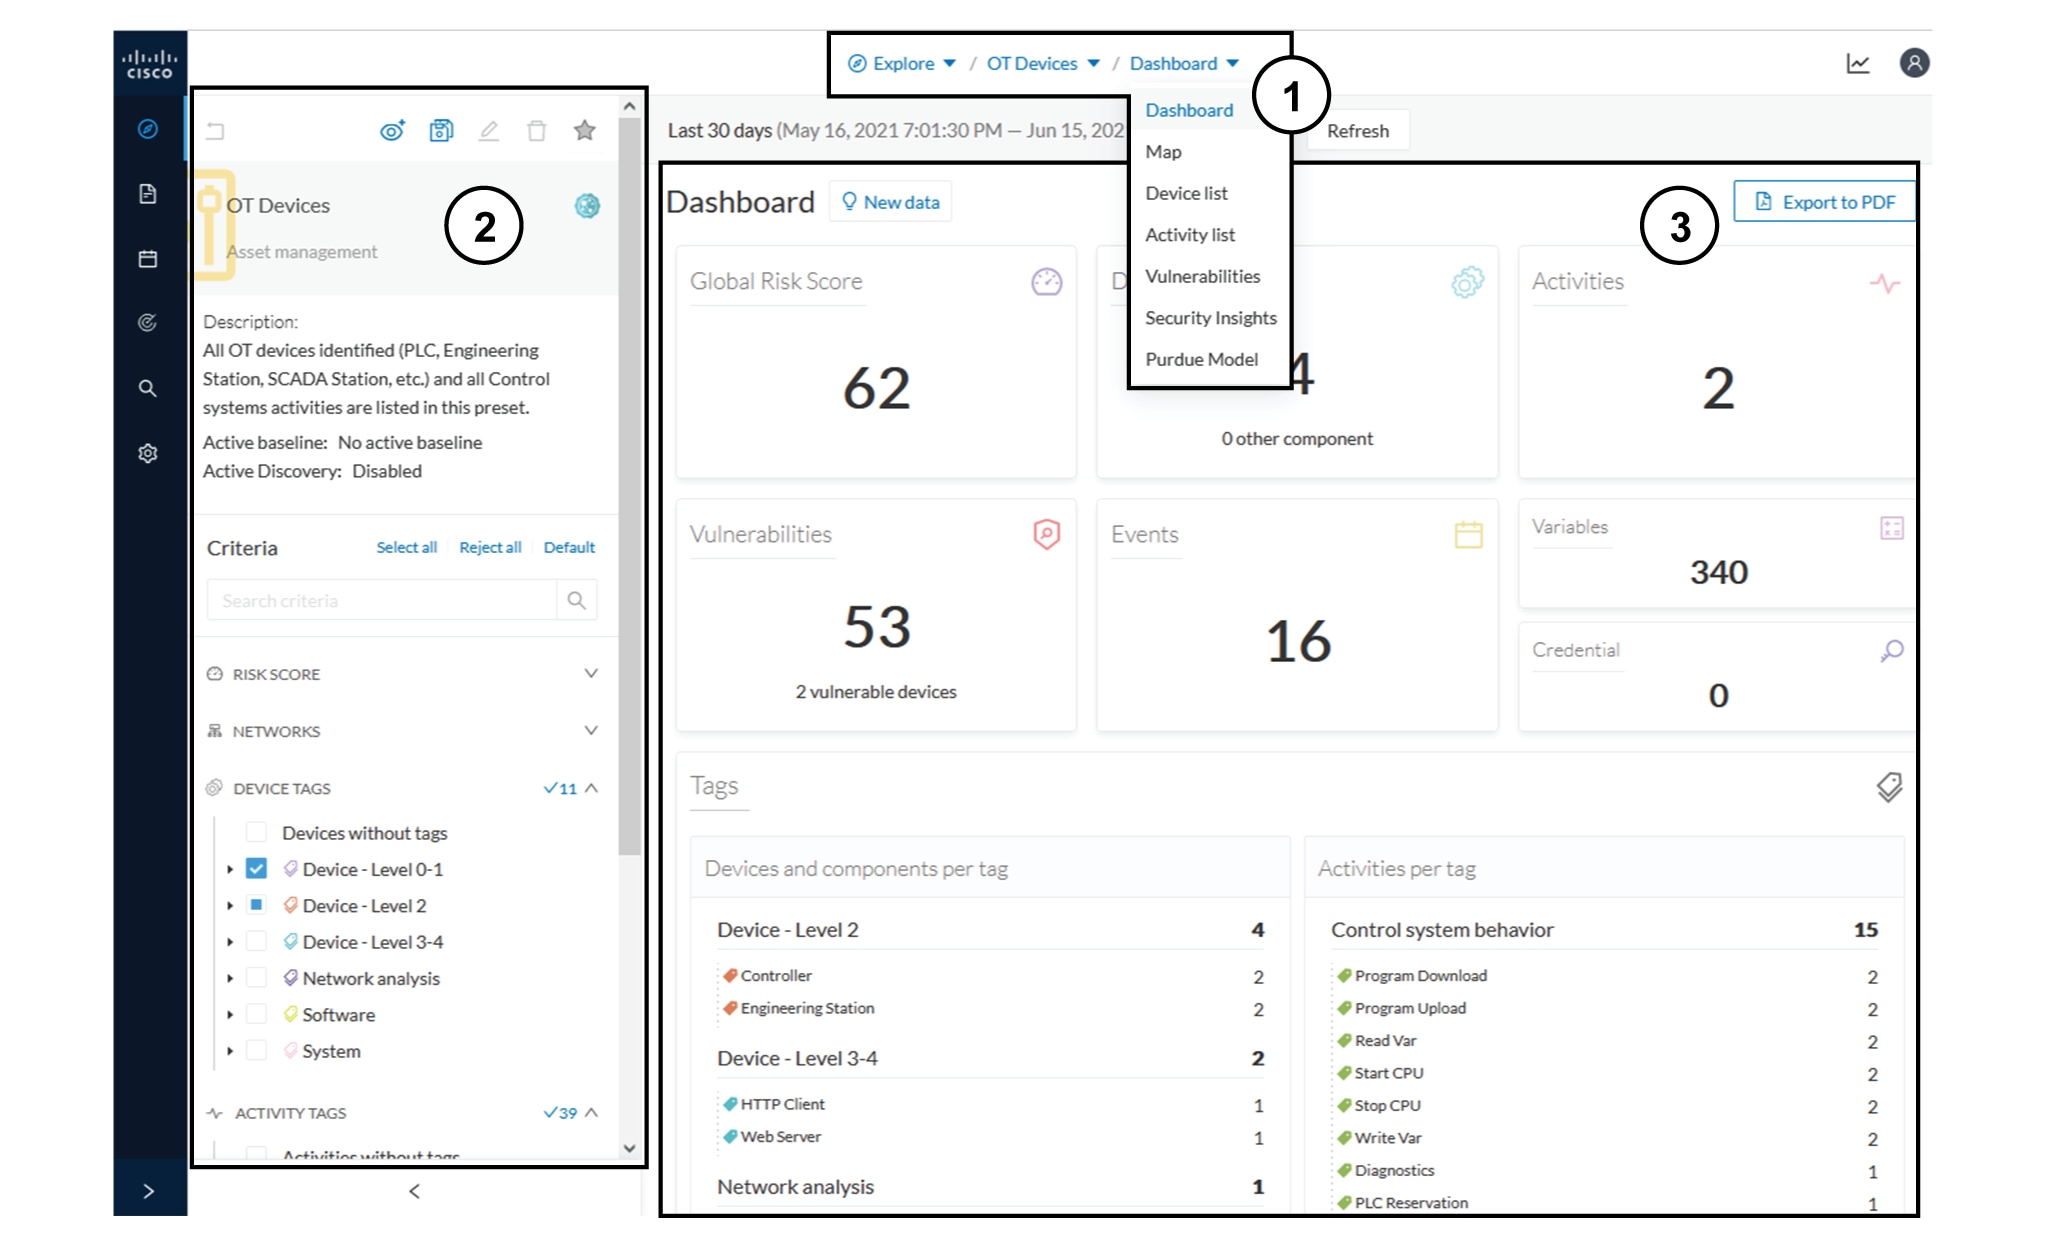
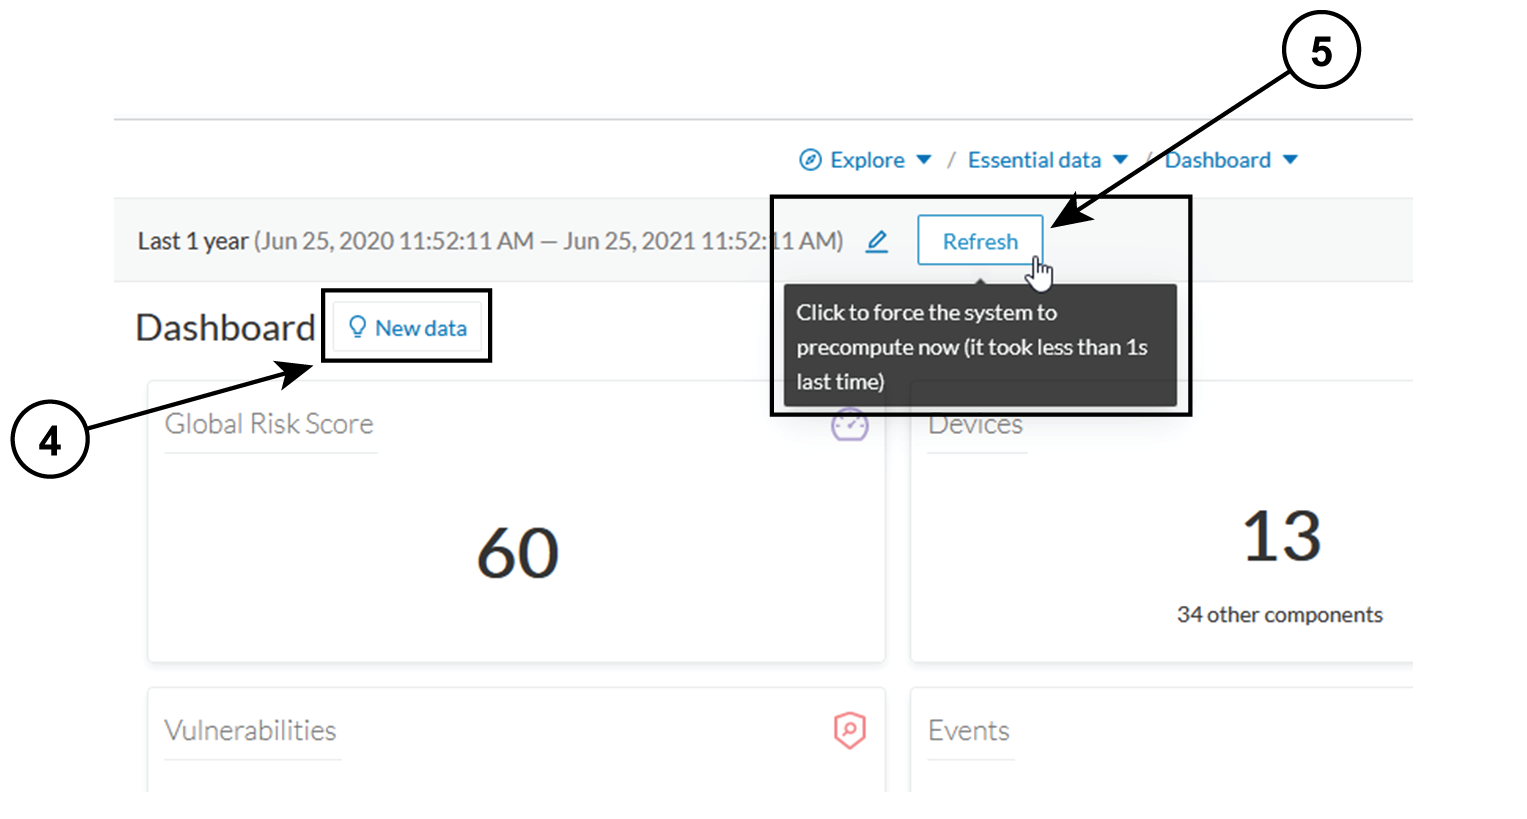
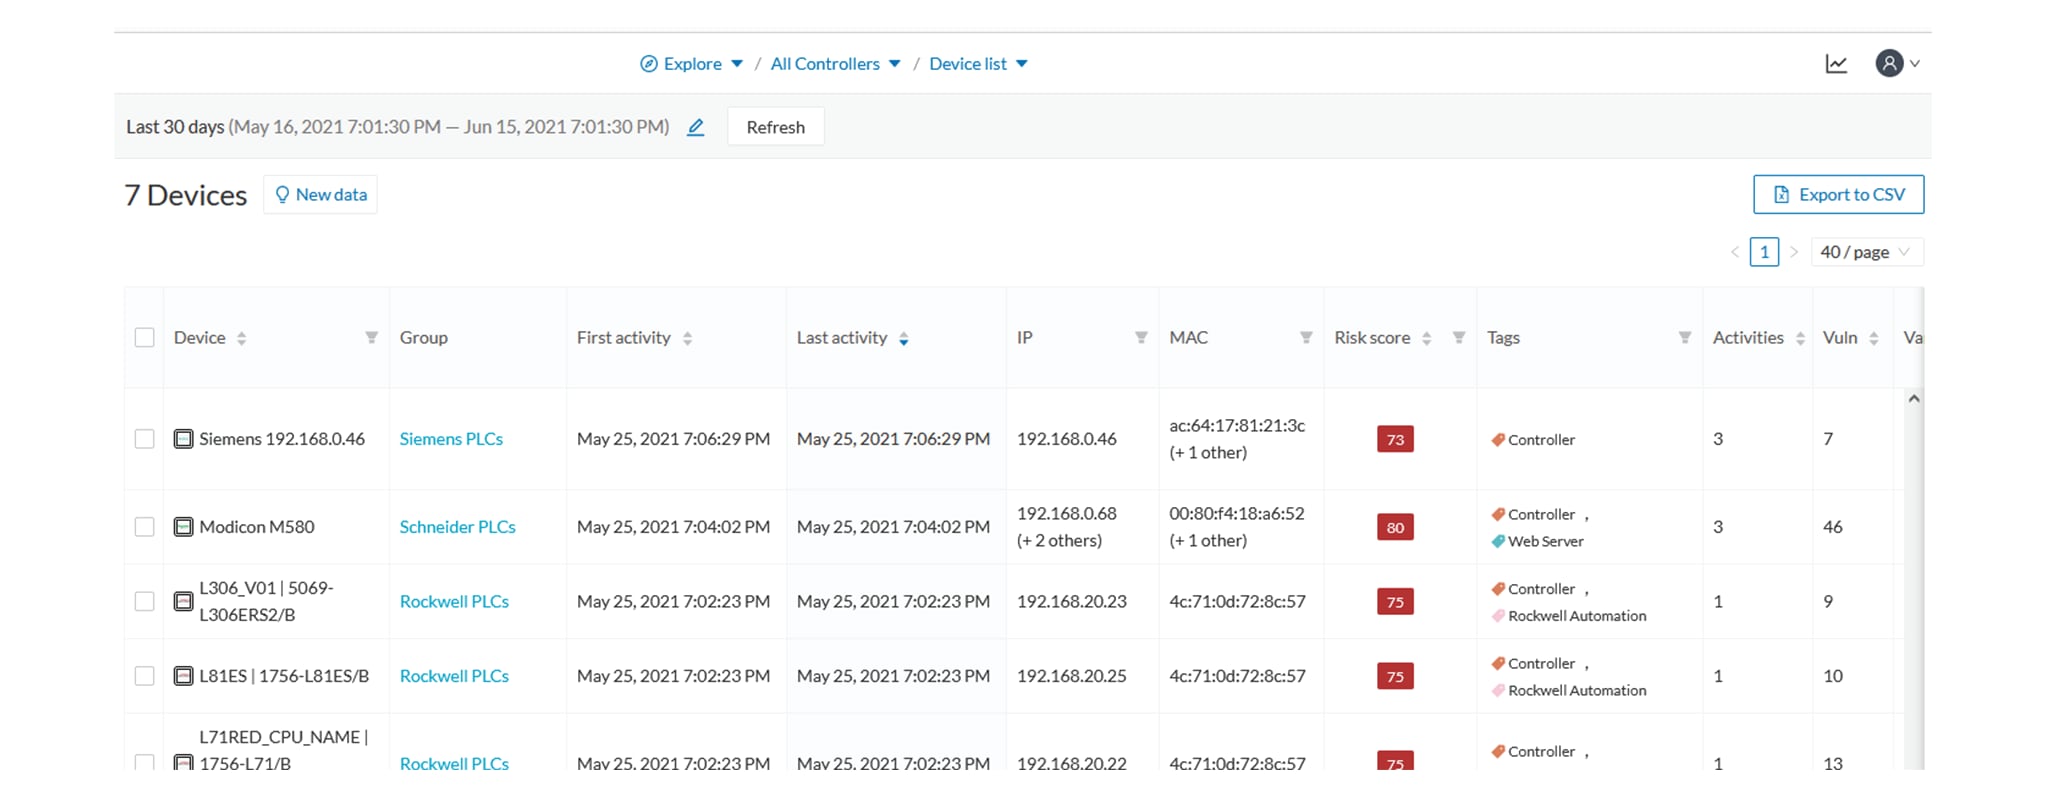
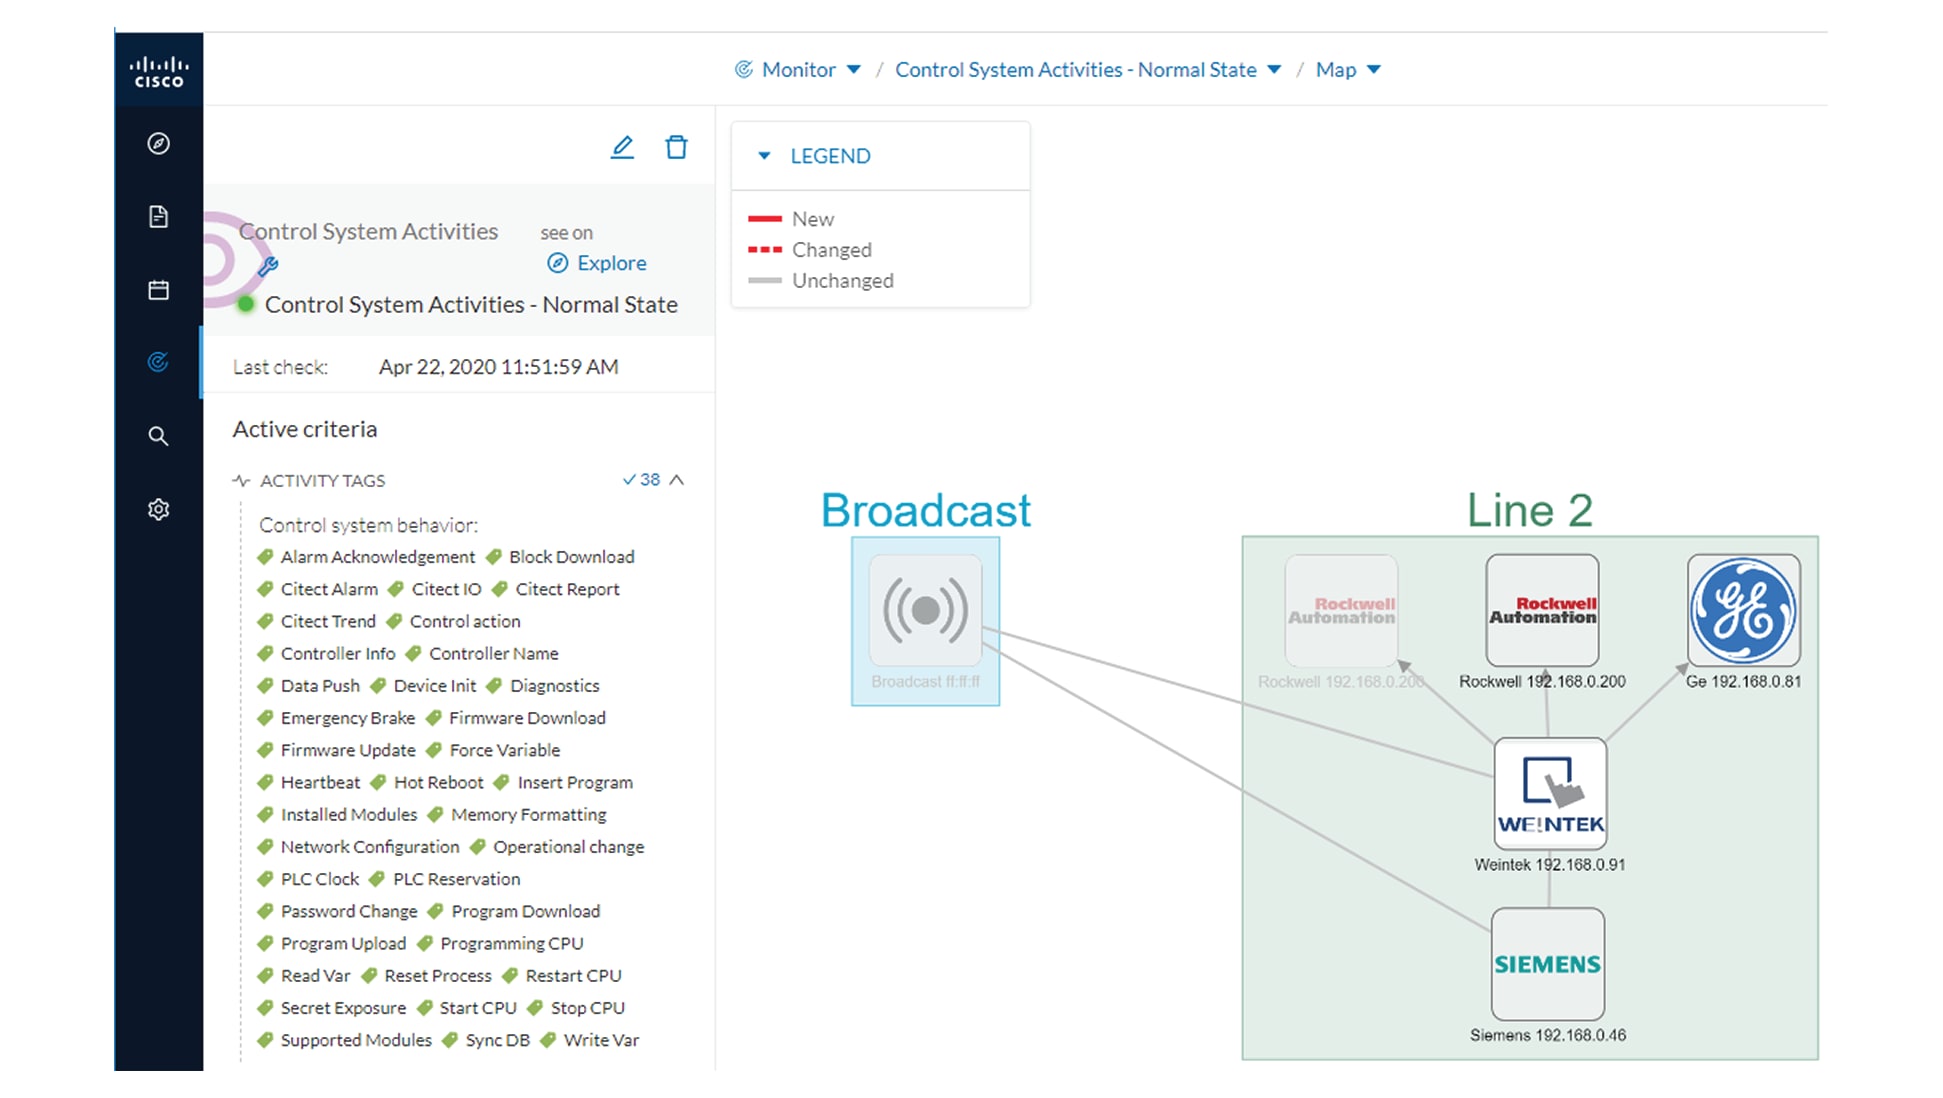
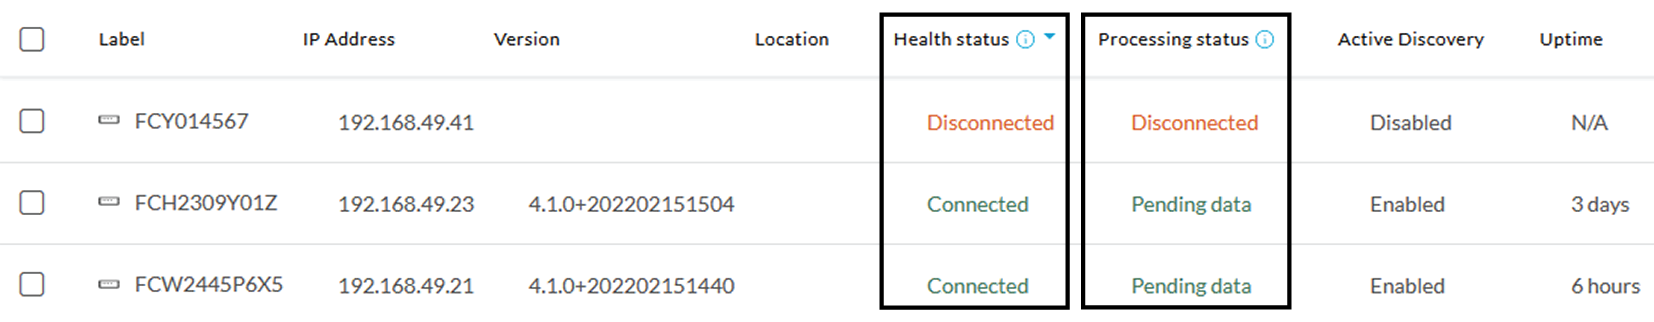
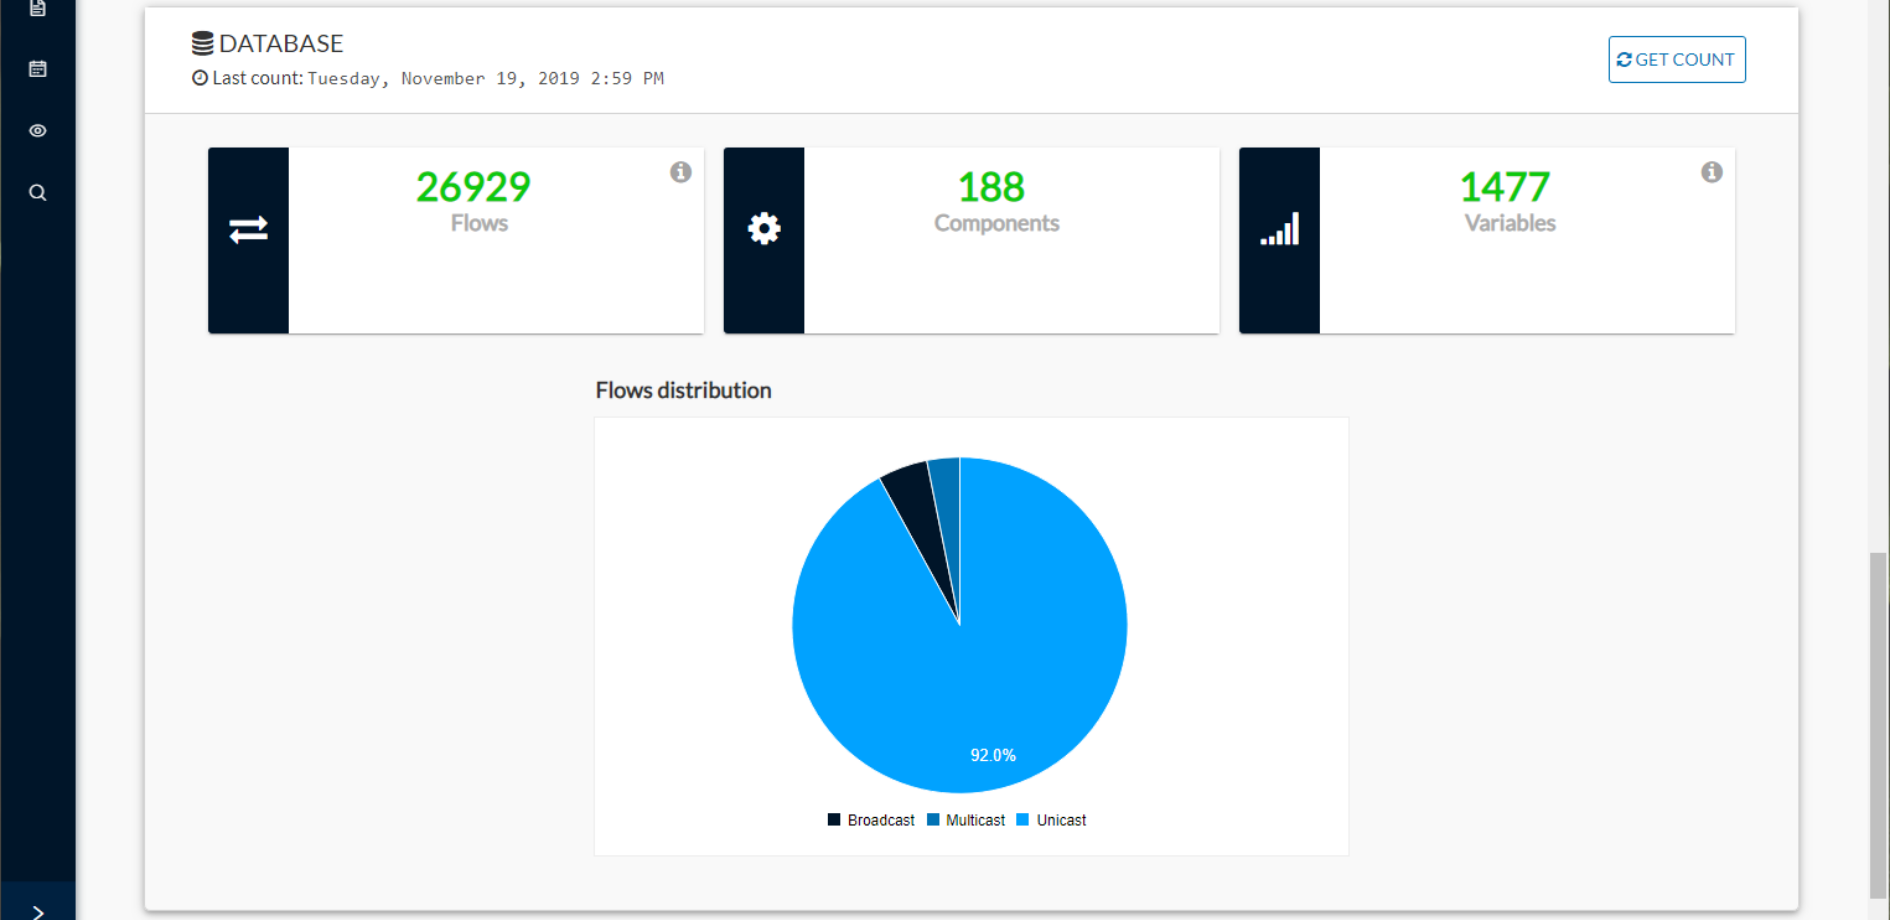
We come back later to check Production Line 2. As we access the Explore mode we notice that there are 10 components instead
of 9. Number of activities and events have increased too. The baseline Line 2 - Normal State reports 3 alerts.
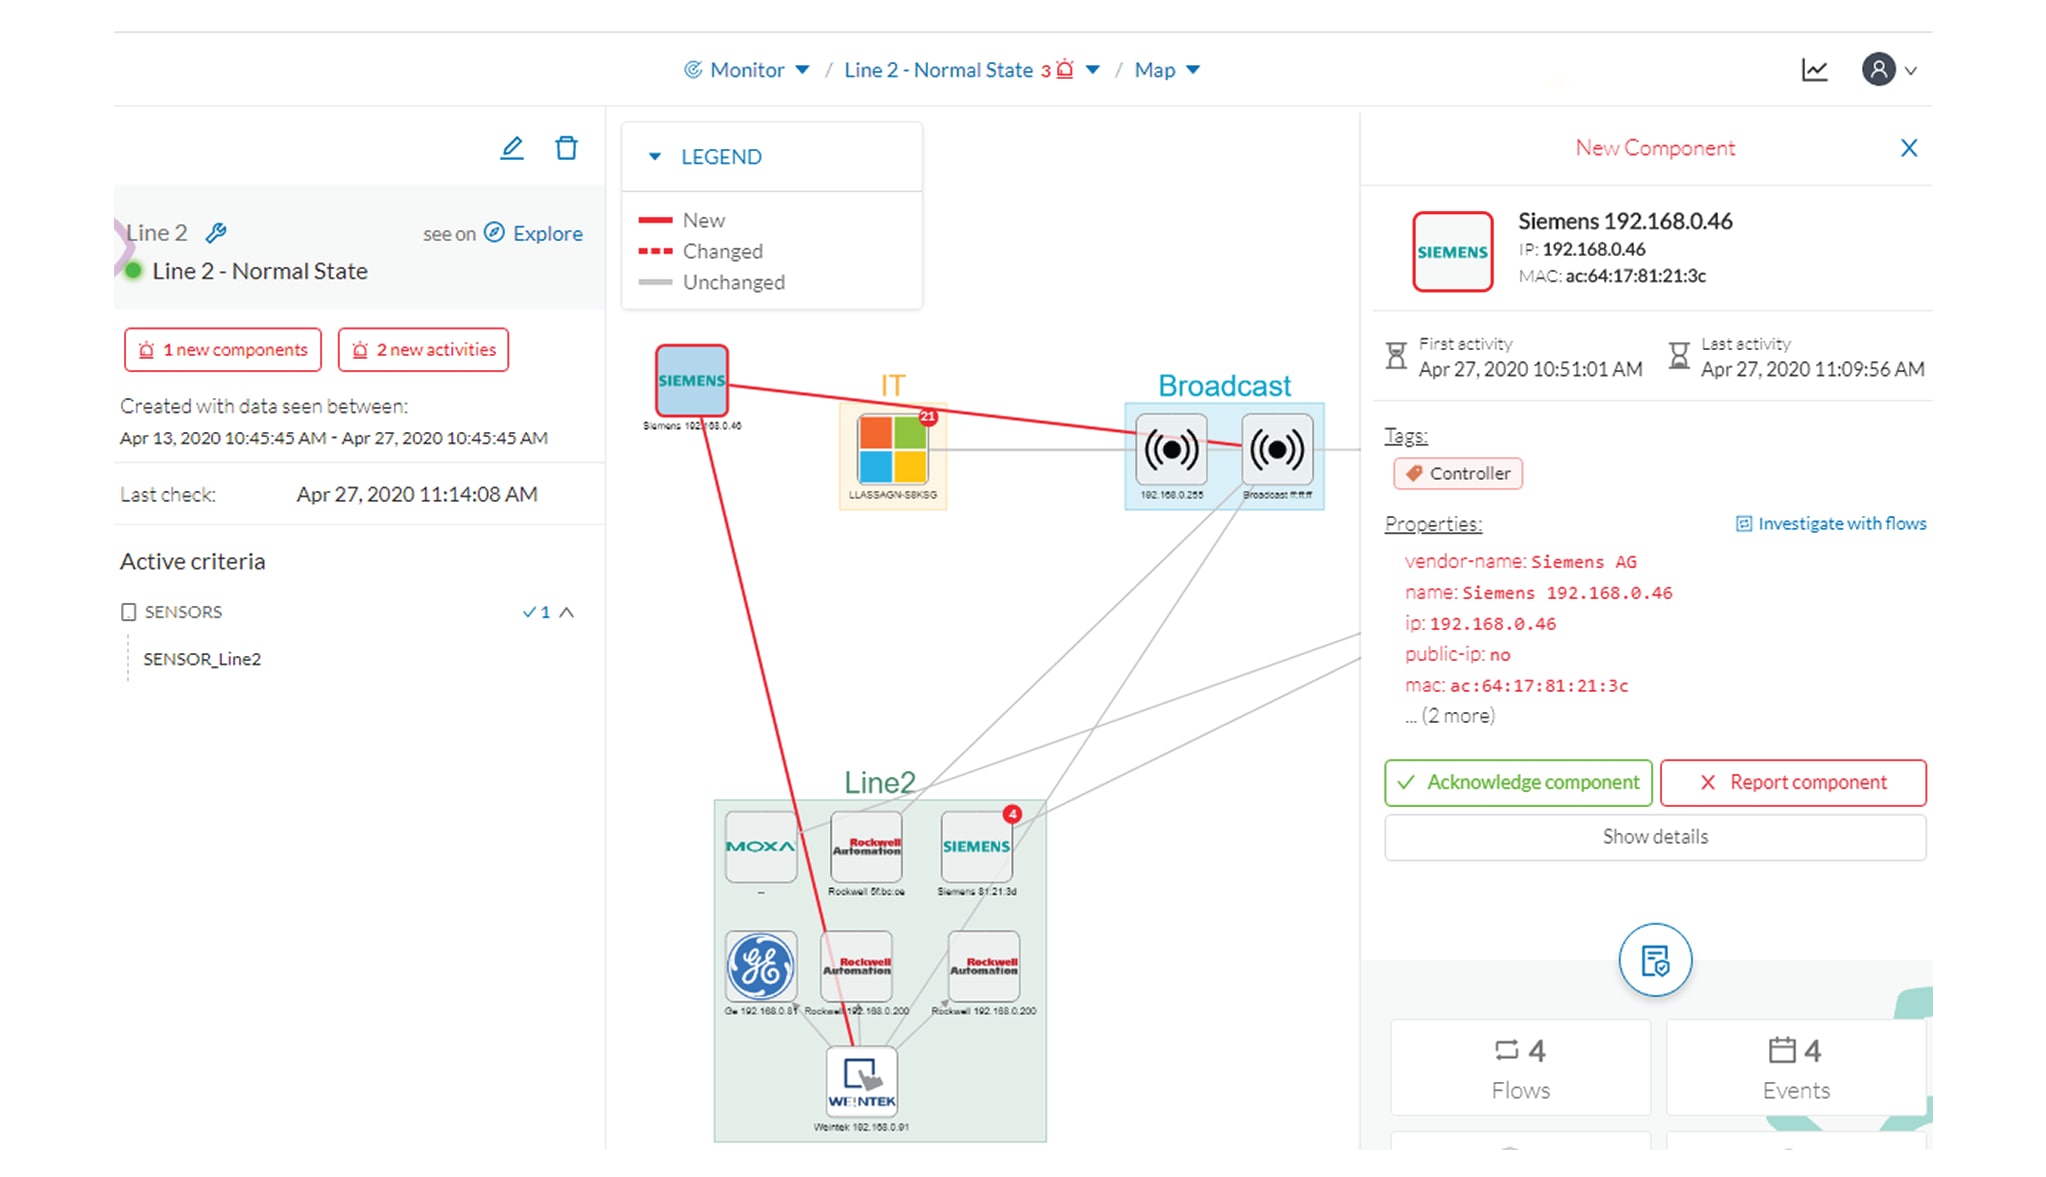
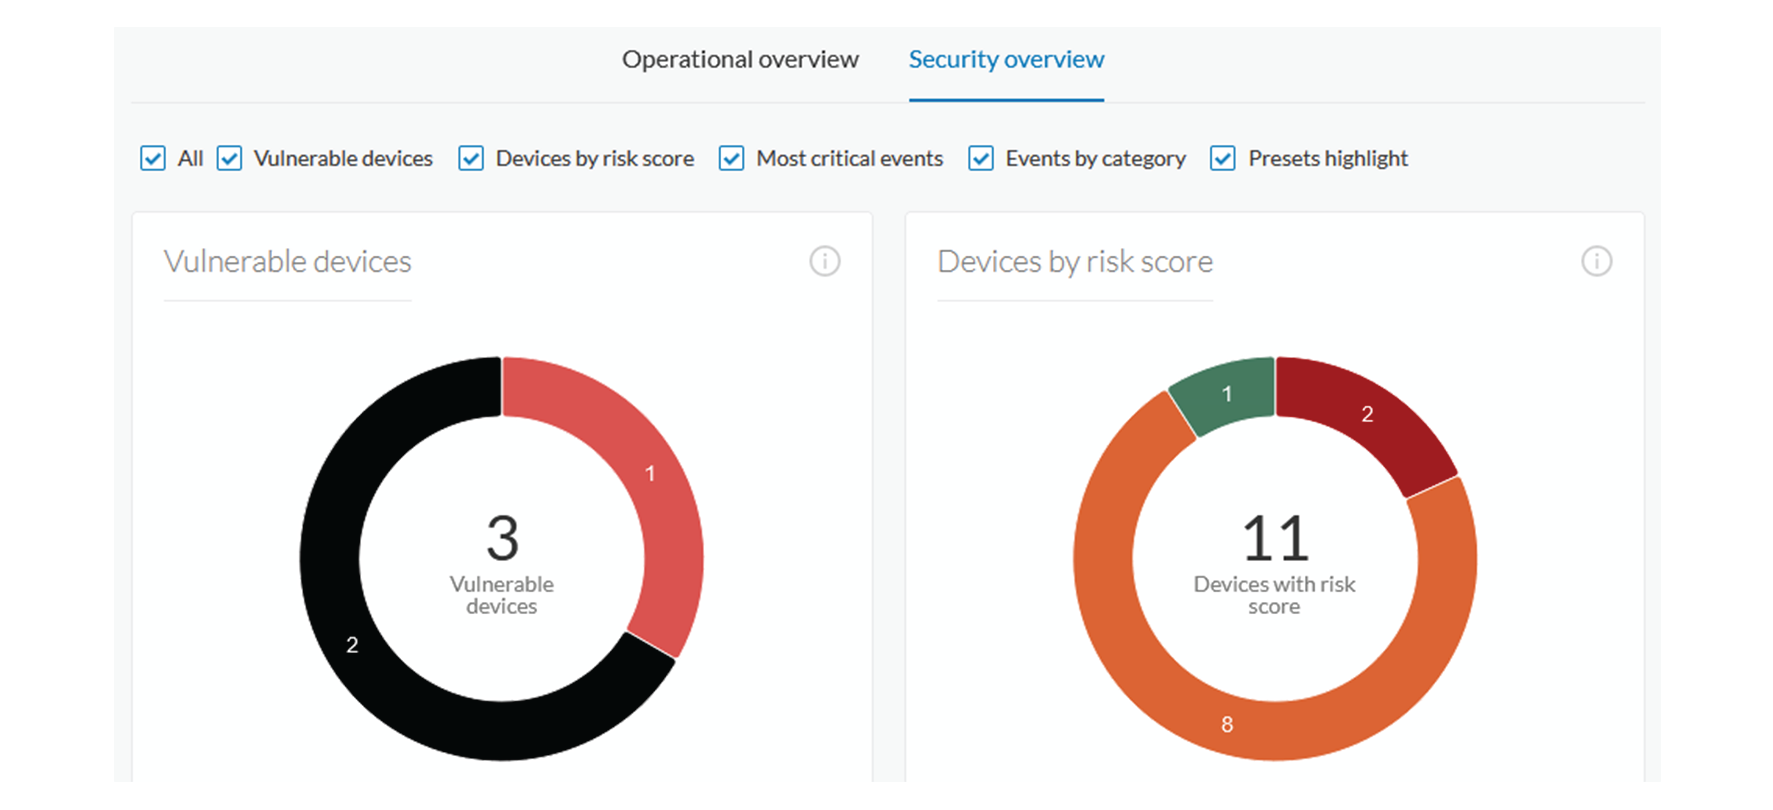
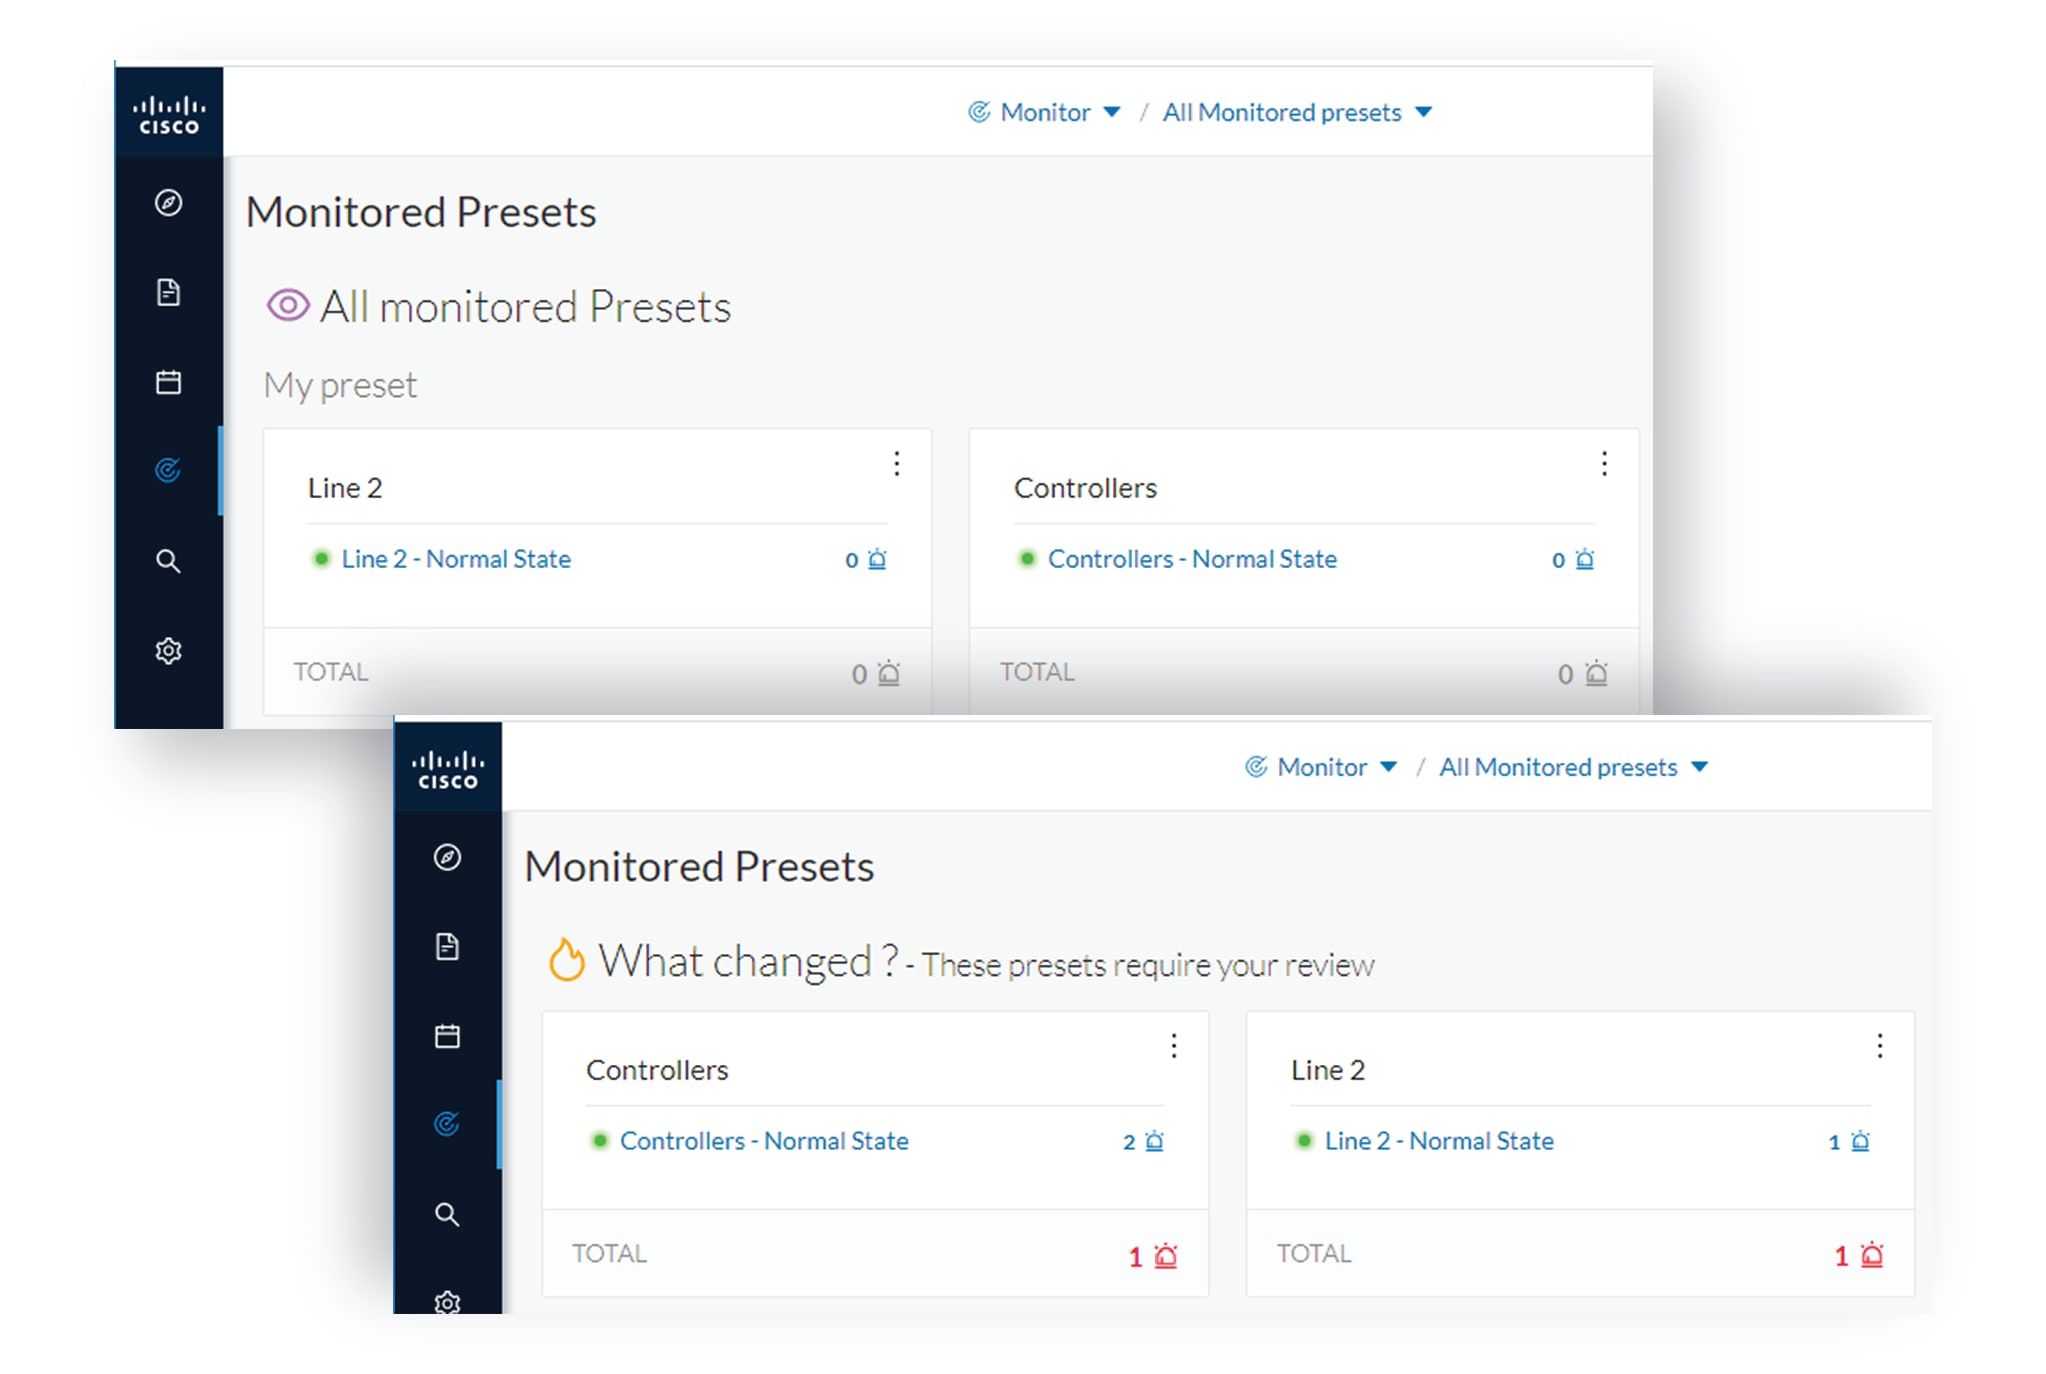
To understand what had happened exactly, we access the baseline in the Monitor mode.
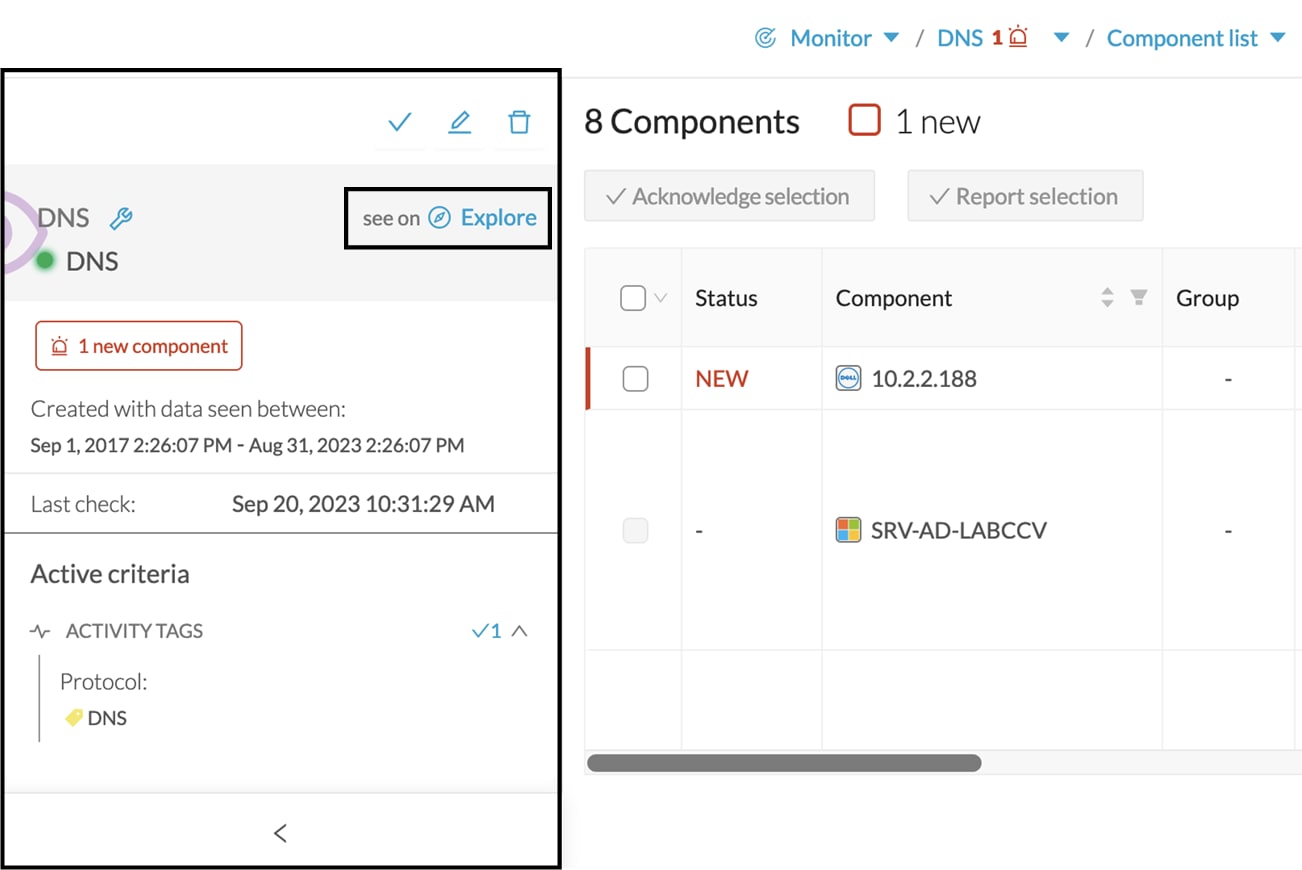
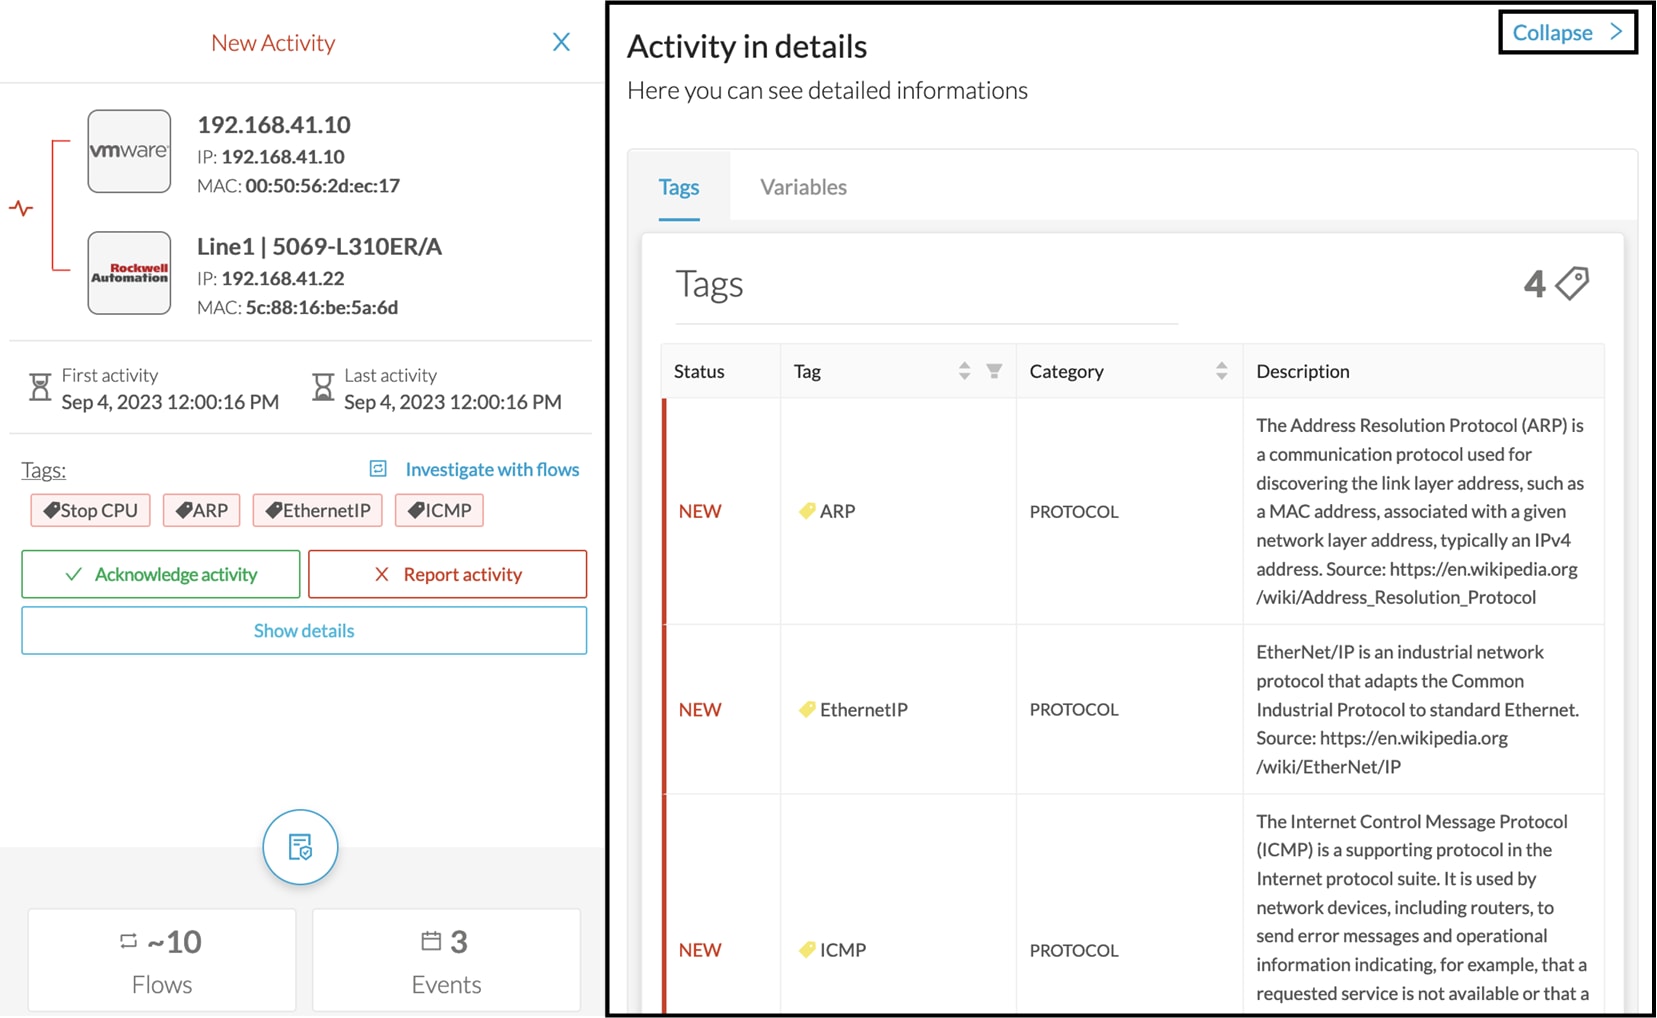
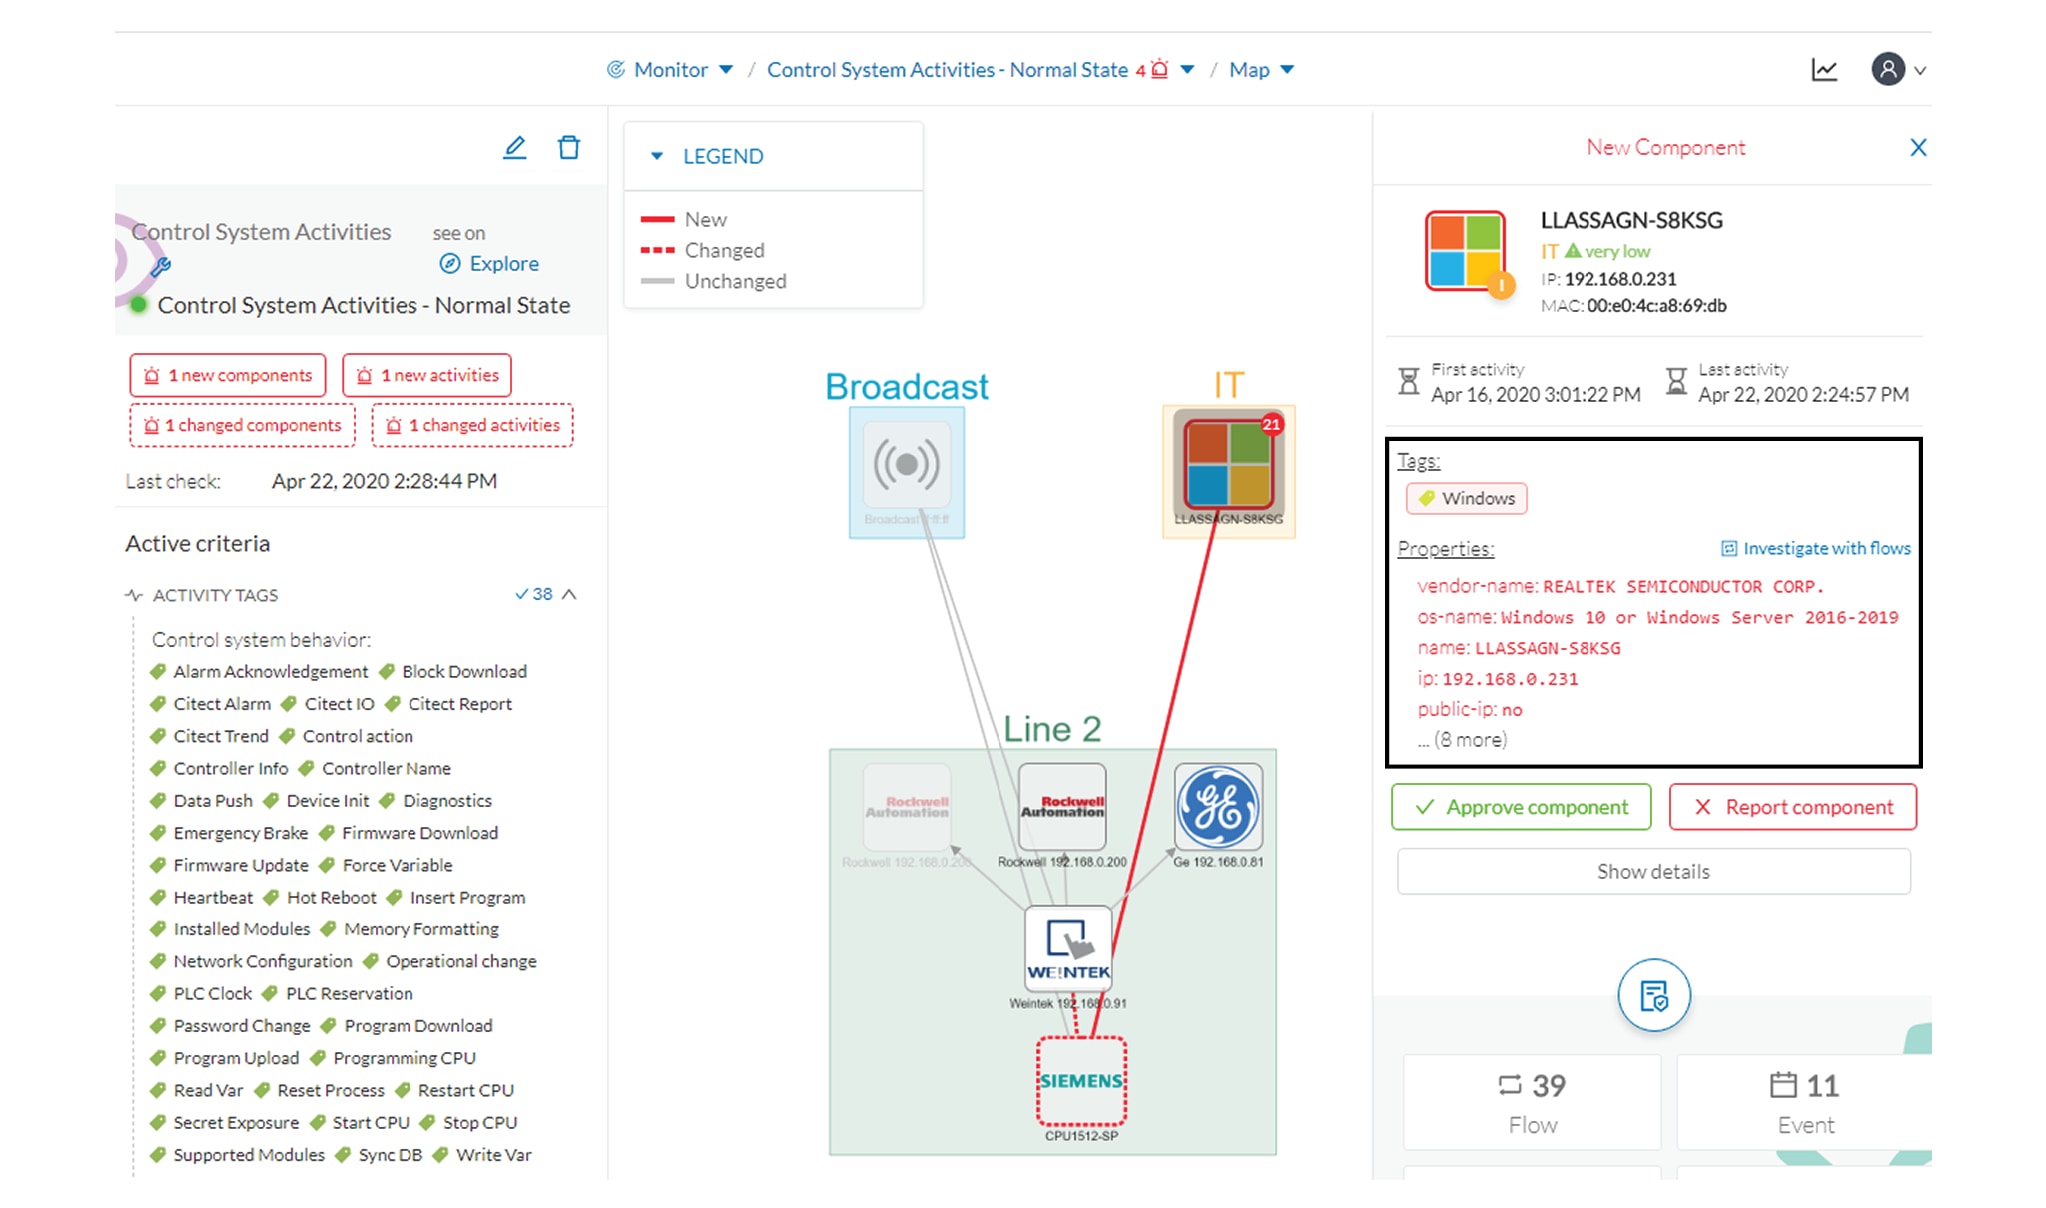
The left panel indicates that 1 new component and 2 new activities have been found.
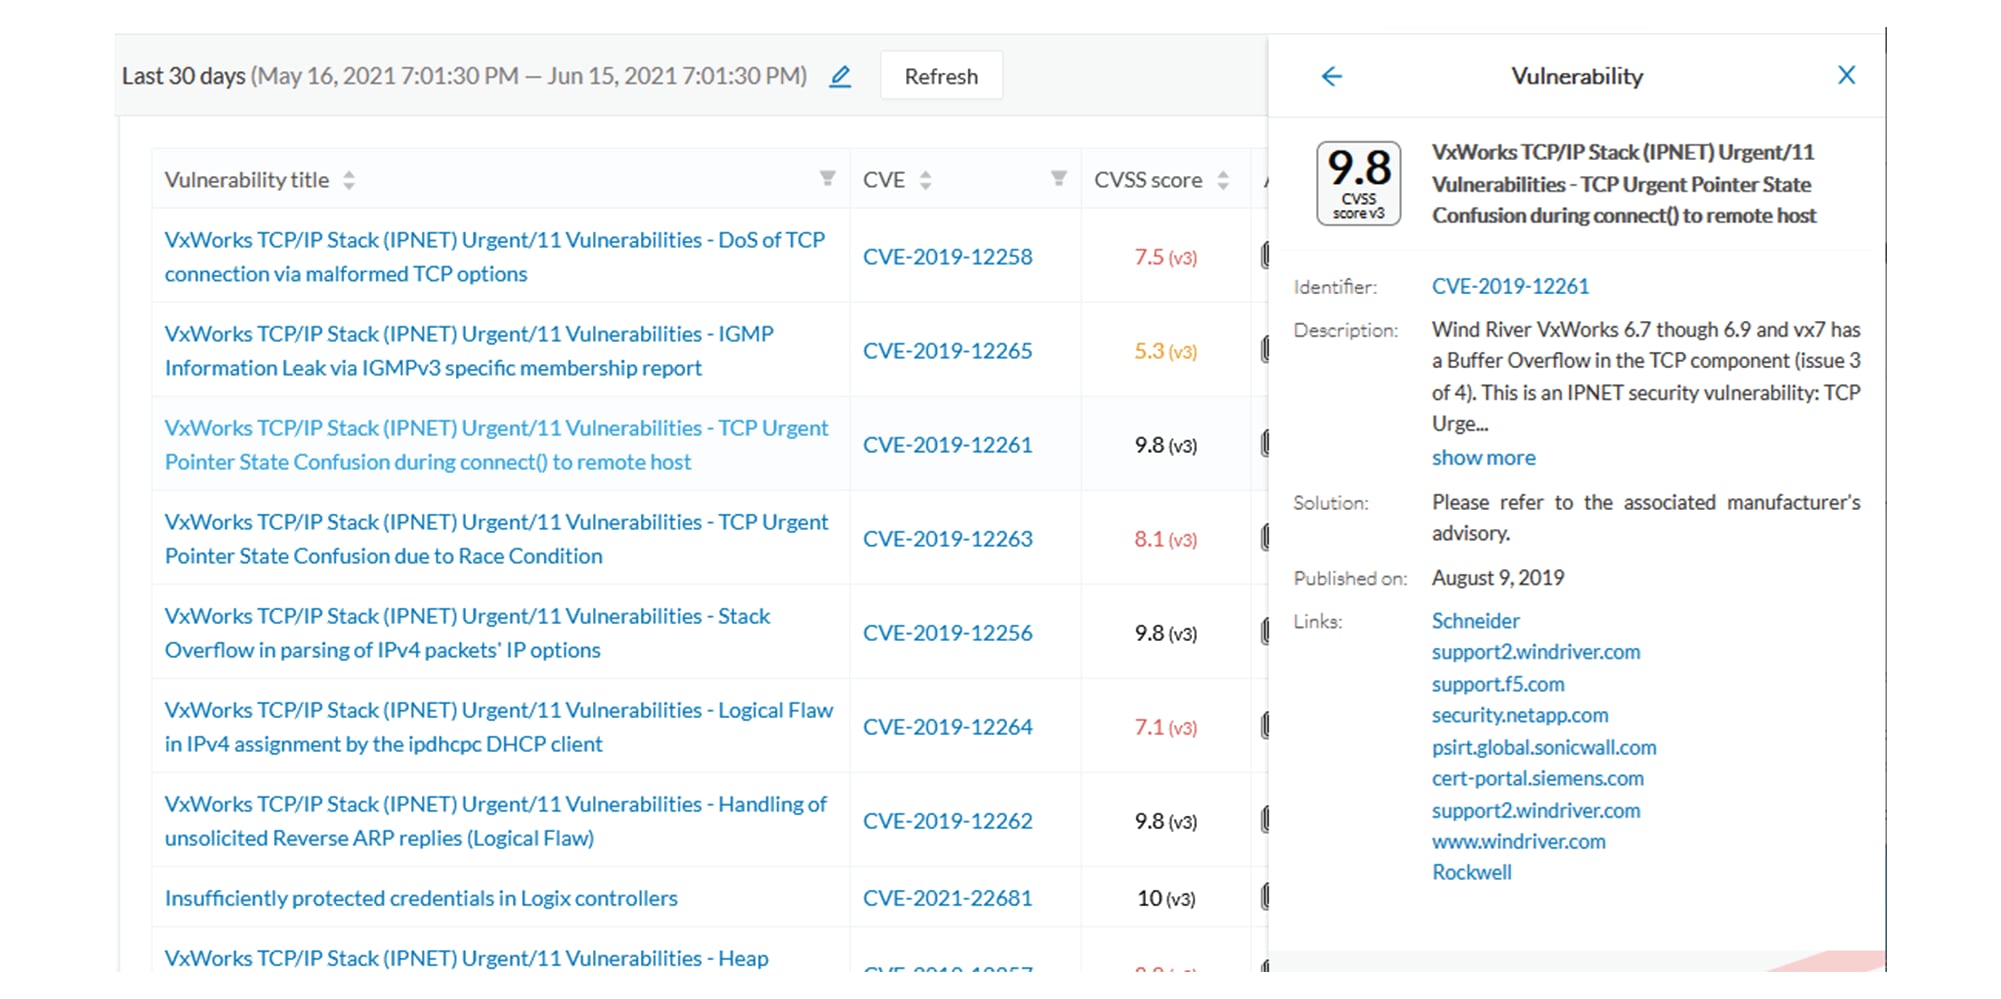
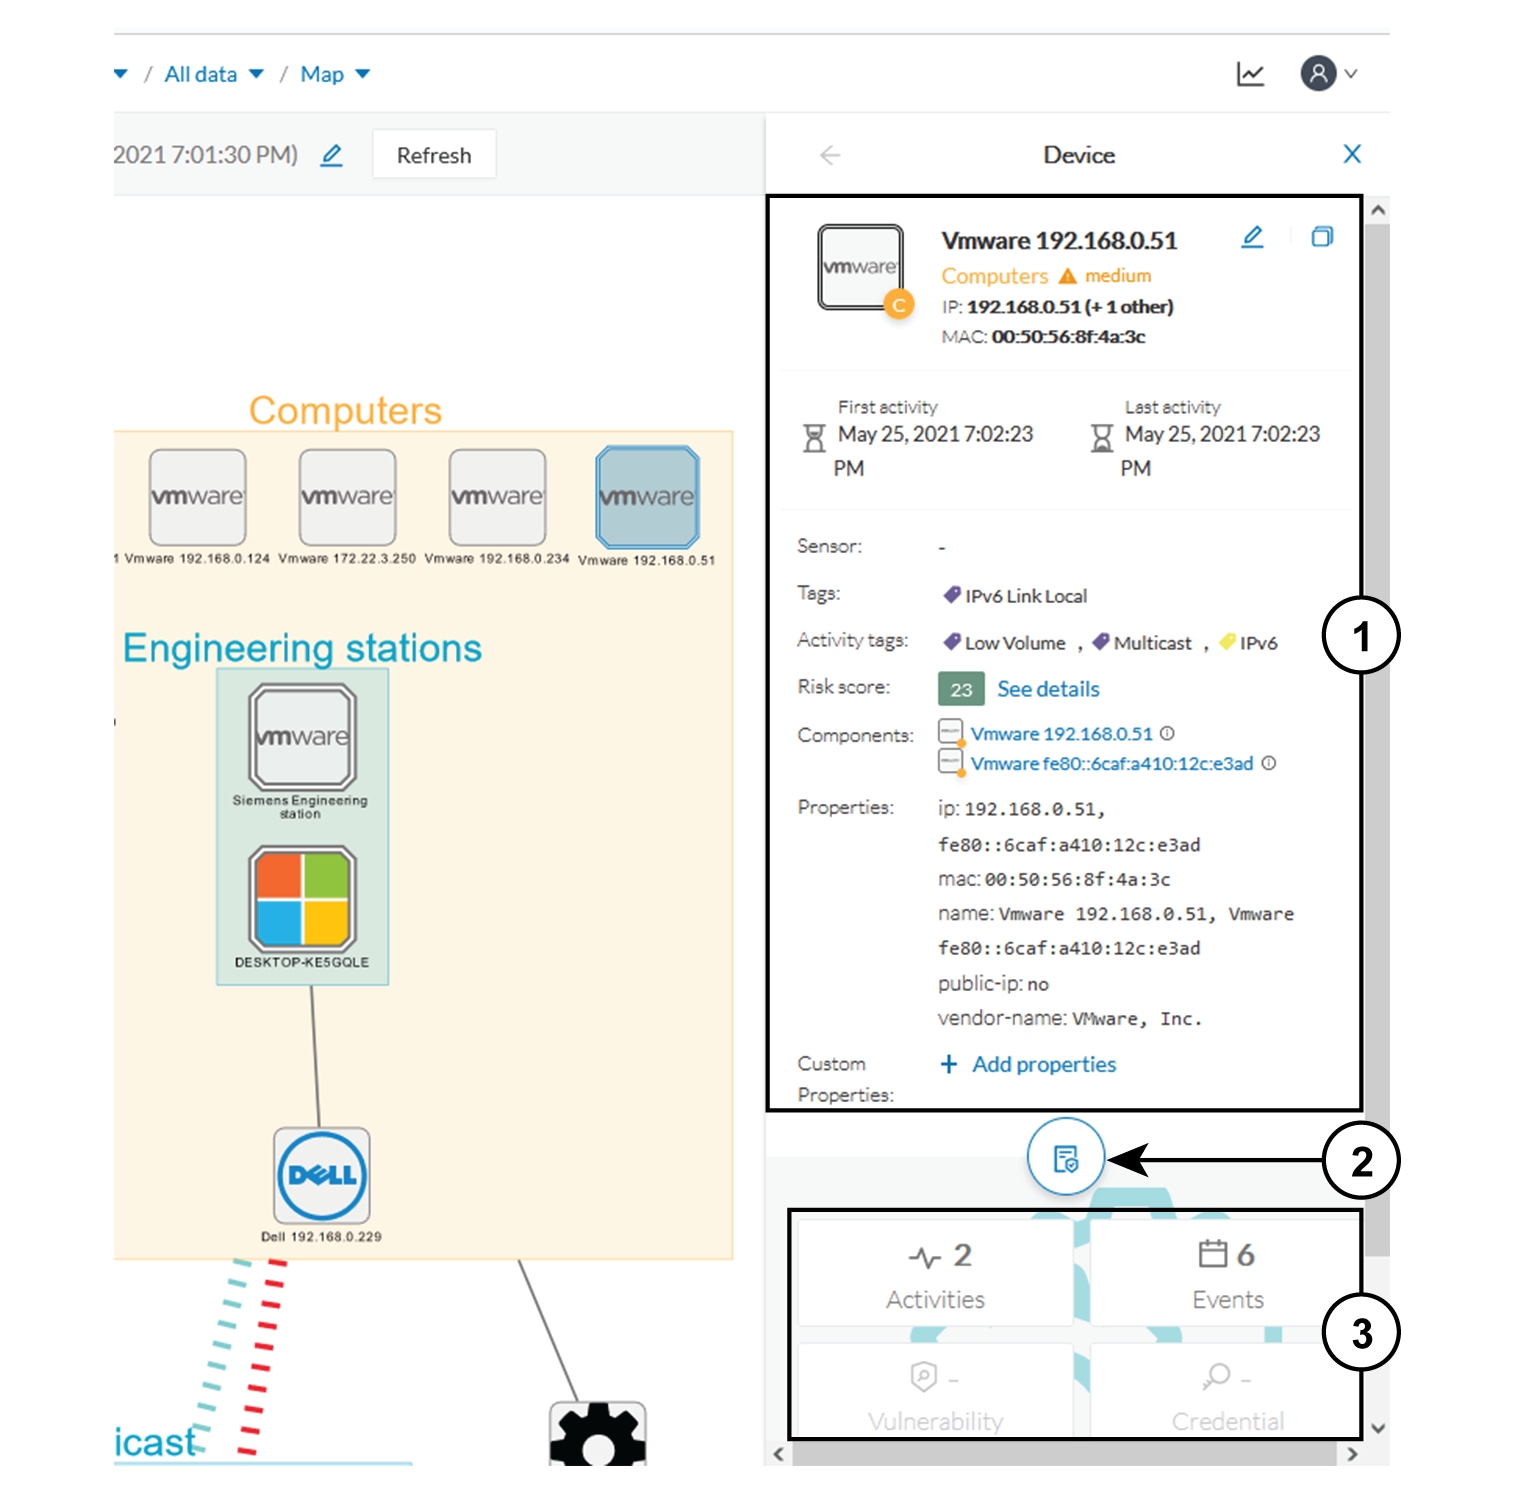
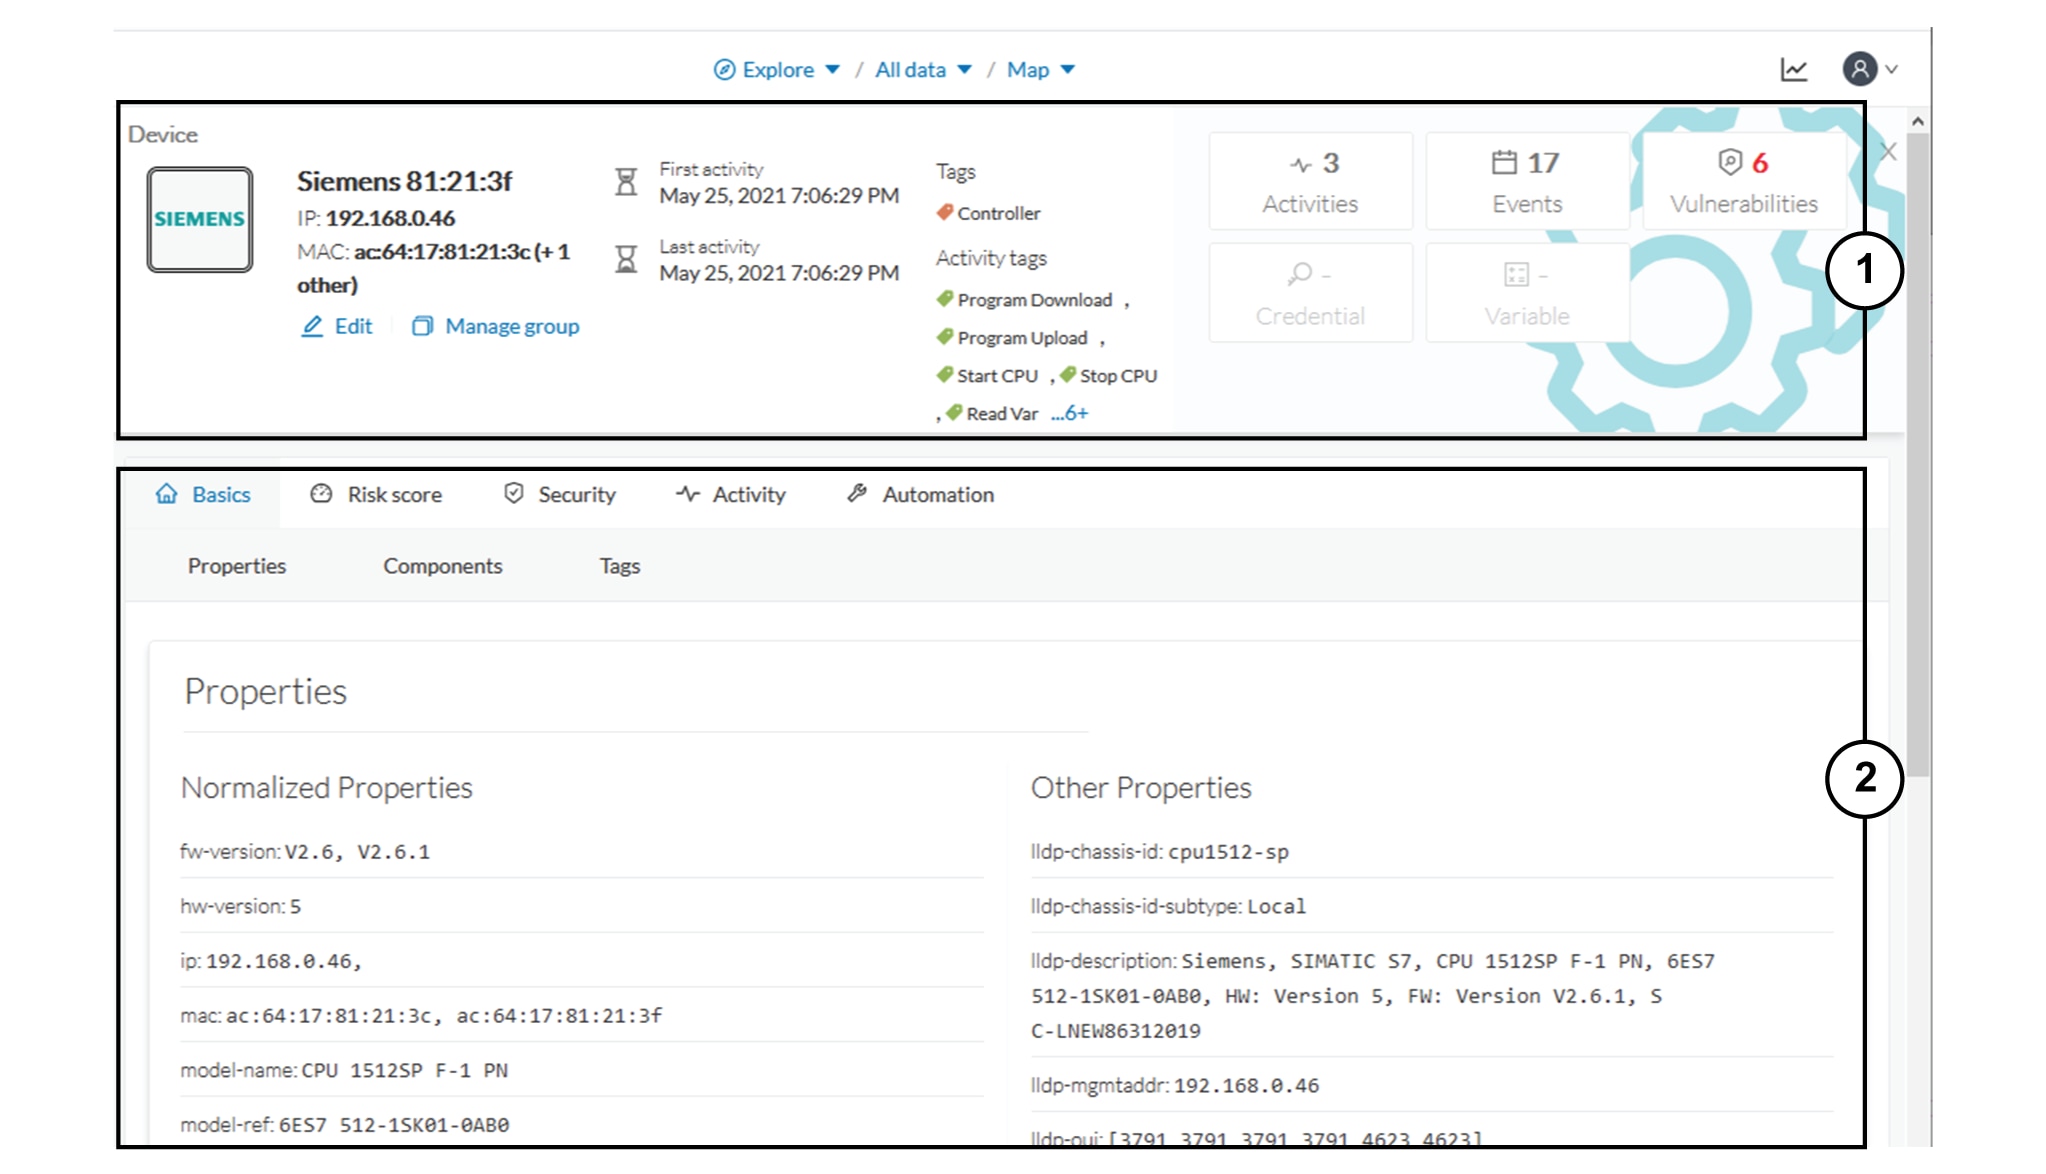
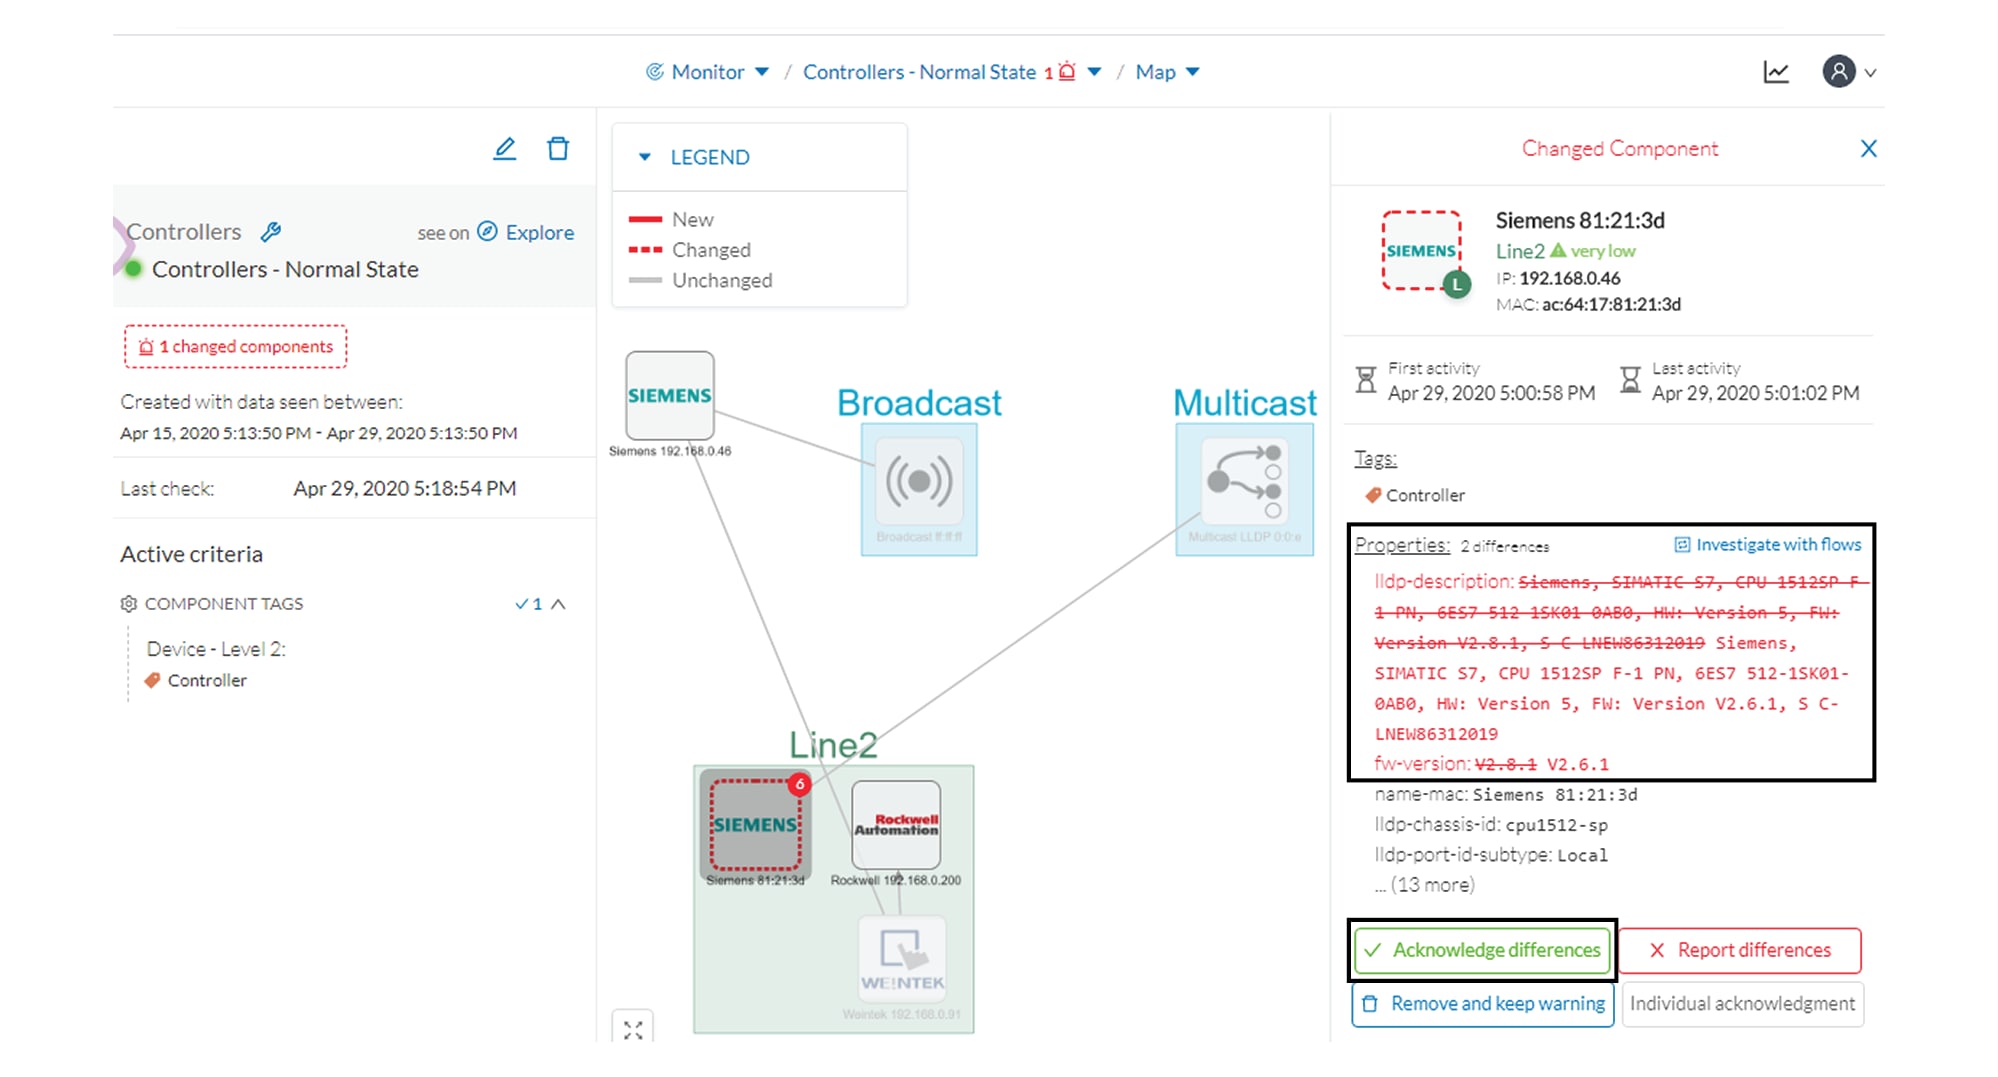
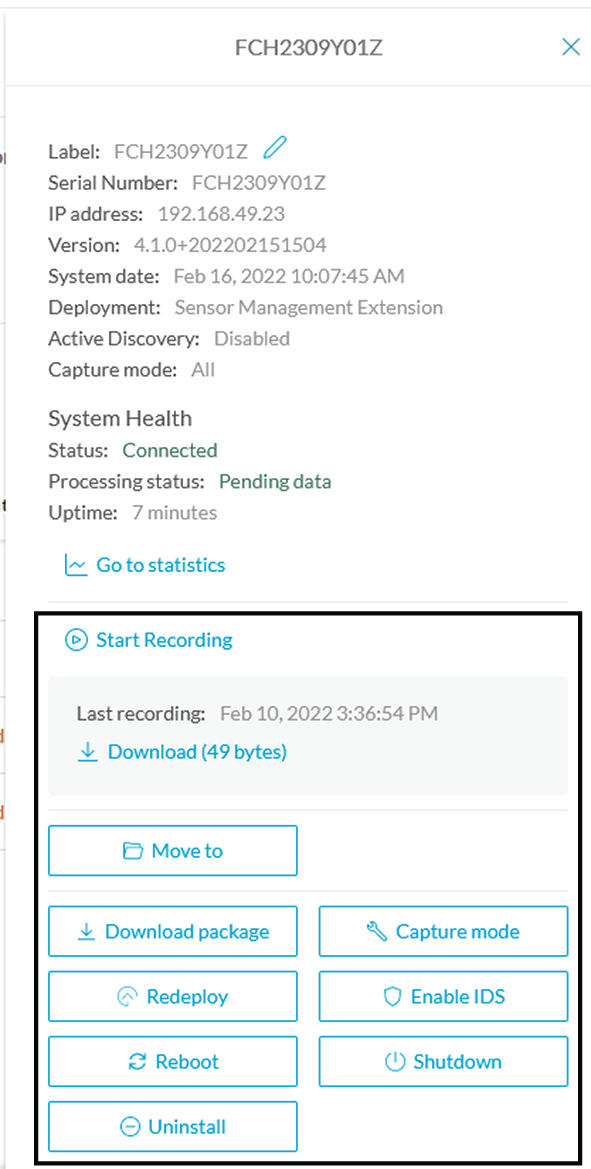
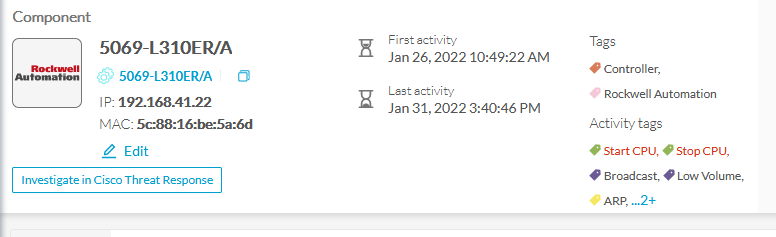
As we click the new component, the right side panel opens with the component's detailed properties.
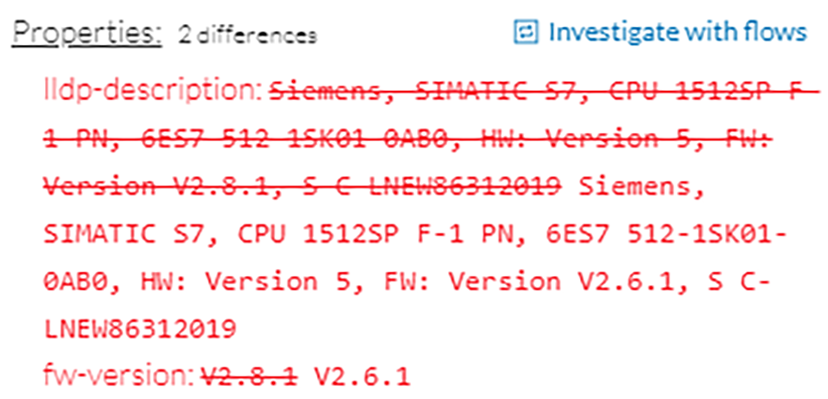
As we observe the component's details, we learn that it is in fact a controller, and properties look like what we're already
used to see on the network regarding other components' characteristics. After confirming on site, we discover that a new PLC
has been connected to the network to enlarge Production Line 2.
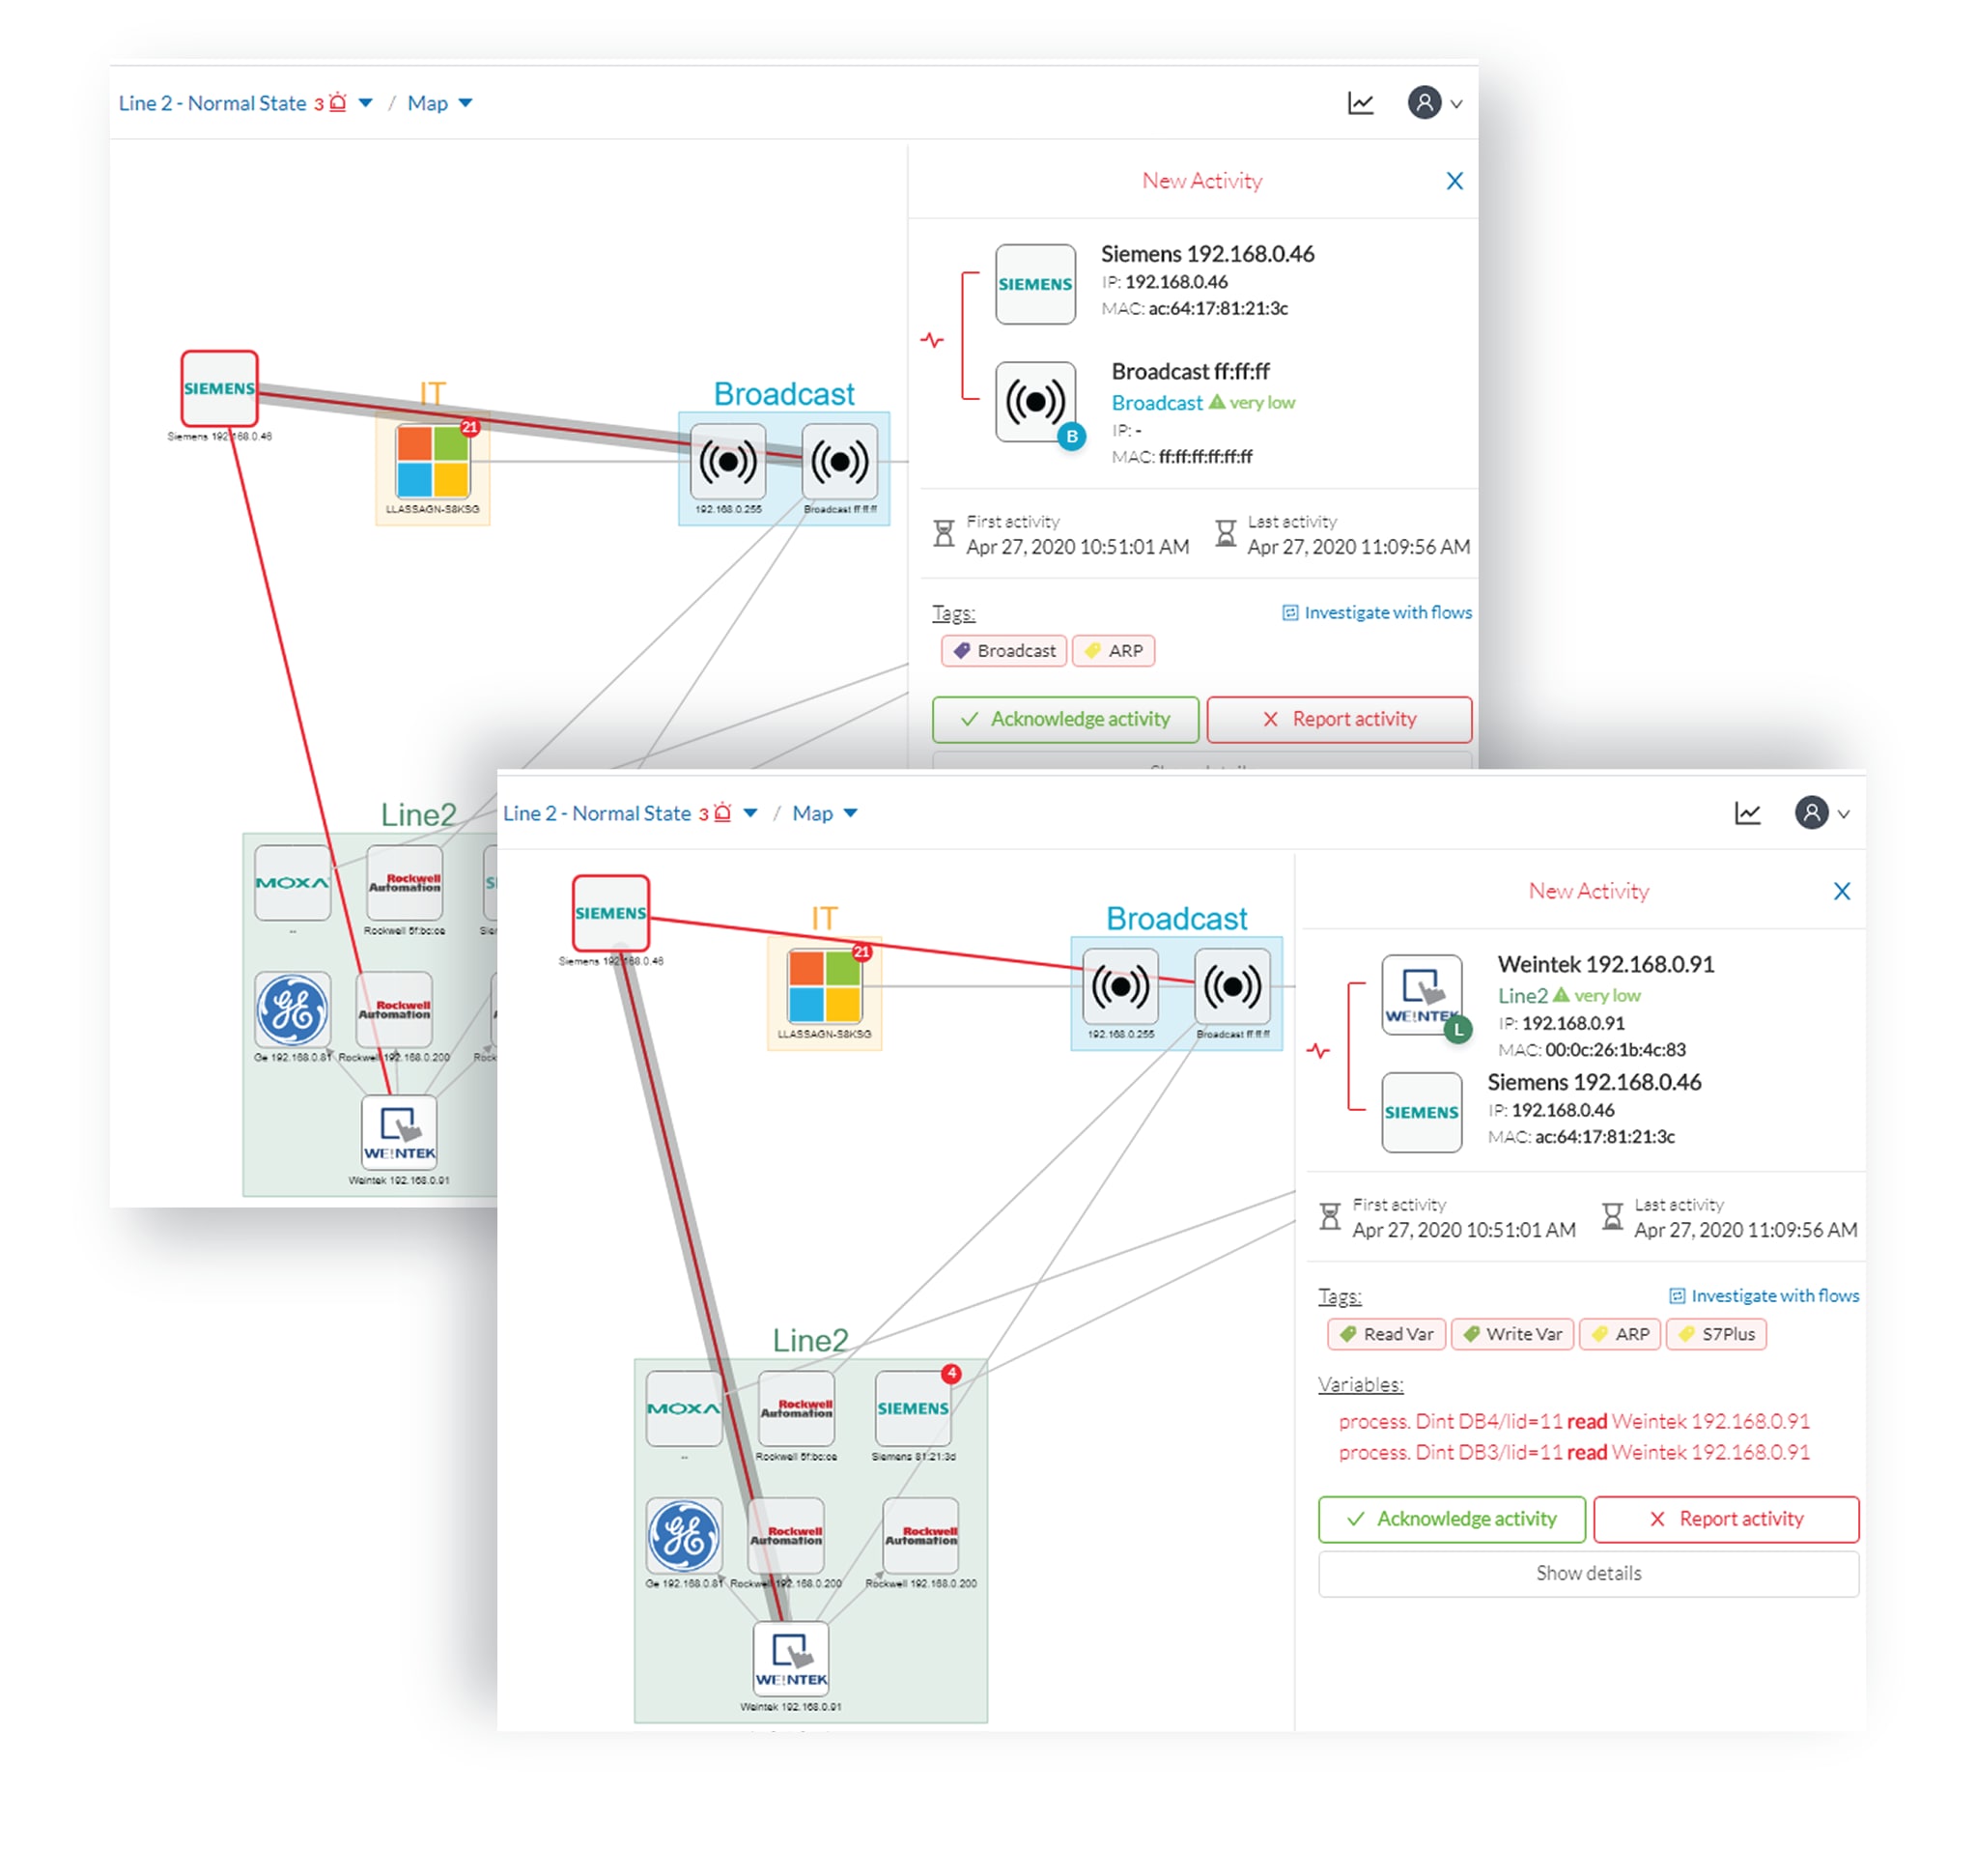
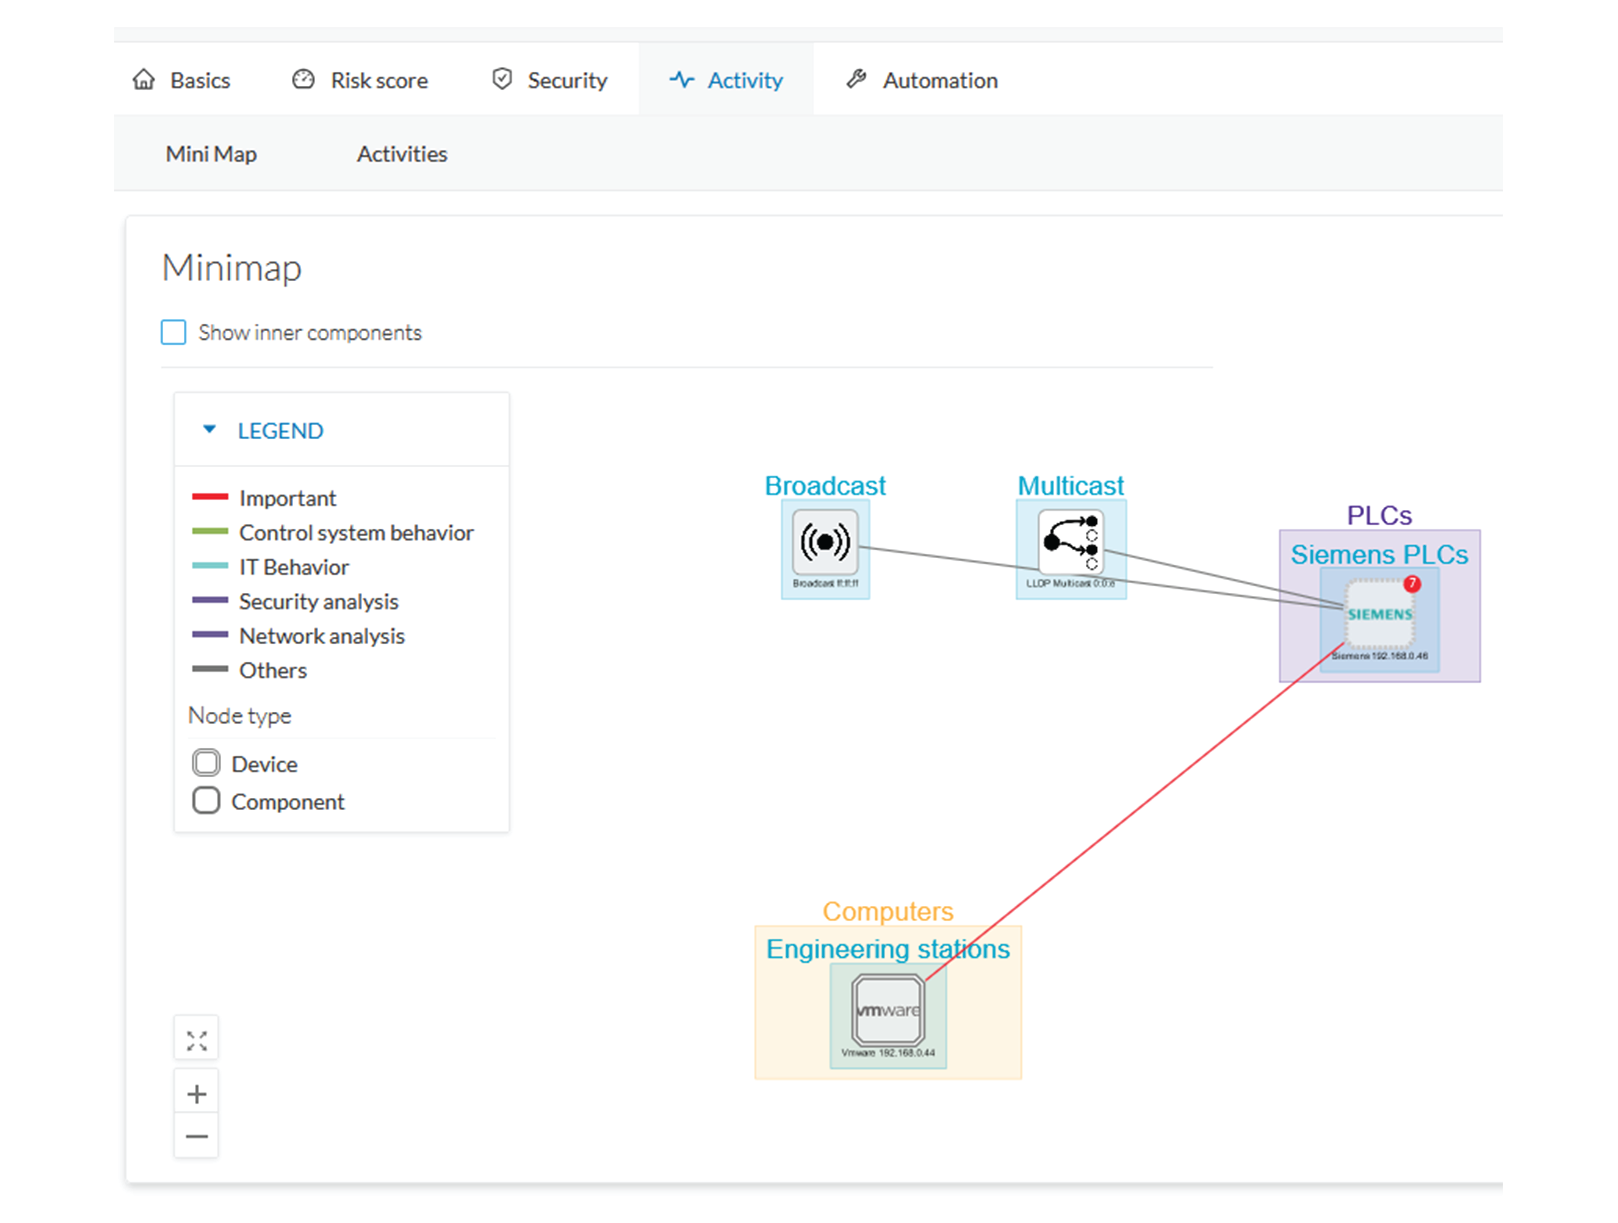
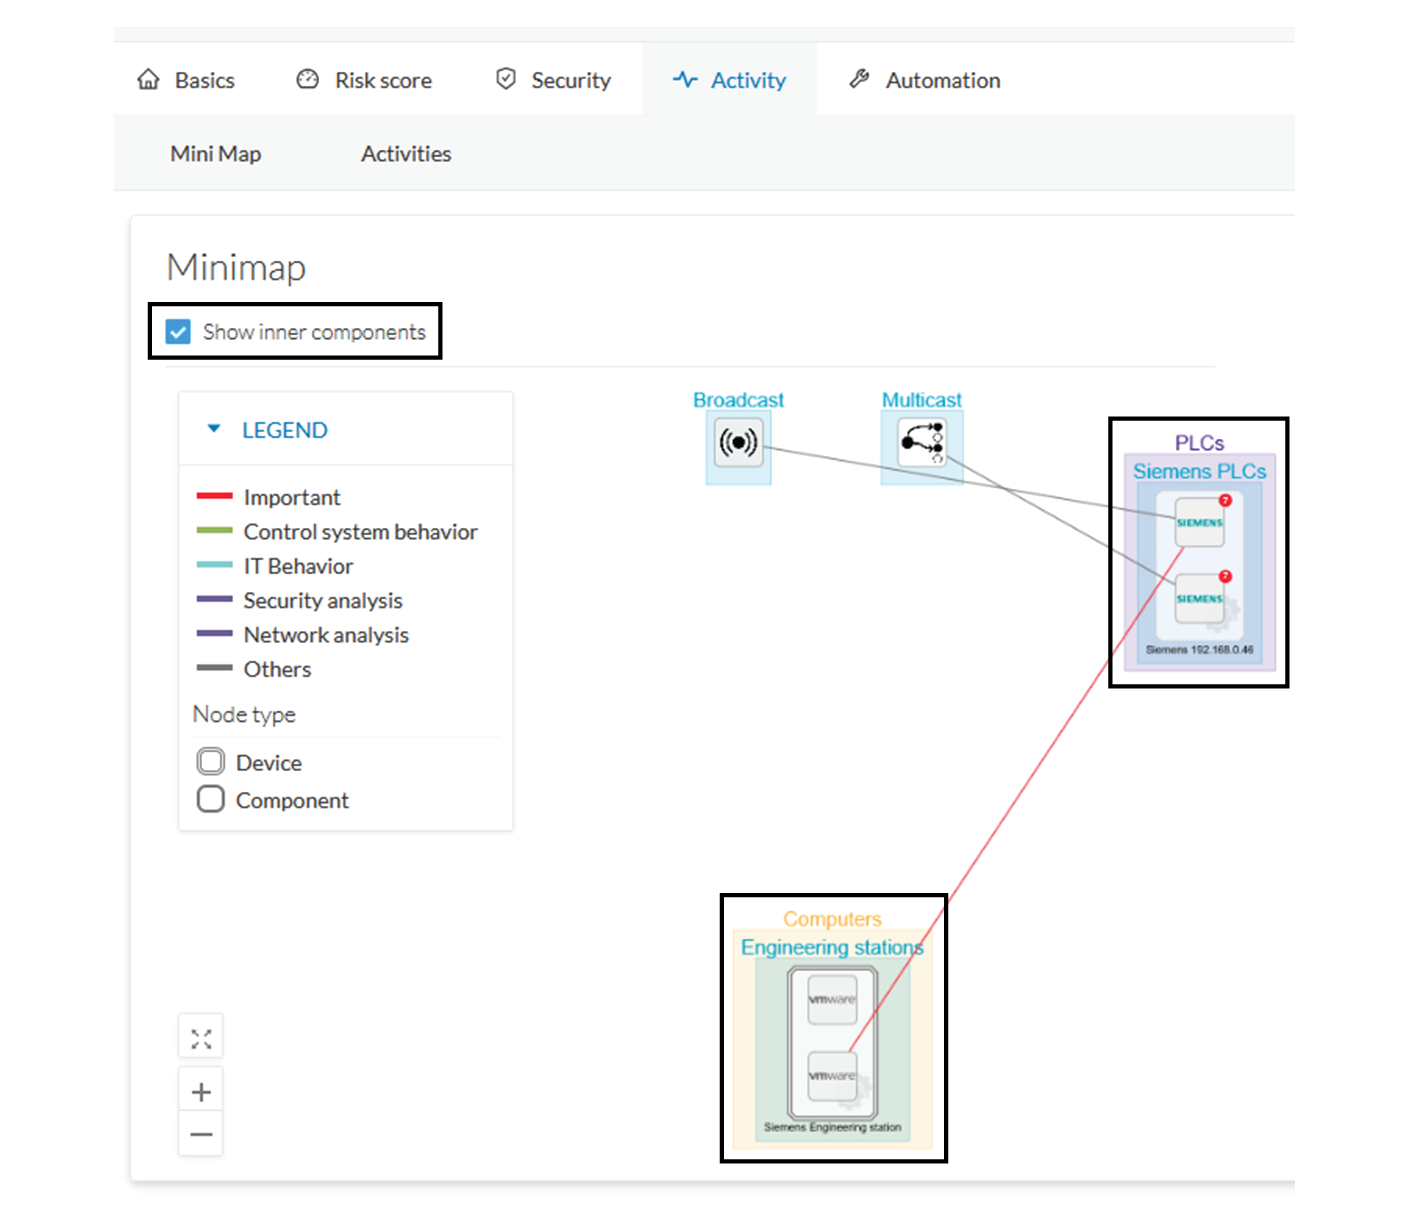
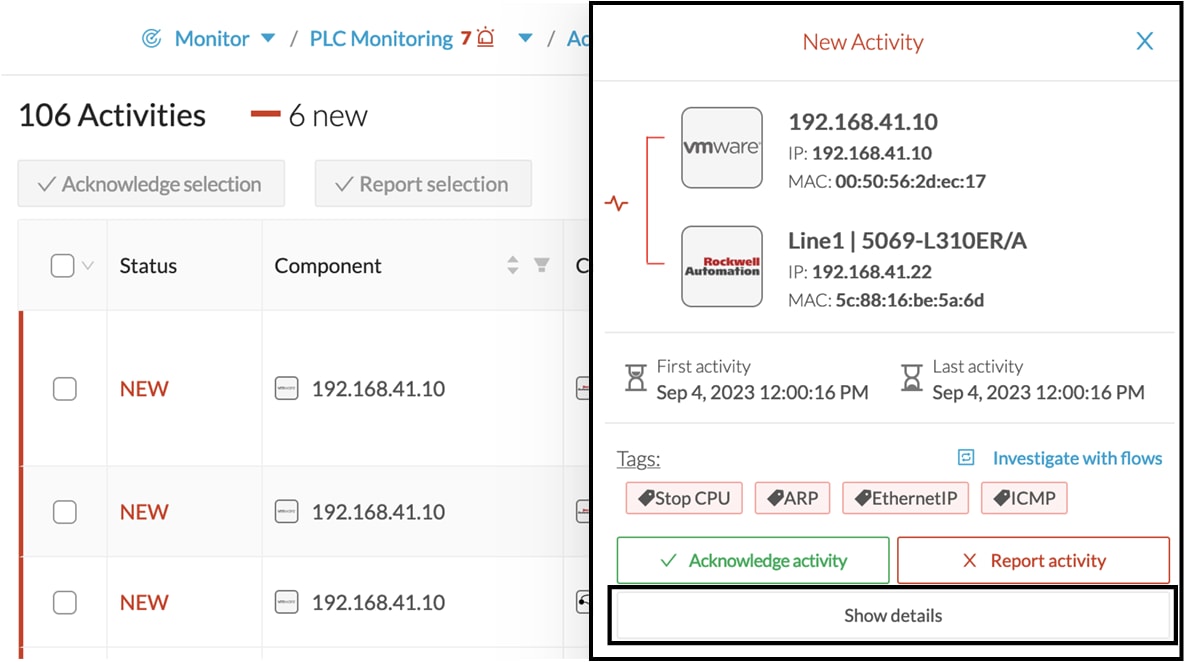
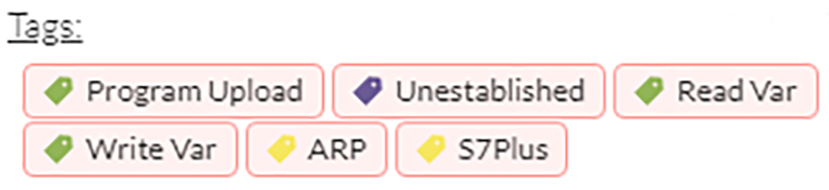
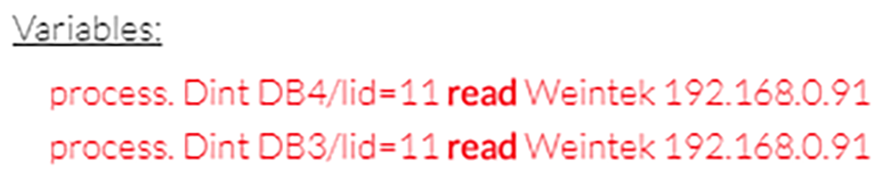
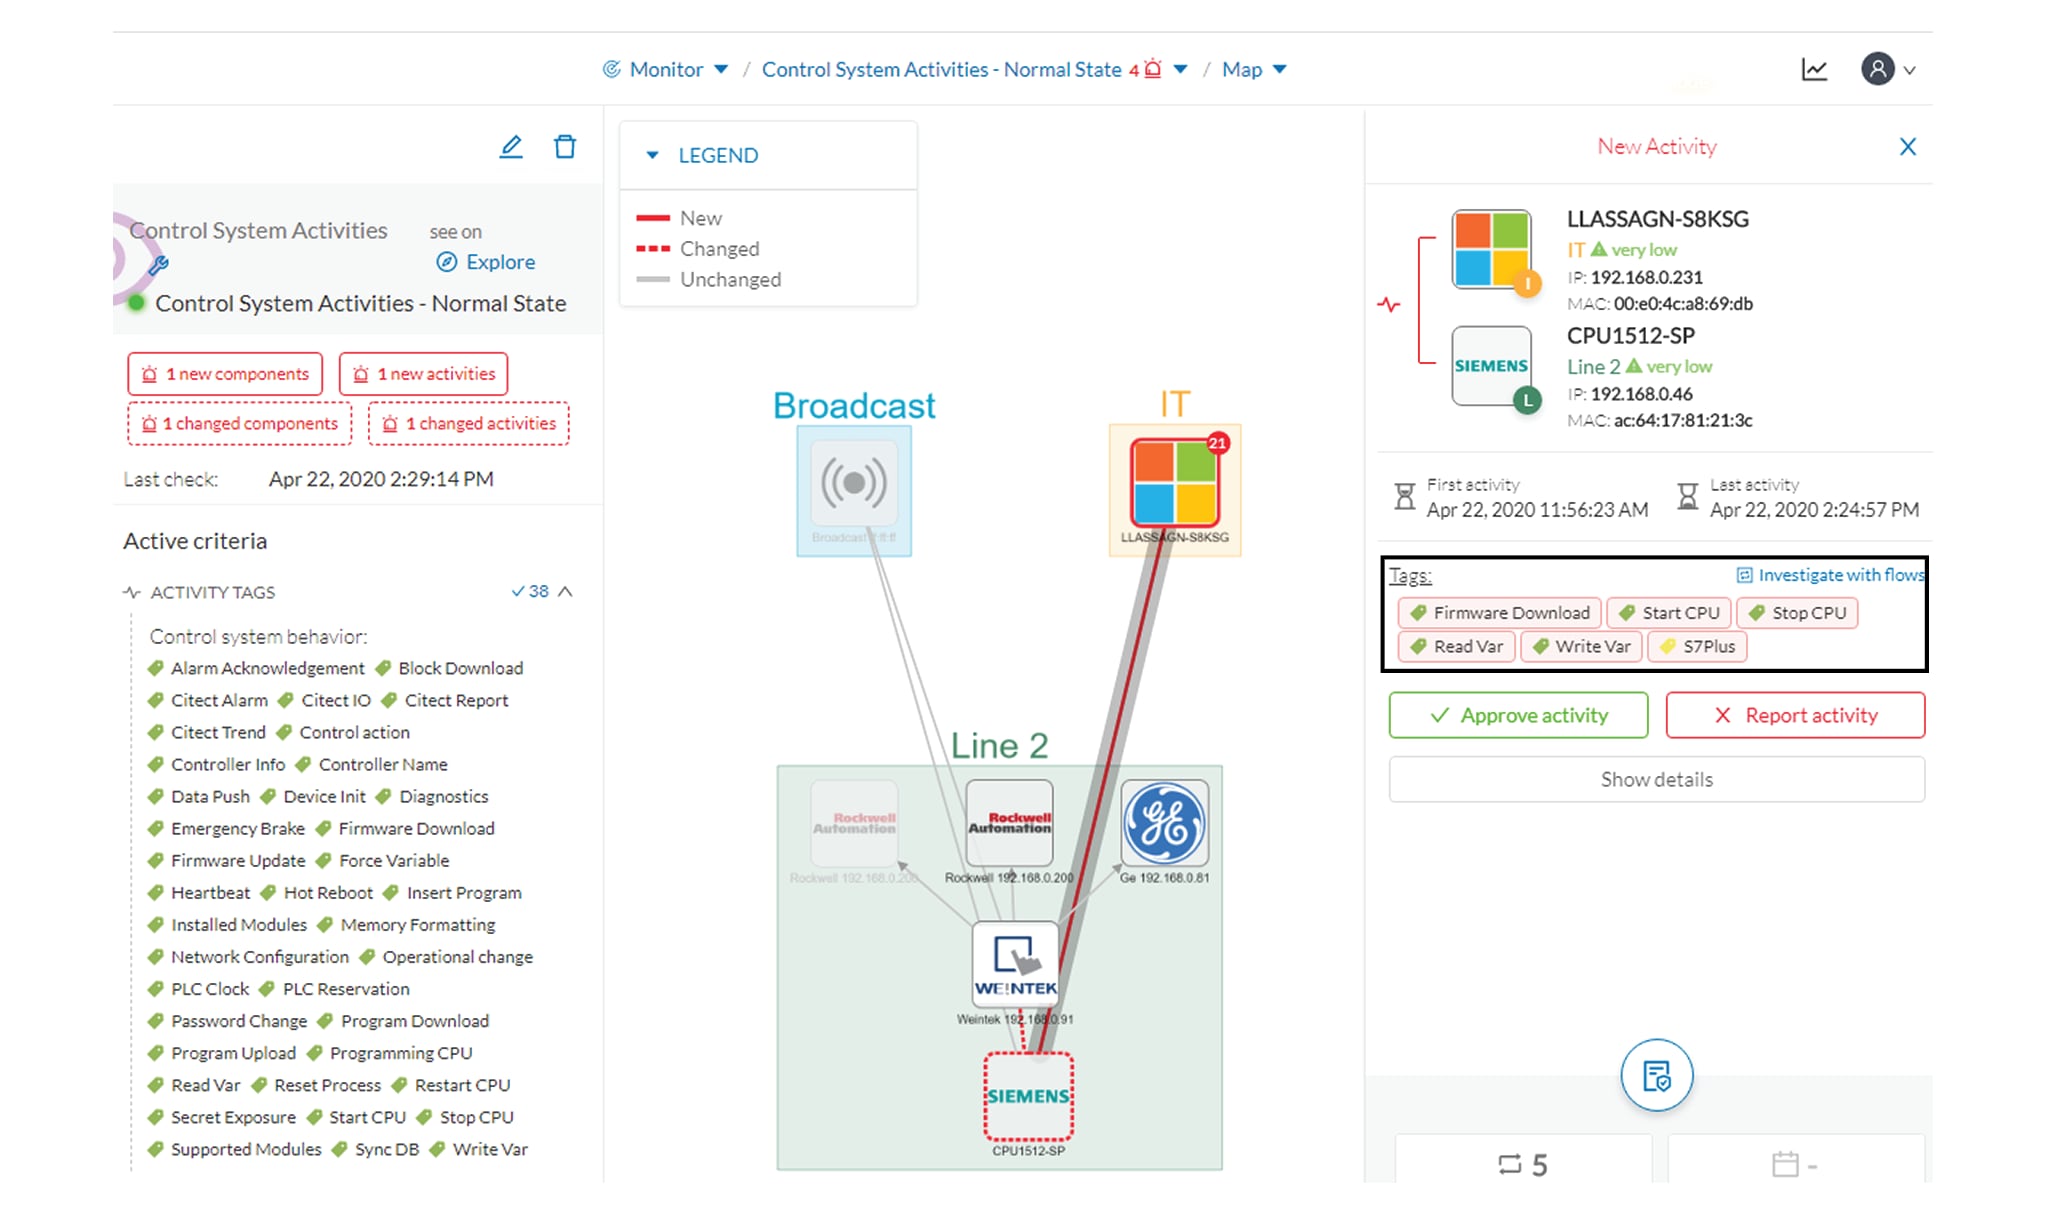
Then, we check that this new component behaves normally by looking at its activities. It has been identified because it has
sent a broadcast packet (probably ARP) and then has connected to the Weintek machine using a legitimate protocol. Actions
like Read variable accesses look normal too.
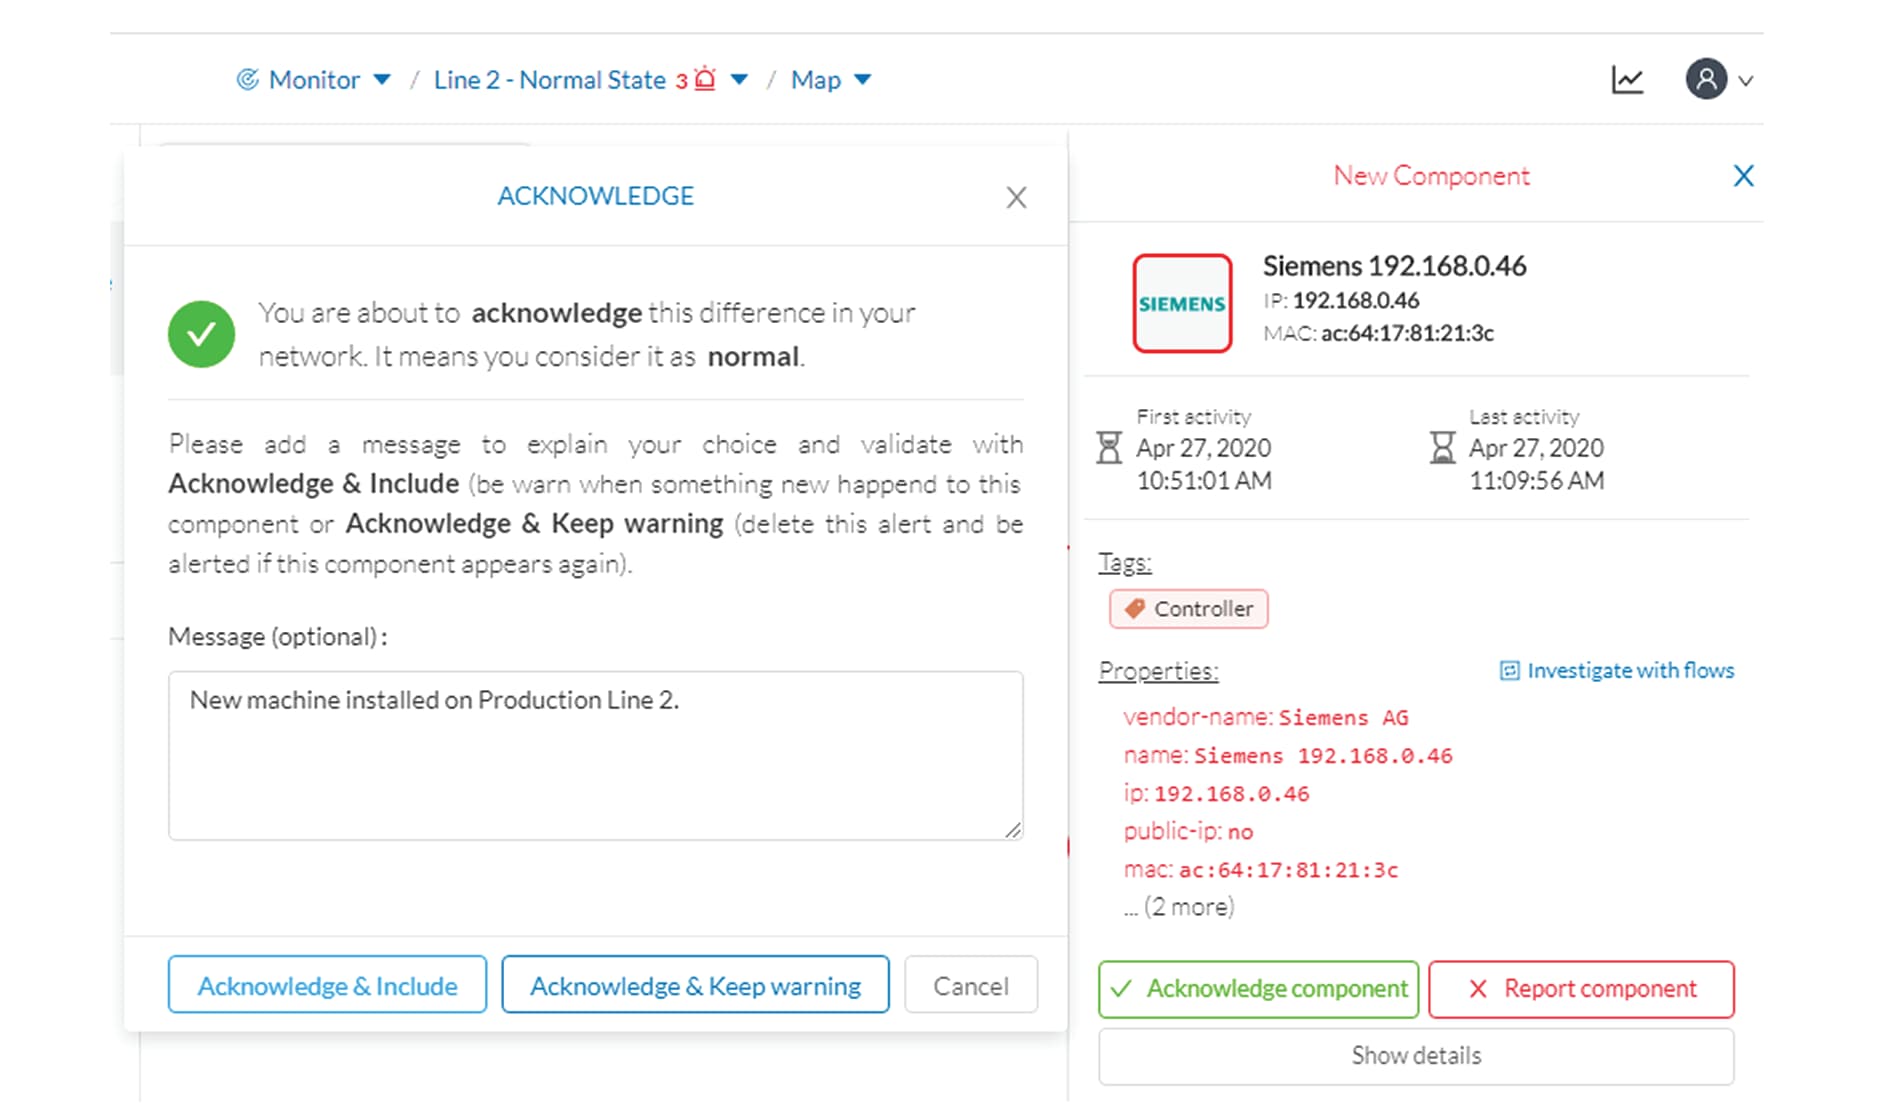
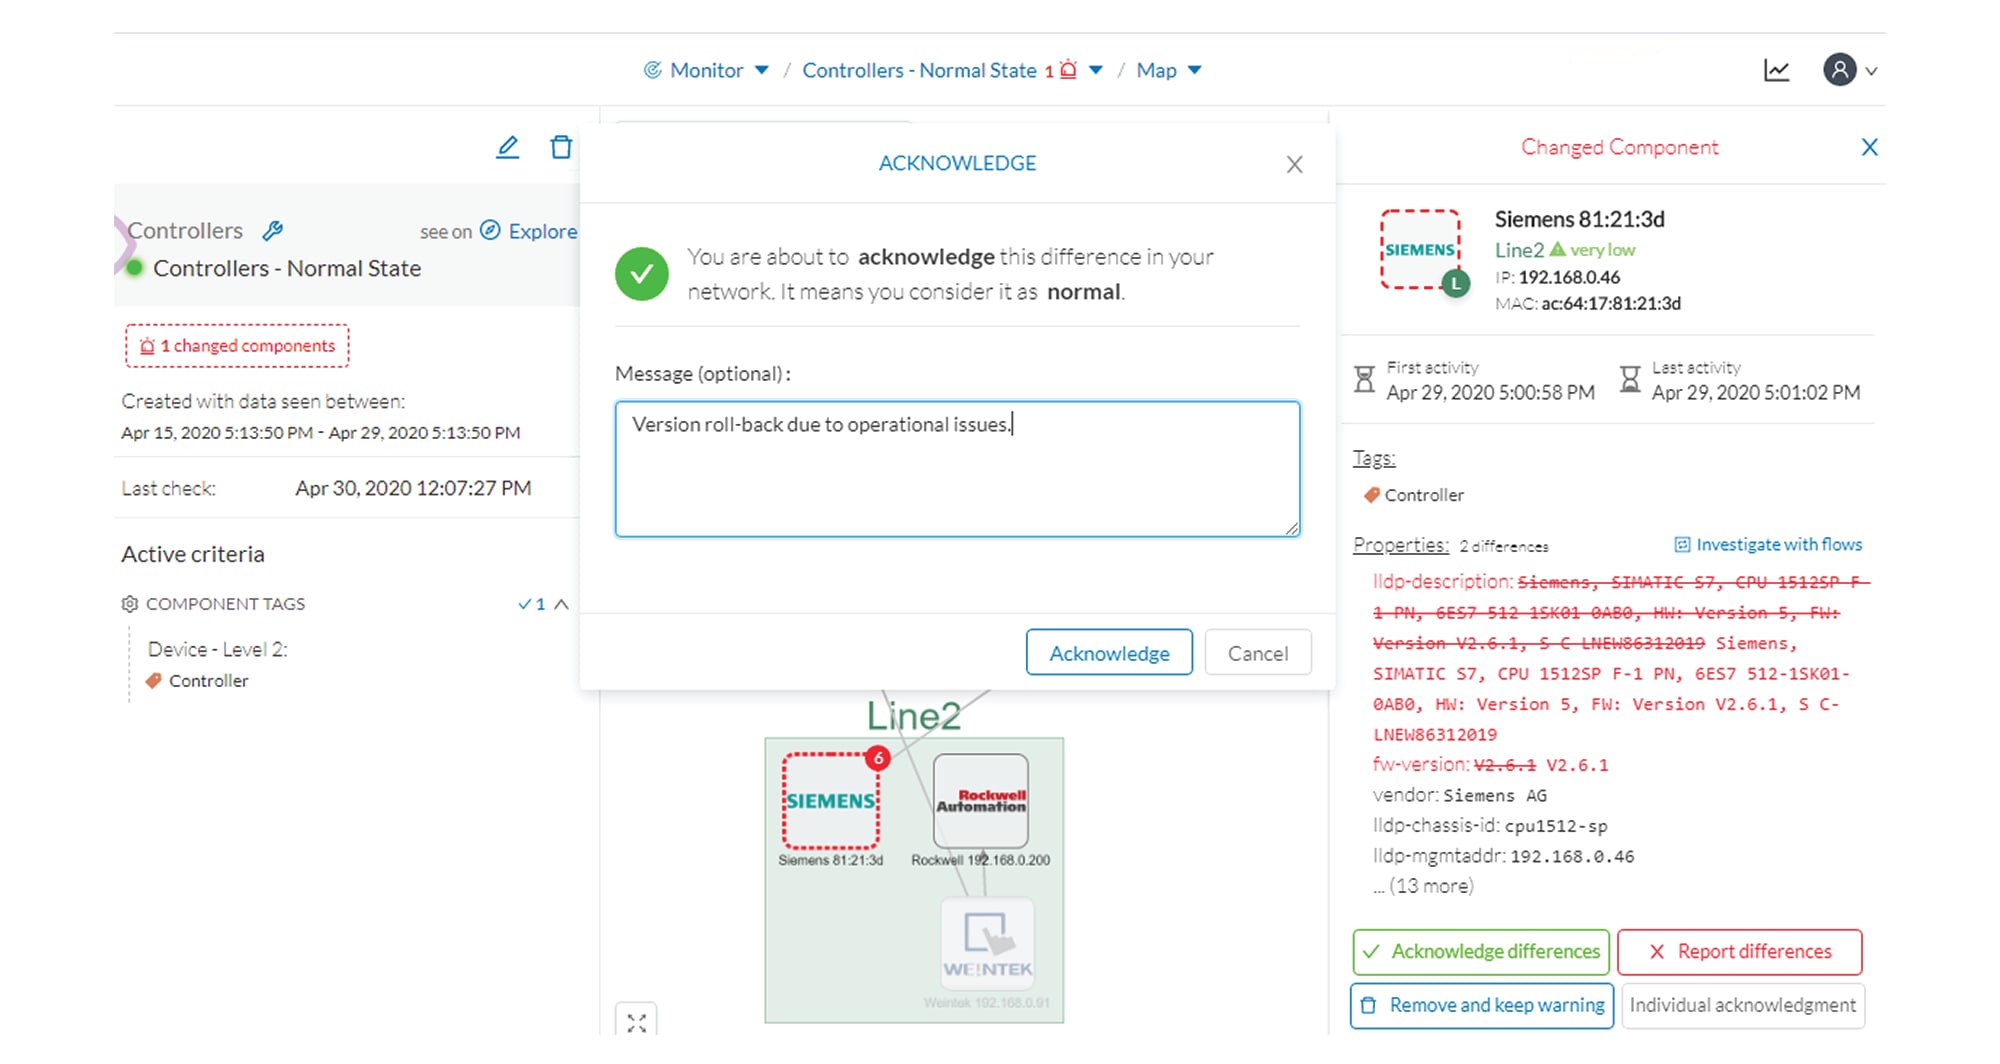
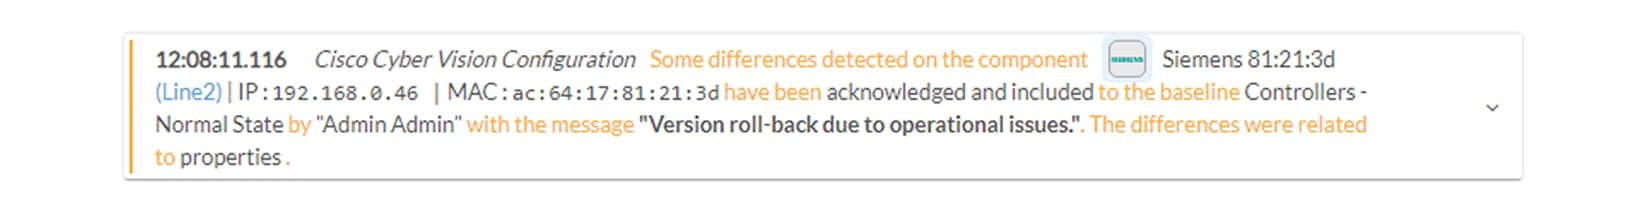
Since the component and activities will be part of the normal operating process of Production Line 2, the differences can
be acknowledged and included in the baseline to be notified if any change occurs.
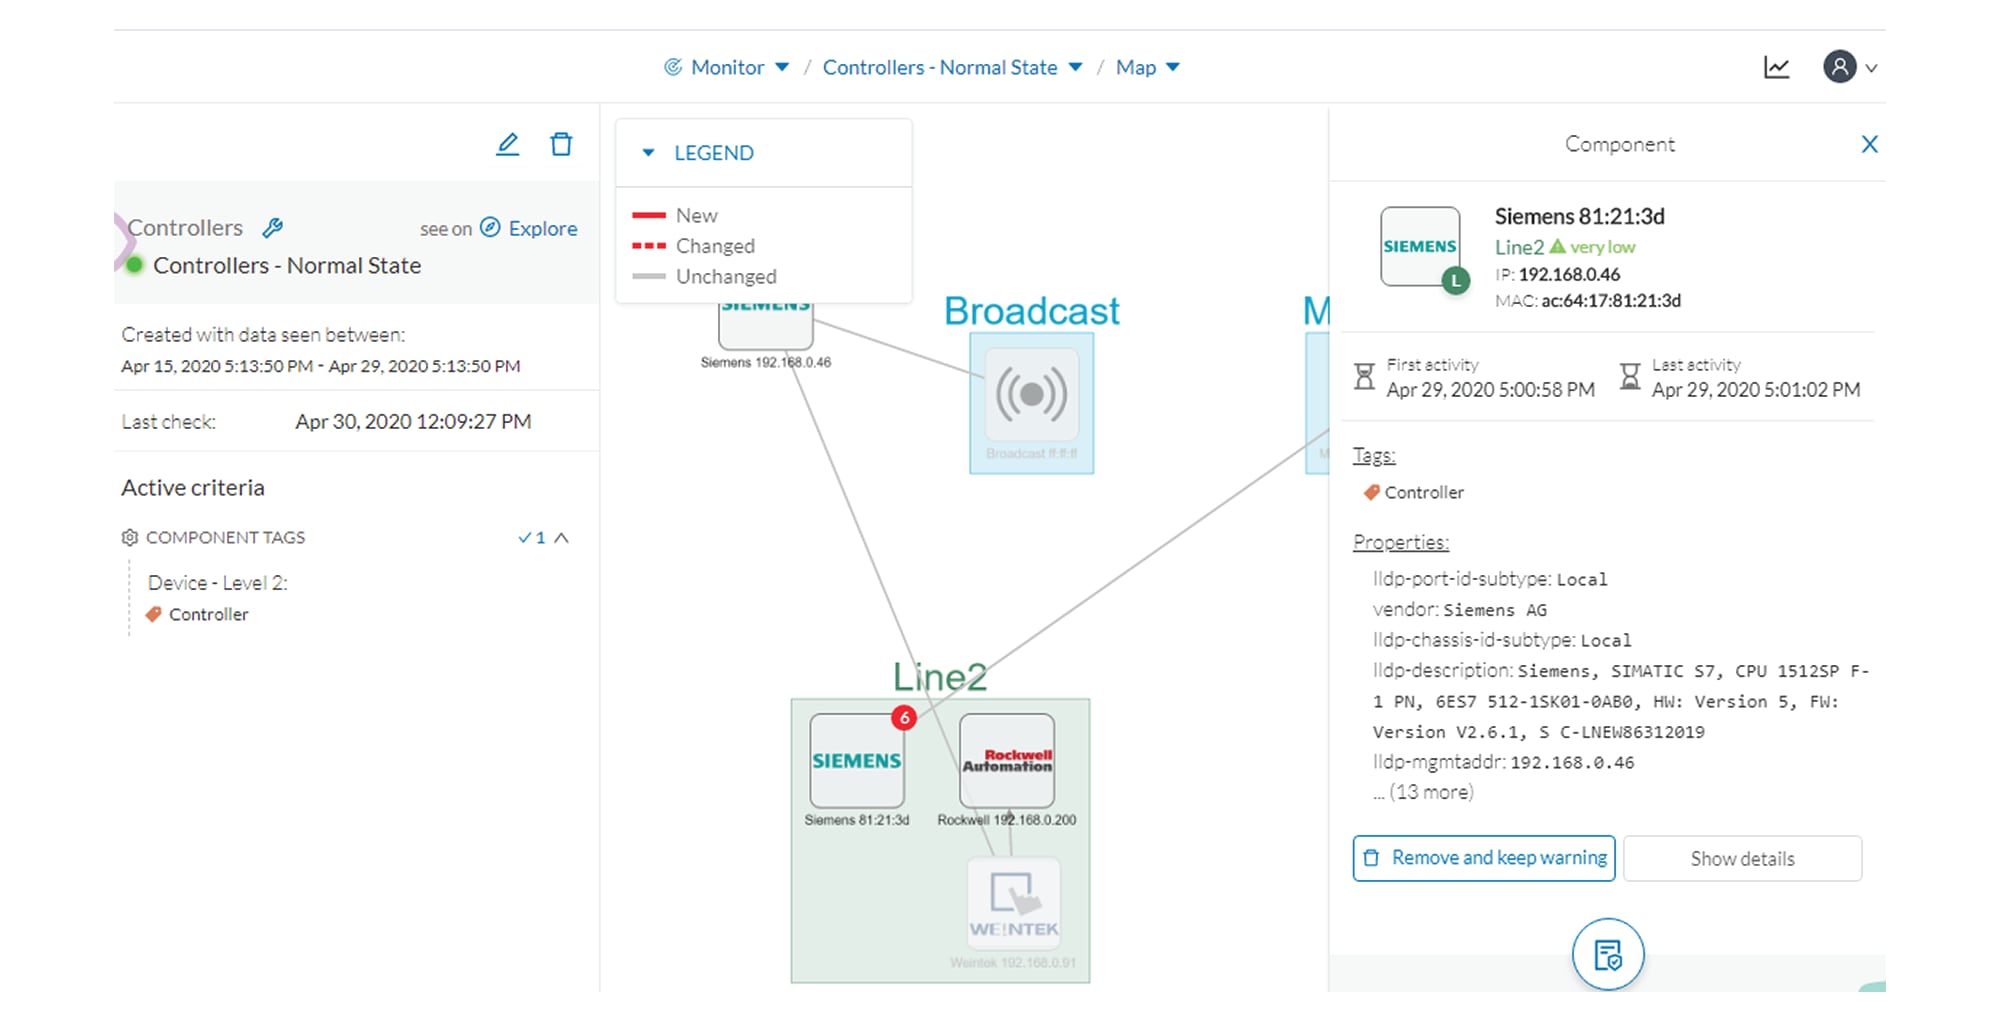
We return to the Explore mode and add the component into the Line 2 group.
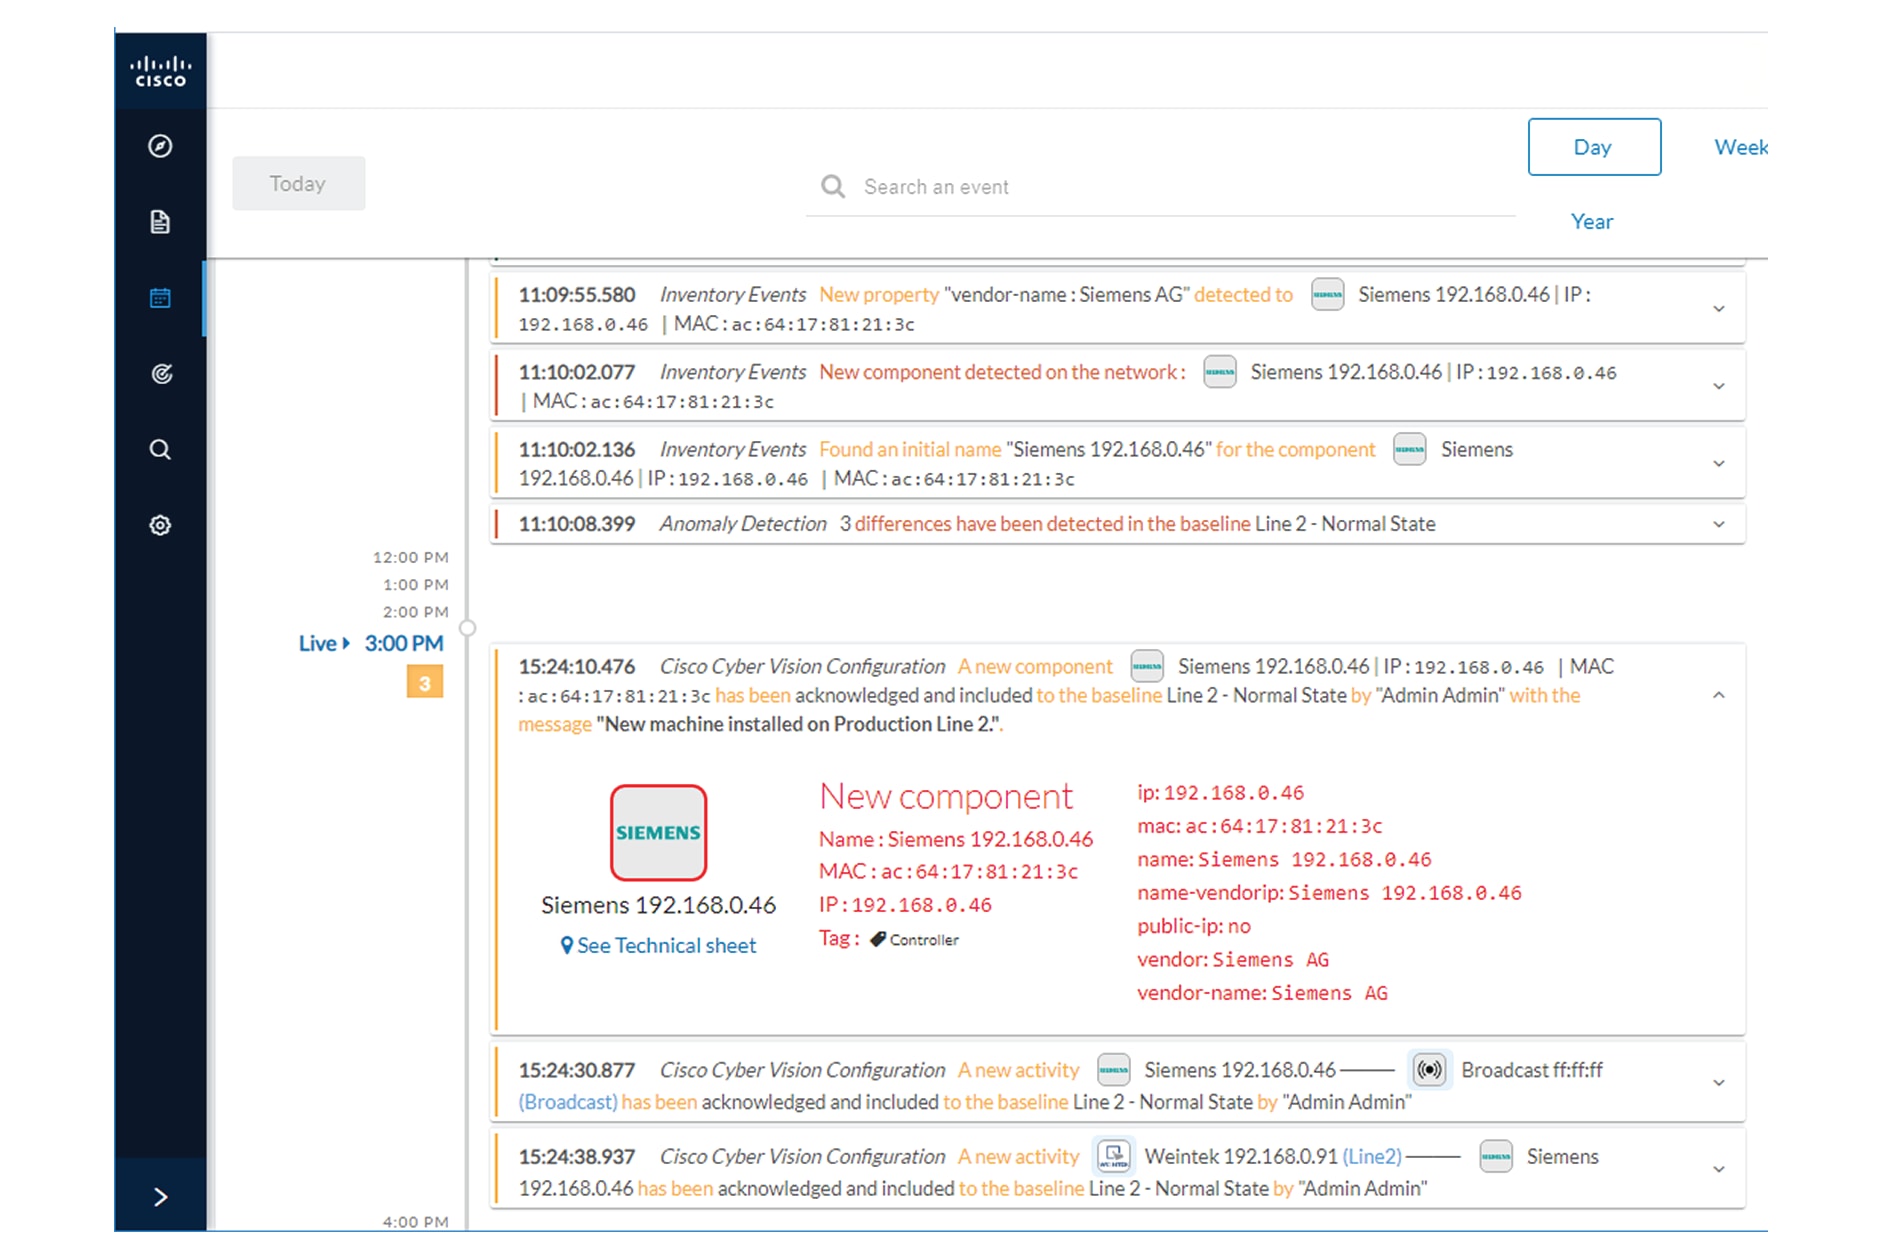
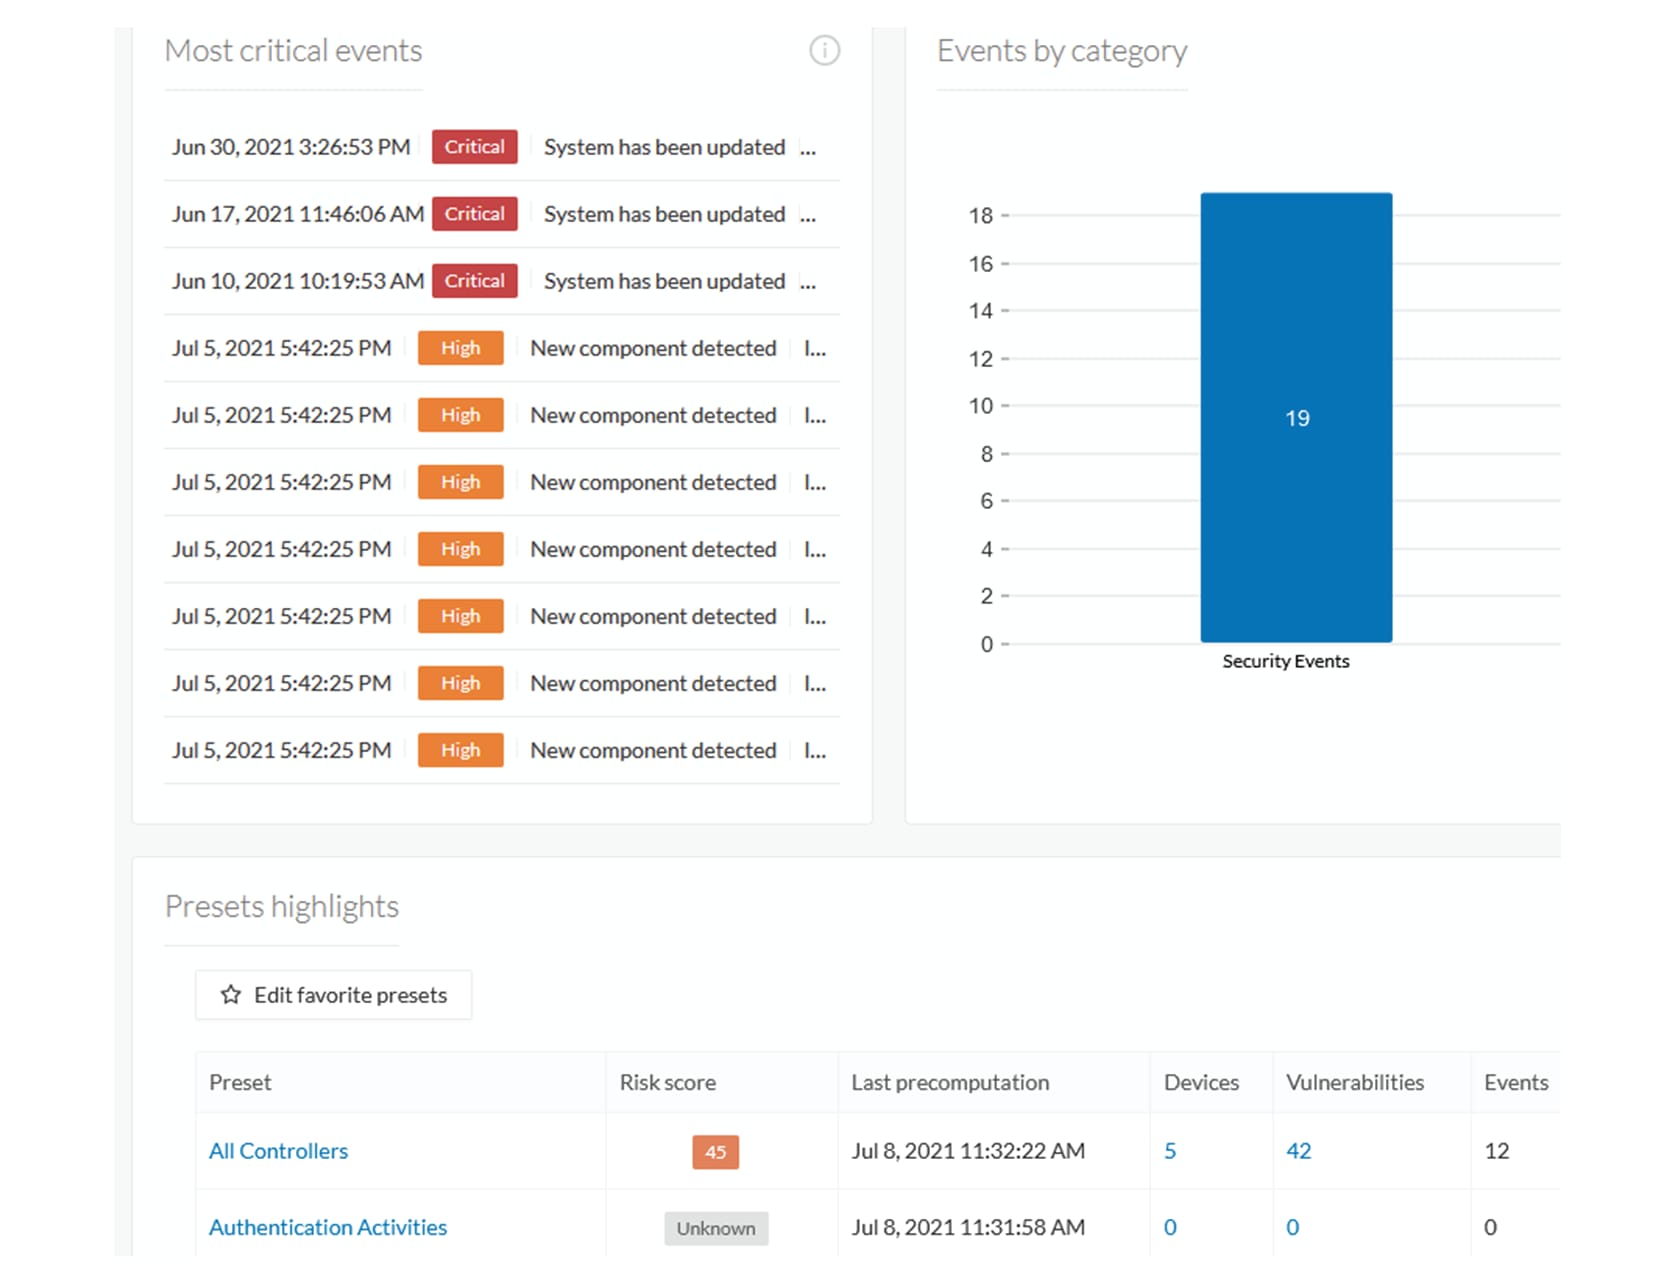
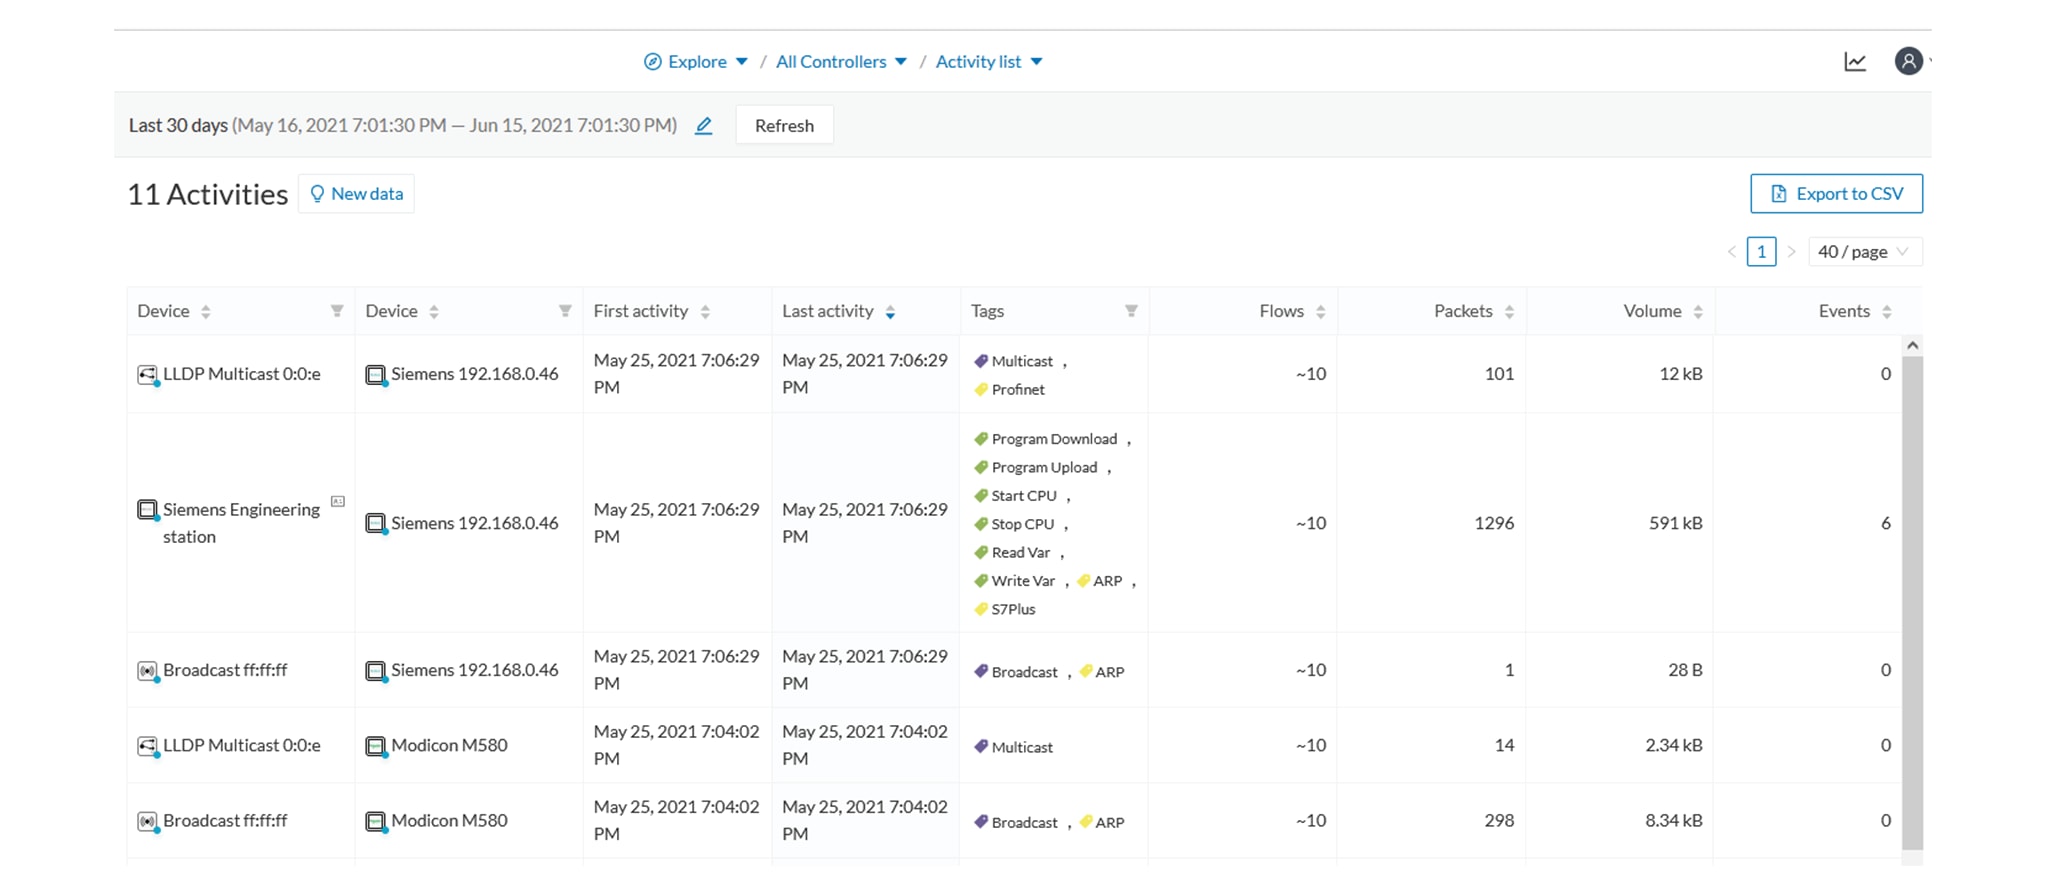
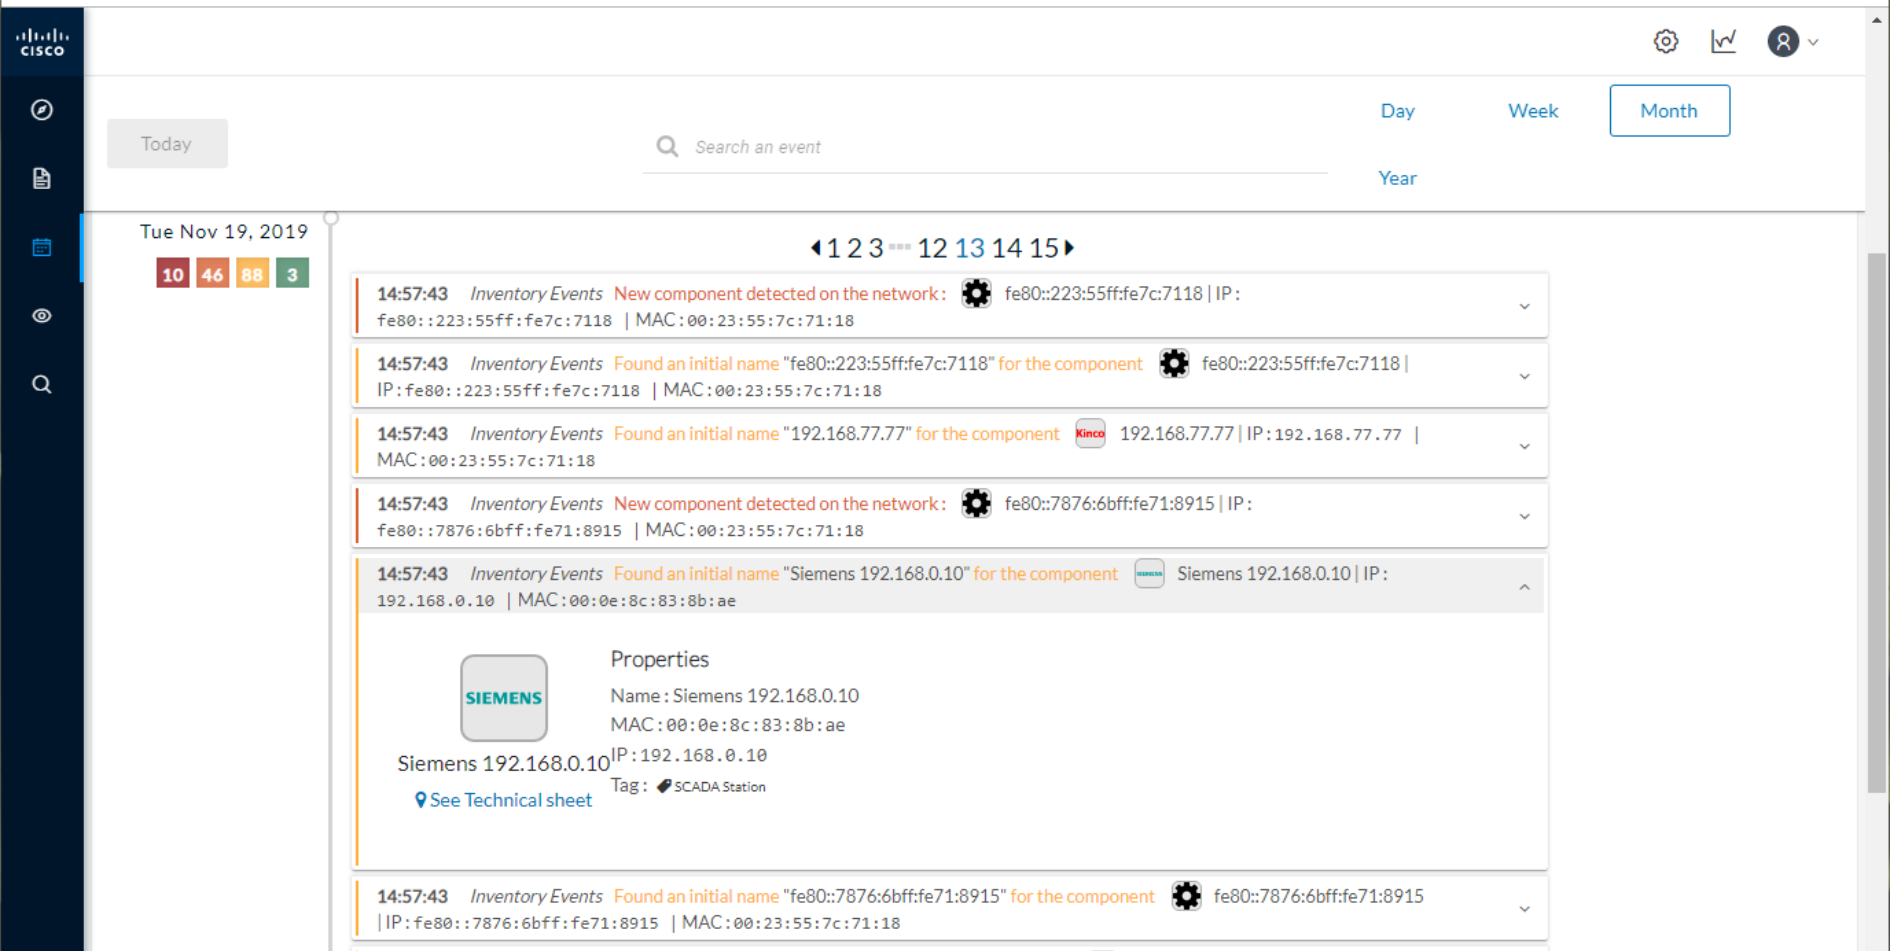
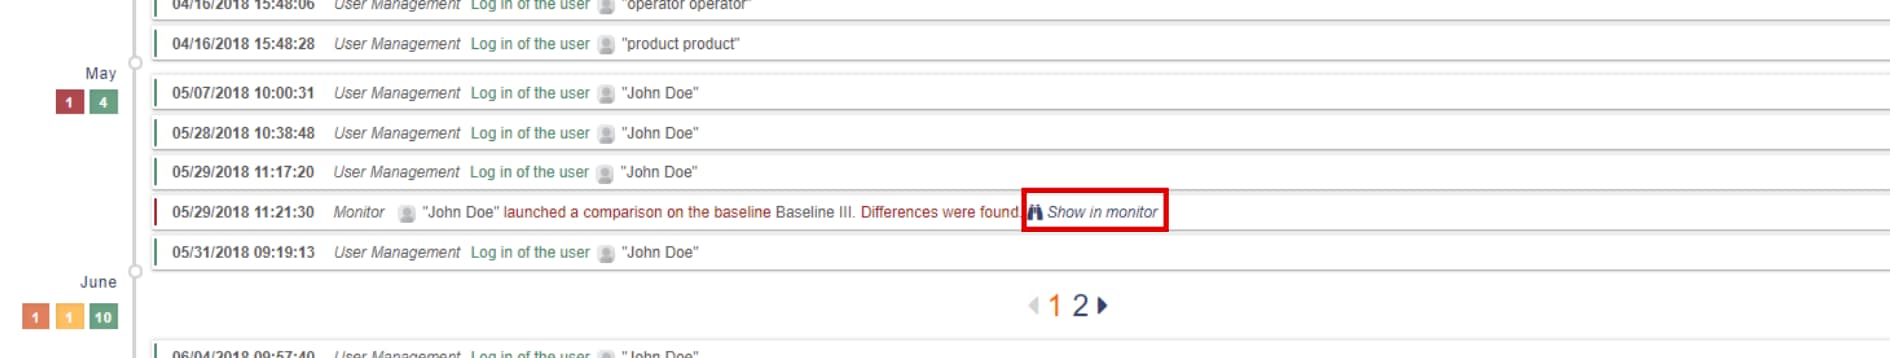
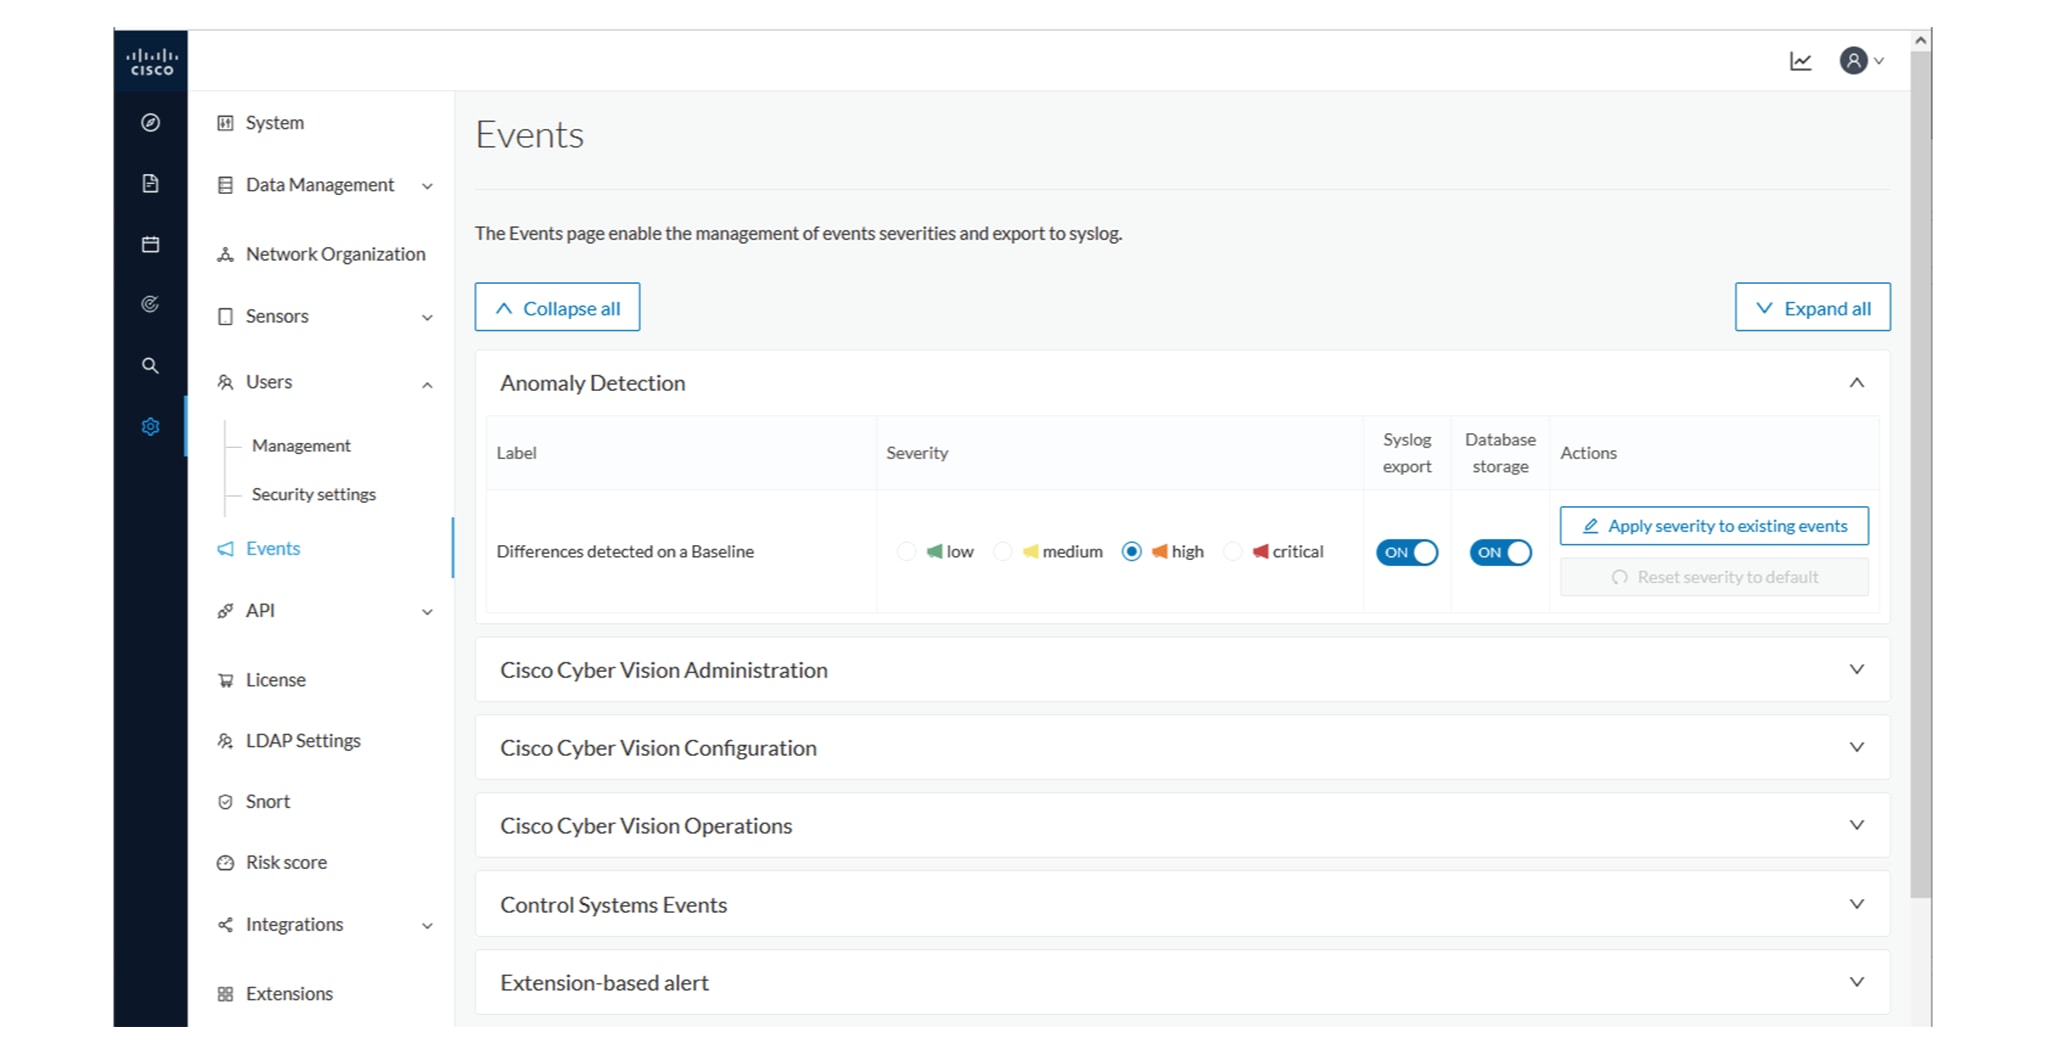
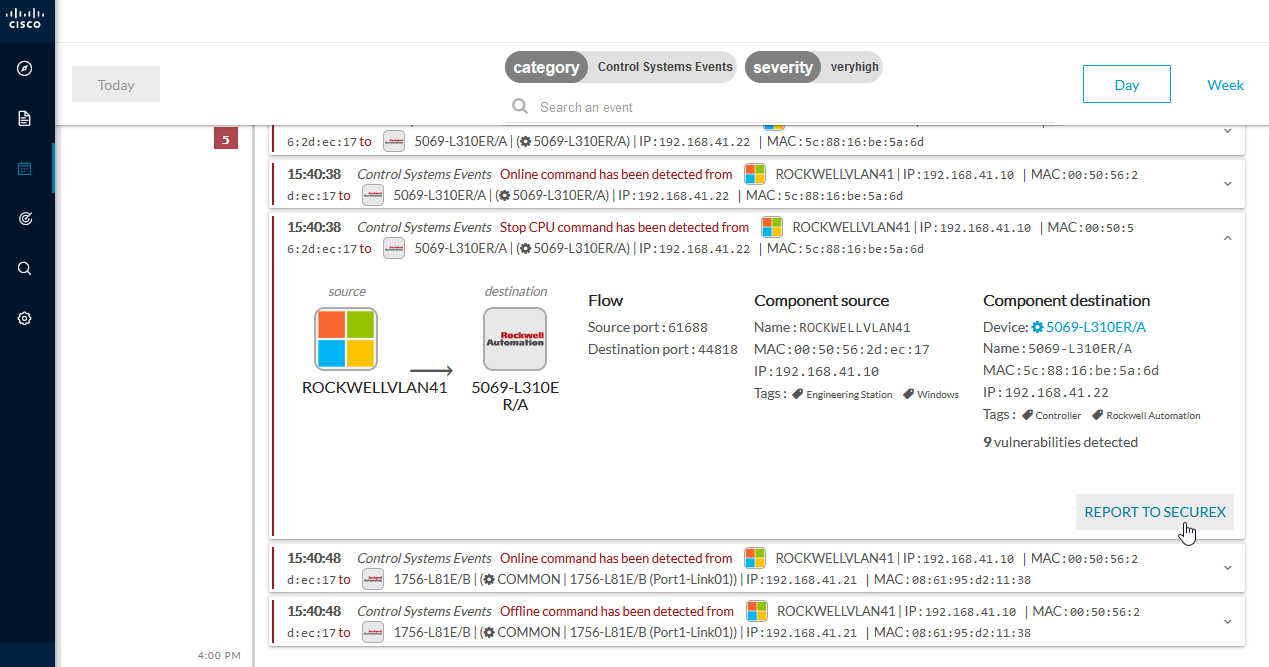
Eventually, we access the Events page and see that all previous actions are reported here, from the detection of a new component
and activities on the network, to adding the component into the group Line 2.


 Feedback