Events

Cisco Cyber Vision provides many events significant for the network security especially the ones which relate to the industrial activity (such as New program downloaded/uploaded, New start/stop CPU command, New init command...). Many other events are also available such as events related to vulnerabilities, comparison results, sensors activity, etc.

Refer to the events administration page on the GUI to see all events available. To do so, refer to the Cisco Cyber Vision Administration Guide.

The Events page provides two views to give high visibility on these events:

  • The Dashboard: a visual and continuously-updated view of the current state of the installation based on the number of events (by severity and over time).

  • The Calendar: a chronological and continuously-updated view of the events within which you can search events.

The Dashboard

Events are presented in the Dashboard under doughnut and line charts.

Doughnut charts present events numbers and percentages per categories and severities.

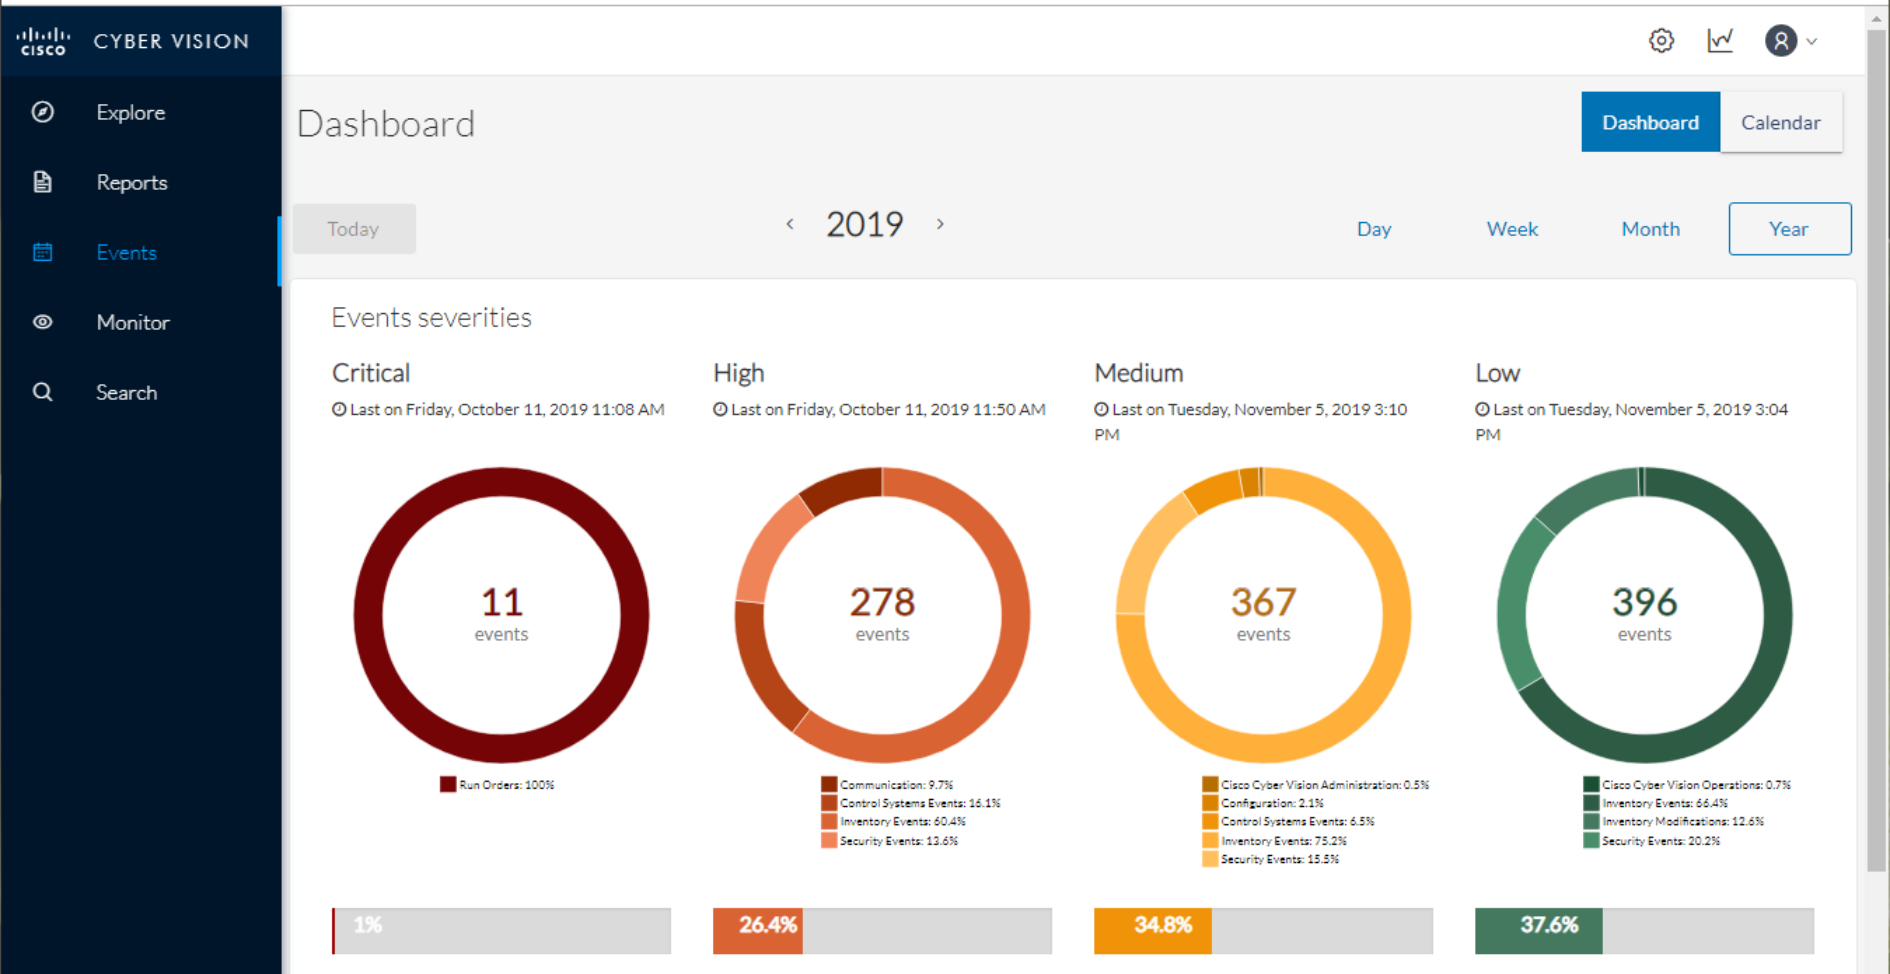
You can see the list of events per categories in the events administration page. To do so, refer to the Cisco Cyber Vision Administration Guide.

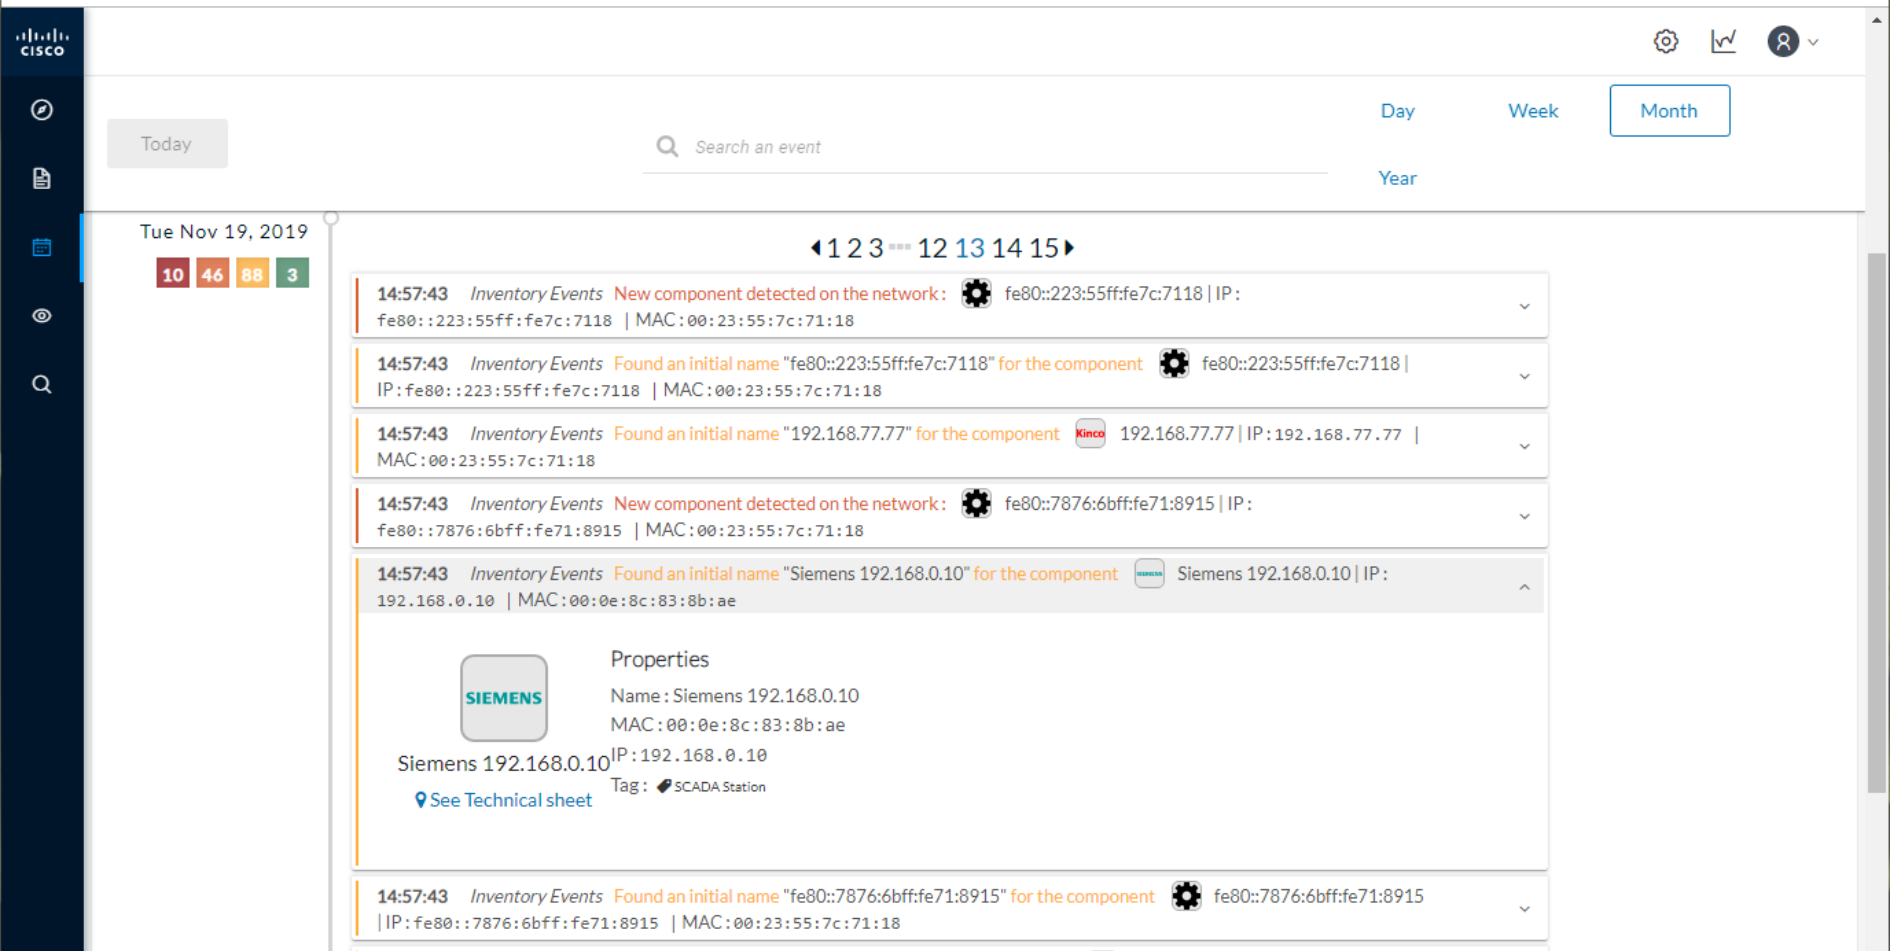
Clicking the doughnut redirects you to the Calendar view that is filtered with the corresponding category and severity so you can quickly access more events details.

Below, the line chart puts an emphasis on the number of events per severity over time.

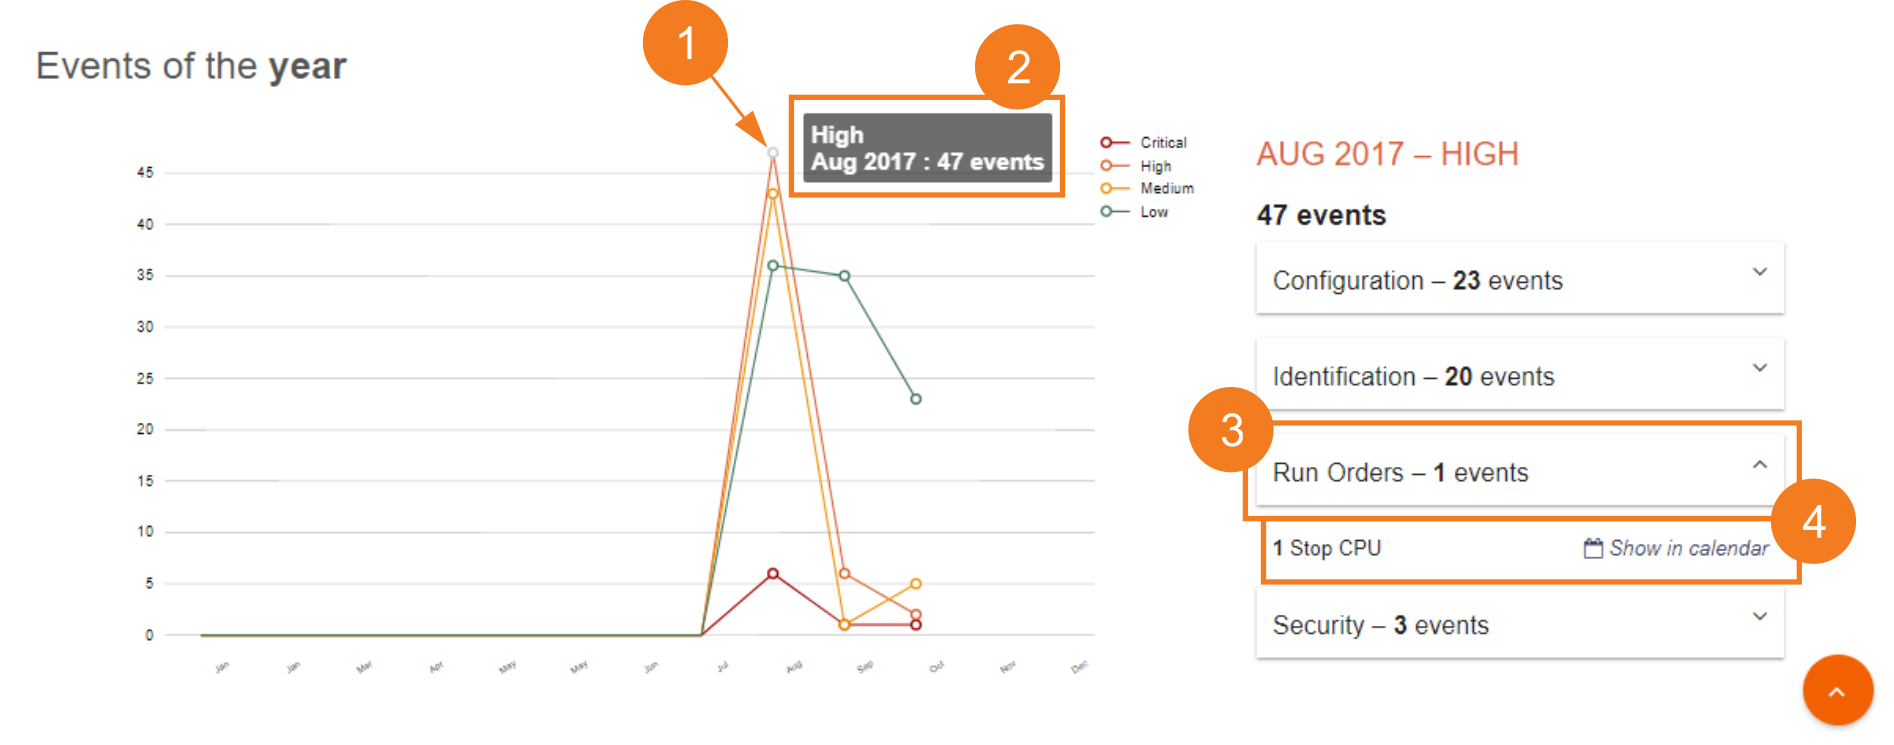
Clicking event markers (1) on the line chart lets you see the number of events per category according to a specific time (2).

Click a category event tab (3) to see events details in the Calendar view by means of the link "Show in calendar" (4). Events will be filtered with the corresponding category, severity and event type.

The Calendar

The Calendar is a chronological view in which you can see and search events. Use the search bar to search events by MAC and IP addresses, component name, destination and source flow, severity and category.

You can also see events that have happened during the day, week, month and year.

Clicking on a result event will show you details about the event.

When an event is related to a component or an activity, you can jump to its technical sheet by clicking See technical sheet.

When a Monitor event is generated, the short description includes a link to view the differences in the Monitor page.