Cisco Security Analytics and Logging

About Security Analytics and Logging (SaaS) in Security Cloud Control

Terminology Note: In this documentation, when Cisco Security Analytics and Logging is used with the Secure Cloud Analytics portal (a software as a service product) you will see this integration referred to as Cisco Security Analytics and Logging (SaaS) or SAL (SaaS).

Cisco Security Analytics and Logging (SAL) allows you to capture connection events from all of your Catalyst SD-WAN devices and view them in one place in Security Cloud Control. The events are stored in the Cisco cloud and viewable from the Event Logging page in Security Cloud Control, where you can filter and review them to gain a clear understanding of what security rules are triggering in your network.

With additional licensing, after you capture these events, you can cross-launch from Security Cloud Control to a Secure Cloud Analytics portal provisioned for you. Secure Cloud Analytics is a software as a service (SaaS) solution that tracks the state of your network by performing a behavioral analysis on events and network flow data. By gathering information about your network traffic from sources including firewall events and network flow data, it creates observations about the traffic and automatically identifies roles for network entities based on their traffic patterns. Using this information combined with other sources of threat intelligence, such as Talos, Secure Cloud Analytics generates alerts, which constitute a warning that there is behavior that may be malicious in nature. Along with the alerts, Secure Cloud Analytics provides network and host visibility, and contextual information it has gathered to provide you with a better basis to research the alert and locate sources of malicious behavior.

Event Types in Security Cloud Control

When filtering the security events logged in Secure Logging Analytics (SaaS), you can choose from a list of Catalyst SD-WAN event types that Security Cloud Control supports. From the Security Cloud Control menu, navigate Analytics > Event Logging and click the filter icon to choose events.

Note that the Catalyst SD-WAN device currently logs only connection events under SD-WAN event types. SD-WAN Catalyst device do not support sending syslog events to Security Cloud Control. To learn more about syslog ID for Catalyst SD-WAN events, see Cisco Catalyst SD-WAN Monitor and Maintain Configuration Guide.

You can generate events for connections as users generate traffic that passes through the system. Enable connection logging on access rules to generate these events. You can also enable logging on Security Intelligence policies and SSL decryption rules to generate connection events.

Connection events contain data about the detected sessions. The information available for any individual connection event depends on several factors, but in general includes:

  • Basic connection properties: timestamp, source and destination IP address, ingress and egress zones, the device that handled the connection, and so on.

  • Additional connection properties discovered or inferred by the system: applications, requested URLs, or users associated with the connection, and so on.

  • Metadata about why the connection was logged: which configuration handled the traffic, whether the connection was allowed or blocked, details about encrypted and decrypted connections, and so on.

Security Analytics and Logging license and Data Storage Plans

To obtain Security Analytics and Logging entitlement, you can purchase one of the following licenses:

  • Security Cloud Control Device License Subscription with Unlimited Logging: This license combines Cisco Defense Orchestrator management license for managing Cisco firewalls device with unlimited volume of event logging. By default, 90 days of storage retention is available with this license. You have the option to extend log retention period to 1, 2, or 3 years by purchasing additional data retention extension licenses.

  • Cisco Logging and Troubleshooting License Subscription: This license supports logging 1 GB volume per day with 90 days of storage retention. You can extend log retention to 1, 2, or 3 years by purchasing additional data retention extension licenses.

For more information, see About Security Cloud Control Licenses.

You need to purchase a data storage plan that corresponds to the volume of events the Cisco cloud receives from your onboarded security devices on a daily basis. This volume is referred to as your daily ingest rate. Data plans are available in whole number amounts of GB/day and in 1-, 3-, or 5-year terms. The most effective method to determine your ingest rate is to participate in a free trial of Secure Logging Analytics (SaaS) before making a purchase. This trial will provide an accurate estimate of your event volume.

With Security Cloud Control device license subscription, you receive 90 days of rolling data storage. This policy ensures that the most recent 90 days of events are stored in the Cisco cloud, and data older than 90 days is deleted.

You have the option to upgrade to additional event retention beyond the default 90 days or to increase daily volume (GB/day) through a change order to an existing subscription. Billing for these upgrades will be prorated for the remainder of the subscription term.

See the Subscriptions section of Guidelines for Quoting Secruity Cloud Control Products for more information about the storage and subscription plans.


Note


If you have a Security Analytics and Logging license and data plan, then obtain a different Security Analytics and Logging license, you are not required change your data plan. Similarly, if your network traffic throughput changes and you obtain a different data plan, this change alone does not require you to obtain a different Security Analytics and Logging license.


What data gets counted against my allotment?

All events sent to the Secure Event Connector accumulate in the Secure Logging Analytics (SaaS) cloud and count against your data allotment.

Filtering what you see in the events viewer does not decrease the number of events stored in the Secure Logging Analytics (SaaS) cloud, it reduces the number of events you can see in the events viewer.

We're using up our storage allotment quickly, what can we do?

Here are two approaches to address that problem:

  • Request more storage.

  • Consider reducing the number of rules that log events. You can log events from SSL policy rules, security intelligence rules, access control rules, intrusion policies, and file and malware policies. Review what you are currently logging to determine if it is necessary to log events from as many rules and policies.

View Security Analytics and Logging License Information

View your Security Analytics and Logging license information such as the entitled monthly storage limit and the event storage retention period. If you do not have a separate Security Analytics and Logging license and data plan, the 90-day rolling data storage details appear in the licensing information.

Procedure


Step 1

From the left navigation bar, click Administration > Logging Settings.

Step 2

Click the View Logging Storage Usage button.

Tip


Alternatively, navigate to Events & Logs > Events > Event Logging from the left navigation bar, and then click the Storage Utilization button to view the Security Analytics and Logging license information.


Extend Event Storage Duration and Increase Event Storage Capacity

To extend your rolling event storage or increase the amount of event cloud storage, do the following steps:

Procedure


Step 1

Log in to your account on Cisco Commerce.

Step 2

Select your Security Cloud Control PID.

Step 3

Follow the prompts to upgrade the length or capacity of your storage capacity.

The increased cost will be pro-rated based for the term remaining on your existing license. See the Guidelines for Quoting Cisco Defense Orchestrator Products for detailed instructions.


View Security Analytics and Logging Alerts

View alerts and notifications for the Security Analytics and Logging configurations and event settings for the managed firewall devices.

Procedure


Step 1

From the left navigation bar, click Administration > Logging Settings.

Step 2

Click the View Logging Storage Usage button.

Tip


Alternatively, navigate to Events & Logs > Events > Event Logging from the left navigation bar, and then click the Storage Utilization button to view the Security Analytics and Logging license information.

The Alerts and Notifications section displays alerts about the settings that impact event logging, enabling you to take action to resolve any issues. Some of these settings include:

  • Sending events to cloud setting is disabled.

  • Sending events to the cloud setting is disabled at device level.

  • Secure Event Connector becomes unavailable.

  • Increase in events ingestion rate.


View Security Analytics and Logging Storage Usage and Event Ingest Rate

View the current Security Analytics and Logging storage utilization and analyze event logging trends. You can analyze the storage utilization trends by event type, device type, and individual devices to gain deeper insights into storage utilization patterns. Use the data visualizations for quick and easy analysis, enabling you to assess the current storage capacity and take measures to reduce the logging rate if the storage utilization approaches the limits that are specified in your Security Analytics and Logging license.

Procedure


Step 1

From the left navigation bar, click Administration > Logging Settings.

Step 2

Click View Logging Storage Usage.

Tip


Alternatively, navigate to Events & Logs > Events > Event Logging from the left navigation bar, and then click the Storage Utilization button to view the Security Analytics and Logging storage usage and event ingestion trends.

Step 3

Use the following dashboards to customize and analyze the storage utilization and gain more insights into the event logging trends in your firewall deployment:

  • Usage Trends: Displays the event logging storage usage for the last 12 months. Hover over a bar to see the data usage for the corresponding month.

  • Events per second (EPS) trends: Displays the event ingest rate for the onboarded devices. Customize your events per second trends view for a specific time period or for a specific device to get more granular data. You can filter the data for the last 1 week, 2 weeks, 3 weeks, or 1 month.

    Note


    The device drop-down list displays the managed firewall devices that are sending events to the Cisco Security Cloud.

  • Utilization by event type trends: Displays event data storage used, in bytes per day, for different event types. Use this widget to monitor storage use by event types and identify surges, if any, or unusual changes in storage use for specific event types. This insight enables you to adjust logging settings for a specific event type and manage storage use.

  • Utilization by device type trends: Displays event data storage used, in bytes per day, for each managed device type. Use this widget to monitor storage use by the device type and identify surges, if any, or unusual changes in storage use for a specific type of device.

  • Utilization by device trends: Displays event data storage used, in bytes per day, for each security device that sends events to Security Cloud Control. This widget focuses on devices with storage use exceeding the average bytes per second value, showing only the top five devices to improve usability. Use this widget to monitor storage use for each device and identify surges or unusual changes. This insight allows you to adjust logging settings for specific devices and manage storage use effectively.


Deprovisioning Cisco Security Analytics and Logging (SaaS)

If you allow your Cisco Security Analytics and Logging (SaaS) paid license to lapse, you have a grace period of 90 days. If you renew your paid license during this grace period, there is no interruption in your service.

Otherwise, if you allow the 90-day grace period to elapse, the system purges all of your customer data. You can no longer view Catalyst SD-WAN events from the Event Logging page, nor have dynamic entity modeling behavioral analytics applied to your Catalyst SD-WAN events and network flow data.

About Security Analytics and Logging for Catalyst SD-WAN

The Secure Router integrates firewall capabilities into its architecture, ensuring robust security across distributed networks.

  • Catalyst SD-WAN integrates security features directly into the SD-WAN fabric, enabling secure Direct Internet Access (DIA) and Direct Cloud Access (DCA).

  • It includes next-generation firewall, integrated intrusion prevention capabilities, and URL filtering.

  • The Catalyst SD-WAN platform enables you to enforce centralized policies for all users, extending enterprise VPN architectures into your private cloud.

Onboard the Catalyst SD-WAN Manager to Security Cloud Control Firewall Management for managing the security capabilities of the managed devices. You can view the security events from Catalyst SD-WAN with Security Analytics and Logging for monitoring and threat detection. The events get stored in the Security Analytics and Logging cloud data store, and you can view them in the Event Logging page in Security Cloud Control, where you can filter and analyze them to identify security rules getting triggered in your network.

How Catalyst SD-WAN Router Share Events with Security Cloud Control Firewall Management

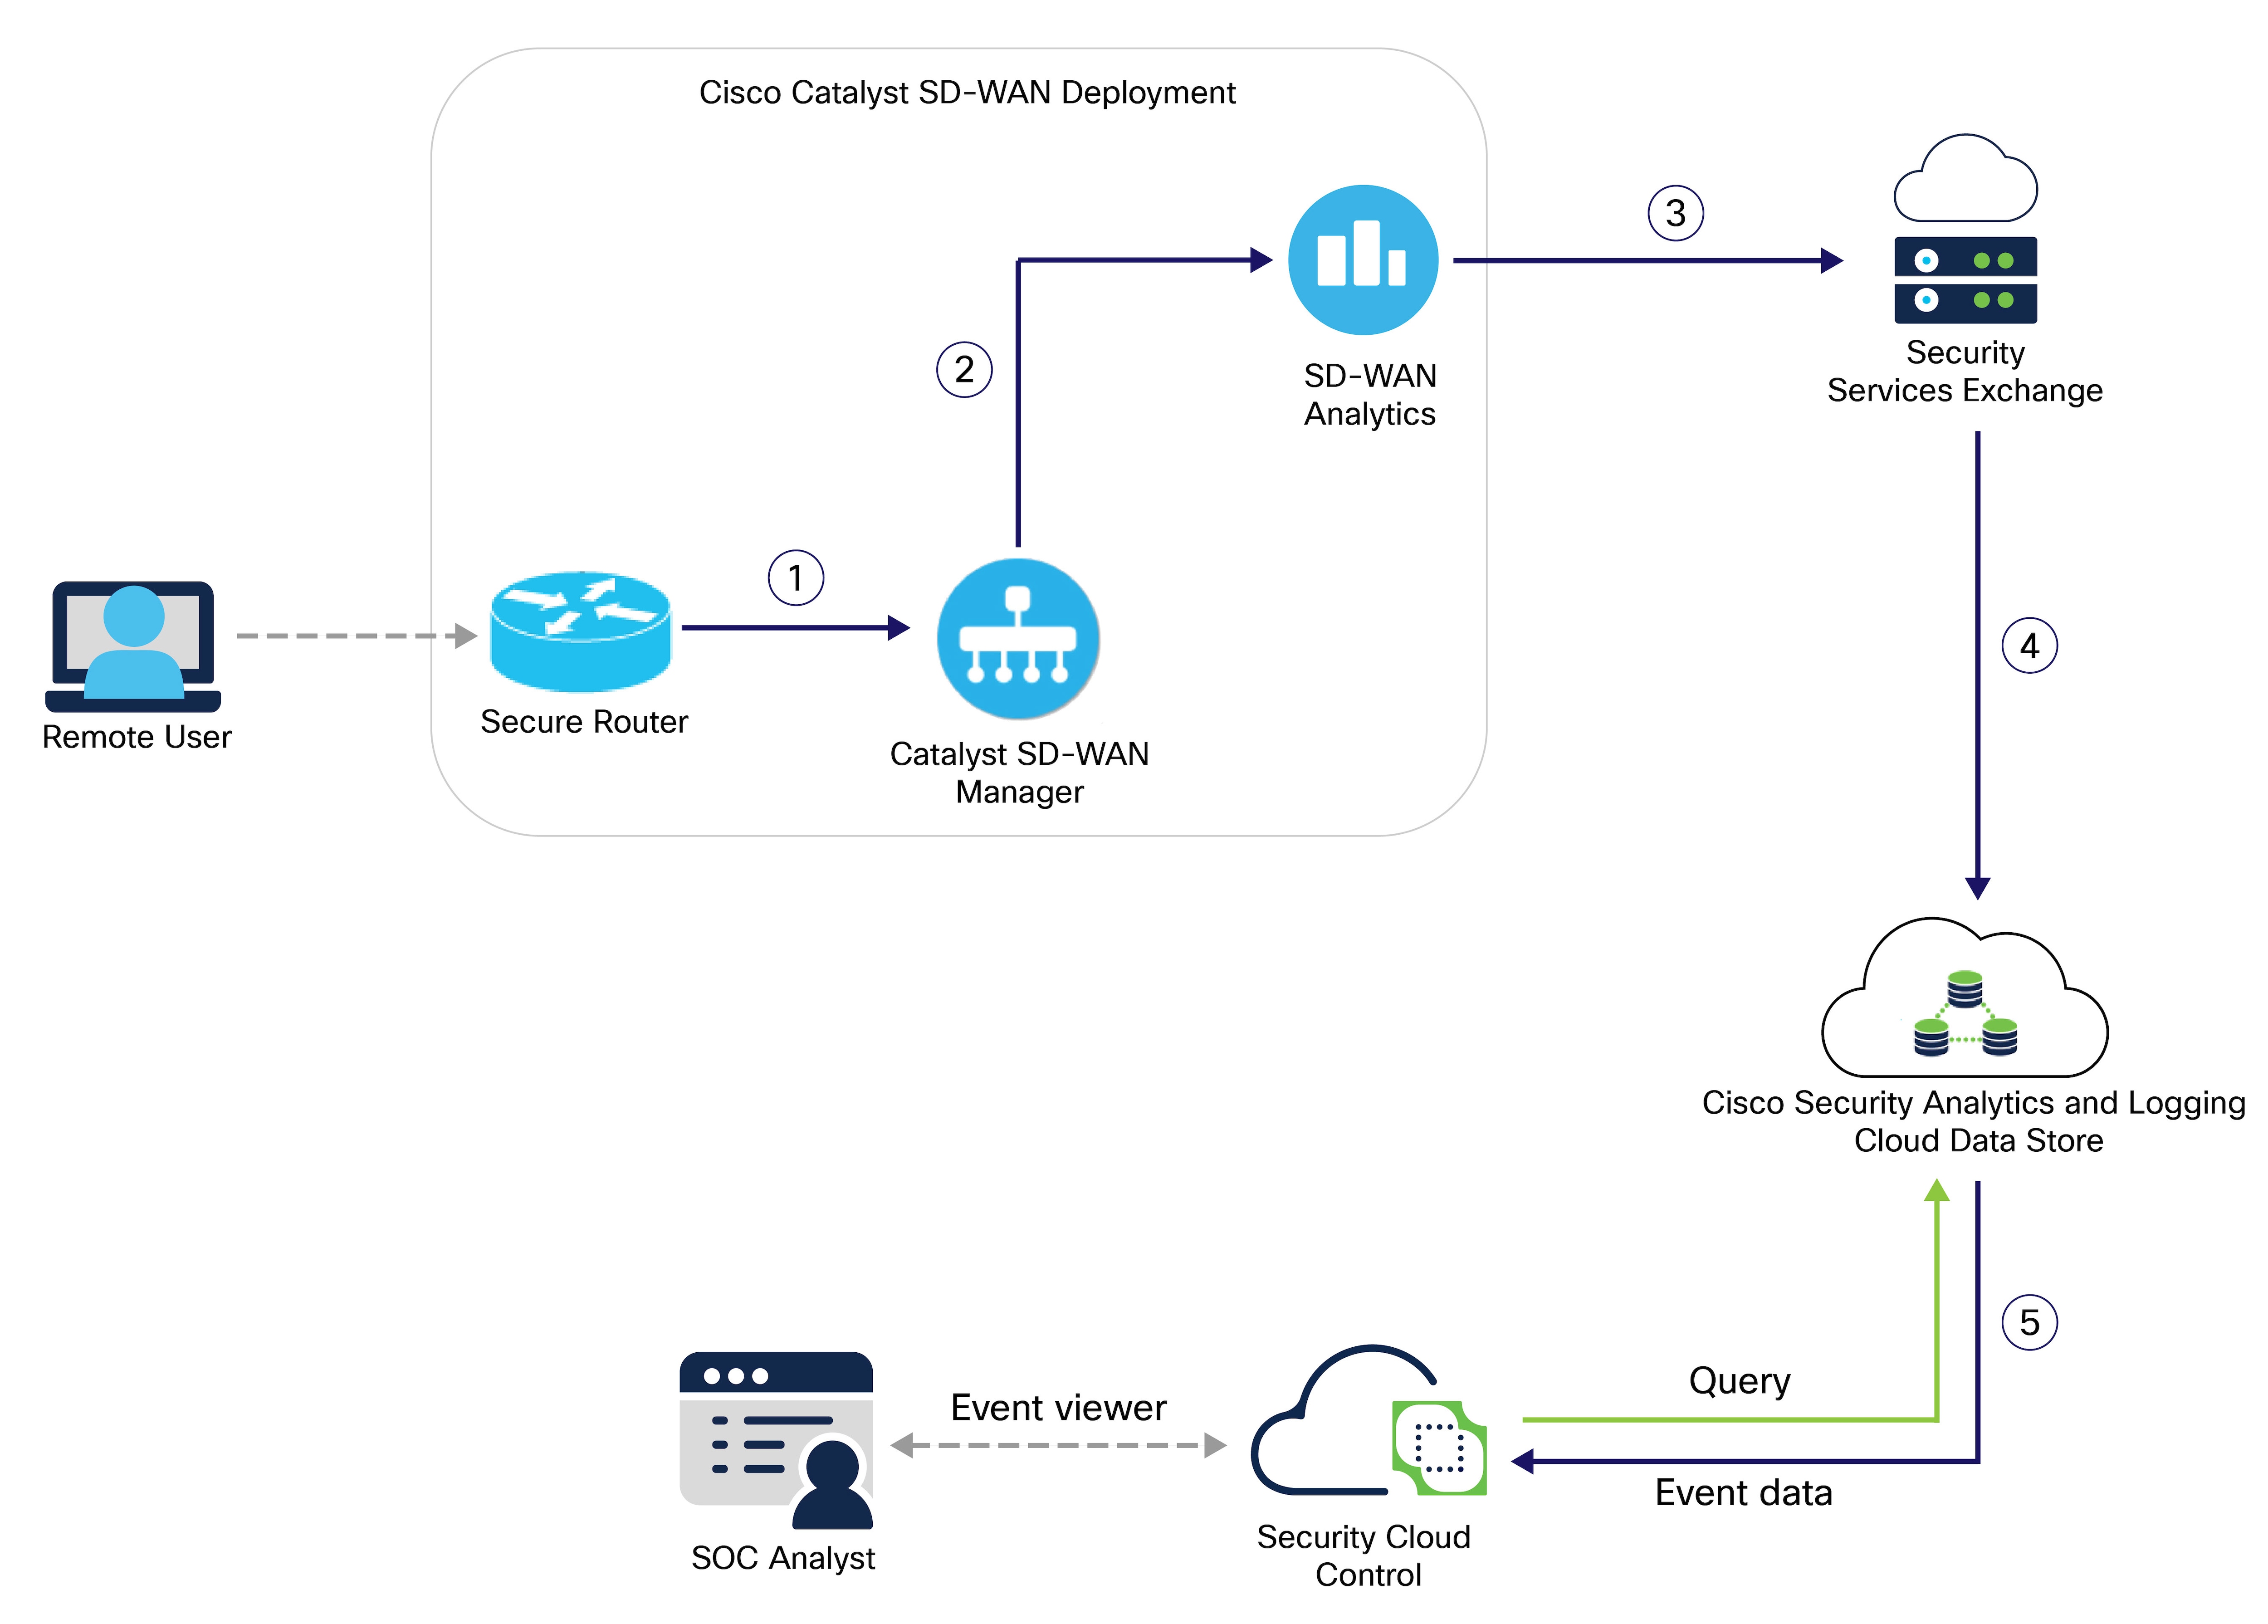
The following diagram describes how Catalyst SD-WAN shares security events with Security Cloud Control Firewall Management.

Figure 1. Event Flow from Catalyst SD-WAN to Security Cloud Control

Step

Description

1

A remote user accesses the network and the Catalyst SD-WAN device generates event log for the corresponding traffic. The device then exports the event data to a PSV file and sends it to the Catalyst SD-WAN Manager.

2

Catalyst SD-WAN Manager sends the event data to the SD-WAN Analytics cloud.

3

SD-WAN Analytics stores the event data in cloud to make it accessible for Security Services Exchange and notifies Security Services Exchange.

After receiving the notification from SD-WAN Analytics cloud, Security Services Exchange downloads the event data from SD-WAN AWS cloud.

4

Security Services Exchange converts the event data from PSV to JSON format and sends it to Cisco Security Analytics and Logging (SaaS).

5

Security Analytics and Logging (SaaS) process the event data using various services to classify and enrich it for use by the Security Cloud Control.

It stores the event data in the cloud data store, which is queried by the event viewer to provide SOC analysts with the relevant event data.

Prerequisites

View Catalyst SD-WAN Events in Security Cloud Control Firewall Management

Before you begin

Ensure that you have met all the requirements described in Prerequisites.

Procedure


Step 1

In the navigation pane, choose Events & Logs > Events > Event Logging.

Step 2

Click the filter () icon.

Step 3

Scroll to the Catalyst SD-WAN Events section and check the Connection check box.