- Preface
- Introduction
- Creating and Analyzing Networks
- Viewing Network Reports
- Editing a Project
- Modeled Network Examples
- GUI Information and Shortcuts
- Cards and Pluggables
- Troubleshooting
- Third-Party DWDM Wavelength Interface Model
- Configuring CTP to Run on a Server
- Pay As You Grow Licensing
- OSMINE Layout Rules
- Index
Cisco Transport Planner DWDM Operations Guide, Software Release 10.6
Bias-Free Language
The documentation set for this product strives to use bias-free language. For the purposes of this documentation set, bias-free is defined as language that does not imply discrimination based on age, disability, gender, racial identity, ethnic identity, sexual orientation, socioeconomic status, and intersectionality. Exceptions may be present in the documentation due to language that is hardcoded in the user interfaces of the product software, language used based on RFP documentation, or language that is used by a referenced third-party product. Learn more about how Cisco is using Inclusive Language.
- Updated:
- January 26, 2017
Chapter: Viewing Network Reports
- Types of Reports
- Viewing Reports
- Viewing the Summary Report
- Saving the NE Update File
- Viewing the Installation Parameters
- Viewing Internal Connections
- Viewing the Traffic Matrix Report
- Viewing the Layout of Single Site
- Exporting the Layout Report for Multiple Sites
- Viewing Power Consumption from the Layout Report
- Viewing the Link Availability Report
- Viewing Optical Results
- Viewing Wavelength Routing
- Viewing the Ethernet Aggregated Demand Report
- Viewing the TDM Aggregated Demand Report
- Viewing Any-to-Any Finalized Circuits
- Viewing Report Differences
Viewing Network
Reports
Cisco Transport Planner provides the reports listed in Report Availability table. Report availability depends on whether a network has been analyzed or whether it is in the Install or Upgrade state. Reports are also available by site. See Report Availability table in Types of Reports section for report availability details.
Types of Reports
The various reports available are listed in the table below.
|
Report |
Network Availability |
Site Availability |
|---|---|---|
|
NE Update |
Analyzed |
— |
|
Installation Parameters |
Analyzed |
Analyzed |
|
Traffic Matrix |
Analyzed |
Analyzed |
|
Layout |
Install, Upgrade, and Analyzed |
Install, Upgrade, and Analyzed |
|
Link Availability |
Analyzed |
Analyzed |
|
Internal Connections |
Analyzed |
— |
|
Optical Results |
Analyzed |
Analyzed |
|
Wavelength Routing |
Analyzed |
— |
|
Summary |
Install, Upgrade, and Analyzed |
Install, Upgrade, and Analyzed |
|
Bill of Material |
Install, Upgrade, and Analyzed |
Install, Upgrade, and Analyzed |
|
Ethernet Aggregated Demand |
Analyzed |
— |
|
TDM Aggregated Demand |
Analyzed |
— |
|
Any-to-Any Finalized Circuits |
Analyzed |
Analyzed |
For more information on the Bill of Materials report, see the Viewing a BoM section. In addition, you can compare the following reports using the Reports Diff tool: Bill of Material, Internal Connections, and Installation Parameters.
To complete the procedures in this section, you must have a project open and the network(s) loaded. See the Opening a Project section and the Loading and Unloading Networks section.
Viewing Reports
The following procedures use the Tasks pane to access reports. You can also access reports by clicking the desired report in the Reports folder in the Project Explorer pane.
- Viewing the Summary Report
- Saving the NE Update File
- Viewing the Installation Parameters
- Viewing Internal Connections
- Viewing the Traffic Matrix Report
- Viewing the Layout of Single Site
- Exporting the Layout Report for Multiple Sites
- Viewing Power Consumption from the Layout Report
- Viewing the Link Availability Report
- Viewing Optical Results
- Viewing Wavelength Routing
- Viewing the Ethernet Aggregated Demand Report
- Viewing the TDM Aggregated Demand Report
- Viewing Any-to-Any Finalized Circuits
- Viewing Report Differences
Viewing the Summary Report
The Summary report summarizes design information, optical results, design cost, and analyzer messages. You can view it before or after you analyze a network. It automatically appears when you analyze a network. Use the following procedure to view the report at another time:
| Step 1 | Complete one of
the following:
To view the Summary report for a network, click the Mgmt Tree tab and click the network. To view the Summary report for a site, click the NtView Name tab and click the site. | ||||||||||
| Step 2 | In the
Tasks pane, click
Summary. The Summary tab appears.
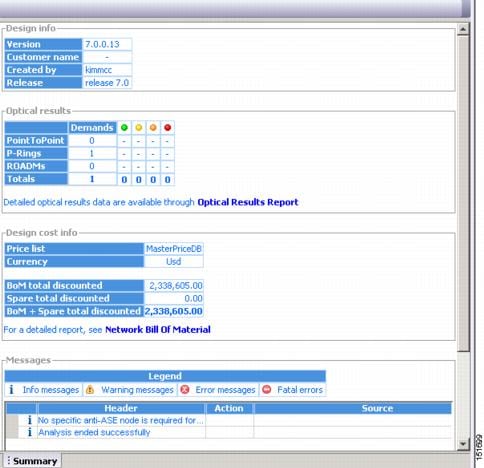 The following table lists the categories in the Summary tab and their descriptions.
|
Saving the NE Update File
After Cisco Transport Planner completes network analysis, you can create a configuration file. If the Optical Networking System (ONS) Software Release is 7.0 or a later release, a single XML file is created including all the automatic node setup (ANS) parameters for all the sites in the network. If you have chosen the Per Side Installation Parameter option in the Editing Network Parameters task, the installation parameters will include information about each side of the site. This file can be directly imported to a site using the NE Update feature in the Cisco Transport Planner (CTP), which uses this file to preprovision a node.
The configuration file is named as NeUpdate.xml by default. The list of reported installation parameters depend on the system release selected for the designed network. You generally save this file after you analyze an installed network.
Use the following procedure to save the NE Update file:
Viewing the Installation Parameters
The Installation Parameters reports shows the values to be set (provisioned) at installation time on each site in the network. These parameters are grouped under the network elements (NE) that are created after network analysis. These parameters are exported when you save the NE Update file and are used to automatically provision a node using CTC.
The NE Update file provides details of the parameters used to provision the passive units. The passive units are individually identified using the unit ID. The unit ID starts from 1 and gets incremented with the list of passive units present in that particular NE.
Passive units are optical devices that the controller card cannot manage and that are not configurable using software. The passive units that are provisioned in the ANP are:
- DCU units
- 15216-MD-40-ODD
- 15216-MD-40-EVEN
- 15216-EF-40-ODD
- 15216-EF-40-EVEN
- 15216-MD-48-ODD
- 15216-MD-48-EVEN
- PP-MESH-4/PP-MESH-8
- 15454-PP-4-SMR patch panel
 Note | CTP lists the passive units in Release 9.1 and later releases. |
Note | CTP allows you to change the Unit ID of any unit. For information on changing the unit ID, see Step 5 in the Viewing the Layout of Single Site section. |
Use the following procedure to view the installation parameters after a network has been analyzed:
| Step 1 | Complete one of the following: | ||||||||||||||||||||||||||
| Step 2 | In the
Tasks pane, click
Installation Parameters. The
Installation Parameters tab appears. The ANS view
subtab appears by default. This tab displays the Automatic Node Setup
information.
The table below describes the columns on the ANS view tab of the Installation Parameters report.
| ||||||||||||||||||||||||||
| Step 3 | Click the
ANP
view tab to view the Automatic Node Provisioning information. The
table below describes the columns on the ANP view tab of the Installation
Parameters report.
| ||||||||||||||||||||||||||
| Step 4 | Click the
PP
view tab to view the Provisioning Parameters information. The table
below describes the columns on the PP view tab of the Installation Parameters
report.
| ||||||||||||||||||||||||||
| Step 5 | To close the Installation Parameters report, click the X on the top right of the Installation Parameters tab. |
Viewing Internal Connections
Use the following procedure to view the network internal connections after a network has been analyzed.
Use this procedure to view patchcord connections related to optical amplifiers, optical filter units, connections with client interface units, transponders, line cards, pluggables, Multi-Shelf Management (MSM), and passive inventory units.
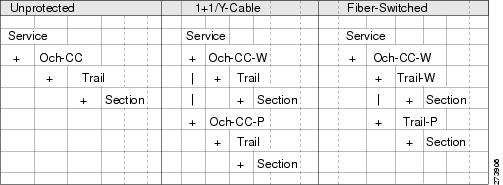
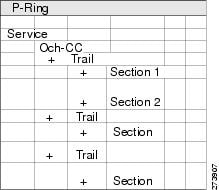
Viewing the Traffic Matrix Report
The Traffic Matrix report displays the point-to-point, P-ring, ROADM, and aggregated demand channel data in the form of service, Och-CC, trail, and section information (see Report Details for a Point-to-Point Demand figure and Report Details for a P-Ring Demand figure). The Och-CC row displays the circuit details from the source client card to the destination client card and does not include the regeneration points, if any.
Use the following procedure to view the traffic matrix report:
| Step 1 | Complete one of the following tasks: | ||||||||||||||||||||||||||||||||||||||||||||||||||||||||||||||||||||||||||
| Step 2 | In the
Tasks pane under Reports, click
Traffic
Matrix. The Traffic Matrix tab appears. A default query opens.
| ||||||||||||||||||||||||||||||||||||||||||||||||||||||||||||||||||||||||||
| Step 3 | To create a
new query, click New Query to open the Query Dialog box (see the following
figure). The Query Dialog box allows you to filter the optical results using a
variety of parameters and templates.
Query Dialog
| ||||||||||||||||||||||||||||||||||||||||||||||||||||||||||||||||||||||||||
| Step 4 | To perform a
query using individual parameters, select the desired parameters from the
drop-down lists in the Query Definition area. The selected parameters appear in
the Query Preview area at the bottom of the screen. The following table
describes the fields in the Query Dialog box.
| ||||||||||||||||||||||||||||||||||||||||||||||||||||||||||||||||||||||||||
| Step 5 | Complete one
of the following tasks, as needed:
| ||||||||||||||||||||||||||||||||||||||||||||||||||||||||||||||||||||||||||
| Step 6 | To close the Traffic Matrix report, click the X in the upper right corner of the tab. |
Viewing the Layout of Single Site
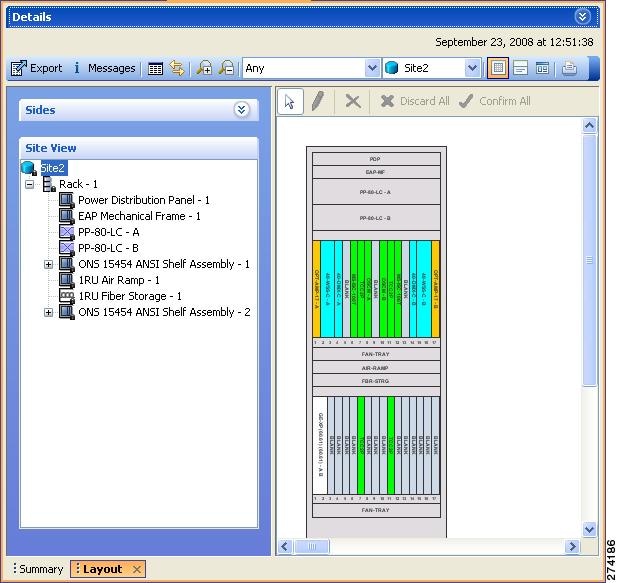
Use the following procedure to view a graphical representation of the layout for a single site in an analyzed network. Additionally, you can modify the MSM Shelf ID for Multi Shelf Management Configuration.
| Step 1 | In the Project Explorer pane, click the NetView Name tab and click the desired site. | ||||||
| Step 2 | In the
Tasks pane, click
Layout. The Layout tab appears, as shown in the
figure below. To change sites, choose the desired site from the drop-down list.
 | ||||||
| Step 3 | From the Site drop-down list, double-click the site in the network to display in the layout report. | ||||||
| Step 4 | In the Site
view in the left pane, right-click a rack and choose
Expand to view a list of all shelves and cards in
the rack.
| ||||||
| Step 5 | To modify the
unit ID of any unit:
CTP allows you to set the same unit ID for PP mesh across all the sites (maximum value is 96). To do this, go to Step 6. Else, go to Step 7. | ||||||
| Step 6 | To change the
unit ID of the PP mesh:
| ||||||
| Step 7 | To modify the
ANSI/ETSI MSM Shelf ID configuration:
The MSM shelf ID is updated in the Layout report, Traffic Matrix report, Installation parameters report, and the NE Update file.
| ||||||
| Step 8 | Click the desired rack or shelf to view it in the layout graphic. | ||||||
| Step 9 | To view details
about a card, double-click the card. The
Details dialog box opens with client information:
| ||||||
| Step 10 | Click Close to close the Details dialog box. | ||||||
| Step 11 | To filter the layout display, choose one of the following from the drop-down list: | ||||||
| Step 12 | After network
analysis, all items are in locked mode. To unlock cards so that Cisco Transport
Planner can rearrange the layout to optimize slot usage during network
analysis, right-click locked card in the rack tree and choose
Unlock.
| ||||||
| Step 13 | To export the graphical representation of the layout in JPEG format, click Export. In the Layout export dialog box, type the name of the file and navigate to the desired folder. Click Save. If you want to export the layout report for multiple sites, see Exporting the Layout Report for Multiple Sites. | ||||||
| Step 14 | To zoom the layout graphic in or out, click the Zoom In and Zoom Out icons. For more information about the Cisco Transport Planner icons, see GUI Information and Shortcuts. | ||||||
| Step 15 | To close the Layout report, click the X in the upper right corner of the tab. |
Exporting the Layout Report for Multiple Sites
Use the following procedure to export the layout report of multiple sites in an analyzed network:
| Step 1 | In the
Project
Explorer pane, navigate to the Reports folder and click
Layout. In the Details window, click the
Network
Wide Layout Export button.
The Network Wide Layout Export Selection dialog box opens. (See the following figure). 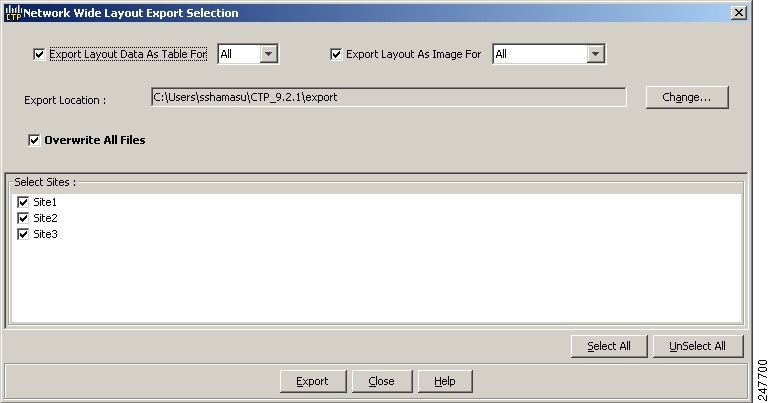 | ||
| Step 2 | In the
Network
Wide Layout Export Selection
dialog box, complete the following:
| ||
| Step 3 | Click
Export.
The Network Wide Layout Summary window opens. The summary
page displays the location where the exported files are available for the
selected sites.
|
Viewing Power Consumption from the Layout Report
Use the following procedure to view the power consumption for each unit of equipment in a site. Power consumption is available in report form from the Layout report.
| Step 1 | Click the NtView Name tab and click the desired site. | ||||||||||||||||||
| Step 2 | In the Tasks pane, click Layout. The Layout tab appears (See Layout Report dialog-box in Viewing the Layout of Single Site section). To change sites, choose the desired site from the drop-down list. | ||||||||||||||||||
| Step 3 | Click the View
layout as table icon in the report tool bar. The Layout Table report appears.
The table below describes the information in the columns of the Layout Table report.
| ||||||||||||||||||
| Step 4 | To export power consumption data, click Export. The Layout Table Export dialog box appears. Enter the name of the file and navigate to the desired folder. Click Save. | ||||||||||||||||||
| Step 5 | Click Close to close the Layout Table report. |
Viewing the Link Availability Report
Cisco Transport Planner determines link availability based on unit failure rate and time to repair. Use the following procedure to view the Link Availability report:
| Step 1 | Complete one of the following: | ||||||||||||||||||||
| Step 2 | In the
Tasks pane, click
Link
Availability. The Link Availability tab appears.
Each row in the tab shows the performance of one optical path. The below table describes the information in the columns.
| ||||||||||||||||||||
| Step 3 | Click New Query to open the Query Dialog (See Query Dialog image in Viewing the Traffic Matrix Report section). The Query Dialog allows you to filter the link availability using a variety of parameters. | ||||||||||||||||||||
| Step 4 | To perform a
query using individual parameters, select the desired parameters from the
drop-down lists in the Query Definition area. The selected parameters appear in
the Query Preview area at the bottom of the screen. The below table describes
the fields in the Query Dialog.
| ||||||||||||||||||||
| Step 5 | Choose one of
the following, as needed:
| ||||||||||||||||||||
| Step 6 | To close the Link Availability report, click the X in the upper right corner of the tab. |
Viewing Optical Results
Use the following procedure to view the optical results of the network that you created and analyzed:
| Step 1 | Complete one of the following: | ||||||||||||||||||||||||||||||||||||||||||||||||||||||||||||||||||||||||||||||||||||
| Step 2 | In the
Tasks pane, click
Optical
Results. The Optical Results tab appears.
Each row in the tab shows the performance of one optical path. The following table describes the information in the columns.
| ||||||||||||||||||||||||||||||||||||||||||||||||||||||||||||||||||||||||||||||||||||
| Step 3 | Click New Query to open the Query Dialog (See Query Dialog figure in Viewing the Traffic Matrix Report section). The Query Dialog allows you to filter the optical results using a variety of parameters. | ||||||||||||||||||||||||||||||||||||||||||||||||||||||||||||||||||||||||||||||||||||
| Step 4 | To perform a
query using individual parameters, select the desired parameters from the
drop-down lists in the Query Definition area. The selected parameters appear in
the Query Preview area at the bottom of the screen. The following table
describes the fields in the Query Dialog.
| ||||||||||||||||||||||||||||||||||||||||||||||||||||||||||||||||||||||||||||||||||||
| Step 5 | Choose one of the following tasks, as needed: | ||||||||||||||||||||||||||||||||||||||||||||||||||||||||||||||||||||||||||||||||||||
| Step 6 | To close the Optical Results report, click the X in the upper-right corner of the tab. |
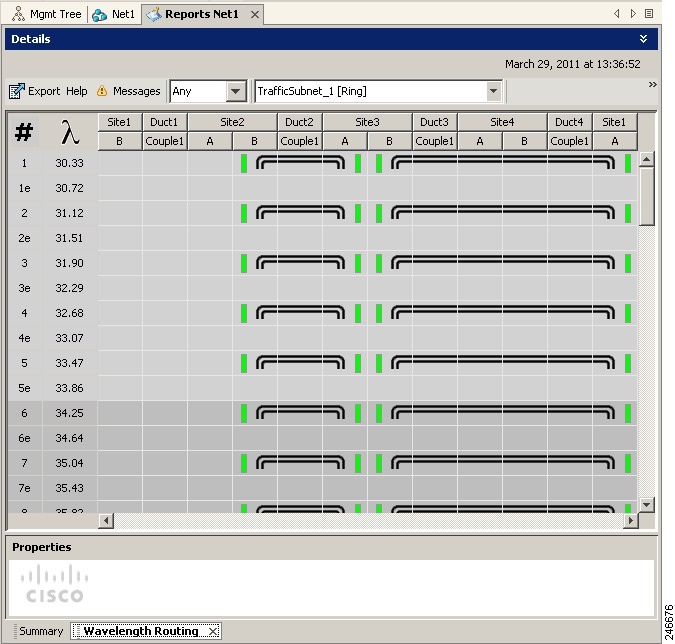
Viewing Wavelength Routing
Use the following procedure to view the wavelength routing map for the network that was analyzed:
| Step 1 | Click the Networks Mgmt Tree tab, and click the analyzed network. | ||||||||||||||||||||||||||||||||||||||||||||||||||||
| Step 2 | In the
Tasks pane, click
Wavelength Routing. The Wavelength Routing tab
appears. Each wavelength supported by the platform is represented by a row.
 | ||||||||||||||||||||||||||||||||||||||||||||||||||||
| Step 3 | Choose one of the following from the Messages drop-down list: | ||||||||||||||||||||||||||||||||||||||||||||||||||||
| Step 4 | To view the
routing map for a particular linear or ring subnet, expand the Traffic subnet
ALL option in the traffic subnet drop-down list and choose the subnet.
 The following table lists and explains the circuit icons present in the routing map:
The following table describes the columns in the Wavelength routing tab.
| ||||||||||||||||||||||||||||||||||||||||||||||||||||
| Step 5 | To export the graphical representation of the layout in JPEG format, click Export. In the Wavelength Routing export dialog box, type the name of the file and navigate to the desired folder. Click Save. | ||||||||||||||||||||||||||||||||||||||||||||||||||||
| Step 6 | To close the Wavelength Routing report, click the X in the upper-right corner of the window. |
Viewing the Ethernet Aggregated Demand Report
Use the following procedure to view the Ethernet Aggregated Demand report:
| Step 1 | Click the Mgmt Tree tab and right-click the analyzed network. |
| Step 2 |
Choose Ethernet Aggregated Demand from the drop-down list.
The Ethernet Aggregated Demand Report tab appears. |
Viewing the TDM Aggregated Demand Report
Use the following procedure to view the TDM Aggregated Demand report:
| Step 1 | Click the Mgmt Tree tab and right-click the analyzed network. |
| Step 2 |
Choose TDM Aggregated Demand from the drop-down list.
The TDM Aggregated Demand Report tab appears. |
Viewing Any-to-Any Finalized Circuits
To view the Any-to-Any (A2A) Finalized Circuits report:
| Step 1 | Click the Mgmt Tree tab and right-click the analyzed network. | ||||||||||||||||||
| Step 2 | Choose A2A
Finalized Circuits from the drop-down list.
The A2A Finalized Circuits tab appears. The A2A Finalized Circuits tab allows to edit or delete any Any-to-Any finalized ROADM demand (see Creating a ROADM Demand task).
The following table describes the columns in the A2A Finalized Circuits tab.
|
Viewing Report Differences
You can compare the BoM, Internal Connections, and Installation Parameters reports for two networks. This is useful to see the differences between a baseline network and an Install or Upgrade network.
- The BoM Diff report lists the units that were added and/or removed from the BoM.
- The Internal Connection Diff report lists changed connections. If at least one of the two endpoints of an internal connection is different, Cisco Transport Planner reports that the internal connection has changed. The report shows all internal connections that were present in the baseline network but are not present in the final network, and all internal connections not present in the baseline network but present in the final network.
- The Installation Parameters Diff report lists changed parameters between the baseline network and the final network.
Use the following procedure to compare networks:
| Step 1 | Click the
Reports Diff icon. For more information about Cisco Transport Planner icons,
see
GUI Information and Shortcuts.
The Reports Diff dialog box appears. The below figure shows the Reports Diff
dialog box as it appears when at least two analyzed networks exist in a
project.
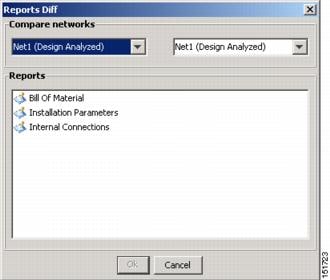 | ||||||||||||||||||||||||||||||||||||||||||||||||||||||||||||||||
| Step 2 | In the Compare networks area, choose the baseline network from the drop-down list on the left. Choose the network to compare from the drop-down list on the right. | ||||||||||||||||||||||||||||||||||||||||||||||||||||||||||||||||
| Step 3 | Click the
report you would like to view. If you chose one non-analyzed network, you can
view only the Bill of Material differences report.
| ||||||||||||||||||||||||||||||||||||||||||||||||||||||||||||||||
| Step 4 | Click
OK.
The following figure shows the BoM Diff report. 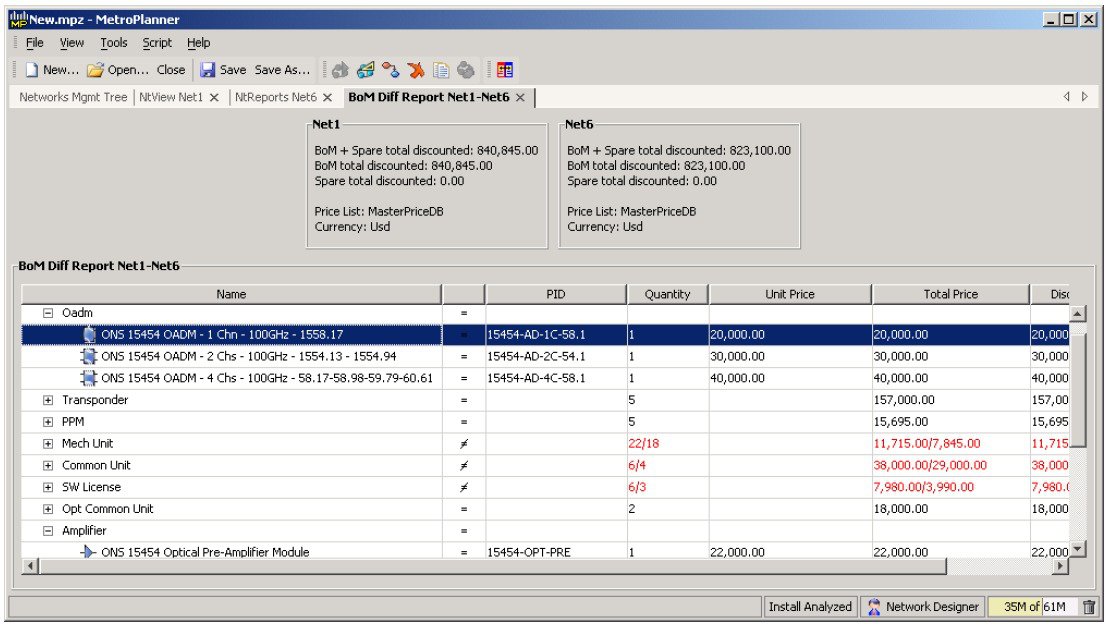 The upper section of the BoM Diff Report tab displays the following information for each network:
The following table describes the information in the BoM Diff report columns. Click a column to sort the table information by that column.
The following table describes the columns in the Installation Parameters Diff report. Click a column to sort the table information by that column. Differences between networks appear in red and in the following format: baseline-network-value /final-network-value .
The following table lists the columns in the Internal Connections Diff report and their descriptions. Click a column to sort the table information by that column. Differences between networks appear in red and in the following format: baseline network value /final network value .
|
 Feedback