- Overview to Prime Performance Manager
- Managing Gateways and Units Using the CLI
- Managing the Web Interface
- Importing Devices From Other Cisco Prime Applications
- Discovering Devices With Prime Performance Manager
- Managing Users and Security
- Managing Reports, Dashboards, and Views
- Setting Up Reports for Specialized Technologies
- Managing Devices
- Managing Network Alarms and Events
- Creating and Managing Thresholds
- Displaying System Properties, Statuses, Messages, and Logs
- Managing Gateways and Units
- Managing High Availability
- Configuring Prime Performance Manager for Firewalls
- Managing Multi-Tenant Services
- Pushing Prime Performance Manager Data to Other Applications
- Backing Up and Restoring Prime Performance Manager
- Prime Performance Manager and IPv6
- Prime Performance Manager Commands
- Predefined Thresholds
- Compliance
Cisco Prime Performance Manager User Guide, 1.7
Bias-Free Language
The documentation set for this product strives to use bias-free language. For the purposes of this documentation set, bias-free is defined as language that does not imply discrimination based on age, disability, gender, racial identity, ethnic identity, sexual orientation, socioeconomic status, and intersectionality. Exceptions may be present in the documentation due to language that is hardcoded in the user interfaces of the product software, language used based on RFP documentation, or language that is used by a referenced third-party product. Learn more about how Cisco is using Inclusive Language.
- Updated:
- September 28, 2015
Chapter: Managing Devices
- Options for Displaying Device Information
- Displaying Device Information at the Network Level
- Displaying Device Properties at the Network Level
- Displaying Device Type Distributions at the Network Level
- Displaying Alarms by Device at the Network Level
- Displaying Alarms by Device Type at the Network Level
- Displaying Devices Time Out Alarms at the Network Level
- Displaying NetFlow Devices at the Network Level
- Displaying Device Polling Responses at the Network Level
- Displaying Device ICMP Ping Responses at the Network Level
- Displaying Device Up Time at the Network Level
- Displaying Device Data Collection Status at the Network Level
- Displaying Device Software at the Network Level
- Displaying Device Contacts and Locations at the Network Level
- Displaying Device Vendors at the Network Level
- Displaying Device Details in Cisco Prime Format
- Managing Devices in the Network-Level View
- Editing a Device Name, Web Port, Time Zone, and Location
- Editing the Device Credentials
- Editing the Report Policy Assigned to a Device
- Editing the Polling Group Assigned to a Device
- Editing the Device Management IP Addresses
- Removing Device Interfaces From Polling
- Relocating Devices to Units
- Annotating a Device
- Displaying the 360 Device Details View
- Displaying Device Information at the Device Level
- Managing Individual Devices
- Creating and Editing Device Polling Groups
- Creating Probes
Managing Devices
After Prime Performance Manager discovers your network devices, you can view detailed information, perform management actions, and create individualized polling for discovered network devices.
Device views, the properties you can display, and the actions you can perform are described in the following topics:
Options for Displaying Device Information
Prime Performance Manager provides many ways for you to see device information. Some are intended as a quick display of the highest priority device details; others are intended for detailed exploration of every single device parameter. Device information display options include:
- Network view—Displayed by choosing Devices from the Network menu. This view displays all network devices and allows you to see device information for all devices at one time. For information about parameters and editing options available in the network view, see Displaying Device Information at the Network Level.
- Device view—Displayed when you click a device hyperlink. Device hyperlinks appear in many locations including the device, alarms, and events windows. Information displayed at the individual device level is much the same as that displayed in network view, with some variations. For information about parameters and editing options available in the network view, see Displaying Device Information at the Device Level.
- Device Hyperlinks—You can view device details from device hyperlinks in one of two ways:
–![]() Mouse hover popup—A quick view of device details can be displayed when you move your cursor over a device hyperlink. The benefit of this option is speed.
Mouse hover popup—A quick view of device details can be displayed when you move your cursor over a device hyperlink. The benefit of this option is speed.
–![]() 360 Device View—Clicking the icon next to a device hyperlink displays the 360 Network Device Details window. This window provides access to most device details including alarms and events. For information about this view, see Displaying the 360 Device Details View.
360 Device View—Clicking the icon next to a device hyperlink displays the 360 Network Device Details window. This window provides access to most device details including alarms and events. For information about this view, see Displaying the 360 Device Details View.
- Device Browser—You can display device details by clicking Device Browser at the bottom of the Prime Performance Manager window. The browser window displays key device details including polling data, uptime, alarms, and status. Options available in the network or device-level windows are available in the device browser.
Displaying Device Information at the Network Level
The Prime Performance Manager network device view provides the broadest overview of your network devices. From this view you can drill down to different device details, as well as to individual devices for details about one device. (See Displaying Device Information at the Device Level.)
To display the network-level device view, from the Network menu, choose Devices. The Network Devices window displays the last updated time in the window title bar. If the gateway and client reside in the same time zone, one time is presented. If the gateway and client are in different time zones, both times are presented.
Device information areas, accessed from Network Devices window tabs, are displayed in Table 9-1 .
|
|
|
|
|---|---|---|
Displays devices with NetFlow provisioned. The table displays the same device parameters as the Devices table. See Table 9-2. If no network devices have NetFlow provisioned, the NetFlow tab is not displayed. |
||
Displaying Device Data Collection Status at the Network Level |
||
Displaying Device Contacts and Locations at the Network Level |
||
Displaying Device Properties at the Network Level
Prime Performance Manager displays properties for all network devices in one view. To display them:
All discovered network devices are displayed. Table 9-2 lists the available device properties. In addition, you can change the following items in User Preferences.
- Device details displayed from device hyperlinks—You can display device details from hyperlinks either as a popup that automatically appears when you move your mouse over the link, or in the 360 Network Device View window, which is displayed when you click an icon next to the hyperlink.
The device details displayed in the popup or 360 Network Device View are described in Table 9-2 , and Table 9-11. The details display option is useful in other windows that list device links, for example, the Network Alarms window, or when drilling down to the interface report level. However, you can disable this feature in User Preferences.
- Alarm severity icons—Devices include an alarm severity icon indicating the highest level alarm on the device. You can disable this feature in User Preferences.
- Deleted devices—Deleted devices, without hyperlinks, can be displayed by enabling this option in User Preferences.
For information about changing user preferences, see Customizing the GUI and Information Display
|
|
|
|---|---|
Internal ID1 |
Device internal ID. Prime Performance Manager assigns this ID to the device for internal use. |
Unit 2 |
|
Device IP address or DNS name as Prime Performance Manager discovered it. |
|
The device type, which is usually based on the device family, for example, Cisco1706 for Cisco 1706 Series Routers. If the device family type is not known, IP Device is displayed. Prime Performance Manager gateway and unit servers are listed as ciscoGatewayServer and ciscoUnitServer. |
|
Displays any annotation that was written about the device. See Annotating a Device. |
|
A short descriptive term for the device, if known. Otherwise, Generic. |
|
| The serial numbers that are displayed as unknown, can be customized using the following steps:
Note Append the correct index to its appropriate device type OID. For cisco340024TSA, the device OID is 1.3.6.1.4.1.9.1.736, the serial number index is 1001, the entry added needs to be as follows: To configure multiple devices, use a comma separated string without any spaces. DEVICE_SERIALNUM_INDEX=1.3.6.1.4.1.9.1.574:1001,1.3.6.1.4.1.9.1.1252:100 |
|
The time for the device to respond to the last poll request. |
|
Average time for the device to respond to Prime Performance Manager poll requests. |
|
Time the device has been up in days, hours, minutes, and seconds. |
|
Indicates how Prime Performance Manager discovered the device: PPM (Prime Performance Manager) or Prime Network. See Chapter5, “Discovering Devices With Prime Performance Manager” |
|
Indicates whether report polling is enabled for this device. |
|
Indicates whether the device is sending alarms. Users with authentication level Network Operator (level 3) and higher can edit this field. See Creating and Editing Device Polling Groups. |
|
If alarms are raised for the device, the highest severity: Critical, Major, Minor, Warning, Informational, Unmanaged, or Normal. |
|
Status3 |
|
Reason for the current device status. (If you cannot see all of the status reason text, place the cursor over the cell to see the full text in a tooltip.) The stateReasons.html provides a list of possible reasons,located at: |
|
The device location, if added. If GPS locations are enabled, the location is displayed as a hyperlink that, when launched, displays the device location in a separate Google Maps browser session. |
|
The polling group to which the device is assigned. See Creating and Editing Device Polling Groups |
|
The report policy to which the device is assigned. See Creating Report Policies. |
|
|
1.Not displayed by default. To display hidden properties, see Adding and Removing Properties from Property Views. 2.Not displayed by default for device alarms; displayed for SNMP timeout alarms. |
Displaying Device Type Distributions at the Network Level
The Network - Device Distribution by Type window presents your device type distributions in table and pie chart format. Information includes the device type, the total number of devices, and the device type percentage within the network. To display device distributions:
Network - Device Distribution by Type fields include:
- Type—The name of the device platform, for example, Cisco1706, ONS15454.
- Total (total number of devices)—The total number of devices of a particular type.
- Percentage—The percentage of devices of this type out of all the discovered devices.
From the Device Distributions window, you can:
- Click a device type link to display all the devices of that type. From there you can drill down into individual devices to view reports, alarms, events, and other information described in Displaying Device Properties at the Network Level.
- Export the data to a CSV file.
- Send the distributions pie chart to a printer or graphic image.
Displaying Alarms by Device at the Network Level
The Network - Alarms by Device window displays a count of alarms by device and severity. You can display alarms by device from either the Devices or Alarms/Events windows:
Table 9-3 lists the Network - Alarms by Device properties.
|
|
|
|
|---|---|---|
Internal ID4 |
Internal device ID. Prime Performance Manager assigns this ID to the device for internal use. |
|
Name of the device. When you click any of the device names, the Alarms tab of that device is displayed. This column is displayed by default. |
||
Indicates whether the device is sending alarms. Users with authentication level Network Operator (level 3) and higher can edit this field. See Creating and Editing Device Polling Groups. |
||
Date and time that the status of the device alarms last changed. |
||


|
4.Not displayed by default. To display hidden properties, see Adding and Removing Properties from Property Views. |
Displaying Alarms by Device Type at the Network Level
The Network - Alarms by Device Type window displays device alarm information organized by device types. You can display alarms by device type from either the Devices or Alarms/Events windows:
Network - Alarms by Device Type displays the following information:
- Device Type—The device type, for example, Cisco7606 for Cisco 7606 Routers, CiscoONS15454 for Cisco ONS 15454 Multiservice Transport Platform, and so on.
- Total—The total number of alarms for the device type.
- Alarms—The following alarm totals are provided along with the total alarm count and alarm percentage:
Displaying Devices Time Out Alarms at the Network Level
The Network - Unreachable window displays devices for which a NodeUnreachable alarm is present. To display devices with unreachable alarms:
- From the Network menu, choose Devices, then click Unreachable. The table displays the same device parameters as the Devices table. See Table 9-2.
Displaying NetFlow Devices at the Network Level
The Network - NetFlow window displays devices that have NetFlow provisioned. To display NetFlow devices:
- From the Network menu, choose Devices, then click NetFlow. The Network - NetFlow Enabled Devices table displays the same device parameters as the Devices table. See Table 9-2.

Note![]() If no network devices have NetFlow provisioned, the NetFlow tab is not displayed.
If no network devices have NetFlow provisioned, the NetFlow tab is not displayed.
Displaying Device Polling Responses at the Network Level
The Network - Polling window displays the number of seconds devices take to respond to the Prime Performance Manager poll requests. To display the device poll responses:
Table 9-4 lists the Network - Polling information.
|
|
|
|---|---|
Internal ID5 |
Internal device ID. Prime Performance Manager assigns this ID to the device for internal use. |
The device type, which is usually based on the device family, for example, Cisco1706 for Cisco 1706 Series Routers. If the device family type is not known, IP Device is displayed. Prime Performance Manager gateway and unit servers are listed as ciscoGatewayServer and ciscoUnitServer. |
|
Indicates whether report polling is enabled for this device. |
|
The date and time Prime Performance Manager last polled the device. |
|
The time, in seconds, it took for the device to respond to the poll. |
|
Average response time for the device to respond to poll from the Prime Performance Manager server. |
|
|
5.Not displayed by default. To display hidden properties, see Adding and Removing Properties from Property Views. |
Displaying Device ICMP Ping Responses at the Network Level
The Network - Ping window displays the number of seconds devices take to respond to the Prime Performance Manager Internet Control Message Protocol (ICMP) pings, and the resulting device availability percentages.
Note![]() The ICMP Ping reports must be enabled in order for data to appear in the Network Ping table. The ICMP Ping reports are located in the Availability report group.
The ICMP Ping reports must be enabled in order for data to appear in the Network Ping table. The ICMP Ping reports are located in the Availability report group.
To display ICMP ping results and device availability:
Displaying Device Up Time at the Network Level
The Network - Uptime window displays the uptime for managed devices. To display device up times:
Table 9-5 lists the device up time properties.
|
|
|
|---|---|
Internal ID6 |
Internal device ID. Prime Performance Manager assigns this ID to the device for internal use. |
The device type, which is usually based on the device family, for example, Cisco1706 for Cisco 1706 Series Routers. If the device family type is not known, IP Device is displayed. Prime Performance Manager gateway and unit servers are listed as ciscoGatewayServer and ciscoUnitServer. |
|
Time the device has been up, in days, hours, minutes, and seconds. |
|
Indicates the highest alarm severity for the chosen device: Critical, Major, Minor, Warning, Informational, Unmanaged, or Normal. |
|
6.Not displayed by default. To display hidden properties, see Adding and Removing Properties from Property Views. |
Displaying Device Data Collection Status at the Network Level
The Network - Data Collection table allows you to quickly see the data collection status of devices across the network. To display the device data collection status:
Table 9-6 lists the data collection status parameters.
Displaying Device Software at the Network Level
The Network - Software window lists the software versions and descriptions for each device in the Prime Performance Manager network. To display the device software information:
Table 9-7 lists the Network - Software parameters.
Displaying Device Contacts and Locations at the Network Level
The Network - Contacts/Locations window displays the device contacts and locations if that information was entered for the device. To display the device contacts and locations:
Table 9-8 lists the Network - Contact/Location properties.
|
|
|
|---|---|
Internal ID7 |
Internal device ID. Prime Performance Manager assigns this ID to the device for internal use. |
IP address or DNS name of the device, as the Prime Performance Manager discovered it. |
|
The device type, which is usually based on the device family, for example, Cisco1706 for Cisco 1706 Series Routers. If the device family type is not known, IP Device is displayed. Prime Performance Manager gateway and unit servers are listed as ciscoGatewayServer and ciscoUnitServer. |
|
|
|
7.Not displayed by default. To display hidden properties, see Adding and Removing Properties from Property Views. |
Displaying Device Vendors at the Network Level
The Network Vendors window displays the device types, manufacturers, and status. To display the device vendor information:
Table 9-9 displays the device vendor information.
|
|
|
|---|---|
Internal ID8 |
Internal device ID. Prime Performance Manager assigns this ID to the device for internal use. |
IP address or DNS name of the device, as the Prime Performance Manager discovered it. |
|
The device type, which is usually based on the device family, for example, Cisco1706 for Cisco 1706 Series Routers. If the device family type is not known, IP Device is displayed. Prime Performance Manager gateway and unit servers are listed as ciscoGatewayServer and ciscoUnitServer. |
|
|
8.Not displayed by default. To display hidden properties, see Adding and Removing Properties from Property Views. |
Displaying Device Details in Cisco Prime Format
If Prime Performance Manager is integrated with Cisco Prime Central (see “Importing Devices From Other Cisco Prime Applications” ), you can display the device details in a format that matches Prime Central. Because fewer properties are displayed than the Devices tab, Prime can provide a quick look at the Prime Performance Manager devices in an organization that aligns with their display in Prime Central.
To display Prime Performance Manager device details in Prime Central format:
Table 9-8 lists the device properties displayed in the Network - Prime window.
|
|
|
|---|---|
Internal ID9 |
Internal device ID. Prime Performance Manager assigns this ID to the device for internal use. |
IP address or DNS name of the device, as the Prime Performance Manager discovered it. |
|
The device type, which is usually based on the device family, for example, Cisco1706 for Cisco 1706 Series Routers. If the device family type is not known, IP Device is displayed. Prime Performance Manager gateway and unit servers are listed as ciscoGatewayServer and ciscoUnitServer. |
|
|
|
|
9.Not displayed by default. To display hidden properties, see Adding and Removing Properties from Property Views. |
Managing Devices in the Network-Level View
At the network-level device view, operator or higher users can perform some device modifications. To manage network devices:
Step 1![]() From the Network menu, choose Devices.
From the Network menu, choose Devices.
Step 2![]() Navigate to one of the following device view tabs:
Navigate to one of the following device view tabs:
See Displaying Device Information at the Network Level for information on displaying these views.
Step 3![]() Select a device. Press Shift to select multiple contiguous devices, or Ctrl to select devices that are not contiguous.
Select a device. Press Shift to select multiple contiguous devices, or Ctrl to select devices that are not contiguous.
Step 4![]() From the Actions menu (located just above the device table), choose any of the following actions.
From the Actions menu (located just above the device table), choose any of the following actions.
- Poll Device—Polls the devices selected in the device list.
- Edit Properties—Allows you to edit the device display name and default web port. See Editing a Device Name, Web Port, Time Zone, and Location.
- Edit Device Credentials—Allows you to edit the device connection credentials used to poll the device. See Editing the Device Credentials.
- Edit Report Policy—Allows you to change the report policy assigned to the device. See Editing the Report Policy Assigned to a Device
- Edit Polling Policy—Allows you to change the polling policy assigned to the device. See Creating and Editing Device Polling Groups and Editing the Polling Group Assigned to a Device.
- Edit Management IP Addresses—Allows you to edit a device management IP addresses. See Editing the Device Management IP Addresses.
- Change Interface Polling—Allows you to remove device interfaces from polling. See Removing Device Interfaces From Polling.
- Relocate Device—Allows you to relocate a device from one unit to another. See Relocating Devices to Units.
- Disable Alarms and TCAs—Displays the Customize Date and Time Range dialog box in which you can configure a date and time span during which alarms and TCAs will be suppressed on the selected device(s). You can specify a specific start and end date using the calendar, or you can specify the start date and time, then click any of the time presets (1 Day, 2 Days, 1 Week, and so on).
- Enable Alarms and TCA—If you disabled alarms and TCAs, this option enables them, even if the duration specified in the Customize Date and Time Range dialog box has not been reached.
- Unmanage Device—Changes managed devices to unmanaged.
- Manage Device—Changes unmanaged devices to managed.
- Enable Maintenance Mode—Allows you to place the device in maintenance mode (polling is stopped) for a specified time period entered in the Enable Maintenance Mode dialog box.
- Annotation—Allows you to enter the notes for the selected device. See Annotating a Device.
- Delete—Deletes the selected device(s).
Note![]() If multiple devices are selected, not all actions are available.
If multiple devices are selected, not all actions are available.
Step 5![]() To check device connectivity, from the device toolbar, click one or both of the following:
To check device connectivity, from the device toolbar, click one or both of the following:
Note![]() You can also use the ppm ping and ppm traceroute commands to check device connectivity. See ppm ping and ppm traceroute.
You can also use the ppm ping and ppm traceroute commands to check device connectivity. See ppm ping and ppm traceroute.
Editing a Device Name, Web Port, Time Zone, and Location
Within the device network view, you can change the device name, web port, time zone and location. To edit these device properties:
Step 1![]() Navigate to one of the following device views: Devices, Alarms by Device, Unreachable, NetFlow, Polling, Ping, Uptime, Data Collection, Software, Contact/Location, Prime. (For information on displaying these views, see Displaying Device Information at the Network Level.)
Navigate to one of the following device views: Devices, Alarms by Device, Unreachable, NetFlow, Polling, Ping, Uptime, Data Collection, Software, Contact/Location, Prime. (For information on displaying these views, see Displaying Device Information at the Network Level.)
Step 2![]() In the device list, select the device whose name you want to edit.
In the device list, select the device whose name you want to edit.
Step 3![]() From the Actions menu, choose Edit Properties
From the Actions menu, choose Edit Properties
Step 4![]() In the Edit Properties dialog box, edit the following properties:
In the Edit Properties dialog box, edit the following properties:
- Name—Name of the device. The name is green for valid inputs and red for invalid inputs. The name may include up to 100 alphanumeric and the special characters hyphen (-), underscore (_), period (.), and colon (:). If you enter an invalid name, the Save option is disabled. After saving, the new name is displayed in the navigation tree and in the Details panel. The character ‘.’ is allowed only when the resulting name is a valid hostname.
- Default Web Port—Should you wish to change the default device web port, enter the web port number.
- Time Zone—Should you wish to change the device time zone, type the first two or more letters of the time zone. The field will populate with time zones matching the letters you entered. (Time zones are expressed using the tzdata, or IANA Time Zone Database formats.)
- Location—The device location, which is displayed in the device Location property. If GPS Locations is enabled (see Changing System Configuration Settings), the location you enter is used to display the device location in Google Maps. If GPS is enabled, be sure to enter sufficient location information to enable Google Maps to display the device location accurately.
Editing the Device Credentials
To edit the device connection credentials:
Step 1![]() Navigate to one of the following device views: Devices, Alarms by Device, Unreachable, NetFlow, Polling, Ping, Uptime, Data Collection, Software, Contact/Location, Prime. (For information on displaying these views, see Displaying Device Information at the Network Level.)
Navigate to one of the following device views: Devices, Alarms by Device, Unreachable, NetFlow, Polling, Ping, Uptime, Data Collection, Software, Contact/Location, Prime. (For information on displaying these views, see Displaying Device Information at the Network Level.)
Step 2![]() In the device list, select the device whose credentials you want to edit.
In the device list, select the device whose credentials you want to edit.
Step 3![]() From the Actions menu, choose Edit Device Credentials.
From the Actions menu, choose Edit Device Credentials.
Step 4![]() In the Edit Device Credentials dialog box, edit any of the following:
In the Edit Device Credentials dialog box, edit any of the following:
–![]() md5—Uses the Hash-based Message Authentication Code (HMAC) MD5 algorithm for authentication
md5—Uses the Hash-based Message Authentication Code (HMAC) MD5 algorithm for authentication
–![]() sha—Uses the HMAC SHA algorithm for authentication
sha—Uses the HMAC SHA algorithm for authentication
–![]() 3des—Uses Data Encryption Standard (DES).
3des—Uses Data Encryption Standard (DES).
–![]() des—Uses the Data Encryption Standard (DES).
des—Uses the Data Encryption Standard (DES).
–![]() aes128—Uses Advanced Encryption Standard (AES) 128-bit encryption.
aes128—Uses Advanced Encryption Standard (AES) 128-bit encryption.
–![]() WSMA_SSH—Web Services Management Agent over SSHv2. WSMA is an infrastructure framework that allows external applications to monitor and control Cisco devices. WSMA uses transports such as SSH, HTTP, and HTTPS to access a set of Web Services agents residing on the Cisco device.
WSMA_SSH—Web Services Management Agent over SSHv2. WSMA is an infrastructure framework that allows external applications to monitor and control Cisco devices. WSMA uses transports such as SSH, HTTP, and HTTPS to access a set of Web Services agents residing on the Cisco device.
–![]() collectd_SSH—A daemon that collects, transfers, and stores performance data.
collectd_SSH—A daemon that collects, transfers, and stores performance data.
–![]() HTTP—HyperText Transfer Protocol.
HTTP—HyperText Transfer Protocol.
–![]() HTTP_BULK—Bulk statistics through HTTP.
HTTP_BULK—Bulk statistics through HTTP.
–![]() WMI_HTTP—Windows Management Instrumentation over HTTP.
WMI_HTTP—Windows Management Instrumentation over HTTP.
–![]() WMI_HTTPS—Windows Management Instrumentation HTTPS.
WMI_HTTPS—Windows Management Instrumentation HTTPS.
–![]() vCenter_HTTPS—VMware vCenter server over HTTPS.
vCenter_HTTPS—VMware vCenter server over HTTPS.
–![]() ESXi_HTTP—VMware ESXi embedded bare metal hypervisor over HTTP.
ESXi_HTTP—VMware ESXi embedded bare metal hypervisor over HTTP.
–![]() ESXi_HTTPS—VMware ESXi embedded bare metal hypervisor over HTTP.S
ESXi_HTTPS—VMware ESXi embedded bare metal hypervisor over HTTP.S
Note![]() When you define the credential for vCenter and ESXi devices, make sure the user account you use has the session privilege. For information, see.
When you define the credential for vCenter and ESXi devices, make sure the user account you use has the session privilege. For information, see.
–![]() XEN_TLS—Xen hypervisor over Transport Layer Security (TLS) protocol.
XEN_TLS—Xen hypervisor over Transport Layer Security (TLS) protocol.
–![]() KVM_TLS—Linux Kernal-based Virtual Machine (KVM) over TLS.
KVM_TLS—Linux Kernal-based Virtual Machine (KVM) over TLS.
Note Xen_TLS and KVM_TLS have discovery requirements. See Xen and KVM TLS Discovery Requirements
–![]() HyperV_HTTP—Microsoft HyperV server over HTTP.
HyperV_HTTP—Microsoft HyperV server over HTTP.
–![]() HyperV_HTTPS—Microsoft HyperV server over HTTPS.
HyperV_HTTPS—Microsoft HyperV server over HTTPS.
–![]() JMX—Java Management Extensions. Collects statistics from Java processes running on various servers.
JMX—Java Management Extensions. Collects statistics from Java processes running on various servers.
Note JMX reports are not enabled by default. After adding the JMX credential, you will need to enable the reports. For information, see Customizing Individual Report Settings.
–![]() PNSC_HTTPS—Cisco Prime Network Services Controller secure HTTP connection.
PNSC_HTTPS—Cisco Prime Network Services Controller secure HTTP connection.
–![]() GMOND_SOCKET—Ganglia Monitoring Daemon (gmond) socket.
GMOND_SOCKET—Ganglia Monitoring Daemon (gmond) socket.
–![]() SMI_HTTPS—Storage Management Initiative over HTTPS.
SMI_HTTPS—Storage Management Initiative over HTTPS.
–![]() ULS_HTTP—Allows Prime Performance Manager to perform Small Cell upload server HTTP credential verification including subsystem, username, password, and credential parameters. Beyond that, ULS_HTTP is identical to HTTP protocol.
ULS_HTTP—Allows Prime Performance Manager to perform Small Cell upload server HTTP credential verification including subsystem, username, password, and credential parameters. Beyond that, ULS_HTTP is identical to HTTP protocol.
–![]() AVI_HTTPS—A secure connection with AVI Networks load leveling device.
AVI_HTTPS—A secure connection with AVI Networks load leveling device.
- User Name—The device login username.
- Password—The password for the login user.
- Secondary Login Type—Enables
- Enable User Name—The privileged username.
- Enable Password—The privileged user password.
- Port—The device port to be used by the transport protocol chosen in the Protocol field.
- Sub System—The subsystem used by transport protocol. If the subsystem is defined on the device, enter it here. A blank string is the default subsystem for SSH. The default subsystem for WSMA is “wsma”.
Note![]() To poll the Cisco Nexus 7000 through its XML management interface using Network Configuration Protocol (NETCONF), enter netconf in the Sub System field. Using the XML interface allows you to generate Border Gateway Protocol (BGP) reports.
To poll the Cisco Nexus 7000 through its XML management interface using Network Configuration Protocol (NETCONF), enter netconf in the Sub System field. Using the XML interface allows you to generate Border Gateway Protocol (BGP) reports.
Note![]() For vCenter and ESXi devices that are members of an Active Domain, you can enter the domain and username in the format domain/username.
For vCenter and ESXi devices that are members of an Active Domain, you can enter the domain and username in the format domain/username.
Note![]() For KVM_TLS, if SASL is enabled on the KVM device, add Simple Authentication Security Layer (SASL) credentials to the entry. SASL usernames typically have the SASL realm appended to it, such as user@hostname. If SASL is not enabled on the KVM device, you can leave the User Name and Password fields blank.
For KVM_TLS, if SASL is enabled on the KVM device, add Simple Authentication Security Layer (SASL) credentials to the entry. SASL usernames typically have the SASL realm appended to it, such as user@hostname. If SASL is not enabled on the KVM device, you can leave the User Name and Password fields blank.
–![]() Enable—Executes the Cisco IOS enable command, which provides Prime Performance Manager privileged EXEC level (Level 15) access to the device.
Enable—Executes the Cisco IOS enable command, which provides Prime Performance Manager privileged EXEC level (Level 15) access to the device.
–![]() Second Login—Executes the login command to log into the device using the secondary username and password. If you choose this option, the secondary user must have privileged EXEC access to the device,
Second Login—Executes the login command to log into the device using the secondary username and password. If you choose this option, the secondary user must have privileged EXEC access to the device,
Note![]() Secondary Login Type is only available for Telnet or SSH connections.
Secondary Login Type is only available for Telnet or SSH connections.
Step 5![]() If you entered an SSHv2 or HTTPS credential and want to use the SSHv2 key authentication, complete the following steps. Otherwise, continue with Step 6. By default, Prime Performance Manager authenticates itself to the device using the User Name and Password entries. To change to the SSHv2 authentication keys:
If you entered an SSHv2 or HTTPS credential and want to use the SSHv2 key authentication, complete the following steps. Otherwise, continue with Step 6. By default, Prime Performance Manager authenticates itself to the device using the User Name and Password entries. To change to the SSHv2 authentication keys:
a.![]() In the Client Authentication Type field, and choose Public Key.
In the Client Authentication Type field, and choose Public Key.
b.![]() Click the Client Private Key field.
Click the Client Private Key field.
c.![]() In the SSH Credentials for [hostname] dialog box, enter the private key file name and click Import.
In the SSH Credentials for [hostname] dialog box, enter the private key file name and click Import.
d.![]() Enter the public key file name and click Import.
Enter the public key file name and click Import.
Step 6![]() Click the Test Credential.
Click the Test Credential.
A Testing Credentials for [ device name ] dialog box appears. If Prime Performance Manager succeeded in connecting to the device with the credentials you entered, the following is displayed:
If Prime Performance Manager could not connect to the device, an error is displayed, for example:
Step 7![]() In the Test Credentials for [ device name ] dialog box, click Close.
In the Test Credentials for [ device name ] dialog box, click Close.
Step 8![]() If the credentials test succeeded, click Save.
If the credentials test succeeded, click Save.
The edited credentials are saved for the device.
Editing the Report Policy Assigned to a Device
To edit the report policy assigned to a device:
Step 1![]() Navigate to one of the following device views: Devices, Alarms by Device, Unreachable, NetFlow, Polling, Ping, Uptime, Data Collection, Software, Contact/Location, Prime. (For information on displaying these views, see Displaying Device Information at the Network Level.)
Navigate to one of the following device views: Devices, Alarms by Device, Unreachable, NetFlow, Polling, Ping, Uptime, Data Collection, Software, Contact/Location, Prime. (For information on displaying these views, see Displaying Device Information at the Network Level.)
Step 2![]() In the device list, select the device whose report policy you want to edit.
In the device list, select the device whose report policy you want to edit.
Step 3![]() From the Actions menu, choose Edit Report Policy.
From the Actions menu, choose Edit Report Policy.
Step 4![]() In the Edit Report Policy dialog box, choose the report policy that you want assigned to the device from the Report Policy policy list.
In the Edit Report Policy dialog box, choose the report policy that you want assigned to the device from the Report Policy policy list.
Editing the Polling Group Assigned to a Device
To edit the polling group assigned to a device:
Step 1![]() Navigate to one of the following device views: Devices, Alarms by Device, Unreachable, NetFlow, Polling, Ping, Uptime, Data Collection, Software, Contact/Location, Prime. (For information on displaying these views, see Displaying Device Information at the Network Level.)
Navigate to one of the following device views: Devices, Alarms by Device, Unreachable, NetFlow, Polling, Ping, Uptime, Data Collection, Software, Contact/Location, Prime. (For information on displaying these views, see Displaying Device Information at the Network Level.)
Step 2![]() In the device list, select the device whose polling group you want to edit.
In the device list, select the device whose polling group you want to edit.
Step 3![]() From the Actions menu, choose Edit Polling Group.
From the Actions menu, choose Edit Polling Group.
Step 4![]() In the Polling Group Details dialog box, edit the following properties:
In the Polling Group Details dialog box, edit the following properties:
- Polling Group—Allows you to assign a different polling policy to the device. For information about creating and editing polling policies, see Creating and Editing Device Polling Groups
- Timeout—The timeout duration in seconds configured in the polling policy. Timeout is not editable unless you choose This Device Only in the Polling Policy field.
- Retries—The number of times Prime Performance Manager will retry a connection after a timeout configured in the polling policy. Retries is not editable unless you choose This Device Only in the Polling Policy field.
Editing the Device Management IP Addresses
To edit the polling group assigned to a device:
Note![]() The Edit SNMP IP Addresses option is available only for the users with authentication Level 5.
The Edit SNMP IP Addresses option is available only for the users with authentication Level 5.
Step 1![]() Navigate to one of the following device views: Devices, Alarms by Device, Unreachable, NetFlow, Polling, Ping, Uptime, Data Collection, Software, Contact/Location, Prime. (For information on displaying these views, see Displaying Device Information at the Network Level.)
Navigate to one of the following device views: Devices, Alarms by Device, Unreachable, NetFlow, Polling, Ping, Uptime, Data Collection, Software, Contact/Location, Prime. (For information on displaying these views, see Displaying Device Information at the Network Level.)
Step 2![]() In the device list, select the device whose management IP addresses you want to edit.
In the device list, select the device whose management IP addresses you want to edit.
Step 3![]() From the Actions menu, choose Edit Management IP Addresses.
From the Actions menu, choose Edit Management IP Addresses.
The Edit Management IP Address dialog box displays the following:
Step 4![]() Click any of the following:
Click any of the following:
- Add —Adds the IP Addresses from the Available IP Address box to the IP Addresses for Management box. This option is disabled if there is no IP address in the Available IP Address box.
- Remove —Removes the IP Addresses from the IP Addresses for Management box and adds them to the Available IP Addresses box. This option is disabled if there is no IP address in the IP Addresses for Management box.
- Raise —Moves the selected IP address up one level in the IP Addresses for Management box. This option is disabled if there is only one IP address in the IP Addresses for Management box.
- Lower —Moves the selected IP address down one level in the IP Addresses for Management box. This option is disabled if there is only one IP address in the IP Addresses for Management box.
Note![]() If only one IP address is available, the Raise and Lower buttons are not available.
If only one IP address is available, the Raise and Lower buttons are not available.
Step 5![]() When finished, click Save.
When finished, click Save.
Removing Device Interfaces From Polling
By default, all device interfaces are polled. At certain times you might want to remove one or more device interfaces from polling. For example in a network that aggregates very large numbers of low speed links pointing to the customer edge of the network, you might not want to retrieve data for every customer link, most of which are fixed bandwidths. In this case, you can use the Change Interface Polling action to remove the interfaces from polling.
Note![]() If you remove interfaces from polling, reports requiring information from the removed interfaces, for example, QOS, MPLS, VPN, might show incomplete data points.
If you remove interfaces from polling, reports requiring information from the removed interfaces, for example, QOS, MPLS, VPN, might show incomplete data points.
To remove a device interface from polling:
Step 1![]() Navigate to one of the following device views: Devices, Alarms by Device, Unreachable, NetFlow, Polling, Ping, Uptime, Data Collection, Software, Contact/Location, Prime. (For information on displaying these views, see Displaying Device Information at the Network Level.)
Navigate to one of the following device views: Devices, Alarms by Device, Unreachable, NetFlow, Polling, Ping, Uptime, Data Collection, Software, Contact/Location, Prime. (For information on displaying these views, see Displaying Device Information at the Network Level.)
Step 2![]() Select the device containing the interfaces you want to remove.
Select the device containing the interfaces you want to remove.
The device must have an Active status and not have alarms. If the device is not active or has alarms, the Change Interface Polling action is not available.
Step 3![]() From the Action menu, choose Change Interface Polling.
From the Action menu, choose Change Interface Polling.
Step 4![]() In the Change Interface Polling dialog box, select the interfaces you want polled and click Add to move from the Available Interfaces to the Selected For Polling group.
In the Change Interface Polling dialog box, select the interfaces you want polled and click Add to move from the Available Interfaces to the Selected For Polling group.

Tip Press Shift to choose more than one interface.
Only interfaces in the Selected For Polling group will be polled.
Relocating Devices to Units
To relocate a device to a different unit:
Step 1![]() Navigate to one of the following device views: Devices, Alarms by Device, Unreachable, NetFlow, Polling, Ping, Uptime, Data Collection, Software, Contact/Location, Prime. (For information on displaying these views, see Displaying Device Information at the Network Level.)
Navigate to one of the following device views: Devices, Alarms by Device, Unreachable, NetFlow, Polling, Ping, Uptime, Data Collection, Software, Contact/Location, Prime. (For information on displaying these views, see Displaying Device Information at the Network Level.)
Step 2![]() In the device list, select the device that you want to relocate.
In the device list, select the device that you want to relocate.
Step 3![]() From the Actions menu, choose Relocate Device.
From the Actions menu, choose Relocate Device.
Step 4![]() In the Relocate Device dialog box, choose the unit to which you want to assign the device from the Units list.
In the Relocate Device dialog box, choose the unit to which you want to assign the device from the Units list.
Annotating a Device
You can add annotative notes to devices to communicate details to network personnel that aren’t included in the device information picked up by Prime Performance Manager.
To annotate a device in the network.
Step 1![]() Login to the Prime Performance Manager GUI.
Login to the Prime Performance Manager GUI.
Step 2![]() From the Network menu, choose Devices. The Device summary page displays.
From the Network menu, choose Devices. The Device summary page displays.
Step 3![]() Highlight the device you want to annotate.
Highlight the device you want to annotate.
Step 4![]() From the Actions menu, click Annotation.
From the Actions menu, click Annotation.
The Annotation screen displays and allows you to enter text for the selected device.
Step 5![]() Click Save to save the text.
Click Save to save the text.
Step 6![]() Click on the Edit Note icon to edit the existing text.
Click on the Edit Note icon to edit the existing text.
Step 7![]() Click on the Cancel Editing Note icon if you do not want to save the edited text.
Click on the Cancel Editing Note icon if you do not want to save the edited text.
Step 8![]() Click on the device link on which you have annotated the text. The selected device page displays the Annotate tab.
Click on the device link on which you have annotated the text. The selected device page displays the Annotate tab.
Displaying the 360 Device Details View
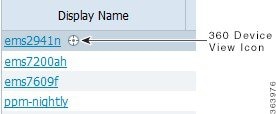
Every device, device element, or device technology hyperlink displayed in Prime Performance Manager includes an icon, shown in Figure 9-1, that, when clicked, displays a 360 detailed device view, shown in Figure 9-2. This window provides detailed information about the device, element, technology from various Prime Performance Manager GUI locations including devices, alarms, reports, and views.
Figure 9-1 360 Device View Icon
To display the 360 device details view:
Step 1![]() Navigate to a device hyperlink in one of the following windows:
Navigate to a device hyperlink in one of the following windows:
Step 2![]() Move your cursor over a device link and click the display icon to the right of the link.
Move your cursor over a device link and click the display icon to the right of the link.
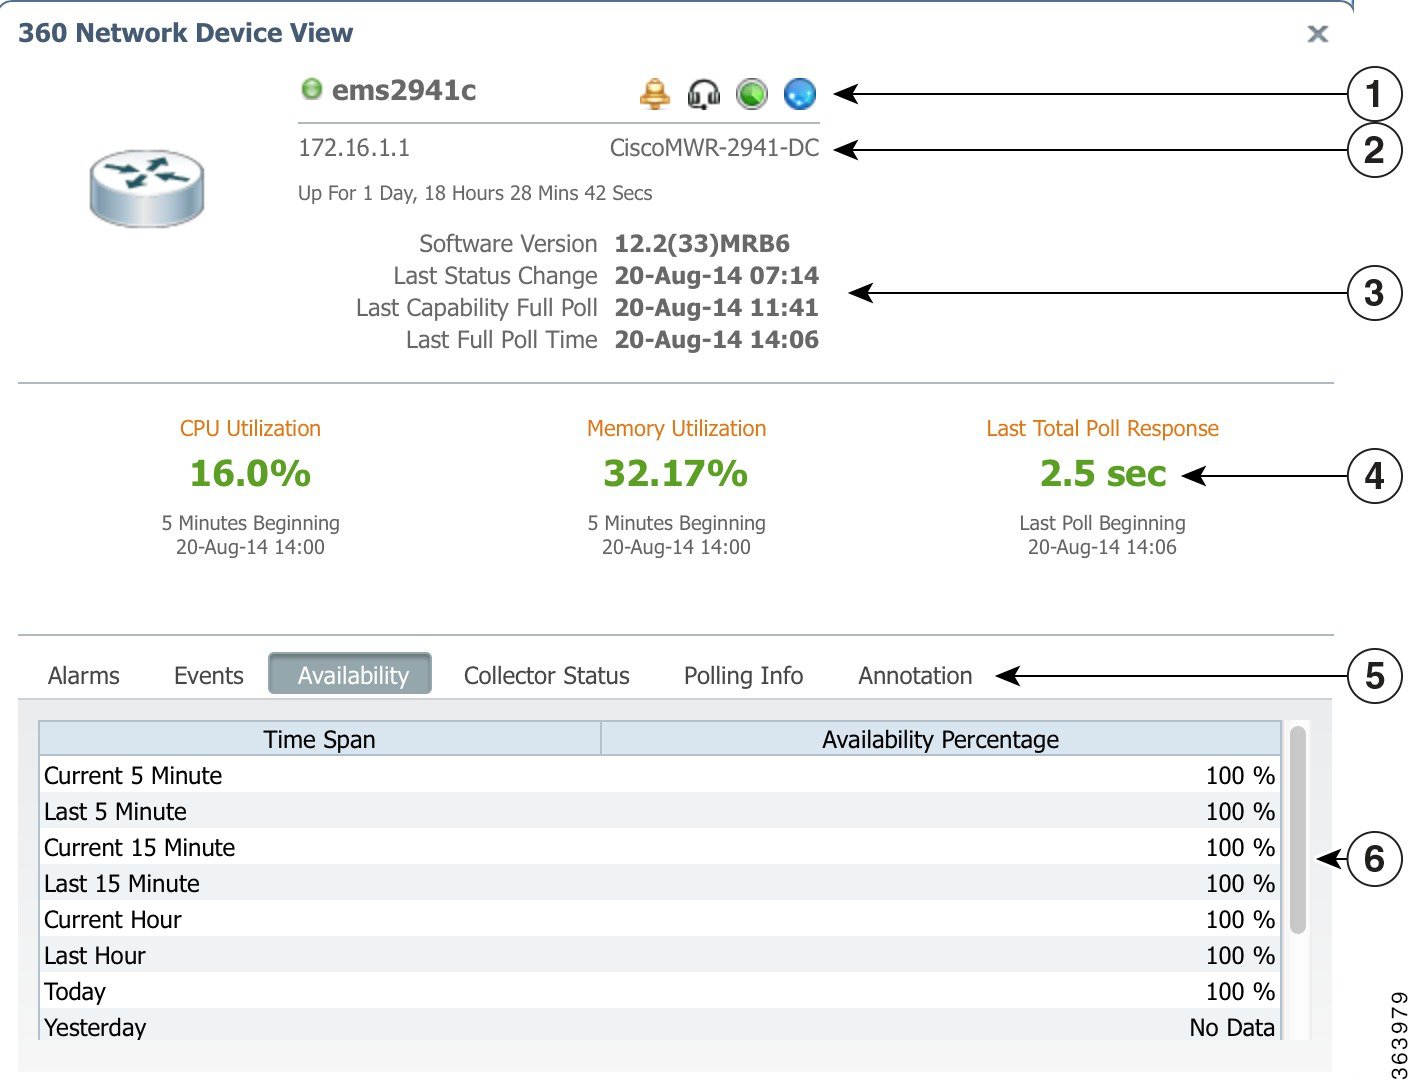
The 360 Network Device Details window (Figure 9-2) appears. Information displayed in the window includes:
- Device name and IP address.
- Software and polling information
- CPU and memory utilization, and the last total poll response, CPU and memory utilization is the average for the specified time period, The timestamp is the beginning of the interval.
- Device alarms, events, availability, collector status, polling information, and annotation.
- Tools that display device alarms in the Alarms window, display the Cisco support website, and run ping and traceroute commands on the device.
Note![]() The data and tabs displayed depend on the particular device and information that is available for it. Data Center devices and device elements, such as hypervisors, UCS server blades, VM, and other Data Center elements will display information specific to the Data Center element, and not necessarily information that appears for standard network devices.
The data and tabs displayed depend on the particular device and information that is available for it. Data Center devices and device elements, such as hypervisors, UCS server blades, VM, and other Data Center elements will display information specific to the Data Center element, and not necessarily information that appears for standard network devices.
Figure 9-2 360 Network Device Details
|
|
|
||
|
|
|
Alarms, Events, Availability, Collector Status, Polling Information, and Annotation tabs. |
|
|
|
|
Note![]() Not all information is displayed for Basic users.
Not all information is displayed for Basic users.
Step 3![]() To close the window, click the Close icon at the top right. The window also closes automatically when you navigate to other windows.
To close the window, click the Close icon at the top right. The window also closes automatically when you navigate to other windows.
Displaying Device Information at the Device Level
Prime Performance Manager allows you to drill down to individual devices and review additional parameters and details not displayed at the network level. including device-level reports, dashboards, properties, event history, alarms, status, and availability.
Device time stamps can be displayed in the device time zone by enabling the Display Device Level Data in Device Time Zone option in User Preferences. Time stamps affected by this option include the time stamp displayed in report titles, calendar popup selections, summary table maximum date strings, graph date strings, tooltip hover information. the Timestamp column in report table format, and the Timestamp values in exported CSV files. For information about changing user preferences, see Customizing the GUI and Information Display.
To display individual device information:
Step 1![]() Navigate to one of the following:
Navigate to one of the following:
- Performance menu > Reports > Choose a report. > Click a device link in the report.
- Network menu > Devices
- Network menu > Alarms/Events
- System menu > Gateways/Units
- If you attached devices to custom report views, display the view or subview. (For information about custom report views, see Creating and Managing Custom Report Views.)
Step 2![]() Click a device link or, if you are displaying a custom view, display the view or subview containing the device.
Click a device link or, if you are displaying a custom view, display the view or subview containing the device.
At the individual device view, the following is displayed:
Note![]() In addition to the menus listed below, custom report views and subviews with attached devices will display a View and View Editor menus. For information, see Creating and Managing Custom Report Views.
In addition to the menus listed below, custom report views and subviews with attached devices will display a View and View Editor menus. For information, see Creating and Managing Custom Report Views.
- Reports—Allows you display any report that is generated for the device. The reports that are available depend upon the device hardware and network provisioning. In many cases, you can drill down to detailed device component reports, for example, interfaces and ports. For additional information about the Prime Performance Manager reports, see Chapter7, “Managing Reports, Dashboards, and Views”
- Dashboards—Allows you display any dashboard that can be generated for the device based upon the hardware and technologies that are provisioned for it. Like reports, you can often drill down to view device component dashboards. For additional information about the Prime Performance Manager dashboards, see Managing Dashboards.
- Details—Displays the detailed device information listed in Table 9-11 .
|
|
|
|
|---|---|---|
Allows you to modify devices by choosing a device in the table, then selecting an option. For a description of actions you can perform, see Managing Individual Devices. |
||
Sets the time the GUI page will be refreshed. The range is 30 to 900 seconds. The default is 180 seconds. |
||
The custom device name, if one is defined. If not, this field displays Unknown. |
||
If devices were imported from Prime Network, the device name (or business tag, if defined) as it appears in Prime Network. |
||
The device IP address or DNS name, as discovered by Prime Performance Manager. |
||
The name set on the router and returned, using the SNMP variable sysName. |
||
If the device has a report policy, the policy is displayed here. Clicking its link takes you to the policy on the Report Policy tab. Other entries you might see:
For information about report policies, see Creating Report Policies. |
||
The polling group to which the device is assigned. For information about polling groups, see Creating and Editing Device Polling Groups. |
||
Indicates whether maintenance mode is enabled for the device. If maintenance mode is enabled, alarms and report polling are disabled. The Status Information area displays the dates the alarms are disabled, and the dates maintenance mode is enabled in red text. |
||
|
||
Reason for the current device status. (If you cannot see all of the status reason text, place the cursor over the cell to see the full text in a tooltip.) A list of possible reasons is provided in the stateReasons.html, located at: |
||
Displays the memory utilization at the time of the poll. If the device has multiple memory pools, the utilization is the average of the pools. Text color is based on the Enabled Colors user preference:
For information about user preferences, see Customizing the GUI and Information Display. |
||
Displays the memory utilization at the time of the poll. If the device has multiple CPUs, the utilization is the average of the CPUs. Text color is also based on the Enabled Colors user preference. |
||
The contact person for the managed device and contact information, if available. If the contact details are not available, this field displays Unknown. |
||
The software version (for example, the ONS package or IOS version) that is installed on the device. |
||
Comprehensive information about the software that is installed on the device. |
||
The device type, which is usually based on the device family, for example, Cisco1706 for Cisco 1706 Series Routers. If the device family type is not known, IP Device is displayed. Prime Performance Manager gateway and unit servers are listed as ciscoGatewayServer and ciscoUnitServer. |
||
The device physical location. If the device location details are not available, this field displays Unknown. |
||
The time the device has been up, in days, hours, minutes, and seconds. |
||
- Data Collection—Displays the device data collection information shown in Table 9-12 .
|
|
|
|
|---|---|---|
Allows you to modify devices by choosing a device in the table, then selecting an option. For a description of actions you can perform, see Managing Individual Devices. |
||
Sets the time the GUI page will be refreshed. The range is 30 to 900 seconds. The default is 180 seconds. |
||
Indicates the device status. See Table 9-2 for a list of device statuses. |
||
Indicates whether report polling is enabled for this device. |
||
The date and time when Prime Performance Manager first discovered the device. |
||
The device uptime, that is, the time since the last startup or reboot. |
||
The last time the device capabilities were assessed. This query is performed once every 24 hours at a minimum. It also occurs when Prime Performance Manager detects a device configuration or entity change, or when the SystemCapabilities or UserCapabilities file changes. |
||
The date and time of the last full poll of the device for device-related MIBs. |
||
The time, in seconds, taken by this device to respond to the last poll request. |
||
The average time, in seconds, taken by this device to respond to poll requests. |
||
The polling group to which the device is assigned. For information about polling groups, see Creating and Editing Device Polling Groups. |
||
If the device has a report policy, the policy is displayed here. Clicking its link takes you to the policy on the Report Policy tab. Other entries you might see:
For information about report policies, see Creating Report Policies. |
||
Indicates whether data has been retrieved through SNMP. Will be Active unless data has never been retrieved using SNMP. |
||
Indicates whether Storage Management Institute statistics were collected. |
||
Indicates whether a hypervisor is active. This will normally be active for VM devices. |
||
Indicates whether Java Management Extensions data was collected. |
||
Indicates whether Data Collection Manager bulk statistics were collected. |
||
Indicates whether Internet Control Message Protocol (ICMP) statistics were collected. |
||
Indicates whether small cell bulk statistics were collected. |
||
Indicates whether ganglia monitoring daemon (gmond) statistics were collected. |
||
IP address(es) associated with this device, including the primary address and all backup IP addresses. |
||
The date and time of the last full poll of the device. If the IP address has never been polled, Prime Performance Manager displays Never Polled. |
||
Indicates whether the IP address is used for polling, Yes or No. |
- Events—Displays events that have occurred on the device. For a list of event parameters, see Table 10-1.
- Alarms—Displays alarms that have been raised on the device. For a list of event parameters, see Table 10-1.
- Thresholds—Displays thresholds that apply to the device. For information, see Displaying Thresholds by Device.
- Report Status—Displays the reports available for the device.
- Availability—Displays device availability information in table and bar chart format. Availability increments include current and last 15 minutes, hour, day, week and month.
- Star Graphs—Allows you to add selected charts from multiple device reports and effectively create a custom report view for a specific device. For information, see Creating Custom Device Star Graphs.
- Device Status—Displays information from the Details, Data Collection, Events, Alarms, and Availability tabs in a snapshot device status view.
- Probes—Displays any probes that are defined for the devices. Actions and fields include:
–![]() Add Probe—Adds a probe to the device. For information, see the Creating Probes.
Add Probe—Adds a probe to the device. For information, see the Creating Probes.
–![]() Probe Type—The probe type: HTTP, TCP, NTP, DNS, or DHCP.
Probe Type—The probe type: HTTP, TCP, NTP, DNS, or DHCP.
–![]() Enable/Disable—Enables or disables the probe.
Enable/Disable—Enables or disables the probe.
–![]() Edit—Displays the Edit [probe type] Probe dialog box where you can edit the probe parameters. For information, see one of the following topics for the probe type:
Edit—Displays the Edit [probe type] Probe dialog box where you can edit the probe parameters. For information, see one of the following topics for the probe type:
- Annotation—Allows you to add annotation to the device. See Annotating a Device.
Note![]() When you select an individual device, it is added to the Devices navigation list so you can go back to it at any later point during the session. For example, if you select five devices, Device 1, Device 2, Device, 3, Device 4, and Device 5, these devices will appear in the navigation area so you can display them at any point.
When you select an individual device, it is added to the Devices navigation list so you can go back to it at any later point during the session. For example, if you select five devices, Device 1, Device 2, Device, 3, Device 4, and Device 5, these devices will appear in the navigation area so you can display them at any point.
Viewing Information in the Device Header
The following device-level tabs, Reports, Dashboards, Details, Data Collection, Events, Alarms, Thresholds, Report Status, Availability, Star Graphs, Device Status, Probes, and Annotation, display summary information about the device. Information includes:
- Device uptime—The Reports and Dashboard headers display time the device has been active since the last startup or reboot.
- Last update—The date and time of the last GUI update displayed. If the gateway and browser are in separate time zones, both times are displayed.
- Device IP or hostname—The device IP address or hostname is displayed in the center of the header. For the reports and dashboards, device components, for example, VMs, blades, are appended to the device IP address or host name with an asterisk, for example,
- Query interval—The Dashboard header displays the report time period.
- Device and alarm statuses— Icons on the right of the header indicate the device status and highest alarm.
- Report policy—Displayed on the Report Status tab.
- Item count—Displayed on the Events and Alarms tabs.
- Page identifiers—Displayed on the Events, Alarms, Thresholds, and Probes tabs.
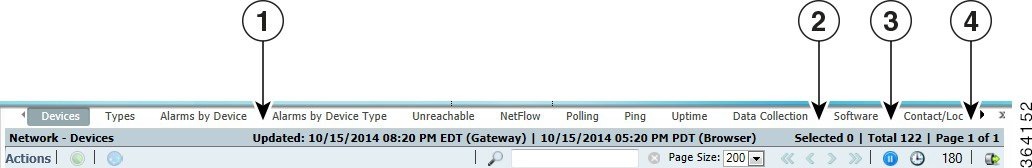
Figure 9-3 shows the device header at the network level. Because the browser is in a different time zone than the gateway, two updated dates and times are shown. Other header options include the number of devices selected, the total number of devices, and the page number.
Figure 9-3 Device Header in Network View
|
|
|
||
|
|
|
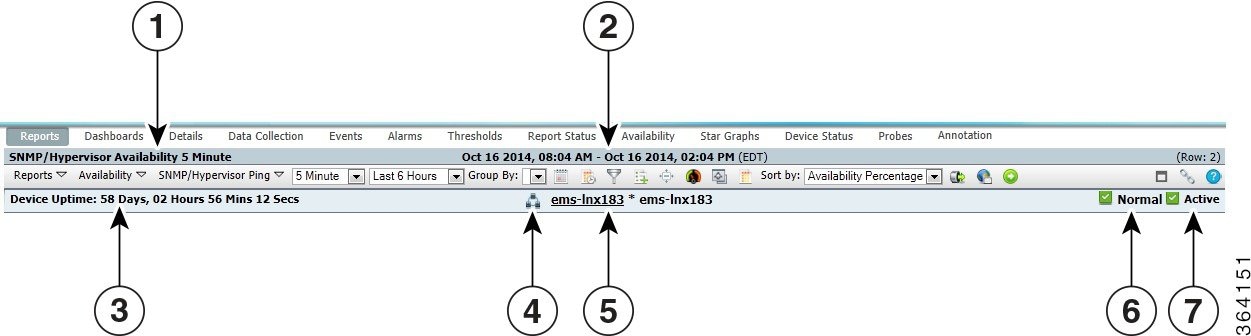
Figure 9-4 shows the device header at the device level for the Reports tab. The report header displays the report name and report period. The device header displays the device uptime, the device name and, because the report is for a device hypervisor, the hypervisor name. The device highest alarm and status icons are also shown.
Figure 9-4 Device Header in Device View
|
|
|
||
|
|
|
||
|
|
|
||
|
|
|
Managing Individual Devices
When you drill down to an individual device, you can perform the management actions that you are allowed to perform from the device summary window.
To manage an individual device:
Step 1![]() Navigate to one of the following:
Navigate to one of the following:
- Performance menu > Reports > Choose a report. > Click a device link in the report.
- Network menu > Devices
- Network menu > Alarms/Events
- System menu > Gateways/Units
- If you attached devices to custom report views, display the view or subview. (For information about custom report views, see Creating and Managing Custom Report Views.)
Step 2![]() Click a device link or, if you are displaying a custom view, display the view or subview containing the device.
Click a device link or, if you are displaying a custom view, display the view or subview containing the device.
Step 3![]() Click the Details or the Data Collection tab.
Click the Details or the Data Collection tab.
Step 4![]() From the Actions menu, choose any of the following options:
From the Actions menu, choose any of the following options:
- Poll Device—Polls the devices selected in the device list.
- Edit Properties—Allows you to edit the device display name and default web port. See Editing a Device Name, Web Port, Time Zone, and Location.
- Edit Device Credentials—Allows you to edit the device connection credentials. See Editing the Device Credentials.
- Edit Report Policy—Allows you to change the report policy assigned to the device or, alternatively, set the report to its default. See Editing the Report Policy Assigned to a Device.
- Edit Polling Policy—Displays the Report Policy dialog box where you can change the polling policy assigned to the device or return the report policy to its default settings. See Creating and Editing Device Polling Groups and Editing the Polling Group Assigned to a Device.
- Edit Management IP Addresses—Allows you to edit a device Management IP addresses. See Editing the Device Management IP Addresses.
- Change Interface Polling—Allows you to remove device interfaces from polling, See Removing Device Interfaces From Polling.
- Relocate Device—Allows you to relocate a device from one unit to another. See Relocating Devices to Units.
- Disable/Enable Sending Alarms and TCA—Disables or enables sending alarms, including threshold crossing alerts, from the selected device. Disable Alarms displays a calendar dialog where you can set the duration the alarms and TCAs will be disabled. The menu item displayed depends on whether the alarms and TCAs are already disabled.
- Acknowledge Alarms—Acknowledges all open alarms on the device.
- Clear Alarms—Clears all open alarms on the device.
- Manage/Unmanage Device—Changes managed devices to unmanaged, and unmanaged devices to managed. The menu item displayed is based on the current device state.
- Enable/Disable Maintenance Mode—Enables or disables maintenance mode. If you place a device into maintenance mode, alarms and reports are disabled for the device. Enable Maintenance Mode displays a calendar dialog where you can set the maintenance mode duration. The menu item displayed depends on the maintenance mode status.
- Annotation—Allows you to add text descriptions and notes to the device. See Annotating a Device.
- Delete—Deletes the selected device(s).
Creating and Editing Device Polling Groups
Device polling is the frequency at which Prime Performance Manager retrieves updated information from devices. When you complete device discovery (see Chapter 5, “Discovering Devices With Prime Performance Manager”), Prime Performance Manager assigns devices to polling groups based on the device type. For example, all discovered Cisco 7606 Series Routers are assigned to a Cisco7606s polling group, all Cisco MWR 1941-DC Mobile Wireless Routers are placed in a CiscoMWR-1941-DC polling group, and so on. The number of polling groups created during device discovery depend on the number of unique device types Prime Performance Manager discovers. If all devices belong to the same device type, then only one polling group is created.
Polling groups are defined by the attributes listed in Table 9-13 . All polling groups created during device discovery are assigned the default values. However, you can:
- Change the polling based on the device type. For example, to change the polling for all Cisco 7606 routers, you would modify the Cisco7606s polling group.
- Create a new polling group and assign devices to it. For example, if you want to assign the same polling parameters to a group of devices with different device types, you create the polling group and assign each device to it.
Editing Polling Group Parameters
Complete the following steps to edit the parameters of an existing polling group:
Step 1![]() Log into the Prime Performance Manager GUI as the administrator user.
Log into the Prime Performance Manager GUI as the administrator user.
Step 2![]() From the Network menu, choose Polling Group Editor.
From the Network menu, choose Polling Group Editor.
Step 3![]() Scroll to the polling group you want to modify and edit the values in the following table cells:
Scroll to the polling group you want to modify and edit the values in the following table cells:
See Table 9-13, for polling group parameter descriptions and default values.
Note![]() You cannot edit the polling group name.
You cannot edit the polling group name.
Step 4![]() On the Polling Group toolbar, click the Save Polling Group tool.
On the Polling Group toolbar, click the Save Polling Group tool.
Tip To see what devices belong to a polling group, under Device List column, click Devices in Polling Group. The devices in the group are displayed in the Device Browser. For information about the Device Browser attributes, see Table 9-2. To return the Device Browser to the default list of network devices, navigate to a different window and refresh the browser page.
Creating a New Polling Group
Complete the following steps to create a new polling group:
Step 1![]() Login to the Prime Performance Manager GUI as the administrator user.
Login to the Prime Performance Manager GUI as the administrator user.
Step 2![]() From the Network menu, choose Polling Group Editor.
From the Network menu, choose Polling Group Editor.
Step 3![]() On the Polling Group Editor toolbar, click the Add Polling Group tool.
On the Polling Group Editor toolbar, click the Add Polling Group tool.
Step 4![]() Complete the following:
Complete the following:
See Table 9-13, for polling group parameter descriptions and default values.
Assigning Devices to Polling Groups
By default, Prime Performance Manager creates device type polling groups and assigns devices to them based on their device type. You can create custom polling groups and reassign the devices to them. To assign a device to a custom polling group:
Step 1![]() Login to the Prime Performance Manager GUI as the administrator user.
Login to the Prime Performance Manager GUI as the administrator user.
Step 2![]() From the Network menu, choose Devices.
From the Network menu, choose Devices.
Step 3![]() In the device table, select the row of the device whose polling group you want to change. To select more than one device, press Shift and highlight the device table row.
In the device table, select the row of the device whose polling group you want to change. To select more than one device, press Shift and highlight the device table row.
Step 4![]() From the Devices window toolbar Actions menu, choose Edit Polling Group.
From the Devices window toolbar Actions menu, choose Edit Polling Group.
Step 5![]() In the Edit Polling Group dialog box, choose the polling group you want to assign. The following options appear:
In the Edit Polling Group dialog box, choose the polling group you want to assign. The following options appear:
- The device type polling group. This option is not displayed if you choose multiple devices with different device types.
- This Device Only—If selected, allows you to edit the polling group parameters and assign it to the selected devices.
- Default—Assigns the device(s) to the default polling group.
- Custom groups—If you created polling groups, they are displayed.
Creating Probes
A probe is a program or other device inserted at a key network point to monitor and/or collect data about network activity. Probes:
- Show you which protocols are being used on your network, which hosts are sending and receiving data, where the traffic is coming from, and when this occurs.
- Provide an overview of the network throughput and the number of hosts, conversations, and protocols seen on the network.
- Provide an overview of the most active protocols, talkers, listeners, hosts, and conversations on your network.
Prime Performance Manager allows you to create the following probe types:
- Transmission Control Protocol (TCP)
- HyperText Transmission Protocol (HTTP)
- Network Timing Protocol (NTP)
- Dynamic Naming Service (DNS)
- Dynamic Host Configuration Protocol (DHCP)
Probe creation procedures are provided in the following topics:
- Creating a DHCP Probe
- Creating a DNS Probe
- Creating an HTTP Probe
- Creating a TCP Probe
- Creating an NTP Probe
Creating a DHCP Probe
The DHCP probe helps to discover DHCP servers on the network. The probe broadcasts multiple DHCP request packets from a physical interface. Different request packet types are sent but a DHCP server may respond only to some requests depending on the server configuration.
After sending a request packet, DHCP probe listens for responses. Unknown server responses are captured in logs. As DHCP server broadcasts do not cross IP routers, it locates only servers that are attached to the same physical network as the specified interface.
Although DHCP probe supports monitoring only on a single physical interface, you can install a probe on each physical interface; each monitors a different physical network. When running multiple copies of DHCP probe, be sure to specify the appropriate file for each instance.
Note![]() Before running DHCP probe on any network other than one for which you are responsible, contact that network’s administrator to take permission for you to run this software on the specified network.
Before running DHCP probe on any network other than one for which you are responsible, contact that network’s administrator to take permission for you to run this software on the specified network.
Step 1![]() Log into the Prime Performance Manager GUI as the administrator user.
Log into the Prime Performance Manager GUI as the administrator user.
Step 2![]() Display the Probe Editor using one of the following:
Display the Probe Editor using one of the following:
The Network Probe Editor window appears.
Step 3![]() On the Probe Editor toolbar, click the Create Probe tool.
On the Probe Editor toolbar, click the Create Probe tool.
Step 4![]() In the Add Probe dialog box Probe Type field, choose:
In the Add Probe dialog box Probe Type field, choose:
Step 5![]() If templates exist and you want to apply one, choose the template from the Apply Template list. Otherwise, continue with Step 6.
If templates exist and you want to apply one, choose the template from the Apply Template list. Otherwise, continue with Step 6.
Step 6![]() If you want to create a template based on entries, click Create Template. Otherwise, continue with Step 7.
If you want to create a template based on entries, click Create Template. Otherwise, continue with Step 7.
Step 7![]() Enter the DHCP probe parameters.
Enter the DHCP probe parameters.
- Device—The device associated with the probe that Prime Performance Manager polls for probe data. You can click the field to display a list of valid devices, or type the device name.
- Name—An arbitrary name assigned to the probe. The name should be unique within Prime Performance Manager when prepended with the device name, that is, Node=abc,Probe=xyz.
- Description—An optional description you can add to help identify the probe.
- Enabled—If checked (default), enables the probe.
- Interval (seconds)— The probe interval. Valid values are 1-300 seconds.
- Response Timeout—The amount of time to wait for a response from the probe before a timeout is issued. Valid values are 1-60 seconds.
- DHCP Server IP Address—(DHCP Probe only) Enter the DHCP server IP address associated with this probe.
- Port—Port on which the name server is listening. Port 67 is the default for DHCP probes and port 547 for DHCPv6 probes.
The new DHCP probe is created and displayed in the Probe Editor.
Creating a DNS Probe
The DNS probe allows you to query DNS servers. A common check is whether your domain name (www.company.com) still points to your web server IP address. The DNS probe allows you to verify your web site domain names, mail server domain name mappings, DNS zone details, and other DNS information contained in text records. The DNS probe allows local servers to automatically fail or recover based on probe results. Probes are constantly sent to the DNS servers to determine their status. If a DNS server fails to respond to a certain number of probes, it is marked as failed. As soon as the DNS server starts to respond to DNS probes, it is returned to the in-service state. The configuration status helps you to find the load balance other ports on the same servers while you are probing DNS.
Step 1![]() Log into the Prime Performance Manager GUI as the administrator user.
Log into the Prime Performance Manager GUI as the administrator user.
Step 2![]() Display the Probe Editor using one of the following:
Display the Probe Editor using one of the following:
The Probe Editor window displays.
Step 3![]() On the Probe Editor toolbar, click the Create Probe tool.
On the Probe Editor toolbar, click the Create Probe tool.
Step 4![]() In the Add Probe dialog box Probe Type field, choose DNS.
In the Add Probe dialog box Probe Type field, choose DNS.
Step 5![]() If templates exist and you want to apply one, choose the template from the Apply Template list. Otherwise, continue with Step 6.
If templates exist and you want to apply one, choose the template from the Apply Template list. Otherwise, continue with Step 6.
Step 6![]() If you want to create a template based on entries, click Create Template. Otherwise, continue with Step 7
If you want to create a template based on entries, click Create Template. Otherwise, continue with Step 7![]() .
.
Step 7![]() Enter the DNS probe parameters.
Enter the DNS probe parameters.
- Device—The device associated with the probe that Prime Performance Manager polls for probe data. If you chose the Probe Editor from the Network menu, you can click the field to display a list of valid devices, or type the device name. If you chose the Probe Editor from the device Probes tab, the device is automatically populated and cannot be changed.
- Name—An arbitrary name assigned to the probe. The name should be unique within Prime Performance Manager when prepended with the device name, that is, Node=abc,Probe=xyz.
- Description—An optional description you can add to help identify the probe.
- Enabled—If checked (default), enables the probe.
- Interval (seconds)— The probe interval. Valid values are 1-300 seconds.
- Response Timeout—The amount of time to wait for a response from the probe before a timeout is issued. Valid values are 1-60 seconds.
- DNS Server IP Address—Enter the DNS server IP address associated with this probe.
- Port—Port on which the name server is listening. This is normally port 53.
- Target Domain—Enter the target web domain address.
- Authoritative Name Server—If the server is a DNS authoritative name server, that is, it is responsible for their supported domains and can delegate authority over subdomains to other name servers, check this box,
- Expected IP Address Table—(optional) The IP addresses you expect to result from the DNS query. Type each entry on a new line.
The new DNS probe is created in the Probe Editor.
Creating an HTTP Probe
An HTTP probe establishes a TCP connection and issues an HTTP request to the server for an expected string and status code. Prime Performance Manager compares the received response with the configured codes, looking for a configured string in the received HTTP page, or verifying the hash tag for the HTTP page. If any of these checks fail, the server is marked as failed. Probe credentials are the username and password used for authentication on the server.
You can use the HTTP probe to verify connectivity and monitor the real servers being load balanced. Probes determine the status of each real server in the server farm. For example, if you configure an expected string and status code and the Prime Performance Manager finds them both in the server response, the server is marked as passed. However, if the Prime Performance Manager does not receive either the server response string or the expected status code, it marks the server as failed
Step 1![]() Log into the Prime Performance Manager GUI as the administrator user.
Log into the Prime Performance Manager GUI as the administrator user.
Step 2![]() Display the Probe Editor using one of the following:
Display the Probe Editor using one of the following:
The Probe Editor window displays.
Step 3![]() On the Probe Editor toolbar, click the Create Probe tool.
On the Probe Editor toolbar, click the Create Probe tool.
Step 4![]() In the Add Probe dialog box Probe Type field, choose HTTP.
In the Add Probe dialog box Probe Type field, choose HTTP.
Step 5![]() If templates exist and you want to apply one, choose the template from the Apply Template list. Otherwise, continue with Step 6.
If templates exist and you want to apply one, choose the template from the Apply Template list. Otherwise, continue with Step 6.
Step 6![]() If you want to create a template based on entries, click Create Template. Otherwise, continue with Step 7
If you want to create a template based on entries, click Create Template. Otherwise, continue with Step 7![]() .
.
Step 7![]() Enter the HTTP probe parameters:
Enter the HTTP probe parameters:
- Device—The device associated with the probe that Prime Performance Manager polls for probe data. If you chose the Probe Editor from the Network menu, you can click the field to display a list of valid devices, or type the device name. If you chose the Probe Editor from the device Probes tab, the device is automatically populated and cannot be changed.
- Name—An arbitrary name assigned to the probe. The name should be unique within Prime Performance Manager when prepended with the device name, that is, Node=abc,Probe=xyz.
- Description—An optional description you can add to help identify the probe.
- Enabled—If checked (default), enables the probe.
- Interval (seconds)— The probe interval. Valid values are 1-300 seconds.
- Open Timeout—The timeout in seconds for opening a connection to the probe, that is, the time the probe waits to open and establish the connection with the server.
- Response Timeout—The amount of time to wait for a response from the probe before a timeout is issued. Valid values are 1-60 seconds.
- IP Address—Enter the HTTP server IP address associated with this probe.
- Port—The TCP port to probe. The range is 0 to 65536.
- Username—(optional) Enter the username associated with the HTTP probe. The maximum length is 64 byte with valid characters.
- Password—(optional) Enter the password for the HTTP probe. The maximum length is 64 byte with valid characters.
- HTTP Header Fields—Click Add Row to add an optional HTTP name and value.
–![]() Name—The HTTP header name. Any name can be assigned.
Name—The HTTP header name. Any name can be assigned.
–![]() Value—The HTTP header value. You can enter any of the following.
Value—The HTTP header value. You can enter any of the following.
For information about HTTP headers, see the W3C RFC 2616 document: http://www.w3.org/Protocols/rfc2616/rfc2616-sec14.html
Note![]() If you type in the method, type in a method exactly as it appears in the drop-down list.
If you type in the method, type in a method exactly as it appears in the drop-down list.
Note![]() If you type in the version, type in a version exactly as it appears in the drop-down list.
If you type in the version, type in a version exactly as it appears in the drop-down list.
–![]() Begin—The bottom range of acceptable HTTP Status codes.
Begin—The bottom range of acceptable HTTP Status codes.
–![]() End— The top range of acceptable HTTP Status codes.
End— The top range of acceptable HTTP Status codes.
Note![]() If you type in the protocol, you can enter HTTP, HTTPS, http, or https.
If you type in the protocol, you can enter HTTP, HTTPS, http, or https.
The new HTTP probe is created in the Probe Editor.
Creating a TCP Probe
TCP probes record TCP connection responses to incoming packets. TCP probes connect to the specified device and port, and then execute a script that sends and receives data from the device.
Step 1![]() Log into the Prime Performance Manager GUI as the administrator user.
Log into the Prime Performance Manager GUI as the administrator user.
Step 2![]() Display the Probe Editor using one of the following:
Display the Probe Editor using one of the following:
The Probe Editor window displays.
Step 3![]() On the Probe Editor toolbar, click the Create Probe tool.
On the Probe Editor toolbar, click the Create Probe tool.
Step 4![]() In the Add Probe dialog box Probe Type field, choose TCP.
In the Add Probe dialog box Probe Type field, choose TCP.
Step 5![]() If templates exist and you want to apply one, choose the template from the Apply Template list. Otherwise, continue with Step 6.
If templates exist and you want to apply one, choose the template from the Apply Template list. Otherwise, continue with Step 6.
Step 6![]() If you want to create a template based on entries, click Create Template. Otherwise, continue with Step 7
If you want to create a template based on entries, click Create Template. Otherwise, continue with Step 7![]() .
.
Step 7![]() Enter the TCP probe parameters.
Enter the TCP probe parameters.
- Device—The device associated with the probe that Prime Performance Manager polls for probe data. If you chose the Probe Editor from the Network menu, you can click the field to display a list of valid devices, or type the device name. If you chose the Probe Editor from the device Probes tab, the device is automatically populated and cannot be changed.
- Name—An arbitrary name assigned to the probe. The name should be unique within Prime Performance Manager when prepended with the device name, that is, Node=abc,Probe=xyz.
- Description—An optional description you can add to help identify the probe.
- Enabled—If checked (default), enables the probe.
- Interval (seconds)— The probe interval. Valid values are 1-300 seconds.
- Open Timeout—The timeout in seconds for opening a connection to the probe, that is, the time the probe waits to open and establish the connection with the server.
- Response Timeout—The amount of time to wait for a response from the probe before a timeout is issued. Valid values are 1-60 seconds.
- IP Address—Enter the TCP server IP address associated with this probe.
- Port—The TCP port to probe. The range is 0 to 65536.
- Over SSL/TLS—Check this box if the TCP connection employs the Secure Sockets Layer (SSL) or Secure Transport Layer cryptographic protocol.
- Send Data—(optional) Data to send on the TCP port. You can enter up to 255 alphanumeric characters.
- Regex—(optional) A regular expression used to inspect the returned TCP port data.
The new TCP probe is created in the Probe Editor.
Creating an NTP Probe
NTP synchronizes computer clocks over a network with a dedicated time server. NTP is required between the source and the target device to provide accurate one-way delay (latency) measurements. Using Prime Performance Manager you can configure NTP probes on the source and target devices.
Step 1![]() Log into the Prime Performance Manager GUI as the administrator user.
Log into the Prime Performance Manager GUI as the administrator user.
Step 2![]() Display the Probe Editor using one of the following:
Display the Probe Editor using one of the following:
The Probe Editor window displays.
Step 3![]() On the Probe Editor toolbar, click the Create Probe tool.
On the Probe Editor toolbar, click the Create Probe tool.
Step 4![]() In the Add Probe dialog box Probe Type field, choose NTP.
In the Add Probe dialog box Probe Type field, choose NTP.
Step 5![]() If templates exist and you want to apply one, choose the template from the Apply Template list. Otherwise, continue with Step 6.
If templates exist and you want to apply one, choose the template from the Apply Template list. Otherwise, continue with Step 6.
Step 6![]() If you want to create a template based on entries, click Create Template. Otherwise, continue with Step 7
If you want to create a template based on entries, click Create Template. Otherwise, continue with Step 7![]() .
.
Step 7![]() Enter the NTP probe parameters.
Enter the NTP probe parameters.
- Device—The device associated with the probe that Prime Performance Manager polls for probe data. If you chose the Probe Editor from the Network menu, you can click the field to display a list of valid devices, or type the device name. If you chose the Probe Editor from the device Probes tab, the device is automatically populated and cannot be changed.
- Name—An arbitrary name assigned to the probe. The name should be unique within Prime Performance Manager when prepended with the device name, that is, Node=abc,Probe=xyz.
- Description—An optional description you can add to help identify the probe.
- Enabled—If checked (default), enables the probe.
- Interval (seconds)— The probe interval. Valid values are 1-300 seconds.
- Response Timeout—The amount of time to wait for a response from the probe before a timeout is issued. Valid values are 1-60 seconds.
- NTP Server IP Address—The target IP Address for the probe. This can be one of the IP addresses associated with the device or it may be arbitrary IP address.
- Port—The NTP port to probe. The range is 0 to 65536.
The new NTP probe is created in the Probe Editor.
 Feedback