User Guide for Cisco Network Registrar 7.2
Bias-Free Language
The documentation set for this product strives to use bias-free language. For the purposes of this documentation set, bias-free is defined as language that does not imply discrimination based on age, disability, gender, racial identity, ethnic identity, sexual orientation, socioeconomic status, and intersectionality. Exceptions may be present in the documentation due to language that is hardcoded in the user interfaces of the product software, language used based on RFP documentation, or language that is used by a referenced third-party product. Learn more about how Cisco is using Inclusive Language.
- Updated:
- March 20, 2015
Chapter: Maintaining Servers and Databases
Maintaining Servers and Databases
This chapter explains how to administer and control your local and regional server operations.
See Also
Managing Servers
Scheduling Recurring Tasks
Logging Server Events
Log Files
View Change Log
Dynamic Update on Server Log Settings
Monitoring and Reporting Server Status
Running Data Consistency Rules
Troubleshooting
Managing Servers
If you are assigned the server-management subrole of the ccm-admin role, you can manage the Cisco Network Registrar servers as follows:
•![]() Start—Load the database and start the server.
Start—Load the database and start the server.
•![]() Stop—Stop the server.
Stop—Stop the server.
•![]() Reload—Stop and restart the server. (Note that you do not need to reload the server with each dynamic update. See Chapter 28, "Configuring DNS Update" for details.)
Reload—Stop and restart the server. (Note that you do not need to reload the server with each dynamic update. See Chapter 28, "Configuring DNS Update" for details.)
•![]() Check statistics—See the "Displaying Statistics" section.
Check statistics—See the "Displaying Statistics" section.
•![]() View logs—See the "Searching the Logs" section.
View logs—See the "Searching the Logs" section.
•![]() Manage interfaces—See the specific protocol pages for how to manage server interfaces.
Manage interfaces—See the specific protocol pages for how to manage server interfaces.
Starting and stopping a server is self-explanatory. When you reload the server, Cisco Network Registrar performs three steps—stops the server, loads configuration data, and restarts the server. Only after you reload the server does it use your changes to the configuration.

Note ![]() The DNS, DHCP, and SNMP servers are enabled by default to start on reboot. The TFTP server is not enabled by default to start on reboot. You can change this using [server] type enable or disable start-on-reboot in the CLI.
The DNS, DHCP, and SNMP servers are enabled by default to start on reboot. The TFTP server is not enabled by default to start on reboot. You can change this using [server] type enable or disable start-on-reboot in the CLI.
Local Basic or Advanced and Regional Web UI
You can manage the protocol servers in the following ways depending on if you are a:
•![]() Local or regional cluster administrator—From the Administration menu, choose Manage Servers to open the Manage Servers page.
Local or regional cluster administrator—From the Administration menu, choose Manage Servers to open the Manage Servers page.
The local and regional cluster web UI access to server administration is identical, even though the available functions are different. As a regional administrator, you can check the state and health of the regional CCM server, server agent, and Router Interface Configuration (RIC) server. However, you cannot stop, start, reload, or view statistics, logs, or interfaces for them.
At the local cluster, you can manage the DHCP, DNS, TFTP, and SNMP servers:
–![]() Click the Statistics icon (
Click the Statistics icon ( ) to view statistics for the server. (See the "Displaying Statistics" section.)
–![]() Click the Log icon (
Click the Log icon ( ) in the View Log column to view the log messages for the server. (See the "Logging Server Events" section.)
–![]() Click the Start icon (
Click the Start icon ( ) to start the server.
–![]() Click the Stop icon (
Click the Stop icon ( ) to stop the server.
–![]() Click the Reload icon (
Click the Reload icon ( ) to reload the server.
•![]() Local cluster DNS administrator—From the DNS menu, choose DNS Server to open the Manage DNS Server page.
Local cluster DNS administrator—From the DNS menu, choose DNS Server to open the Manage DNS Server page.
Along with the Statistics (), Log (), Start (), Stop (), and Reload () functions, you can also perform other functions when you click the Run icon ( ) in the Commands column to open the DNS Server Commands page (see Figure 7-1).
In Expert mode, you can also synchronize the CCM server from the DNS server in the Manage DNS Server page. Click Sync CCM Server from DNS Server to open the Sync CCM Server from DNS Server page. Note the change sets to synchronize on this page, then click Run, followed by Return.
Figure 7-1 DNS Server Commands Page (Local Basic)
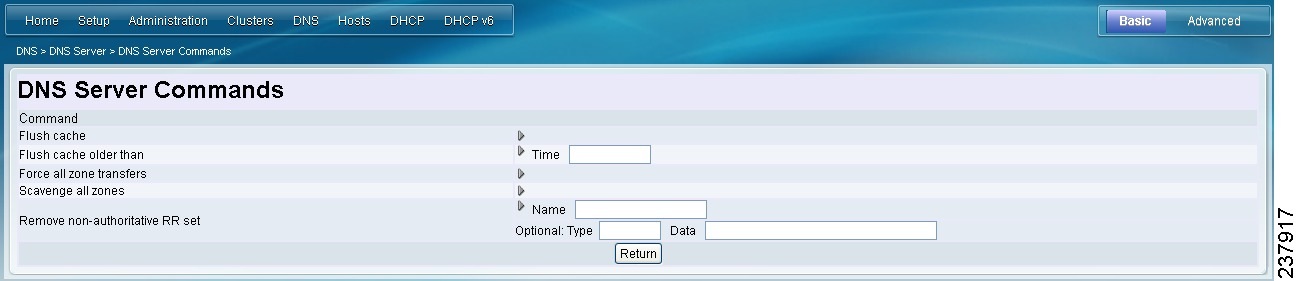
The server command functions are:
–![]() Flushing cache (see the "Flushing DNS Cache" section on page 17-16)—Click the Run icon (). If you want to flush cache older than a certain time, enter the time in the Time field next to Flush cache older than, then click the Run icon. This is the equivalent of dns flushCache in the CLI.
Flushing cache (see the "Flushing DNS Cache" section on page 17-16)—Click the Run icon (). If you want to flush cache older than a certain time, enter the time in the Time field next to Flush cache older than, then click the Run icon. This is the equivalent of dns flushCache in the CLI.
–![]() Forcing all zone transfers (see the "Enabling Zone Transfers" section on page 15-16)—Click the Run icon (). This is the equivalent of dns forceXfer secondary in the CLI.
Forcing all zone transfers (see the "Enabling Zone Transfers" section on page 15-16)—Click the Run icon (). This is the equivalent of dns forceXfer secondary in the CLI.
–![]() Scavenging all zones (see the "Scavenging Dynamic Records" section on page 28-16)—Click the Run icon (). This is the equivalent of dns scavenge in the CLI.
Scavenging all zones (see the "Scavenging Dynamic Records" section on page 28-16)—Click the Run icon (). This is the equivalent of dns scavenge in the CLI.
–![]() Removing nonauthoritative resource record sets (see the "Removing Cached Records" section on page 16-5)—Enter the name of the RR set in the Name field, then click the Run icon (). If you optionally want to remove nonauthoritative RR sets based on specific types or data, enter these values in the Type or Data field, respectively. This is the equivalent of dns removeCachedRR name type data in the CLI.
Removing nonauthoritative resource record sets (see the "Removing Cached Records" section on page 16-5)—Enter the name of the RR set in the Name field, then click the Run icon (). If you optionally want to remove nonauthoritative RR sets based on specific types or data, enter these values in the Type or Data field, respectively. This is the equivalent of dns removeCachedRR name type data in the CLI.
•![]() Local cluster DHCP administrator—Click DHCP, then DHCP Server to open the Manage DHCP Server page. Along with the Statistics (
Local cluster DHCP administrator—Click DHCP, then DHCP Server to open the Manage DHCP Server page. Along with the Statistics ( ), Log (), Start (), Stop (), and Reload () functions, you can also perform other functions when you click the Run icon () in the Commands column to open the DHCP Server Commands page (see Figure 7-2).
Figure 7-2 DHCP Server Commands Page (Local Basic)

This page provides the Get Leases with Limitation ID feature, to find clients that are associated through a common limitation identifier (see the "Administering Option 82 Limitation" section on page 24-18). Enter at least the IP address of the currently active lease in the IP Address field, then click the Run icon (). You can also enter the limitation ID itself in the form nn:nn:nn or as a string ("nnnn"), in which case the IP address becomes the network in which to search. This function is the equivalent of dhcp limitationList ipaddress limitation-id show in the CLI.
CLI Commands
In the CLI, the regional cluster allows CCM server management only:
•![]() To start the server, use server type start (or simply type start; for example, dhcp start).
To start the server, use server type start (or simply type start; for example, dhcp start).
•![]() To stop the server, use server type stop (or simply type stop; for example, dhcp stop). If stopping the server, it is advisable to save it first using the save command.
To stop the server, use server type stop (or simply type stop; for example, dhcp stop). If stopping the server, it is advisable to save it first using the save command.
•![]() To reload the server, use server type reload (or simply type reload; for example, dhcp reload). Cisco Network Registrar stops the server you chose, loads the configuration data, and then restarts the server.
To reload the server, use server type reload (or simply type reload; for example, dhcp reload). Cisco Network Registrar stops the server you chose, loads the configuration data, and then restarts the server.
•![]() To set or show attributes for the server, use [server] type set attribute=value or [server] type show. For example:
To set or show attributes for the server, use [server] type set attribute=value or [server] type show. For example:
nrcmd> ccm set ipaddr=192.168.50.10
Scheduling Recurring Tasks
In Basic and Advanced user mode in the local cluster web UI, you can schedule a number of recurring tasks. These tasks are:
•![]() Reloading the DHCP server.
Reloading the DHCP server.
•![]() Reloading the DNS server.
Reloading the DNS server.
•![]() Synchronizing DHCP failover server pairs:
Synchronizing DHCP failover server pairs:
–![]() If in staged dhcp edit mode, reload the main DHCP server.
If in staged dhcp edit mode, reload the main DHCP server.
–![]() Synchronize the failover configuration to the backup DHCP server.
Synchronize the failover configuration to the backup DHCP server.
–![]() If in staged dhcp edit mode, reload the backup DHCP server.
If in staged dhcp edit mode, reload the backup DHCP server.
•![]() Synchronizing High-Availability (HA) DNS server pairs:
Synchronizing High-Availability (HA) DNS server pairs:
–![]() If in staged dhcp edit mode, reload the main DNS server.
If in staged dhcp edit mode, reload the main DNS server.
–![]() Synchronize the HA DNS configuration to the backup DNS server.
Synchronize the HA DNS configuration to the backup DNS server.
–![]() If in staged dhcp edit mode, reload the backup DNS server.
If in staged dhcp edit mode, reload the backup DNS server.
•![]() Synchronizing zone distribution maps:
Synchronizing zone distribution maps:
–![]() If in staged dhcp edit mode, reload the main DNS server.
If in staged dhcp edit mode, reload the main DNS server.
–![]() If in staged dhcp edit mode, reload the backup HA DNS server.
If in staged dhcp edit mode, reload the backup HA DNS server.
–![]() Synchronize the zone distribution maps.
Synchronize the zone distribution maps.
–![]() If in staged dhcp edit mode, reload the secondary DNS server or servers.
If in staged dhcp edit mode, reload the secondary DNS server or servers.
Local Basic or Advanced Web UI
To set up one or more of these recurring server tasks:
Step 1 ![]() From the Administration menu, choose Schedule Tasks to open the List/Add Scheduled Tasks page.
From the Administration menu, choose Schedule Tasks to open the List/Add Scheduled Tasks page.
Step 2 ![]() Click Add Task to open the Add Scheduled Task page.
Click Add Task to open the Add Scheduled Task page.
Step 3 ![]() Enter values in the appropriate fields:
Enter values in the appropriate fields:
a. ![]() Name of the scheduled task. This can be any identifying text string.
Name of the scheduled task. This can be any identifying text string.
b. ![]() Description of the task.
Description of the task.
c. ![]() Pull down from the available list of task types, which are:
Pull down from the available list of task types, which are:
•![]() dhcp-reload—Reloads the DHCP server
dhcp-reload—Reloads the DHCP server
•![]() dns-reload—Reloads the DNS server
dns-reload—Reloads the DNS server
•![]() sync-dhcp-pair—Synchronizes the DHCP failover server pair
sync-dhcp-pair—Synchronizes the DHCP failover server pair
•![]() sync-dns-pair—Synchronizes the HA DNS failover server pair
sync-dns-pair—Synchronizes the HA DNS failover server pair
•![]() sync-zd-map—Synchronizes zone distribution maps
sync-zd-map—Synchronizes zone distribution maps
•![]() sync-dns-update-map—Synchronizes DNS update maps
sync-dns-update-map—Synchronizes DNS update maps
d. ![]() In Advanced mode, select to enable or disable the task (the preset value is enabled in both modes).
In Advanced mode, select to enable or disable the task (the preset value is enabled in both modes).
e. ![]() Indicate the time interval for the scheduled task, such as 60m or 4w2d.
Indicate the time interval for the scheduled task, such as 60m or 4w2d.
f. ![]() Indicate any scheduled offset, or when you want the task scheduled at a fixed time of day, as an hour from 12:00 midnight. The scheduled interval must be less than 24h, and the offset must be less than the interval. For example, if you set the scheduled-interval to 4h and the scheduled-offset to 2, the task would occur at 2:00 A.M., 6:00 A.M., 10:00 A.M., 2:00 P.M., 6:00 P.M., and 10:00 P.M.
Indicate any scheduled offset, or when you want the task scheduled at a fixed time of day, as an hour from 12:00 midnight. The scheduled interval must be less than 24h, and the offset must be less than the interval. For example, if you set the scheduled-interval to 4h and the scheduled-offset to 2, the task would occur at 2:00 A.M., 6:00 A.M., 10:00 A.M., 2:00 P.M., 6:00 P.M., and 10:00 P.M.
g. ![]() If you are synchronizing a DHCP failover pair, HA DNS pair, or zone distribution map, you can also choose the relevant object identifier associated with the task.
If you are synchronizing a DHCP failover pair, HA DNS pair, or zone distribution map, you can also choose the relevant object identifier associated with the task.
Step 4 ![]() Click Add New Task.
Click Add New Task.
Step 5 ![]() If you click the name of the task on the List/Add Scheduled Tasks page, on the Edit Scheduled Task page you can view (in the Task Status section) the last status or the list of last errors (if any) that occurred during the task execution. Click Run Now to run the task immediately.
If you click the name of the task on the List/Add Scheduled Tasks page, on the Edit Scheduled Task page you can view (in the Task Status section) the last status or the list of last errors (if any) that occurred during the task execution. Click Run Now to run the task immediately.
Note ![]() The DNS server startup and background loading slows down when HA is enabled before the HA DNS server communicates to its partner. You need to allow the HA DNS server to communicate with its partner before reloading or restarting the DNS server.
The DNS server startup and background loading slows down when HA is enabled before the HA DNS server communicates to its partner. You need to allow the HA DNS server to communicate with its partner before reloading or restarting the DNS server.
Logging Server Events
When you start Cisco Network Registrar, it automatically starts logging Cisco Network Registrar system activity. Cisco Network Registrar maintains all the logs by default on:
•![]() Windows—install-path\logs
Windows—install-path\logs
•![]() Solaris and Linux—install-path/logs (to view these logs, use the tail -f command)
Solaris and Linux—install-path/logs (to view these logs, use the tail -f command)

Tip ![]() To avoid filling up the Windows Event Viewer and preventing Cisco Network Registrar from running, in the Event Log Settings, check the Overwrite Events as Needed box. If the events do fill up, save them to a file, then clear them from the Event Log.
To avoid filling up the Windows Event Viewer and preventing Cisco Network Registrar from running, in the Event Log Settings, check the Overwrite Events as Needed box. If the events do fill up, save them to a file, then clear them from the Event Log.
Local Basic or Advanced and Regional Web UI
Server logging is available in the web UI when you open the Manage Servers page for a server (see the "Managing Servers" section), then click the Log icon () in the View Log column for the server. This opens the Log for Server page. The log is in chronological order with the page with the latest entries shown first. If you need to see earlier entries, click the left arrow at the top or bottom of the page.
See Also
Searching the Logs
Logging Format and Settings
Searching the Logs
The web UI provides a convenient way to search for entries in the activity and startup log files. You can locate specific message text, log message IDs, and message timestamps using a regular expression string entry. When you click the Log icon () in the View Log or View Startup Log column on the Manage Servers page (or one of the specific server pages), this opens a Log for Server page. In the text field next to the Search icon ( ) at the top or bottom of the page, enter the search string in the regular expression syntax. (For example, entering name? searches for occurrences of the string name in the log file.) Click the Search icon () to view the results of log search.
Click the name of the log message, which opens the Log for Server page with the full message text. To view the full message text, click the name of the log message. Change between Table and Text view by clicking the Log icon (). Click Close on the Log Search Result page to close the browser window.
Logging Format and Settings
The server log entries include the following categories:
•![]() Activity—Logs the activity of your servers.
Activity—Logs the activity of your servers.
•![]() Info—Logs standard operations of the servers, such as starting up and shutting down.
Info—Logs standard operations of the servers, such as starting up and shutting down.
•![]() Warning—Logs warnings, such as invalid packets, user miscommunication, or an error in a script while processing a request.
Warning—Logs warnings, such as invalid packets, user miscommunication, or an error in a script while processing a request.
•![]() Error—Logs events that prevent the server from operating properly, such as out of memory, unable to acquire resources, or errors in configuration.
Error—Logs events that prevent the server from operating properly, such as out of memory, unable to acquire resources, or errors in configuration.
Note ![]() Warnings and errors go to the Event Viewer on Windows (see the Tip). For a description of the log messages for each server module, see the install-path/docs/msgid/MessageIdIndex.html file.
Warnings and errors go to the Event Viewer on Windows (see the Tip). For a description of the log messages for each server module, see the install-path/docs/msgid/MessageIdIndex.html file.
Local Basic or Advanced and Regional Web UI
You can affect which events to log. For example, to set the logging for the local cluster DNS and DHCP server:
•![]() DNS—From the DNS menu, choose DNS Server to open the Manage DNS Server page. Click the name of the server to open the Edit DNS Server page. Expand the Logging attributes section to view the log settings. Make changes to these settings as desired, click Modify Server, then reload the server. (See Table 17-2 on page 17-25 for the log settings to maximize DNS server performance.)
DNS—From the DNS menu, choose DNS Server to open the Manage DNS Server page. Click the name of the server to open the Edit DNS Server page. Expand the Logging attributes section to view the log settings. Make changes to these settings as desired, click Modify Server, then reload the server. (See Table 17-2 on page 17-25 for the log settings to maximize DNS server performance.)
•![]() DHCP—From the DHCP menu, choose DHCP Server to open the Manage DHCP Server page. Click the name of the server to open the Edit DHCP Server page. Expand the Logging section to view the log settings. Make changes to these settings as desired, click Modify Server, then reload the server. (See Table 23-3 on page 23-15 for the log settings to maximize DHCP server performance.)
DHCP—From the DHCP menu, choose DHCP Server to open the Manage DHCP Server page. Click the name of the server to open the Edit DHCP Server page. Expand the Logging section to view the log settings. Make changes to these settings as desired, click Modify Server, then reload the server. (See Table 23-3 on page 23-15 for the log settings to maximize DHCP server performance.)
CLI Commands
Use dns set log-settings, dhcp set log-settings, and tftp set log-settings for the respective servers.
Log Files
Table 7-1 describes the Cisco Network Registrar log files in the install-path/logs directory.
Each component can generate a number of log files, each with a preconfigured maximum size of 1 MB. The first log file name has the _log suffix. When this file reaches its maximum size, it gets the .01 version extension appended to its name and a new log file is created without the version extension. Each version extension is incremented by one for each new file created. When the files reach their configured maximum number, the oldest file is deleted and the next oldest assumes its name. The usual maximum number is four for the DNS, DHCP, and TFTP servers.
Cisco Network Registrar also has server_startup_log files. This applies to the CCM, DHCP, DNS, and TFTP servers. These files log the start up and shut down phases of the server (the information is similar to the normal log file information). Server startup log files are useful in diagnosing problems that have been reported when the server was last started.
The number of these start-up logs is fixed at four for a server, and the size is fixed at one MB per server.
Note ![]() Some user commands can create User authentication entries in the Server Agent log because of separate connections to the cluster. Do not interpret these as a system security violation by another user.
Some user commands can create User authentication entries in the Server Agent log because of separate connections to the cluster. Do not interpret these as a system security violation by another user.
CLI Commands
You can check the configured maximums for the DNS, DHCP, and TFTP servers using [server] type serverLogs show in the CLI, which shows the maximum number (nlogs) and size (logsize) of these protocol server log files. You can adjust these parameters using [server] type serverLogs set nlogs=value and [server] type serverLogs set logsize=value. You cannot adjust these maximums for any of the other log files.
Note ![]() A change to the server logs will not take effect until you restart Cisco Network Registrar.
A change to the server logs will not take effect until you restart Cisco Network Registrar.
View Change Log
In the web UI, you can view the change logs and tasks associated with configurations you make.
Local Basic and Advanced Web UI
From the Administration menu, choose Change Log. To view the change log, you must be assigned the database subrole of the ccm-admin or regional-admin role:
•![]() The View Change Log page shows all the change logs, sorted by DBSN name. To get to the bottom of the list, click the right arrow at the bottom left of the page. Click the DBSN number of the change log entry to open a View Change Set page for it.
The View Change Log page shows all the change logs, sorted by DBSN name. To get to the bottom of the list, click the right arrow at the bottom left of the page. Click the DBSN number of the change log entry to open a View Change Set page for it.
On the View Change Log page, you can filter the list, manually trim it, and save it to a file. You can filter the list by:
•![]() Start and end dates
Start and end dates
•![]() Administrator who initiated the changes
Administrator who initiated the changes
•![]() Configuration object class
Configuration object class
•![]() Specific object
Specific object
•![]() Object identifier (ID), in the format OID-00:00:00:00:00:00:00:00
Object identifier (ID), in the format OID-00:00:00:00:00:00:00:00
•![]() Server
Server
•![]() Database
Database
Click Filter List or Clear Filter (to clear the filter that persists through the session). You can initiate a trim of the change log by setting how many days old you want the record to get before trimming it, by setting a number of days value in the "older than" field and clicking the Delete icon ( ).
).
To save the change log entries to a comma-separated values (CSV) file, click the Save icon ( ).
).
If a task is associated with a change log, it appears on the View Change Set page. You can click the task name to open the View CCM Task page for it.
Dynamic Update on Server Log Settings
The DHCP and the DNS servers register the changes on the server logs only during the server configuration, which happens during a reload. Reloading the servers is time consuming. Cisco Network Registrar allows the DHCP and DNS servers to register the changes to log settings, without a reload.
Local Basic or Advanced Web UI
To dynamically update DHCP server log settings, do the following:
Step 1 ![]() From the DHCP menu, choose DHCP Server. The Manage DHCP Server page appears.
From the DHCP menu, choose DHCP Server. The Manage DHCP Server page appears.
Step 2 ![]() Click the name of the DHCP server to open the Edit DHCP Server page.
Click the name of the DHCP server to open the Edit DHCP Server page.
Step 3 ![]() Modify the log settings as desired.
Modify the log settings as desired.
Step 4 ![]() Click Modify Server at the bottom of the page. The new log settings are applied to the DHCP server.
Click Modify Server at the bottom of the page. The new log settings are applied to the DHCP server.
Step 5 ![]() The Manage DHCP Server page is displayed with an updated page refresh time.
The Manage DHCP Server page is displayed with an updated page refresh time.
To dynamically update DNS server log settings, do the following:
Step 1 ![]() From the DNS menu, choose DNS Server. This opens the Manage DNS Server page.
From the DNS menu, choose DNS Server. This opens the Manage DNS Server page.
Step 2 ![]() Click the name of the DNS server to open the Edit DNS Server page.
Click the name of the DNS server to open the Edit DNS Server page.
Step 3 ![]() Modify the log settings as desired.
Modify the log settings as desired.
Step 4 ![]() Click Modify Server at the bottom of the page. The new log settings are applied to the DNS server. The Manage DNS Server page is displayed with an updated page refresh time.
Click Modify Server at the bottom of the page. The new log settings are applied to the DNS server. The Manage DNS Server page is displayed with an updated page refresh time.
Note ![]() If the dhcp-edit-mode or dns-edit-mode is set to synchronous, and if the server running, the change in server log settings is communicated to the server.
If the dhcp-edit-mode or dns-edit-mode is set to synchronous, and if the server running, the change in server log settings is communicated to the server.
To dynamically update the DHCP or DNS server log settings using the CLI, you must have the appropriate edit-mode set to synchronous. After changing the server log settings, use the save command to save the settings.
For example:
nrcmd>session set dhcp-edit-mode=synchronous
nrcmd>dhcp set log-settings=new-settings
nrcmd>save
Monitoring and Reporting Server Status
Monitoring the status of a server involves checking its:
•![]() State
State
•![]() Health
Health
•![]() Statistics
Statistics
•![]() Log messages
Log messages
•![]() Address usage
Address usage
•![]() Related servers (DNS and DHCP)
Related servers (DNS and DHCP)
•![]() Leases (DHCP)
Leases (DHCP)
See Also
Server States
Displaying Health
Displaying Statistics
Displaying IP Address Usage
Displaying Related Servers
Displaying Leases
Server States
All Cisco Network Registrar protocol servers (DNS, DHCP, SNMP, and TFTP) pass through a state machine consisting of the following states:
•![]() Loaded—First step after the server agent starts the server (transitional).
Loaded—First step after the server agent starts the server (transitional).
•![]() Initialized—Server was stopped or fails to configure.
Initialized—Server was stopped or fails to configure.
•![]() Unconfigured—Server is not operational because of a configuration failure (transitional).
Unconfigured—Server is not operational because of a configuration failure (transitional).
•![]() Stopped—Server was administratively stopped and is not running (transitional).
Stopped—Server was administratively stopped and is not running (transitional).
•![]() Running—Server is running successfully.
Running—Server is running successfully.
The two essential states are initialized and running, because the server transitions through the states so quickly that the other states are essentially invisible. Normally, when the server agent starts the server, it tells the server to be up. The server process starts, sets its state to loaded, then moves up to running. If you stop the server, it walks down the states to initialized, and if you restart, it moves up to running again. If it fails to configure for some reason, it drops back to initialized, as if you had stopped it.
There is also an exiting state that the server is in very briefly when the process is exiting. The user interface can also consider the server to be disabled, but this rarely occurs and only when there is no server process at all (the server agent was told not to start one).
Displaying Health
You can display aspects of the health of a server, or how well it is running. The following items can decrement the server health, so you should monitor their status periodically. For the:
•![]() Server agent (local and regional clusters)
Server agent (local and regional clusters)
•![]() CCM server (local and regional clusters)
CCM server (local and regional clusters)
•![]() DNS server (local cluster):
DNS server (local cluster):
–![]() Configuration errors
Configuration errors
–![]() Memory
Memory
–![]() Disk space usage
Disk space usage
–![]() Inability to contact its root servers
Inability to contact its root servers
•![]() DHCP server (local cluster):
DHCP server (local cluster):
–![]() Configuration errors
Configuration errors
–![]() Memory
Memory
–![]() Disk space usage
Disk space usage
–![]() Packet caching low
Packet caching low
–![]() Options not fitting in the stated packet limit
Options not fitting in the stated packet limit
–![]() No more leases available
No more leases available
•![]() TFTP server (local cluster):
TFTP server (local cluster):
–![]() Memory
Memory
–![]() Socket read or write error
Socket read or write error
–![]() Exceeding the overload threshold and dropping request packets
Exceeding the overload threshold and dropping request packets
•![]() RIC server (regional cluster)
RIC server (regional cluster)
Server Health Status
The server health status varies from the value 0 to 10. The value 0 means the server is not running and 10 means the server is running. Some of the servers report only 0 or 10, and not anything in between. When a server reports a value from 1 to 9, it means that it detected conditions that indicate possible problems. It has nothing to do with the actual performance of the server. So, if the health of the server is a value from 1 to 9, the server log files need to be reviewed to see what errors were logged.
Note ![]() Depending on the level of activity and the size and number of log files, the condition that reduced the server health might not be visible in the log files. It is important to review the log files, but the servers do not log all the conditions that reduce the server health.
Depending on the level of activity and the size and number of log files, the condition that reduced the server health might not be visible in the log files. It is important to review the log files, but the servers do not log all the conditions that reduce the server health.
The following conditions can reduce the DHCP server health:
•![]() Configuration errors (occurs when the server is getting started or restarting)
Configuration errors (occurs when the server is getting started or restarting)
•![]() When the server detects out-of-memory conditions
When the server detects out-of-memory conditions
•![]() When packet receive failures occur
When packet receive failures occur
•![]() When packets are dropped because the server is out of request or response buffers
When packets are dropped because the server is out of request or response buffers
•![]() When the server is unable to construct a response packet
When the server is unable to construct a response packet
Similar conditions exist for the TFTP server.
Tip ![]() Health values range from 0 (the server is not running) to 10 (the highest level of health). It is recommended that the health status can be ignored, with the understanding that zero means server is not running and greater than zero means server is running. On Solaris or Linux, you can run the cnr_status command, in the install-path/usrbin/ directory, to see if your local cluster server is running. For more information on how to check whether the local cluster server is running, see the Installation Guide for Cisco Network Registrar.
Health values range from 0 (the server is not running) to 10 (the highest level of health). It is recommended that the health status can be ignored, with the understanding that zero means server is not running and greater than zero means server is running. On Solaris or Linux, you can run the cnr_status command, in the install-path/usrbin/ directory, to see if your local cluster server is running. For more information on how to check whether the local cluster server is running, see the Installation Guide for Cisco Network Registrar.
Local Basic or Advanced and Regional Web UI
From the Administration menu, select Manage Servers. Check the Manage Servers page for the state and health of each server.
CLI Commands
Use [server] type getHealth. The number 10 indicates the highest level of health, 0 that the server is not running.
Displaying Statistics
To display server statistics, the server must be running.
Local Basic or Advanced and Regional Web UI
Go to the Manage Servers page, then click the Statistics icon (), if available, in the Statistics column. On the Server Statistics page, click the name of the attribute to get popup help.
The DHCP and DNS statistics are each divided into two groups of statistics. The first group is for total statistics and the second group is for sample statistics. The total statistics are accumulated over time. The sample statistics occur during a configurable sample interval. The names of the two categories vary per server and per user interface, and are identified in Table 7-2.
To set up the sample counters, you must activate either the collect-sample-counters attribute for the server or a log-settings attribute value called activity-summary. You can also set a log-settings value for the sample interval for each server, which is preset to 5 minutes. The collect-sample-counters attribute is preset to true for the DNS server, but is preset to false for the DHCP server. For example, to enable the sample counters and set the interval for DHCP, set the following attributes for the DHCP server:
•![]() Enable collect-sample-counters (dhcp enable collect-sample-counters)
Enable collect-sample-counters (dhcp enable collect-sample-counters)
•![]() Set log-settings for activity-summary (dhcp set log-settings=activity-summary)
Set log-settings for activity-summary (dhcp set log-settings=activity-summary)
•![]() Set activity-summary-interval to 5m (dhcp set activity-summary-interval=5m)
Set activity-summary-interval to 5m (dhcp set activity-summary-interval=5m)
CLI Commands
In the CLI, if you use [server] type getStats, the statistics are encoded in curly braces followed by sets of digits, as described in Table 7-3 for DNS, Table 7-4 for DHCP, and Table 7-5 for TFTP. The server type getStats all command is more verbose and identifies each statistic on a line by itself. Using the additional sample keyword shows the sample statistics only.
Reset the counters and total statistic by using dhcp resetStats or dns resetStats.
See Also
DNS Statistics
DHCP Statistics
TFTP Statistics
DNS Statistics
The DNS server statistics in the web UI appear on the DNS Server Statistics page, click on the statistic's name to read its description. You can refresh the DNS Server Statistics.
The DNS server statistics that you can view are:
•![]() Attribute—Displays server statistics such as server identifier, recursive service, process uptime, time since reset, and so on.
Attribute—Displays server statistics such as server identifier, recursive service, process uptime, time since reset, and so on.
Total Statistics
•![]() Performance Statistics—Displays the total statistics of the DNS Server performance.
Performance Statistics—Displays the total statistics of the DNS Server performance.
•![]() Query Statistics—Displays the total statistics of the queries.
Query Statistics—Displays the total statistics of the queries.
•![]() Security Statistics—Displays the total statistics of the security.
Security Statistics—Displays the total statistics of the security.
•![]() Error Statistics—Displays the total statistics of the errors.
Error Statistics—Displays the total statistics of the errors.
•![]() Max Counter Statistics—Displays the total statistics of the maximum number of concurrent threads, RRs, DNS update latency, concurrent packets, and so on.
Max Counter Statistics—Displays the total statistics of the maximum number of concurrent threads, RRs, DNS update latency, concurrent packets, and so on.
•![]() HA Statistics—Displays the total statistics of the HA DNS Server.
HA Statistics—Displays the total statistics of the HA DNS Server.
•![]() IPv6 Statistics—Displays the total statistics of the IPv6 packets received and sent.
IPv6 Statistics—Displays the total statistics of the IPv6 packets received and sent.
Sample Statistics
•![]() Performance Statistics—Displays the sample statistics about the DNS Server performance.
Performance Statistics—Displays the sample statistics about the DNS Server performance.
•![]() Query Statistics—Displays the sample statistics about the queries.
Query Statistics—Displays the sample statistics about the queries.
•![]() Security Statistics—Displays the sample statistics about the security.
Security Statistics—Displays the sample statistics about the security.
•![]() Error Statistics—Displays the sample statistics about the errors.
Error Statistics—Displays the sample statistics about the errors.
•![]() Max Counter Statistics—Displays the sample statistics about the maximum number of concurrent threads, RRs, DNS update latency, concurrent packets, and so on.
Max Counter Statistics—Displays the sample statistics about the maximum number of concurrent threads, RRs, DNS update latency, concurrent packets, and so on.
•![]() HA Statistics—Displays the sample statistics about the HA DNS Server.
HA Statistics—Displays the sample statistics about the HA DNS Server.
•![]() IPv6 Statistics—Displays the sample statistics about the IPv6 packets received and sent.
IPv6 Statistics—Displays the sample statistics about the IPv6 packets received and sent.
Note ![]() To get the most recent data, click the Refresh Server Statistics icon () at the top left corner of the page.
To get the most recent data, click the Refresh Server Statistics icon () at the top left corner of the page.
The CLI dns getStats command has the following options:
dns getStats [performance | query | errors | security | maxcounters | ha | ipv6 | all]
[total | sample]
The dns getStats all command is the most commonly used.
nrcmd> dns getStats
nrcmd> dns getStats
100 Ok
{1} 2 3 4 5 6 7 8 9 10 11 12 13 14 15 16
DHCP Statistics
The DHCP server statistics in the web UI appear on the DHCP Server Statistics page, click on the statistic's name to read its description.
The DHCP server statistics details are available for:
•![]() Attribute—Displays the server statistics such as server start time, server reload time, server up time, and statistics reset time.
Attribute—Displays the server statistics such as server start time, server reload time, server up time, and statistics reset time.
•![]() Total Statistics—Displays the total statistics of the scopes, request buffers, response buffers, packets and so on.
Total Statistics—Displays the total statistics of the scopes, request buffers, response buffers, packets and so on.
•![]() Lease Counts (IPv4)—Displays the sample statistics of the IPv4 lease counts such as active leases, configured leases, reserved leases, and reserved active leases.
Lease Counts (IPv4)—Displays the sample statistics of the IPv4 lease counts such as active leases, configured leases, reserved leases, and reserved active leases.
•![]() Packets Received (IPv4)—Displays the sample statistics of the IPv4 packets received.
Packets Received (IPv4)—Displays the sample statistics of the IPv4 packets received.
•![]() Packets Sent (IPv4)—Displays the sample statistics of the IPv4 packets sent.
Packets Sent (IPv4)—Displays the sample statistics of the IPv4 packets sent.
•![]() Packets Failed (IPv4)—Displays the statistics of the failed IPv4 packets.
Packets Failed (IPv4)—Displays the statistics of the failed IPv4 packets.
The Additional Attributes are:
•![]() Failover Statistics—Displays the statistics of the DHCP failover server.
Failover Statistics—Displays the statistics of the DHCP failover server.
•![]() IPv6 Statistics—Displays the statistics of the IPv6 prefixes configured, timed-out IPv6 offer packets and so on.
IPv6 Statistics—Displays the statistics of the IPv6 prefixes configured, timed-out IPv6 offer packets and so on.
•![]() Lease Counts (IPv6)—Displays the statistics of the IPv6 lease counts of active leases, configured leases, reserved leases, and reserved active leases.
Lease Counts (IPv6)—Displays the statistics of the IPv6 lease counts of active leases, configured leases, reserved leases, and reserved active leases.
•![]() Packets Received (IPv6)—Displays the statistics of the IPv6 packets received.
Packets Received (IPv6)—Displays the statistics of the IPv6 packets received.
•![]() Packets Sent (IPv6)—Displays the statistics of the IPv6 packets sent.
Packets Sent (IPv6)—Displays the statistics of the IPv6 packets sent.
•![]() Packets Failed (IPv6)—Displays the statistics of the failed IPv6 packets.
Packets Failed (IPv6)—Displays the statistics of the failed IPv6 packets.
Additional Attributes also includes Top Utilized Aggregations.
The CLI dhcp getStats command has the following options:
dhcp getStats [[all | server [,] failover [,] dhcpv6] [total | sample]
The dhcp getStats all command is the most commonly used.
nrcmd> dhcp getStats
Note ![]() To get the most recent data, click the Refresh Server Statistics icon () at the top left of the page.
To get the most recent data, click the Refresh Server Statistics icon () at the top left of the page.
The CLI dhcp getStats command has the following options:
dhcp getStats [[all | server [,] failover [,] dhcpv6] [total | sample]
The dhcp getStats all command is the most commonly used. The dhcp getStats command without
this option returns the statistics in a single line of positional values in the following format (Table 7-4
shows how to read these values):nrcmd> dhcp getStats
100 Ok
{1} 2 3 4 5 6 7 8
TFTP Statistics
The TFTP server statistics in the web UI appear on the TFTP Server Statistics page, click on the statistic's name to read its description. Table 7-5 shows the TFTP statistics encoded as output to the generic tftp getStats command.
When the TFTP server starts up, it allocates sessions (tftp-max-sessions) and packets (tftp-max-packets) for its use. The TFTP session represents the communication between the TFTP client and TFTP server.
When a read request reaches the TFTP server, the server assigns a packet for the request, increments the total-packets-in-use and total-read-requests values by one, and responds to the user with a data packet. The TFTP server backs up the latest communication packet to resend, if needed. The TFTP server picks another packet from the pool to use it as data packet. When the TFTP server receives an acknowledgement for the block of data sent to the client, it sends the next data block. The TFTP server queues up packets associated with a session, if the session is not able to work on the packets immediately.
The TFTP server statistics details are available for:
•![]() Attribute—Displays the server statistics such as port number, default device, home directory, use home directory as root, and so on.
Attribute—Displays the server statistics such as port number, default device, home directory, use home directory as root, and so on.
•![]() Log Settings—Displays the statistics of the log level, log settings, and packet trace level.
Log Settings—Displays the statistics of the log level, log settings, and packet trace level.
TFTP statistics is encoded as an output to the generic tftp getStats command in the following format:
nrcmd> tftp getStats
Note ![]() To get the most recent data, click the Refresh Server Statistics icon () at the top left of the page.
To get the most recent data, click the Refresh Server Statistics icon () at the top left of the page.
nrcmd> tftp getStats
100 Ok
{1} 2 3 4 5 6 7 8 9 10 11 12 13 14 15 16 17 18 19 20 21 22 23 24 25 26 27 28 29
Displaying IP Address Usage
Displaying IP address usage gives an overview of how clients are currently assigned addresses.
Local Advanced and Regional Web UI
You can look at the local or regional cluster address space, or generate a subnet utilization or lease history report at the regional cluster, to determine IP address usage. These functions are available in both web UIs in the Address Space menu, if you have address space privileges at the local or regional cluster.
You can determine the current address space utilization by clicking the View icon ( ) in the Current Usage column for the unified address space, address block, and subnet (see the "Viewing Address Utilization for Address Blocks, Subnets, and Scopes" section on page 9-11). You can also get the most current IP address utilization by querying the lease history (see the "Querying Leases" section on page 22-31). In the latter case, the regional CCM server references the appropriate DHCP server directly. To ensure this subnet-to-server mapping, you must update the regional address space view so that it is consistent with the relevant local cluster. Do this by pulling the replica address space, or reclaiming the subnet to push to the DHCP server (see the "Reclaiming Subnets" section on page 9-9). Also ensure that the particular DHCP server is running.
CLI Commands
You can generate an IP address usage report using the report command. The command has the following syntax:
report [column-separator=string | dhcpv4 | dhcp-only | dhcpv6 | file=outputfile | vpn=name
The column-separator specifies the character string that separates the report columns (the preset value is the space character). If you want to include more than one space, precede them with the backslash (\) escape character (enclosed in quotation marks). You can specify DHCPv4 or DHCPv6 addresses (dhcp-only is the same as dhcpv4). Not specifying the VPN returns the addresses in the current VPN only.
Displaying Related Servers
Cisco Network Registrar displays the relationship among servers in a DNS zone distribution or a DHCP failover configuration. In the web UI, you can view a related servers page when you click the Related Servers icon ( ) on various pages. You can use the display of related servers to diagnose and monitor misconfigured or unreachable servers.
See Also
Monitoring Remote Servers Using Persistent Events
DNS Zone Distribution Servers
DHCP Failover Servers
Monitoring Remote Servers Using Persistent Events
To service clients that require updates to DNS and LDAP related servers, the DHCP server uses a persistent event algorithm to ensure updates to related servers when a related server is temporarily unavailable. In addition, the algorithm prevents a misconfigured or offline DNS server from using up all the available update resources.
At startup, the DHCP server calculates the number of related servers in the configuration that require persistent events. A preconfigured Maximum Pending Events attribute (an Expert mode attribute that specifies the number of in-memory events that is preset to 40,000) is divided by the number of servers to obtain a limit on the number of events permitted for each remote server. This calculation covers related DNS and LDAP servers (DHCP failover does not use persistent storage for events). The DHCP server uses this calculation to issue log messages and take the action described in Table 7-6. The table shows a hypothetical case of a DHCP server with four related DNS servers each having a limit of 10K events.
SNMP traps and DHCP server log messages also provide notification that a related server is unreachable.
DNS Zone Distribution Servers
A DNS zone distribution simplifies creating multiple zones that share the same secondary server attributes. You can view and set the primary and secondary DNS servers in a zone distribution.
Local Basic or Advanced Web UI
Click DNS, then Zone Distribution. This opens the List Zone Distributions page. The local cluster allows only one zone distribution, the default. Click this zone distribution name to open the Edit Zone Distribution page, which shows the authoritative and secondary servers in the zone distribution.
Regional Web UI
From the DNS menu, choose Zone Distributions. This opens the List/Add Zone Distributions page. The regional cluster allows creating more than one zone distribution. Click the zone distribution name to open the Edit Zone Distribution page, which shows the primary, authoritative, and secondary servers in the zone distribution.
CLI Commands
Create a zone distribution using zone-dist name create primary-cluster, then view it using zone-dist list. For example:
nrcmd> zone-dist distr-1 create Boston-cluster
nrcmd> zone-dist list
DHCP Failover Servers
Related servers in a DHCP failover pair relationship can show the following information:
•![]() Type—Main or backup DHCP server.
Type—Main or backup DHCP server.
•![]() Server name—DNS name of the server.
Server name—DNS name of the server.
•![]() IP address—Server IP address in dotted octet format.
IP address—Server IP address in dotted octet format.
•![]() Requests—Number of outstanding requests, or two dashes if not applicable.
Requests—Number of outstanding requests, or two dashes if not applicable.
•![]() Communication status—OK or INTERRUPTED.
Communication status—OK or INTERRUPTED.
•![]() Cluster state—Failover state of this DHCP server.
Cluster state—Failover state of this DHCP server.
•![]() Partner state—Failover state of its partner server.
Partner state—Failover state of its partner server.
For details on DHCP failover implementation, see Chapter 27, "Configuring DHCP Failover."
Local Basic or Advanced Web UI
From the DHCP menu, choose Failover. The List/Add DHCP Failover Pairs page shows the main and backup servers in the failover relationship.
CLI Commands
Use dhcp getRelatedServers to display the connection status between the main and partner DHCP servers. If there are no related servers, the output is simply 100 Ok.
Displaying Leases
After you create a scope, you can monitor lease activity and view lease attributes.
Local Basic or Advanced Web UI
From the DHCP menu, choose Scopes or Prefixes (in Advanced mode). On the List/Add DHCP Scopes or List/Add DHCPv6 Prefixes page, click the View icon () in the Leases column to open the List DHCP Leases for Scope or List DHCP Leases for Prefix page.
Regional Web UI
From the Address Space menu, choose Lease History. Set the query parameters, then click Query Lease History. (See the "Querying Leases" section on page 22-31.)
Running Data Consistency Rules
Using consistency rules, you can check data inconsistencies such as overlapping address ranges and subnets. You can set data consistency rules at the regional and local clusters.
The table on the List Consistency Rules page explains these rules. Check the check box next to the rule that you want to run.
The List Consistency Rules page includes functions to select all rules and clear selections. You can show the details for each of the rule violations as well as view the output. The rule selections you make are persistent during your user session.
Local Basic or Advanced and Regional Web UI
To run consistency rules, do the following:
Step 1 ![]() From the Home menu, choose Consistency Rules.
From the Home menu, choose Consistency Rules.
The List Consistency Rules page appears.
Step 2 ![]() Check the check boxes for each of the listed consistency rules that you want to apply.
Check the check boxes for each of the listed consistency rules that you want to apply.
•![]() To select all the rules, click the Select All Rules link.
To select all the rules, click the Select All Rules link.
•![]() To clear all selections, click the Clear Selection link.
To clear all selections, click the Clear Selection link.
Step 3 ![]() Click Run Rules.
Click Run Rules.
The Consistency Rules Violations page appears.The rules are categorized by violation type.
•![]() To show details for the violations, click the Show Details link.
To show details for the violations, click the Show Details link.
•![]() To show the output, click the page icon ().
To show the output, click the page icon ().
Step 4 ![]() Click Return to return to the List Consistency Rules page.
Click Return to return to the List Consistency Rules page.
CLI Tool
Use the cnr_rules consistency rules tool from the command line to check for database inconsistencies. You can also use this tool to capture the results of the rule in a text or XML file.
The cnr_rules tool is located at:
•![]() Windows—...\bin\cnr_rules.bat
Windows—...\bin\cnr_rules.bat
•![]() Solaris and Linux—.../usrbin/cnr_rules
Solaris and Linux—.../usrbin/cnr_rules
To run the cnr_rules tool, enter:
> cnr_rules -N username -P password [options]
•![]() -N username—Authenticates using the specified username.
-N username—Authenticates using the specified username.
•![]() -P password—Authenticates using the specified password.
-P password—Authenticates using the specified password.
•![]() options—Describes the qualifying options for the tool, as described in Table 7-7. If you do not enter any options, the command usage appears.
options—Describes the qualifying options for the tool, as described in Table 7-7. If you do not enter any options, the command usage appears.
Troubleshooting
The following sections describe troubleshooting the configuration and the DNS, DHCP, and TFTP servers.
See Also
Immediate Troubleshooting Actions
Modifying the cnr.conf File
Troubleshooting Server Failures
Troubleshooting and Optimizing the TFTP Server
Solaris and Linux Troubleshooting Tools
Using the TAC Tool
Immediate Troubleshooting Actions
When facing a problem, it is crucial not to cause further harm while isolating and fixing the initial problem. Here are things to do (or avoid doing) in particular:
•![]() Have 512 MB or more of memory and 2.5 GB or more of a data partition.
Have 512 MB or more of memory and 2.5 GB or more of a data partition.
•![]() Do not reboot a cable modem termination system (CMTS).
Do not reboot a cable modem termination system (CMTS).
•![]() Enable DHCP failover.
Enable DHCP failover.
•![]() Do not reload, restart, or disrupt Cisco Network Registrar with failover resynchronization in progress.
Do not reload, restart, or disrupt Cisco Network Registrar with failover resynchronization in progress.
Modifying the cnr.conf File
Cisco Network Registrar uses the cnr.conf file for basic configuration parameters. This file is normally located in the install-path/conf directory. Cisco Network Registrar creates the file during installation and processes it line by line.
You can edit this file if configuration parameters change. Note that during normal operation, you would not want to change the values. However, certain conditions might require you to modify certain values, such as when you move the data files for disk space reasons.
The format of the cnr.conf file consists of parameter name-value pairs, one per line; for example, for a Windows local cluster installation:
cnr.rootdir=C:\\Program Files\\Network Registrar\\Local
cnr.ccm-port=1234
cnr.cisco-gss-appliance-integration=n
cnr.datadir=C:\\NetworkRegistrar\\Local\\data
cnr.java-home=C:\\Program Files\\Java\\jre1.5.0_12
cnr.logdir=C:\\NetworkRegistrar\\Local\\logs
cnr.https-port=8443
cnr.tempdir=C:\\NetworkRegistrar\\Local\\temp
cnr.http-port=8080
cnr.ccm-mode=local
cnr.ccm-type=cnr
cnr.http-enabled=y
cnr.https-enabled=n
cnr.keystore-file=C:
cnr.keystore-password=unset
cnr.backup-time=23:45
Directory paths must be in the native syntax for the operating system. The format allows the use of colons (:) in directory paths, but not as name-value pair separators; it does not allow line continuation or embedded unicode characters. Other modifications to the file might include the location of the log directory (see the "Log Files" section) or the time cnr_shadow_backup backups should occur (see the "Setting Automatic Backup Time" section on page 8-3).
In rare cases, you might want to modify the file; for example, to exclude certain data from daily backups due to capacity issues. To do this, you need to add the appropriate settings manually.

The following settings are supported:
•![]() cnr.backup-dest—Specify the destination to place backed up databases. Defaults to cnr.datadir if not specified.
cnr.backup-dest—Specify the destination to place backed up databases. Defaults to cnr.datadir if not specified.
•![]() cnr.backup-dbs—Provide a comma-separated list of the databases you want to backup. For a local cluster the default is ccm,dhcp,dns,mcd,cnrsnmp. For a regional cluster it is ccm,lease6hist,leasehist,subnetutil,replica.
cnr.backup-dbs—Provide a comma-separated list of the databases you want to backup. For a local cluster the default is ccm,dhcp,dns,mcd,cnrsnmp. For a regional cluster it is ccm,lease6hist,leasehist,subnetutil,replica.
•![]() cnr.backup-files—Provide a comma-separated list of files and the complete path to the files that you want copied as part of the backup. Files are copied to cnr.backup-dest.
cnr.backup-files—Provide a comma-separated list of files and the complete path to the files that you want copied as part of the backup. Files are copied to cnr.backup-dest.
•![]() cnr.dbrecover-backup—Specify whether to run db recover and db verify on a backed up Oracle Berkeley database. The default is true. This setting is used for daily backups only. Manual backups ignore this setting. Disabling the automatic operation means that you must run the operation manually, preferably on a separate machine, or at a time when the Cisco Network Registrar servers are relatively idle.
cnr.dbrecover-backup—Specify whether to run db recover and db verify on a backed up Oracle Berkeley database. The default is true. This setting is used for daily backups only. Manual backups ignore this setting. Disabling the automatic operation means that you must run the operation manually, preferably on a separate machine, or at a time when the Cisco Network Registrar servers are relatively idle.
•![]() cnr.daily-backup—Specify whether to run the daily back up. The default is true.
cnr.daily-backup—Specify whether to run the daily back up. The default is true.
Troubleshooting Server Failures
The server agent processes (nwreglocal and nwregregion) normally detect server failures and restart the server. You can usually recover from the failure and the server is not likely to fail again immediately after restarting. On rare occasions, the source of the server failure prevents the server from successfully restarting, and the server fails again as soon as it restarts. In such instances, perform the following steps:
Step 1 ![]() If the server takes a significantly long time to restart, stop and restart the server agent. On:
If the server takes a significantly long time to restart, stop and restart the server agent. On:
•![]() Windows:
Windows:
net stop nwreglocal or nwregregion
net start nwreglocal or nwregregion
•![]() Solaris:
Solaris:
/etc/init.d/nwreglocal stop or nwregregion stop
/etc/init.d/nwreglocal stop or nwregregion start
•![]() Linux:
Linux:
/etc/rc.d/init.d/nwreglocal stop or nwregregion stop
/etc/rc.d/init.d/nwreglocal stop or nwregregion start
Step 2 ![]() Keep a copy of all the log files. Log files are located in the install-path/logs directory on Solaris and Linux, and the install-path\logs folder on Windows. The log files often contain useful information that can help isolate the cause of a server failure.
Keep a copy of all the log files. Log files are located in the install-path/logs directory on Solaris and Linux, and the install-path\logs folder on Windows. The log files often contain useful information that can help isolate the cause of a server failure.
Step 3 ![]() Use the TAC tool, as described in the "Using the TAC Tool" section, or save the core or user.dmp file, if one exists, depending on the operating system:
Use the TAC tool, as described in the "Using the TAC Tool" section, or save the core or user.dmp file, if one exists, depending on the operating system:
•![]() Windows—The user.dmp file is located in the system directory, which varies depending on the Windows system. Search for this file and save a renamed copy.
Windows—The user.dmp file is located in the system directory, which varies depending on the Windows system. Search for this file and save a renamed copy.
•![]() Solaris and Linux—The core file is located in the install-path. Save a renamed copy of this file that Cisco Network Registrar does not overwrite.
Solaris and Linux—The core file is located in the install-path. Save a renamed copy of this file that Cisco Network Registrar does not overwrite.
Step 4 ![]() On Windows, use the native event logging application to save the System and Application event logs to files. You can do this from the Event Viewer. These event logs often contain data that helps debug Cisco Network Registrar server problems. For a description of the log messages for each server module, see the install-path/docs/msgid/MessageIdIndex.html file.
On Windows, use the native event logging application to save the System and Application event logs to files. You can do this from the Event Viewer. These event logs often contain data that helps debug Cisco Network Registrar server problems. For a description of the log messages for each server module, see the install-path/docs/msgid/MessageIdIndex.html file.
Troubleshooting and Optimizing the TFTP Server
You can set certain attributes to troubleshoot and optimize TFTP server performance.
See Also
Tracing TFTP Server Activity
Optimizing TFTP Message Logging
Enabling TFTP File Caching
Tracing TFTP Server Activity
To trace TFTP server activity, set the packet-trace-level attribute to a value of 1 through 4, depending on the level of verbosity you want the TFTP server to use to write messages to the trace file. The trace files are located in the /logs subdirectory of the installation directory. Windows tracing goes to the file_tftp_1_log file; Solaris and Linux tracing goes to the /var/nwreg2/{local | regional}/logs/file_tftp_1_log and file_tftp_1_trace files.
Here are the trace levels, with each higher level being cumulative:
•![]() 0—Disables all server tracing (the default).
0—Disables all server tracing (the default).
•![]() 1—Displays all the log messages in the trace file.
1—Displays all the log messages in the trace file.
•![]() 2—Displays the client IP address and port number for all packets.
2—Displays the client IP address and port number for all packets.
•![]() 3—Displays the packet header information.
3—Displays the packet header information.
•![]() 4—Displays the first 32 bytes of the packet.
4—Displays the first 32 bytes of the packet.
Note ![]() Setting and getting the trace level only works if the TFTP server is started. Turn on packet tracing only for debugging purposes, and then not for any extended time, for performance reasons.
Setting and getting the trace level only works if the TFTP server is started. Turn on packet tracing only for debugging purposes, and then not for any extended time, for performance reasons.
Optimizing TFTP Message Logging
You can improve TFTP server performance by restricting logging and tracing. By default, the server logs error, warning, and informational messages to file_tftp_1_log files. You can set the log levels using a few TFTP server parameters:
•![]() Log level (use the log-level attribute)—Master controller of server logging, which is preset to, and is best left at, level 3 (logs all error, warning, and informational messages). As with packet tracing, the higher logging levels are cumulative. If set to 0, no server logging occurs.
Log level (use the log-level attribute)—Master controller of server logging, which is preset to, and is best left at, level 3 (logs all error, warning, and informational messages). As with packet tracing, the higher logging levels are cumulative. If set to 0, no server logging occurs.
•![]() Log settings (use the log-settings attribute)—This is the second level of logging control and takes only two values, default or no-success-messages. The default log setting does not alter the default value of log level 3 (error, warning, and informational messages). However, you may want to disable writing success informational messages, and thereby improve server performance, by changing the log settings to no-success-messages.
Log settings (use the log-settings attribute)—This is the second level of logging control and takes only two values, default or no-success-messages. The default log setting does not alter the default value of log level 3 (error, warning, and informational messages). However, you may want to disable writing success informational messages, and thereby improve server performance, by changing the log settings to no-success-messages.
•![]() Log file count and size (use the log-file-count attribute)—Sets how many log files to maintain and how large to allow them to get in the /logs directory. The default value is to maintain a maximum of four files of one megabyte each.
Log file count and size (use the log-file-count attribute)—Sets how many log files to maintain and how large to allow them to get in the /logs directory. The default value is to maintain a maximum of four files of one megabyte each.
Note ![]() Reload the TFTP server after changing these values.
Reload the TFTP server after changing these values.
Enabling TFTP File Caching
You can improve TFTP server performance significantly by enabling file caching on the server. You must do this explicitly, because it is preset to disabled. You must also create and point to a file cache directory, and you can set the maximum size of this directory. Here are the steps:
Step 1 ![]() Determine where you want the TFTP cache files to go. This becomes a subdirectory of the TFTP home directory, which is preset to install-path/data/tftp (on Solaris and Linux, it is /var/nwreg2/{local | regional}/data/tftp). If you want a different location, set the home-directory attribute.
Determine where you want the TFTP cache files to go. This becomes a subdirectory of the TFTP home directory, which is preset to install-path/data/tftp (on Solaris and Linux, it is /var/nwreg2/{local | regional}/data/tftp). If you want a different location, set the home-directory attribute.
Step 2 ![]() Change to the TFTP home directory and create the cache directory, such as CacheDir, in the home directory, using the mkdir Cachedir command. Note that Cisco Network Registrar ignores any files in any subdirectories of this cache directory.
Change to the TFTP home directory and create the cache directory, such as CacheDir, in the home directory, using the mkdir Cachedir command. Note that Cisco Network Registrar ignores any files in any subdirectories of this cache directory.
Step 3 ![]() Use the file-cache-directory attribute to set up the TFTP server to point to the cache directory. You cannot use absolute path or relative path in the directory name. The file-cache-directory name is either appended to the path given in the home-directory or the default home directory path (if you do not specify one).
Use the file-cache-directory attribute to set up the TFTP server to point to the cache directory. You cannot use absolute path or relative path in the directory name. The file-cache-directory name is either appended to the path given in the home-directory or the default home directory path (if you do not specify one).
Step 4 ![]() Use the file-cache-max-memory-size attribute to set the maximum memory size, in bytes, of the cache. The preset value is 32 KB. Cisco Network Registrar loads all files into cache that cumulatively fit this memory size. If you set the value to 0, Cisco Network Registrar does not cache any data, even if you enable file caching.
Use the file-cache-max-memory-size attribute to set the maximum memory size, in bytes, of the cache. The preset value is 32 KB. Cisco Network Registrar loads all files into cache that cumulatively fit this memory size. If you set the value to 0, Cisco Network Registrar does not cache any data, even if you enable file caching.
Step 5 ![]() Copy all of the files you want cached into the cache directory, and not into any subdirectory. Because all files in this directory are loaded into cache, do not include large files.
Copy all of the files you want cached into the cache directory, and not into any subdirectory. Because all files in this directory are loaded into cache, do not include large files.
Step 6 ![]() Enable the file-cache attribute to enable file caching, then reload the server. Cisco Network Registrar logs the name of each cached file, and skips any it cannot load. It reads in all files as binary data and translates them as the TFTP client requests. For example, if a client requests a file as NetASCII, the client receives the cached data in that form.
Enable the file-cache attribute to enable file caching, then reload the server. Cisco Network Registrar logs the name of each cached file, and skips any it cannot load. It reads in all files as binary data and translates them as the TFTP client requests. For example, if a client requests a file as NetASCII, the client receives the cached data in that form.
Step 7 ![]() Writing to cache is not allowed. If you need to update a cache file, overwrite it in the cache directory, then reload the server.
Writing to cache is not allowed. If you need to update a cache file, overwrite it in the cache directory, then reload the server.
Solaris and Linux Troubleshooting Tools
You can also use the following commands on Solaris and Linux systems to troubleshoot Cisco Network Registrar. To:
•![]() See all Cisco Network Registrar processes:
See all Cisco Network Registrar processes:
ps -leaf | grep nwr
•![]() Monitor system usage and performance:
Monitor system usage and performance:
top
vmstat
•![]() View login or bootup errors:
View login or bootup errors:
–![]() On Solaris—grep /var/adm/messages*
On Solaris—grep /var/adm/messages*
–![]() On Linux—grep /var/log/messages*
On Linux—grep /var/log/messages*
•![]() View the configured interfaces and other network data:
View the configured interfaces and other network data:
ifconfig -a
Using the TAC Tool
There may be times when any amount of troubleshooting steps will not resolve your problem and you have to resort to contacting the Cisco Technical Assistance Center (TAC) for help. Cisco Network Registrar provides a tool so that you can easily assemble the server or system error information, and package this data for TAC support engineers. This eliminates having to manually assemble this information with TAC assistance. The resulting package from this tool provides the engineers enough data so that they can more quickly and easily diagnose the problem and provide a solution.
The cnr_tactool utility is available in the bin directory of the Windows, and usrbin directory of the UNIX or Linux, installation directories. Execute the cnr_tactool utility:
> cnr_tactool -N username -P password [-d output-directory]
The output directory is optional and normally is the temp directory of the installation directories (in the /var path on Solaris and Linux). If you do not supply the username and password on the command line, you are prompted for them:
> cnr_tactool
username:
password:
[processing messages....]
The tool generates a packaged tar file whose name includes the date and version. The tar file contains all the diagnostic files.
 Feedback