- Recent Configuration Enhancements and Limitations
- Unified Policy CLI
- Metric Producer Parameters
- Reacts
- NetFlow/IPFIX Flow Monitor
- NetFlow/IPFIX Flow Record
- L3/L4 Fields
- L7 Fields
- Interfaces and Directions
- Counters and Timers
- TCP Performance Metrics
- Media Performance Metrics
- L2 Information
- WAAS Interoperability
- Classification
- NetFlow/IPFIX Option Templates
- NetFlow/IPFIX Show commands
- Customizing NBAR Attributes
- Customizing N BAR Protocols
- Packet Capture Configuration
- QoS Metrics: Cisco IOS Platforms
AVC Configuration
This chapter addresses Cisco AVC configuration and includes the following topics:
- Recent Configuration Enhancements and Limitations
- Unified Policy CLI
- Metric Producer Parameters
- Reacts
- NetFlow/IPFIX Flow Monitor
- NetFlow/IPFIX Flow Record
- QoS Metrics: Cisco IOS Platforms
- QoS Metrics: Cisco IOS XE Platforms
- Connection/Transaction Metrics
- Easy Performance Monitor
- CLI Field Aliases
- Identifying the Monitored Interface
- Configuration Examples
Recent Configuration Enhancements and Limitations
Table 4-1 describes configuration features added in recent releases, and limitations.
Table 4-1 Configuration Features and Enhancements
|
|
|
|
|
|---|---|---|---|
For information, see |
|||
Easy Performance Monitor “express” method of provisioning monitors |
For information, see |
||
For limitations, see: |
|||
For limitations, see: |
Unified Policy CLI
|
|
|
|---|---|
Monitoring a configuration is done using performance-monitor unified monitor and policy.
–![]() Multiple flow monitors under a class-map
Multiple flow monitors under a class-map
–![]() Up to 5 monitors per attached class-map
Up to 5 monitors per attached class-map
–![]() Up to 256 classes per performance-monitor policy
Up to 256 classes per performance-monitor policy
- Metric producer parameters are optional.
- Account-on-resolution (AOR) configuration causes all classes in the policy-map to work in AOR mode, which delays the action until the class-map results are finalized (the application is determined by NBAR2).
Attach a policy to the interface using following command:
Displaying Policy Map Performance Monitor Data
Display policy map performance monitor data using the command below. Example output is shown here.
- On Cisco IOS platforms, the data is reported once per flow, either for the first packet of the flow or for the packet of resolution if AOR is enabled.
- On Cisco IOS XE platforms, the data is reported for all packets that match the policy map.
Metric Producer Parameters
Metric producer-specific parameters are optional and can be defined for each metric producer for each class-map.
Reacts
The react CLI defines the alerts applied to a flow monitor. The react CLI has a performance impact on the router. When possible, send the monitor records directly to the Management and Reporting system and apply the network alerts in the Management and Reporting system.

Note![]() Cisco IOS XE Platforms: Applying reacts on the device requires punting the monitor records to the route processor (RP) for alert processing. To avoid the performance reduction of punting the monitor records to the RP, send the monitor records directly to the Management and Reporting system, as described above.
Cisco IOS XE Platforms: Applying reacts on the device requires punting the monitor records to the route processor (RP) for alert processing. To avoid the performance reduction of punting the monitor records to the RP, send the monitor records directly to the Management and Reporting system, as described above.
NetFlow/IPFIX Flow Monitor
|
|
|
|---|---|
Flow monitor defines monitor parameters, such as record, exporter, and other cache parameters.
Configuration Format: Cisco IOS Platforms
Configuration Format: Cisco IOS XE Platforms
- The react-map CLI is allowed under the class in the policy-map. In this case, the monitor must include the exporting of the class-id in the flow record. The route processor (RP) correlates the class-id in the monitor with the class-id where the react is configured.
- Applying history or a react requires punting the record to the RP.
- Export on the “event transaction end” is used to export the records when the connection or transaction is terminated. In this case, the records are not exported based on timeout. Exporting on the event transaction end should be used when detailed connection/transaction granularity is required, and has the following advantages:
–![]() Sends the record close to the time that it has ended.
Sends the record close to the time that it has ended.
–![]() Exports only one record on true termination.
Exports only one record on true termination.
–![]() Conserves memory in the cache and reduces the load on the Management and Reporting system.
Conserves memory in the cache and reduces the load on the Management and Reporting system.
–![]() Enables exporting multiple transactions of the same flow. (This requires a protocol pack that supports multi-transaction.)
Enables exporting multiple transactions of the same flow. (This requires a protocol pack that supports multi-transaction.)
- Export spreading—In a case of synchronized cache, all network devices export records from the monitor cache at the same time. If multiple network devices are configured with the same monitor interval and synchronized cache, the collector may receive all records from all devices at the same time, which can impact the collector performance. The export-spreading feature spreads out the export over a time interval, which is automatically set by MMA or specified by the user.
NetFlow/IPFIX Flow Record
The flow record defines the record fields. With each Cisco IOS release, the Cisco AVC solution supports a more extensive set of metrics.
The sections that follow list commonly used AVC-specific fields organized by functional groups. These sections do not provide detailed command reference information, but highlight important usage guidelines.
In addition to the fields described below, a record can include any NetFlow field supported by the platform.
A detailed description of NetFlow fields appears in the Cisco IOS Flexible NetFlow Command Reference .
Note![]() On Cisco IOS XE platforms, the record size is limited to 40 fields (key and non-key fields or match and collect fields).
On Cisco IOS XE platforms, the record size is limited to 40 fields (key and non-key fields or match and collect fields).
L3/L4 Fields
The following are L3/L4 fields commonly used by the Cisco AVC solution.
The client is determined according to the initiator of the connection.
The client and server fields are bi-directional. The source and destination fields are uni-directional.
L7 Fields
The following are L7 fields commonly used by the Cisco AVC solution.
- The application ID is exported according to RFC-6759.
- Account-On-Resolution configures FNF to collect data in a temporary memory location until the record key fields are resolved. After resolution of the record key fields, FNF combines the temporary data collected with the standard FNF records. Use the account-on-resolution option when the field used as a key is not available at the time that FNF receives the first packet.
The following limitations apply when using Account-On-Resolution:
–![]() Flows ended before resolution are not reported.
Flows ended before resolution are not reported.
–![]() On Cisco IOS XE platforms, FNF packet/octet counters, timestamp, and TCP performance metrics are collected until resolution. All other field values are taken from the packet that provides resolution or the following packets.
On Cisco IOS XE platforms, FNF packet/octet counters, timestamp, and TCP performance metrics are collected until resolution. All other field values are taken from the packet that provides resolution or the following packets.
- For information about extracted fields, including the formats in which they are exported, see:
Cisco Application Visibility and Control Field Definition Guide for Third-Party Customers
Interfaces and Directions
The following are interface and direction fields commonly used by the Cisco AVC solution:
Counters and Timers
The following are counter and timer fields commonly used by the Cisco AVC solution.
Note Two aliases provide backward compatibility for configurations created on earlier releases:
- connection client bytes transport long is an alias for connection client bytes long .
- connection server bytes transport long is an alias for connection server bytes long .
TCP Performance Metrics
The following are fields commonly used for TCP performance metrics by the Cisco AVC solution:
The following limitations apply to TCP performance metrics:
- All TCP performance metrics must observe bi-directional traffic.
- The policy-map must be applied in both directions.
Figure 4-1 provides an overview of network response time metrics.
Figure 4-1 Network Response Times
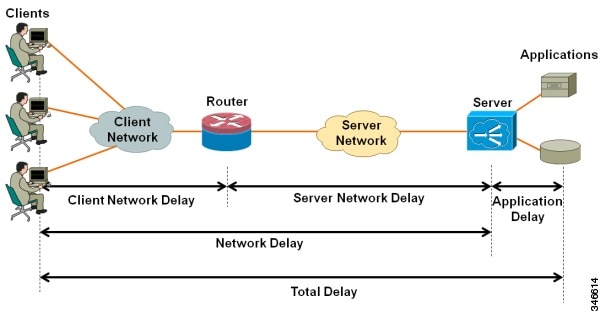
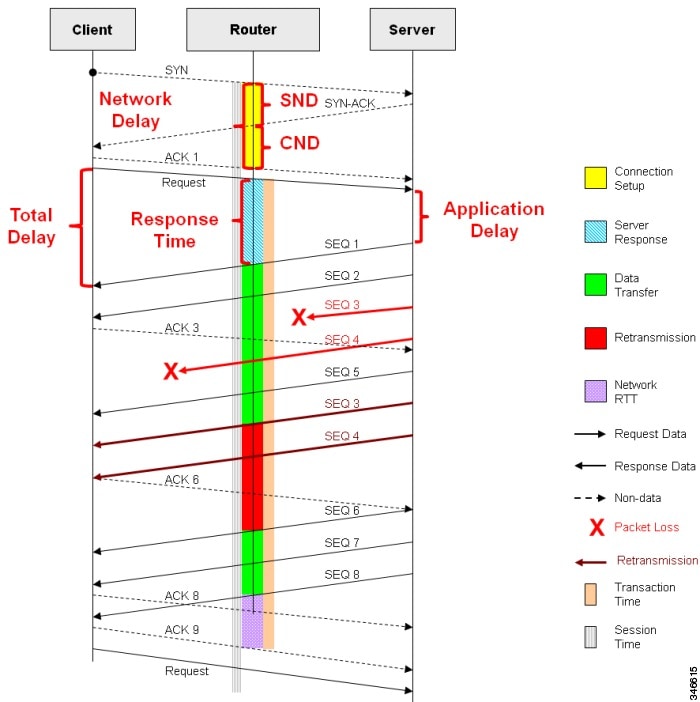
Figure 4-2 provides details of network response time metrics.
Figure 4-2 Network Response Time Metrics in Detail
Media Performance Metrics
The following are fields commonly used for media performance metrics by the Cisco AVC solution:
Some of the media performance fields require punt to the route processor (RP). For more information, see Cisco Application Visibility and Control Field Definition Guide for Third-Party Customers .
L2 Information
The following are L2 fields commonly used by the Cisco AVC solution:
WAAS Interoperability
|
|
|
|---|---|
The following are WAAS fields commonly used by the Cisco AVC solution:
Account-On-Resolution configures FNF to collect data in a temporary memory location until the record key fields are resolved. After resolution of the record key fields, FNF combines the temporary data collected with the standard FNF records. Use this option ( account-on-resolution ) when the field used as a key is not available at the time that FNF receives the first packet.
The following limitations apply when using Account-On-Resolution:
Classification
The following are classification fields commonly used by the Cisco AVC solution:
Use this field to report the matched class for the performance-monitor policy-map.
NetFlow/IPFIX Option Templates
NetFlow option templates map IDs to string names and descriptions:
NetFlow/IPFIX Show commands
Use the following commands to show NetFlow/IPFIX information:
Customizing NBAR Attributes
Use the following commands to customize the NBAR attributes:
Note![]() These commands support all attributes defined by the NBAR2 Protocol Pack, including custom-category, custom-sub-category, and custom-group available in Protocol Pack 3.1 and later.
These commands support all attributes defined by the NBAR2 Protocol Pack, including custom-category, custom-sub-category, and custom-group available in Protocol Pack 3.1 and later.
Customizing Attribute Values
|
|
|
|---|---|
Background
Attribute maps enable users to map various attribute values to protocols, changing the built-in grouping of protocols. The “custom attributes value” feature enables users to add new values to existing attributes.
For example, when using custom protocols to define enterprise specific protocols, it can be useful to classify the custom protocols as a new group (example: my-db-protocols-group). Beginning in the current release, new values can be defined for:
Customized attributes can be used for QoS matching, and the customized values appear in AVC reports.
Future Protocol Pack versions may enable defining additional attributes. For information about viewing which attributes can be customized and how many new groups can be defined, see Additional Usage Guidelines.
Basic Usage
Previous releases of AVC included the following pre-defined attribute values, which could not be user-customized:
- For the category attribute: custom-category
- For the sub-category attribute: custom-sub-category
- For the application-group attribute: custom-application-group
To provide backward compatibility with existing configurations, the current release supports configurations that were created for earlier releases and that include one or more of these attributes.
The following examples define custom values for the category and sub-category attributes, and provide the optional explanatory help string:
Example—Removing Custom Values
The following example removes the custom value (“XYZ-app-group”) that had been assigned for the application-group attribute:
Additional Usage Guidelines
The following command provides help, indicating which attributes can have custom values.
Displaying Customizable Attributes and Custom Values
The following command indicates which attributes can be defined with custom values (depends on the Protocol Pack version installed on the device), and displays the currently defined custom values.
Customizing NBAR Protocols
Use the following commands to customize NBAR protocols and assign a protocol ID. A protocol can be matched based on HTTP URL/Host or other parameters:
Packet Capture Configuration
|
|
|
|---|---|
Use the following commands to enable packet capture:
QoS Metrics: Cisco IOS Platforms
This section applies to Cisco IOS platforms. (For information about QoS Metrics configuration for Cisco IOS XE platforms, see QoS Metrics: Cisco IOS XE Platforms. )
This section describes how to configure a performance monitor to include Quality of Service (QoS) metrics.
Background—QoS
QoS configuration is based on class maps and policy maps . Class maps categorize traffic; policy maps determine how to handle the traffic. Based on the policy identified for each packet, the packet is placed into a specific QoS queue , which determines the priority and pattern of transmission. Each queue is identified by a Queue ID field.
For additional information about QoS, see: http://www.cisco.com/go/qos
Exported Metrics
AVC enables configuration of QoS Packet Drop and QoS Class Hierarchy monitors on an interface, using one or more of the following QoS metrics, which can be included in exported performance monitor records:
- Queue ID—Identifies a QoS queue.
- Queue Packet Drops—Packets dropped (on the monitored interface) per QoS queue, due to a QoS policy that limits resources available to a specific type of traffic.
- Class Hierarchy—Class hierarchy of the reported flow. The class hierarchy is determined by the QoS policy map and determines the traffic priority.
QoS Packet Drop Monitor Output in Exported Record
When a QoS Packet Drop monitor is configured, the performance monitor record includes packet drop data per QoS queue in the following format:
|
|
|
|---|---|
QoS Class Hierarchy Information Included in Exported Record
QoS class hierarchy information is exported using the following performance monitor fields:
This section provides an example of a QoS policy map configuration, followed by the information provided in a performance monitor record for three flows governed by this configuration.
The example includes two levels of policy map hierarchy. In the example, the service-policy P11 statement in bold type creates a hierarchy with the P11 policy map as a child of the P1 policy map.
Note![]() QoS class hierarchy reporting supports a hierarchy of five levels.
QoS class hierarchy reporting supports a hierarchy of five levels.
Based on the configuration, the following applies to a packet with, for example, a DSCP value of “ef” in the IP header:
1.![]() The C1 class definition includes the packet by the
The C1 class definition includes the packet by the match any statement.
2.![]() The C11 class definition includes the packet by the
The C11 class definition includes the packet by the match ip dscp ef statement.
3.![]() Because the packet is included in class C1, policy map P1 defines the policy for the packet with the
Because the packet is included in class C1, policy map P1 defines the policy for the packet with the shaping average statement.
4.![]() Policy map P1 invokes policy map P11 for class C1 with the
Policy map P1 invokes policy map P11 for class C1 with the service-policy P11 statement.
5.![]() Because the packet is included in class C11, policy map P11 assigns the packet to a queue which has been allocated 10% of remaining bandwidth.
Because the packet is included in class C11, policy map P11 assigns the packet to a queue which has been allocated 10% of remaining bandwidth.
Table 4-2 shows an example of the information provided in an FNF record for three flows governed by this configuration.
Table 4-2 QoS Class Hierarchy Information in the Flow Record
|
|
|
|
|---|---|---|
In Table 4-2 , policy and class information is shown using the true policy and class names, such as P1 and C1. However, the record exports policy and class names using numerical identifiers in place of policy and class names. The monitor periodically outputs a “policy option template” and a “class option template” indicating the policy names and class names that correspond to the numbers used in the exported records. These option templates are defined in the exporter configuration, using statements such as the following, which create the option templates and indicate the time interval at which the monitor outputs the option template information:
Configuration
Configuring a QoS Packet Drop Monitor
A QoS Packet Drop monitor can only export the Queue ID and Queue Packet Drop fields. It cannot be combined with other monitors to export additional fields. At the given reporting interval, the monitor reports only on queues that have dropped packets (does not report value of 0).
Step 1: Create the QoS Packet Drop Monitor
Use the following performance monitor configuration to create a QoS Packet Drop monitor. The process specifies a flow record of type performance monitor named “qos-record” and attaches the record to a monitor of type performance monitor named “qos-monitor.” In the steps that follow, the qos-monitor is attached to the desired policy map.
Step 2: Configure the QoS Policy
The following example shows configuration of a QoS policy map. It includes a hierarchy of three policies: avc, avc-parent, and avc-gparent. Note that avc-gparent includes avc-parent, and avc-parent includes avc.
Step 3: Create the QoS Class Hierarchy Record
To correlate the queue drops collected from the QoS Drops monitor, create a flow record that includes the class hierarchy and Queue id and flow key fields. The data exported by this monitor indicates which flows are assigned to which QoS Queue Id.
The following example configuration creates a QoS class record. The process specifies a record of type performance monitor named “qos-class-record.”
Step 4: Create the QoS Class Hierarchy Monitor
Use the following performance monitor configuration to create a QoS Class Hierarchy monitor. The process specifies a monitor of type “class-hier-monitor.” In the steps that follow, the monitor is attached to the desired interface.
Step 5: Create the Performance Monitor Policy
Use the following configuration to create a policy-map that will collect both monitors.
Step 6: Attach the Performance Monitor and QoS Policy to an Interface
Use the following to attach the monitor to the desired interface. For <interface> , specify the interface type—for example: GigabitEthernet0/2/1
Specify the IP address of the interface in IPv4 or IPv6 format.
Verifying the QoS Packet Drop Monitor Configuration
This section provides commands that are useful for verifying or troubleshooting a QoS Packet Drop Monitor configuration.
Verifying that the Monitor is Allocated
Use the following command to verify that the QoS monitor exists:
Use the following commands to verify additional monitor details:
Verifying QoS Queue IDs, Queue Drops, and Class Hierarchies
The following show command displays the record collected:
QoS Metrics: Cisco IOS XE Platforms
This section applies to Cisco IOS XE platforms. (For information about QoS Metrics configuration for Cisco IOS platforms, see QoS Metrics: Cisco IOS Platforms.)
This section describes how to configure Flexible NetFlow (FNF) monitors to include Quality of Service (QoS) metrics.
Background—FNF and QoS
Flexible NetFlow (FNF) enables monitoring traffic on router interfaces. FNF monitors are configured for a specific interface to monitor the traffic on that interface. At defined intervals, the monitor sends collected traffic data to a “collector,” which can be a component within the router or an external component.
Beginning with Cisco AVC for IOS XE release 3.9, FNF records include new fields for QoS metrics.
QoS configuration is based on class maps and policy maps . Class maps categorize traffic; policy maps determine how to handle the traffic. Based on the policy identified for each packet, the packet is placed into a specific QoS queue , which determines the priority and pattern of transmission. Each queue is identified by a Queue ID field.
For additional information about QoS, see: http://www.cisco.com/go/qos
Exported Metrics
AVC enables configuration of QoS Packet Drop and QoS Class Hierarchy monitors on an interface, using one or more of the following QoS metrics, which can be included in exported FNF records:
- Queue ID—Identifies a QoS queue.
- Queue Packet Drops—Packets dropped (on the monitored interface) per QoS queue, due to a QoS policy that limits resources available to a specific type of traffic.
- Class Hierarchy—Class hierarchy of the reported flow. The class hierarchy is determined by the QoS policy map and determines the traffic priority.
QoS Packet Drop Monitor Output in Exported Record
When a QoS Packet Drop monitor is configured, the FNF record includes packet drop data per QoS queue in the following format:
|
|
|
|---|---|
QoS Class Hierarchy Information Included in Exported Record
QoS class hierarchy information is exported using the following FNF fields:
This section provides an example of a QoS policy map configuration, followed by the information provided in an FNF record for three flows governed by this configuration.
The example includes two levels of policy map hierarchy. In the example, the service-policy P11 statement in bold type creates a hierarchy with the P11 policy map as a child of the P1 policy map.
Note![]() QoS class hierarchy reporting supports a hierarchy of five levels.
QoS class hierarchy reporting supports a hierarchy of five levels.
Based on the configuration, the following applies to a packet with, for example, a DSCP value of “ef” in the IP header:
1.![]() The C1 class definition includes the packet by the
The C1 class definition includes the packet by the match any statement.
2.![]() The C11 class definition includes the packet by the
The C11 class definition includes the packet by the match ip dscp ef statement.
3.![]() Because the packet is included in class C1, policy map P1 defines the policy for the packet with the
Because the packet is included in class C1, policy map P1 defines the policy for the packet with the shaping average statement.
4.![]() Policy map P1 invokes policy map P11 for class C1 with the
Policy map P1 invokes policy map P11 for class C1 with the service-policy P11 statement.
5.![]() Because the packet is included in class C11, policy map P11 assigns the packet to a queue which has been allocated 10% of remaining bandwidth.
Because the packet is included in class C11, policy map P11 assigns the packet to a queue which has been allocated 10% of remaining bandwidth.
Table 4-3 shows an example of the information provided in an FNF record for three flows governed by this configuration.
Table 4-3 QoS Class Hierarchy Information in the FNF record
|
|
|
|
|---|---|---|
In Table 4-3 , policy and class information is shown using the true policy and class names, such as P1 and C1. However, the FNF record exports policy and class names using numerical identifiers in place of policy and class names. The monitor periodically outputs a “policy option template” and a “class option template” indicating the policy names and class names that correspond to the numbers used in the exported FNF records. These option templates are defined in the exporter configuration, using statements such as the following, which create the option templates and indicate the time interval at which the monitor outputs the option template information:
Configuration
Enabling QoS Metric Collection
To enable the QoS metrics collection feature for the platform, enter global configuration mode using configure terminal , then use the following QoS configuration command. The command causes QoS to begin collecting QoS metrics for FNF.
Note![]() Enabling QoS metrics collection requires resetting all performance monitors on the device.
Enabling QoS metrics collection requires resetting all performance monitors on the device.
To verify that QoS metrics collection is enabled, use the following command:
The following is an example of the output of the command:
Configuring a QoS Packet Drop Monitor
A QoS Packet Drop monitor can only export the Queue ID and Queue Packet Drop fields. It cannot be combined with other monitors to export additional fields. At the given reporting interval, the monitor reports only on queues that have dropped packets (does not report value of 0).
Step 1: Create the QoS Packet Drop FNF Monitor
Use the following FNF configuration to create a QoS Packet Drop monitor. The process specifies a flow record of type “qos-record” and attaches the record to a monitor of type “qos-monitor.” In the steps that follow, the qos-monitor is attached to the desired interface.
Note![]() Ensure that QoS metrics collection is enabled. SeeEnabling QoS Metric Collection.
Ensure that QoS metrics collection is enabled. SeeEnabling QoS Metric Collection.
Step 2: Configure the QoS Policy
The following example shows configuration of a QoS policy map. It includes a hierarchy of three policies: avc, avc-parent, and avc-gparent. Note that avc-gparent includes avc-parent, and avc-parent includes avc.
Step 3: Attach the FNF Monitor and QoS Policy to an Interface
Use the following to attach the monitor to the desired interface. For <interface> , specify the interface type—for example: GigabitEthernet0/2/1
Specify the IP address of the interface in IPv4 or IPv6 format.
Verifying the QoS Packet Drop Monitor Configuration
This section provides commands that are useful for verifying or troubleshooting a QoS Packet Drop Monitor configuration.
Verifying that the Monitor is Allocated
Use the following command to verify that the QoS monitor exists:
Use the following commands to verify additional monitor details:
Verifying QoS queues and Class-Hierarchies
The following show commands display the statistics that QoS has collected. “gigX/X/X” refers to the interface for which the monitor has been configured.
Verifying FNF-QOS FIA Activation
Use the following show command to verify that the FNF-QoS FIA (feature activation array) is enabled on the interface (GigabitEthernet0/2/1 in this example):
Verifying the FNF Monitor and Record
Use the following debug commands to verify that the FNF monitor and record have been created:
Configuring a QoS Class Hierarchy Monitor
In contrast to the QoS Packet Drop monitor, a QoS Class Hierarchy monitor can be combined with another monitor to export additional metrics.
Step 1: Create the QoS Class Record
The following example configuration creates a QoS class record. The process specifies a record of type “qos-class-record.” The example specifies “ipv4 source” and “ipv4 destination” addresses, but you can configure the record to match according to other criteria.
Note![]() Ensure that QoS metrics collection is enabled. SeeEnabling QoS Metric Collection.
Ensure that QoS metrics collection is enabled. SeeEnabling QoS Metric Collection.
Step 2: Create the QoS Class Hierarchy Monitor
Use the following FNF configuration to create a QoS Class Hierarchy monitor. The process specifies a monitor of type “class-hier-monitor.” In the steps that follow, the monitor is attached to the desired interface.
Step 3: Attach the QoS Class Hierarchy Monitor to an Interface
Use the following to attach the monitor to the desired interface. For <interface> , specify the interface type—for example: GigabitEthernet0/2/1
Specify the IP address of the interface in IPv4 or IPv6 format.
Note![]() Attaching the service-policy to the interface, as indicated by the “service-policy” statement below, is a required step.
Attaching the service-policy to the interface, as indicated by the “service-policy” statement below, is a required step.
Verifying the QoS Class Hierarchy Monitor Configuration
This section provides commands that are useful for verifying or troubleshooting a QoS Class Hierarchy Monitor configuration.
Verifying that the Monitor is Allocated
Use the following command to verify that the QoS monitor exists:
Use the following commands to verify additional details:
Verifying FNF-QOS FIA Activation
In the following feature invocation array (FIA) verification example, the interface is GigabitEthernet0/2/1.
Verifying the FNF Monitor and Record
Use the following debug commands to verify that the FNF monitor and record have been created:
Connection/Transaction Metrics
|
|
|
|---|---|
Flexible NetFlow (FNF) monitors can report on individual transactions within a flow. This enables greater resolution for traffic metrics. This section describes how to configure connection and transaction metrics, including transaction-id and connection id , for FNF monitors. The connection/transaction monitoring feature is referred to as “Multi-transaction.”
Note![]() The Multi-transaction feature requires an NBAR protocol pack that supports the feature. The protocol pack provided with Cisco AVC for IOS XE release 3.9S and later protocol packs support this feature.
The Multi-transaction feature requires an NBAR protocol pack that supports the feature. The protocol pack provided with Cisco AVC for IOS XE release 3.9S and later protocol packs support this feature.
Introduction
Flexible NetFlow (FNF) monitors typically report traffic metrics per flow. (A flow is defined as a connection between a specific source address/port and destination address/port.) A single flow can include multiple HTTP transactions. Enabling the Multi Transaction feature for a monitor enables reporting metrics for each transaction individually.
You can configure the FNF record to identify the flow or the flow+transaction, using one of the following two metrics:
- connection id—A 4-byte metric identifying the flow.
- transaction-id—An 8-byte metric composed of two parts:
–![]() MSB—Identifies the flow and is equivalent to the connection id metric.
MSB—Identifies the flow and is equivalent to the connection id metric.
–![]() LSB—Identifies the transaction. The value is a sequential index of the transaction, beginning with 0.
LSB—Identifies the transaction. The value is a sequential index of the transaction, beginning with 0.
Configuration
The following subsections describe the Multi-transaction feature:
Requirements
The following requirements apply when using the Multi-transaction feature:
- The record configuration must use match , not collect .
- Specify only “connection id” or “transaction-id,” but not both.
- Include “application name” in the record.
- Include “cache timeout event transaction-end” which specifies that the record is transmitted immediately and not stored in the monitor cache.
Configuring Exporter, Record, and Monitor in Performance Monitor Mode
Flexible Netflow (FNF) performance monitor (perf-monitor) mode enables configuring monitors with advanced filtering options that filter data before reporting it. Options for configuring filtering include IP access list, policy-map, and so on.
The following perf-monitor example configures a monitor and specifies the transaction-id metric for the FNF record, as shown in bold . Alternatively, you can specify the connection id metric.
Note![]() SeeConfiguring Exporter, Record, and Monitor in Performance Monitor Mode for additional configuration information.
SeeConfiguring Exporter, Record, and Monitor in Performance Monitor Mode for additional configuration information.
Verifying and Troubleshooting the Configuration
This section describes commands useful for verification and troubleshooting the FNF configuration. There are subsections for:
Note![]() For information about theshow commands in the sections below, see the FNF command reference guide:
For information about theshow commands in the sections below, see the FNF command reference guide:
http://www.cisco.com/c/en/us/td/docs/ios-xml/ios/fnetflow/command/fnf-cr-book.html
Native or Performance Monitor Mode
Verifying Multi-transaction Status
Display the Multi-transaction status:
If Multi-transaction is enabled, the value is: is_multi_trs_enable==1
Native FNF Mode
Use the following show commands to validate the configuration.
Viewing Collected FNF Data and Statistics
Use the following show commands to view the collected FNF data and statistics.
Performance Monitor Mode
Use the following show commands to validate the configuration.
Viewing Collected FNF Data and Statistics
Use the following show commands to view the FNF collected data and statistics.
Easy Performance Monitor
|
|
|
|---|---|
The following features were added in release 15.4(3)T:
|
The following features were added in release 3.13S:
|
Note![]() Before downgrading to an earlier Cisco IOS XE release, reviewISSU Limitations. Configurations that employ features introduced in a later Cisco IOS XE release are not compatible with earlier releases.
Before downgrading to an earlier Cisco IOS XE release, reviewISSU Limitations. Configurations that employ features introduced in a later Cisco IOS XE release are not compatible with earlier releases.
Overview
The Easy Performance Monitor (“Easy perf-mon” or “ezPM”) feature provides an “express” method of provisioning monitors. This new mechanism adds functionality and does not affect the existing methods for provisioning monitors.
Easy perf-mon does not provide the full flexibility of the traditional perf-mon configuration model. Easy perf-mon provides “profiles” that represent typical deployment scenarios. See Profiles. Easy perf-mon profiles include:
After selecting a profile and specifying a small number of parameters, Easy perf-mon provides the remaining provisioning details.
For additional information about configuring Easy perf-mon, see:
Easy Performance Monitor
Profiles
Application Experience Profile
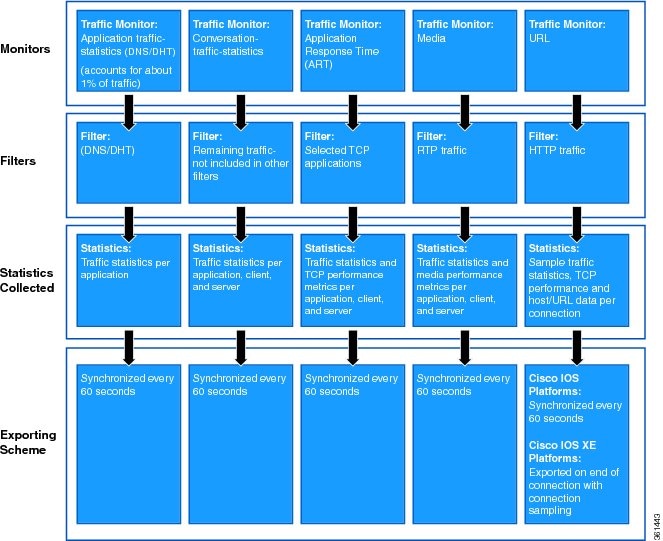
The Application Experience profile enables use of five different traffic monitors, described in Table 4-4 .
Application Experience implements the improved data exporting model introduced in Cisco IOS XE 3.10S, which is optimized for maximum performance, exporting the maximum possible amount of available information for monitored traffic. Based on the requirements of the reports that have been defined:
- For each type of traffic, the exported record contains all of the collected data required for the defined reports, with the required granularity.
- Exported records do not contain unnecessary data, such as data redundant with previously exported records or data that is not required for the defined reports.
- Exported records include server information.
Monitor Details
Table 4-4 Application Experience Traffic Monitors
|
|
|
|
|---|---|---|
HTTP applications1 |
||
|
1.The ezPM URL monitor is configured by default with a pre-defined class that contains a subset of HTTP-based protocols. To modify the list of monitored HTTP protocols, use the class-replace command (see Configuring Easy Performance Monitor) or configure the monitor manually. In a future release, this URL monitor will automatically support all HTTP-based protocols supported by the protocol pack; no modification by CLI will be required. |
For the monitor parameters shown in Table 4-5 , default values can be overridden to configure the monitors differently. For an example of how to configure parameters in the Application Experience profile, see Easy Perf-Mon Configuration Example 2: Application Experience Profile.
Table 4-5 Application Experience Traffic Monitors: Configurable Parameters
|
|
|
||||||
|---|---|---|---|---|---|---|---|
|
|
|
|
|
|
|
||
Notes and Limitations
- Context Limitation —On Cisco IOS platforms, only a one context can be attached to any single interface. The context can be from any currently available profile, such as Application Experience or Application Statistics.
- Infrastructure —The Application Experience profile operates by provisioning performance monitor CLIs. It utilizes the performance monitor infrastructure, including performance monitor policy maps, performance monitor records, and so on.
- Context Limitation —A maximum of three (3) Application Statistics profile contexts can be attached to a single interface, in addition to one (1) Application Experience context, for a total of four contexts.
Export Model
Figure 4-3 illustrates how the Application Experience profile exports different types of traffic statistics.
Figure 4-3 Export Model—Application Experience Profile
Application Statistics Profile
Application Statistics is a simpler profile than Application Experience. In contrast to the Application Experience profile, it provides only application statistics and does not report performance statistics.
The Application Statistics profile provides two different traffic monitors, application-stats and application-client-server-stats, described in Table 4-6 . The monitors operate on all IPv4 and IPv6 traffic.
Selecting a Monitor
The Application Statistics profile includes two monitors, but operates with only one or the other of the two monitors. It is not possible to run both monitors simultaneously, and doing so would not be useful because the application-client-server-stats monitor reports all of the same information as the application-stats monitor, plus additional information.
Consequently, when configuring this profile, the traffic monitor all command is not available.
Monitor Details
Table 4-6 Application Statistics Traffic Monitors
|
|
|
|
|---|---|---|
Table 4-7 indicates the parameters that can be set differently from the default values when configuring monitors in the Application Statistics profile.
Table 4-7 Application Statistics Traffic Monitors: Configurable Parameters
|
|
|
||||||
|---|---|---|---|---|---|---|---|
|
|
|
|
|
|
|
||
Notes and Limitations
- AOR —Account on Resolution (AOR) is supported.
- Infrastructure —On Cisco IOS platforms, the Application Statistics profile operates by provisioning in the performance monitor infrastructure, similarly to the Application Experience profile.
Although the Application Statistics profile operates using a different infrastructure on Cisco IOS XE platforms, provisioning is handled in the same way and the infrastructure differences are essentially transparent to the user.
- AOR —Account on Resolution (AOR) is not supported.
- Infrastructure —To provide maximum performance, on Cisco IOS XE platforms the Application Statistics profile operates by provisioning native FNF monitors on the interface. The profile does not include the complexity and flexibility of the performance monitor infrastructure, such as policy maps and so on.
Although the Application Statistics profile operates using a different infrastructure on Cisco IOS platforms, provisioning is handled in the same way and the infrastructure differences are essentially transparent to the user.
- GETVPN Interoperability —Because the Application Statistics profile operates on Cisco IOS XE platforms using native FNF, and FNF monitors encrypted traffic, GETVPN interoperability is not supported on these platforms.
- Context Limitation —A maximum of three (3) Application Statistics profile contexts can be attached to one interface, in addition to one (1) Application Experience context, for a total of four.
Configuring Easy Performance Monitor
- Only traffic monitors available in the profile can be activated.
- Each traffic monitor is configured on a separate line. If only the traffic-monitor name is specified, the monitor is activated with the default configuration defined in the profile.
Note![]() SeeTable 4-8 for information about which releases support each option.
SeeTable 4-8 for information about which releases support each option.
3.![]() performance monitor context context-name profile profile-name
performance monitor context context-name profile profile-name
4.![]() exporter destination { hostname | ipaddress } source interface interface-type number [ port port-value transport udp vrf vrf-name ]
exporter destination { hostname | ipaddress } source interface interface-type number [ port port-value transport udp vrf vrf-name ]
5.![]() (Optional) Repeat Step 4 to configure up to three (3) exporters.
(Optional) Repeat Step 4 to configure up to three (3) exporters.
6.![]() traffic monitor { traffic-monitor-name [ ingress | egress ] } [[ cache-size max-entries ] | [ cache-type { normal | synchronized }] | [{ class-and | class-replace2 } class-name ] | ipv4 | ipv6 ] [ sampling-rate number ]
traffic monitor { traffic-monitor-name [ ingress | egress ] } [[ cache-size max-entries ] | [ cache-type { normal | synchronized }] | [{ class-and | class-replace2 } class-name ] | ipv4 | ipv6 ] [ sampling-rate number ]
7.![]() To configure additional traffic monitor parameters, repeat Step 6.
To configure additional traffic monitor parameters, repeat Step 6.
9.![]() interface interface-type number
interface interface-type number
10.![]() performance monitor context context-name
performance monitor context context-name
Table 4-8 Easy Performance Monitor Configuration Options
For additional information about configuring Easy perf-mon, see:
Configuration Examples
Easy Perf-Mon Configuration Example 1
The following Easy perf-mon configuration example activates all traffic monitors in the profile and attaches the policy-maps, both ingress and egress, to the GigabitEthernet0/0/1 interface:
Easy Perf-Mon Configuration Example 2: Application Experience Profile
The following ezPM “Application Experience” profile configuration example activates three traffic monitors, and specifies monitoring only IPv4 traffic. The context is then attached to two interfaces:
Easy Perf-Mon Configuration Example 3: Application Statistics Profile
The following ezPM “Application Statistics” profile configuration example uses the “app-usage” context and activates one traffic monitor: application-stats.
The application-stats monitor provides per interface/application/direction/protocol and IP version traffic (bytes/packets) and flow (new flows/concurrent flows) statistics.
Easy Perf-Mon Configuration Example 4: Two Contexts Configured on a Single Interface
The following ezPM configuration example combines two contexts on the GigabitEthernet0/0/1 interface:
- One context applies the “Application Statistics” profile, referred to as fg (fine grain). In the example, this context configures detailed reporting for critical applications.
- One context applies the “Application Statistics” profile, referred to as cg (coarse grain). This context configures more general reporting of application metrics for all traffic.
CLI Field Aliases
|
|
|
|---|---|
Aliases provide a mechanism for simplifying configuration statements. The all alias refers to the set of all fields possible for a given statement. For example, “ collect connection delay all ” configures all fields that are possible to configure by the “ collect connection delay ” statement.

Identifying the Monitored Interface
|
|
|
|---|---|
The “observation point id” metric identifies a monitored interface for traffic in both directions (ingress and egress). A single flow definition using this metric can be used in place of match interface input and match interface output , making configuration more compact and enabling a single record collected on an interface to include metrics for traffic in both directions.
Configure the monitor on both the ingress and egress directions.
In the following example configuration, a single monitor identifies the interface for traffic in both directions:
Configuration Examples
This section contains AVC configuration examples. These examples provide a general view of a variety of configuration scenarios, combining multiple AVC features. Configuration is flexible and supports different types of record configurations.
Conversation Based Records—Omitting the Source Port
The monitor configured in the following examples sends traffic reports based on conversation aggregation. For performance and scale reasons, it is preferable to send TCP performance metrics only for traffic that requires TCP performance measurements. It is recommended to configure two similar monitors:
- One monitor includes the required TCP performance metrics. In place of the line shown in bold in the example below (collect <any TCP performance metric>), include a line for each TCP metric for the monitor to collect.
- One monitor does not include TCP performance metrics.
The configuration is for IPv4 traffic. Similar monitors should be configured for IPv6.
Example 1: For Cisco IOS Platforms
Example 2: For Cisco IOS XE Platforms
HTTP URL
The monitor configured in the following example sends the HTTP host and URL. If the URL is not required, the host can be sent as part of the conversation record (see Conversation Based Records—Omitting the Source Port).
HTTP URI
The uri statistics command enables exporting the first level of a parsed URI address. The command exports the value in the URI statistics field, which contains the depth 1 URI value, followed by a URI hit count value.
Note![]() Cisco IOS XE Platforms: The URI hit count value is always 1 because the URI statistics field can only be configured per connection or transaction.
Cisco IOS XE Platforms: The URI hit count value is always 1 because the URI statistics field can only be configured per connection or transaction.
If no backslash exists at all after the URL, a zero length field is exported.
If the depth 1 value of the parsed URI exceeds a maximum number of characters, the value is truncated to the maximum length.
Note![]() Cisco IOS XE Platforms: The uri statistics command must be configured with either the connection id or transaction-id commands.
Cisco IOS XE Platforms: The uri statistics command must be configured with either the connection id or transaction-id commands.
Example of Exported Value—Typical Address
Address: http://usr:pwd@www.test.com:81/dir/dir.2/index.htm?q1=0&&test1&test2=value#top
The uri statistics command exports: /dir:1
- /dir is the URI depth 1 level value.
- The “ : ” indicates a null character, followed by a URI hit count value of 1 .
Example of Exported Value—No Backslash after URL
Application Traffic Statistics
The monitor configured in the following example collects application traffic statistics:
Media RTP Report
The monitor configured in the following example reports on media traffic:
QoS Example 1: Control and Throttle Traffic
The following QoS configuration example illustrates how to control and throttle the peer-to-peer (P2P) traffic in the network to 1 megabit per second:
QoS Example 2: Assigning Priority and Allocating Bandwidth
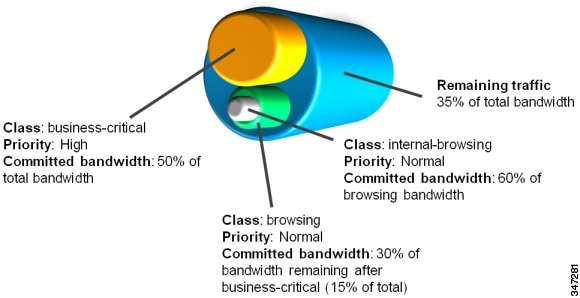
The following QoS configuration example illustrates how to allocate available bandwidth on the eth0/0 interface to different types of traffic. The allocations are as follows:
- Business-critical Citrix application traffic for “access-group 101” users receives highest priority, with 50% of available bandwidth committed and traffic assigned to a priority queue. The
policestatement limits the bandwidth of business-critical traffic to 50% in the example. - Web browsing receives a committed 30% of the remaining bandwidth after the business-critical traffic. This is a commitment of 15% of the total bandwidth available on the interface.
- Internal browsing, as defined by a specific domain (myserver.com in the example), receives a committed 60% of the browsing bandwidth.
- All remaining traffic uses the remaining 35% of the total bandwidth.
The policy statements commit minimum bandwidth in the percentages described for situations of congestion. When bandwidth is available, traffic can receive more than the “committed” amount. For example, if there is no business-critical traffic at a given time, more bandwidth is available to browsing and other traffic.
Figure 4-4 illustrates the priority and bandwidth allocation for each class. “Remaining traffic” refers to all traffic not specifically defined by the class mapping.
Figure 4-4 Bandwidth Allocation
In class-map definition statements:
- match-all restricts the definition to traffic meeting all of the “match” conditions that follow. For example, the “business-critical” class only includes Citrix protocol traffic from IP addresses in “access-group 101.”
- match-any includes traffic meeting one or more of the “match” conditions that follow.
 Feedback