Cisco Nexus Dashboard Fabric Controller (NDFC) Deployment Guide
Available Languages
Bias-Free Language
The documentation set for this product strives to use bias-free language. For the purposes of this documentation set, bias-free is defined as language that does not imply discrimination based on age, disability, gender, racial identity, ethnic identity, sexual orientation, socioeconomic status, and intersectionality. Exceptions may be present in the documentation due to language that is hardcoded in the user interfaces of the product software, language used based on RFP documentation, or language that is used by a referenced third-party product. Learn more about how Cisco is using Inclusive Language.
- US/Canada 800-553-2447
- Worldwide Support Phone Numbers
- All Tools
 Feedback
 Feedback
Cisco Nexus Dashboard Fabric Controller (NDFC), formerly known as Data Center Network Manager (DCNM), runs exclusively as an application service on top of Cisco Nexus Dashboard (ND). Nexus Dashboard uses Kubernetes at its core with customized extensions, creating a secure, scaled-out platform for microservices-based application deployment. Nexus Dashboard provides Active/Active HA (High Availability) for all applications running on top of that cluster.
The NDFC 12.1.3b release introduces several new features, notably pure IPv6 deployment and management capability. Prior ND releases supported pure IPv4 or dual-stack IPv4/IPv6 configurations for the cluster nodes. With release 3.0(1), ND now supports pure IPv4, pure IPv6, and/or dual stack IPv4/IPv6 configurations for the cluster nodes and services. These new deployment models are the focus of this paper.
Note: The documentation set for this product strives to use bias-free language. For the purposes of this documentation set, bias-free is defined as language that does not imply discrimination based on age, disability, gender, racial identity, ethnic identity, sexual orientation, socioeconomic status, and intersectionality. Exceptions may be present in the documentation due to language that is hardcoded in the user interfaces of the product software, language used based on RFP documentation, or language that is used by a referenced third-party product.
NDFC can be deployed to manage three fabric types—LAN, IPFM, and SAN. LAN stands for Local Area Network; NDFC supports two types of LAN fabrics —Brownfield deployments are applicable for existing fabrics, while Greenfield deployments are for new fabrics. For more information on LAN deployments, refer to the NDFC 12.1.3b Release Notes and Enhanced Classic LAN in Cisco NDFC. IPFM stands for IP Fabric for Media; the IPFM fabric feature is a specific type of LAN fabric, and it must be specifically enabled. For more information, refer to the IPFM and Classic IPFM, Release 12.1.3 article. SAN stands for Storage Area Networking; NDFC provides complete lifecycle management and automation for Cisco MDS and Nexus Dashboard deployments, spanning SAN. For more information on SAN deployments, refer to Unlocking SAN Innovation with Cisco NDFC.
You can deploy NDFC on either a Physical Nexus Dashboard Cluster (pND) or a Virtual Nexus Dashboard cluster (vND). In either case, as a native microservices-based application, NDFC supports true scale-out. This means that simply adding extra nodes to the Nexus Dashboard cluster increases the system scale. The system requirements and qualified scale support depend on the Nexus Dashboard deployment model. Refer to the Networking Requirements section to validate NDFC verified scale information.
Customers still running on DCNM can upgrade directly to either NDFC 12.1.3b or NDFC 12.2.2 on the Unified ND platform (starting with ND release 3.2), depending on your unique environment and use case. For information on this specifically, please navigate to the DCNM to NDFC Migration section.
Networking with Nexus Dashboard
As an application that runs on top of Nexus Dashboard, NDFC uses the networking interfaces of Nexus Dashboard to manage, automate, configure, maintain, and monitor the Cisco Nexus and MDS family of switches. In this section, we will briefly review networking guidelines for the Cisco Nexus Dashboard cluster.
Each Nexus Dashboard node in a cluster has two interfaces, each in a different subnet:
● management interface
● data (also known as fabric) interface
Therefore, during deployment of the Nexus Dashboard cluster, you must provide two IP addresses/subnets for each node that will be part of the cluster. At the time of deployment, you may choose whether you want to deploy a single-node or a 3-node Nexus Dashboard cluster. Single-node Nexus Dashboard cluster deployments support NDFC IP Fabric for Media and SAN Controller production deployments, and a LAN Controller lab deployment (<=25 switches). A minimum of three Nexus Dashboard nodes are required for all production NDFC LAN Controller deployments.
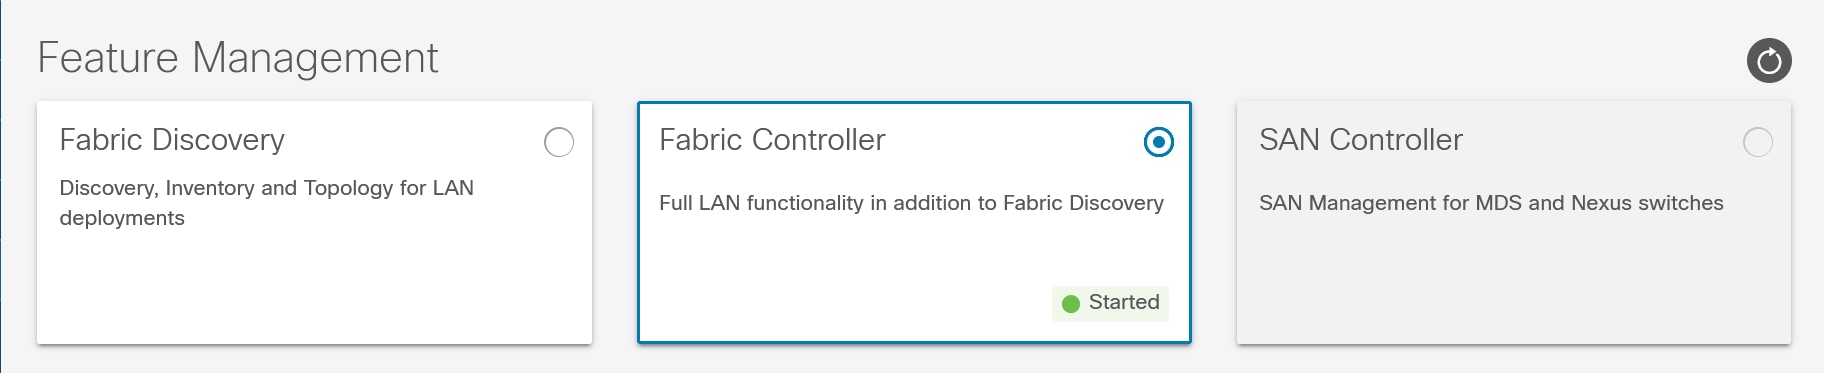
Figure 1: Feature Management
As the name implies, the Nexus Dashboard management interface connects to the management network, and it typically provides web/API access to the Nexus Dashboard cluster. The Nexus Dashboard data interface typically provides IP reachability to the physical data center network infrastructure.
This section describes the purpose and functionality of the networks as they are used by the Nexus Dashboard services.
The management network is used for these functions:
● Accessing the Nexus Dashboard GUI (graphical user Interface).
● Accessing the Nexus Dashboard CLI (command‐line interface) via SSH (Secure Shell).
● DNS (Domain Name System) and NTP (Network Time Protocol) communication.
● Nexus Dashboard firmware upload.
● Installing applications from the Cisco DC App Center (AppStore).
● Intersight device connection.
The data network is used for these functions:
● Nexus Dashboard clustering.
● Application-to-application communication (SMTP (Simple Mail Transfer Protocol) and SNMP (Simple Network Management Protocol) forwarding).
● Two logical interfaces are required per Nexus Dashboard node:
◦ bond1br (also known as the Nexus Dashboard management interface).
◦ bond0br (also known as the Nexus Dashboard data interface).
● For enabling NDFC on a Nexus Dashboard cluster, the Nexus Dashboard management and data interfaces must be in different subnets. Therefore, a minimum of two IP subnets is required for deployment of such a cluster.
● Note: The capability to configure nodes within the cluster with either Layer 2 or Layer 3 adjacency was enabled in release 12.1.1e (NDFC on Nexus Dashboard Release 2.2.1h). For more information on Layer 3 reachability between cluster nodes, see Layer 3 Reachability between Cluster Nodes.
o L2 vs L3 cluster deployments are not discussed in detail in this paper.
● NDFC can manage the switches in two ways: OOB or IB-management.
o In-band management (IB) means that you connect to an IP address of the switch via one or more front-panel ports, often through SSH or Telnet. The address you connect to is often a loopback.
o Out-of-band management (OOB) means that you connect to the mgmt0 interface of the switch, which always has an assigned IP address.
● Switch OOB reachability from NDFC, by default, is via the Nexus Dashboard management interface, so you need to ensure that it is connected to an infrastructure that provides access to the mgmt0 interface(s) of the switches.
o Note: if desired, you can specify, via configuration, to use the data interface for OOB communication.
● Switch in-band reachability from NDFC must be via the Nexus Dashboard data interface. If switches are managed by NDFC via the switch front-panel port (SVI, loopback or equivalent), it is referred to as In-band management.
● All NDFC application pods use the default route that is associated with the Nexus Dashboard data interface. If desired, you may add static routes on Nexus Dashboard to force connectivity through the management interface. This is done via the Nexus Dashboard System Settings workflow that is available on the Nexus Dashboard Admin Console.
● Connectivity between the Nexus Dashboard nodes is required on both networks with the following added round trip time (RTT) requirements:
| Application |
Connectivity |
Maximum RTT |
| Nexus Dashboard Fabric Controller |
Between Nodes |
50 ms |
| To Switches |
200 ms |
Table 1: NDFC RTT stats
NDFC to Device Connectivity
As stated in the Networking Requirements section, a switch can be managed via its mgmt0 interface (also known as OOB management) with NDFC to switch reachability, either via the Nexus Dashboard Management Interface or Data interface. This section includes different use cases when a switch is discovered and managed by NDFC.
When the Nexus Dashboard cluster is online for the first time, you’ll see the following routing table. Note that the IP addresses may be different based on the specific cluster deployment.
[rescue-user@ndfc-12]# ip rule show
0: from all lookup local
32763: from 172.17.0.0/16 lookup 100
32764: from 172.25.74.144 lookup 1001
32765: from 192.168.100.5 lookup 1000
32766: from all lookup main
32767: from all lookup default
Note: By default, only rescue-user is enabled for local SSH to theNexus Dashboard CLI. Root access is denied and can be used only by Cisco TAC (Technical Assistance Center).
Table 100 - used for Inter-POD communication on the Nexus Dashboard Kubernetes architecture.
Table 1001 - used for the Nexus Dashboard Management Network specified during the system installation.
Table 1000: This is used for the Nexus Dashboard fabric (also known as Data) network, which is specified during the system UI bootstrap.
[rescue-user @ndfc-12]# ip route show table 100
default via 192.168.100.254 dev bond0br
172.17.0.0/16 dev k8br0 scope link
172.25.74.0/23 dev bond1br scope link
192.168.100.0/24 dev bond0br scope link
As shown in Table 100, by default, PODs use bond0br (also known as the Nexus Dashboard Fabric/Data Interface) as the next-hop for any default routing. If Nexus Dashboard to Switch mgmt0 communication is desired via the Nexus Dashboard Management interface, an operator must add those specific routes so that the switches can be reached via bond1br (also known as the Nexus Dashboard Management Interface).
Below are some specific examples of how to enable communication between Nexus Dashboard and the Switch mgmt0 interface:
Nexus Dashboard Interfaces are Layer 2-Adjacent to Switch Mgmt0 Interface
Nexus Dashboard management IP = 172.25.74.144/24, Nexus Dashboard data IP = 192.168.100.10/24. Switch mgmt0 IP = 172.25.74.10/24
In this case, the switch management 0 IP address and Nexus Dashboard management IP address are part of the same subnet. Therefore, NDFC onboards the switch using the management interface. As it is Layer 2 in nature, it picks the interface with the matching subnet.
The Nexus Dashboard Management Interface is used for switch discovery, monitoring, configuration deployments, image management, out-of-band POAP, and PMN/PTP telemetry. The Nexus Dashboard Data Interface is used for in-band-related features, such as Endpoint Locator.
To enable Layer 2 adjacency, define the persistent IP addresses used for SCP-POAP and SNMP-trap services in the Nexus Dashboard Management subnet. For more information, see Persistent IP Requirements for NDFC.
Nexus Dashboard management IP = 172.25.74.144/24, Nexus Dashboard data IP = 192.168.100.10/24. Switch mgmt0 IP = 192.168.100.100/24
In this case, the switch management 0 IP and Nexus Dashboard Data IP are part of the same subnet. Therefore, NDFC onboards the switch using the data interface. As it is Layer 2 in nature, it will pick the interface with the matching subnet.
The Nexus Dashboard Data Interface is used for switch out-of-band discovery, monitoring, configuration deployments, image management, and POAP (out-of-band). The Nexus Dashboard Data Interface is also used for Endpoint Locator and PMN/PTP Telemetry.
To enable this use case, do the following tasks:
1. Define the persistent IP addresses used for SCP-POAP and SNMP-trap services in the Nexus Dashboard Management subnet. For more information, see Persistent IP Requirements for NDFC.
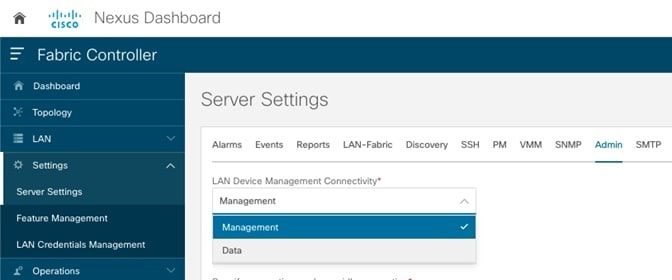
2. Change the NDFC global Server Settings LAN Device Management Connectivity from “Management” to “Data,” as shown in the following image.
 |
Note: There is a special configuration required for performing Image management on switches mgmt0 using the Nexus Dashboard Data interface.
3. By default, when NDFC LAN Device Management Connectivity is set to Data, the SCP-POAP and SNMP-trap service pods are spawned with persistent IPs associated with the Nexus Dashboard data interface subnet. For operations related to any file copies to/from the NDFC from/to the switch, NDFC uses a default VRF. The switch has IP reachability to the Nexus Dashboard data interface over the default VRF. This includes image copy operations required for Image and package management. In this case, NDFC utilizes the mgmt0 interface VRF, also known as management VRF for such operations. Therefore, the following options are supported:
4. If switches have not already been added into NDFC, perform Step 3a; if switches are added/already discovered and present in the fabric, perform Step 3b.
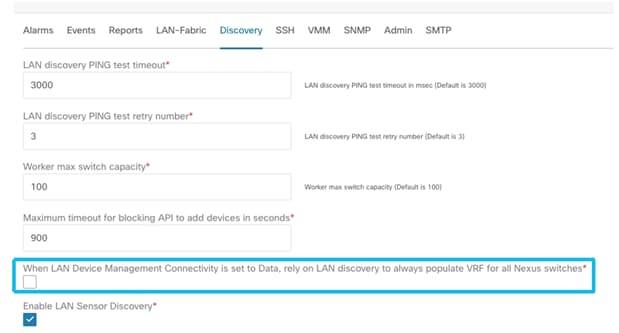 |
3a. Enable NDFC server settings. On the NDFC Web UI, choose LAN > Settings > Server Settings > Discovery tab. Enable the setting as shown in the following image.
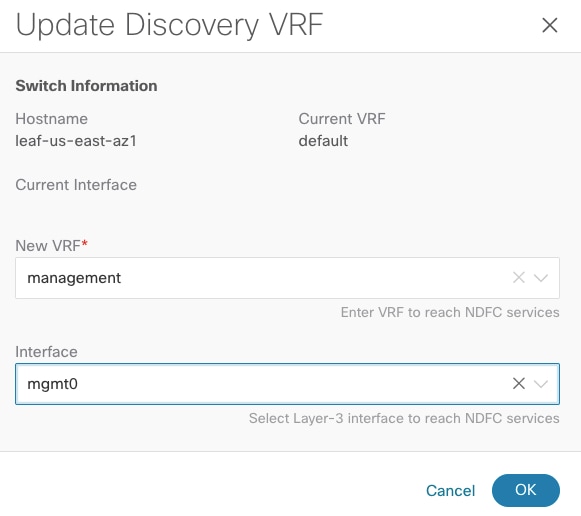
3b. Update discovery VRF per switch. Choose LAN > Switches. Double click on the switch to open the Switch Overview screen, From the Actions drop-down list, choose Discovery > Update VRF.
 |
By enabling the above options, the VRF associated with the interface that has the discovery IP for a switch will be auto-d iscovered by NDFC during switch import. The option to override the VRF for a particular switch is always available and, if set by the user, it is always honored.
Nexus Dashboard Interfaces are Layer-3 Adjacent to Switch Mgmt0 Interface
Case 3
Nexus Dashboard management IP = 172.25.74.144/24, Nexus Dashboard data IP = 192.168.100.10/24. Switch mgmt0 IP = 10.23.234.192/16
In this case, the Switch management 0, also known as mgmt0, IP address is not part of the subnets associated with either Nexus Dashboard interface. For this typical layer-3 reachability scenario, users must decide which Nexus Dashboard Interface will provide IP reachability to the switches, and therefore will be used for switch onboarding and discovery.
In this case, the switch mgmt0 interface is reachable via the Nexus Dashboard Management Interface.
The Nexus Dashboard Management Interface is used for switch discovery, monitoring, configuration deployments, image management, and out-of-band POAP. The Nexus Dashboard Data Interface is used for the Endpoint Locator.
To enable this use case, do the following tasks:
1. Add static route(s) associated with the ND Management interface pointing to the switch mgmt0 subnet(s).
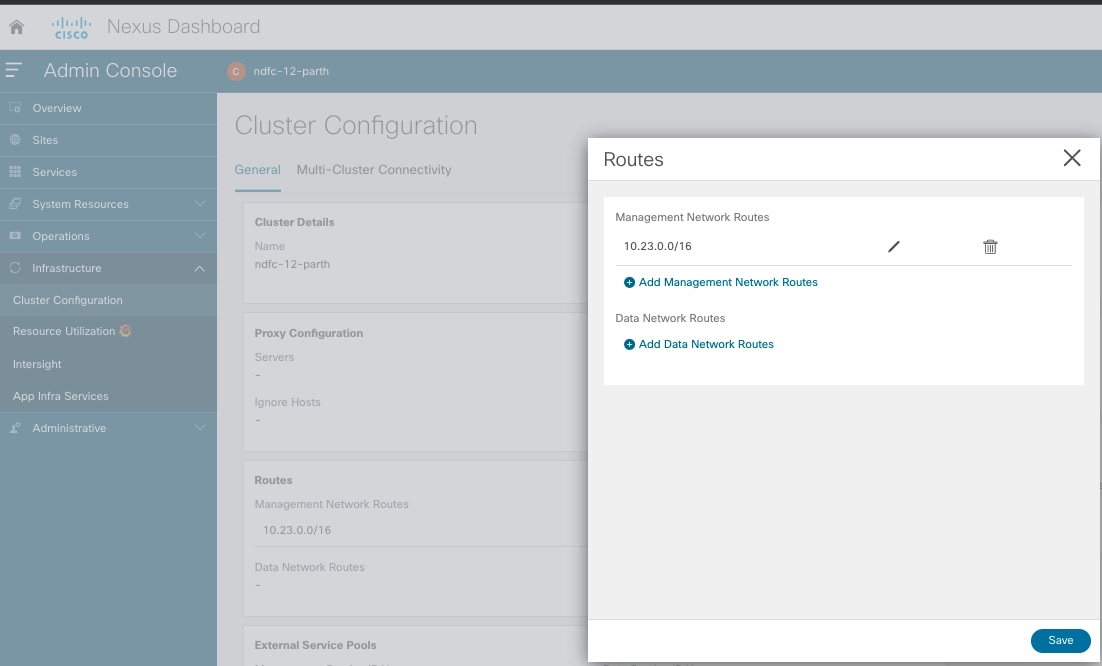
Figure 5: Figure 1. Adding Nexus Dashboard Static Routes for IP Connectivity.
Note that using this static route configuration option, the operator can decide whether to use the Nexus Dashboard management or data interface for reachability to a particular destination, even if the destination is reachable over both interfaces. Now, if we check the updated routing table, we see that a new entry has been added to Table 100.
[rescue-user@ndfc-12]# ip route show table 100
default via 192.168.100.254 dev bond0br
10.23.0.0/16 via 172.25.74.1 dev bond1br
172.17.0.0/16 dev k8br0 scope link
172.25.74.0/23 dev bond1br scope link
192.168.100.0/24 dev bond0br scope link
Therefore, the switch with the IP address of 10.23.234.192 can now be reached via the Nexus Dashboard Management Interface and can be successfully imported into the NDFC.
2. Define the persistent IP addresses used for SCP-POAP and SNMP-trap services in the Nexus Dashboard Management subnet. For more information, see Persistent IP Requirements for NDFC.
Recall that the NDFC LAN Device Management Connectivity in the Server Settings is set to Management by default. Consequently, the SCP-POAP and SNMP-trap service pods will be spawned with persistent IPs associated with the Nexus Dashboard management subnet.
Nexus Dashboard management IP = 172.25.74.144/24, Nexus Dashboard data IP = 192.168.100.10/24. Switch mgmt0 IP = 10.35.35.35/24
In this scenario, the switch management 0 (also known as mgmt0) IP address is not part of subnets associated with either Nexus Dashboard interface. For this typical Layer-3 reachability scenario, users must decide which Nexus Dashboard Interface to use for switching onboarding.
For this use case, the switch’s mgmt0 interface is accessed via the ND Data Interface. Switches managed or discovered via the front-panel interfaces such as SVIs, loopbacks, and so on, must always be reachable via the ND data interface. NDFC supports simultaneous support for switches when they are reachable over the switch mgmt0 interface (aka Out-of-Band access) or reachable via the front-panel ports (aka In-Band access).
The Nexus Dashboard Data Interface is used for switch out-of-band and inband discovery, monitoring, configuration deployments, image management, and POAP (both out-of-band and inband). The Nexus Dashboard Data Interface is also used for the Endpoint Locator if enabled.
To enable this use case, the configuration steps are similar to those of Case 2. The only addition is to Add static route(s) to the ND Data interface pointing to the switch’s mgmt0 subnet(s). Notice that this is not required for routing reachability purposes, as the default route associated with the ND Data interface previously shown above would take care of that. However, it is necessary to ensure NDFC POAP can work adequately for touchless Day-0 switch bring-up.
Nexus Dashboard management IP = 172.25.74.144/24, Nexus Dashboard data IP = 192.168.100.10/24. Switch mgmt0 IP = 10.55.55.55/24
In this scenario, the switch management 0 (also known as mgmt0) IP address is not part of subnets associated with either Nexus Dashboard interface. For this typical Layer-3 reachability scenario, users must decide which Nexus Dashboard Interface to use for switching onboarding.
For this use case, you must deploy an NDFC cluster with Layer-3 reachability between the ND nodes. The NDFC LAN Device Management Connectivity in Server Settings must be set to Data. This implies that the SCP-POAP and SNMP-trap service pods have persistent IPs associated with a subnet pool that is associated with the ND data interface. Note that the persistent IPs are not part of either the ND data or management subnet of any of the nodes, as is typically the case for the Layer-2 adjacent ND cluster deployment. They belong to a different pool so the current persistent IP reachability for the pods is dynamically advertised to the physical network via eBGP. For more information, see Layer-3 Reachability between Cluster Nodes.
In this scenario, the Switch Mgmt0 interface has IP reachability from NDFC via the ND Management Interface. However, for image management and SNMP trap purposes, the switch also must have reachability to the ND Data Interface via the front-panel ports (typically part of the default VRF). Therefore, NDFC has IP reachability to the Switch Mgmt0 interface via the ND Management Interface and Switch Front Panel ports via the ND Data Interface. This may be a common scenario when you have physically separate Out-of-Band and Inband networks.
The Nexus Dashboard Management Interface is used for switch out-of-band discovery, monitoring, and configuration deployments. The Nexus Dashboard Data Interface is used for Image management, Inband management/Inband POAP, and the Endpoint Locator.
Note: In this scenario, switch mgmt0 out-of-band POAP is not supported, as an SCP/POAP persistent IP address is associated with the ND Data Interface and Switch mgmt0 reachability is only via the ND Management Interface.
To enable this use case, do the following tasks:
1. Add static route(s) associated with the ND Mgmt interface pointing to the switch mgmt0 subnet(s).
2. Define the persistent IP addresses used for SCP-POAP and SNMP-trap services and associate them with the ND Data interface. For more information on the use of persistent IP addresses, see Persistent IP Requirements for NDFC.
3. Change the global server setting for LAN Device Management Connectivity to Data.
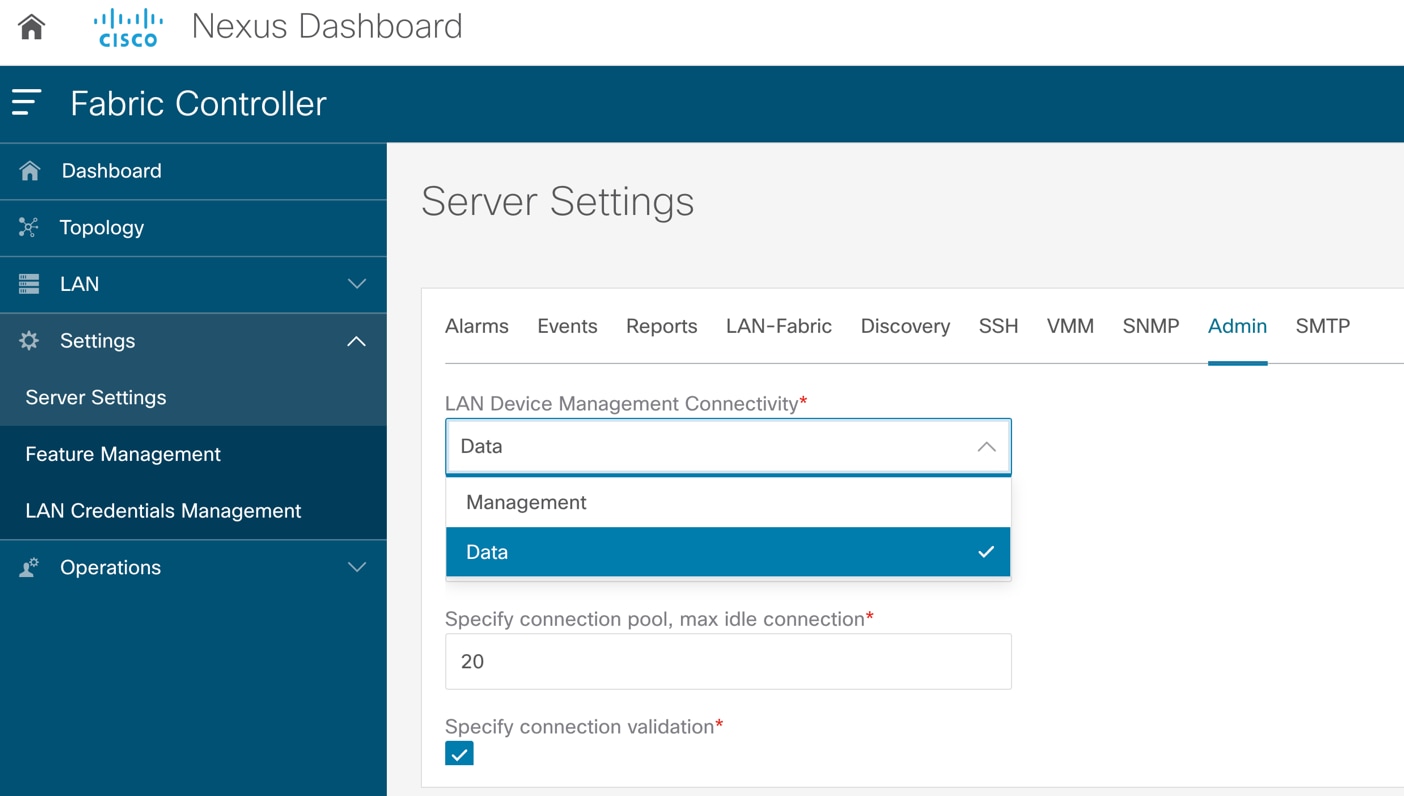
Figure 6: Change the Global Server Setting to Data.
In summary, the following are the guidelines for managing the switches using NDFC.
● To discover a switch, there must be IP reachability from NDFC to that switch. The switch can be imported over its mgmt0 IP (called Out-of-Band management) or over another IP associated with a Layer-3 interface (called Inband management).
● For Out-of-Band or switch mgmt0 access, NDFC may have reachability over the ND management or ND data interface. To set up reachability over the ND management interface, appropriate static routes must be added on the ND management interface. Static routes are required if reachability is over the ND data interface, when NDFC POAP functionality is desired for touchless Day-0 switch bring up.
● For Inband management, NDFC to switch reachability must be set up over the ND data interface. NDFC Inband POAP functionality is supported only over the ND data interface.
● The LAN Device Management Connectivity option in the NDFC Server Settings controls whether the SCP-POAP and SNMP trap services are spawned with persistent IPs that are associated with either the ND management or the ND data interface. The default value for this setting is Management.
● For Inband management, the NDFC LAN Device Management Connectivity option in the NDFC Server Settings must be set to Data. This means to support both Out-of-Band and Inband management simultaneously, all switches must have IP reachability to the ND data interface.
● When configuring an ND cluster with Layer-3 reachability between the ND nodes, the NDFC LAN Device Management Connectivity option in the NDFC Server Settings must be set to Data. This means that even to support Out-of-Band management only, switches must have IP reachability to the ND data interface. The 2 options here are:
◦ IP reachability to switch mgmt0 interface is over the ND data interface
◦ IP reachability to switch mgmt0 interface is over ND management interface
Note that there is also IP reachability from that switch over the front-panel ports to the ND data interface.
● If POAP is desired over Layer-3, that is, NDFC is Layer-3 adjacent to switches, provide Nexus Dashboard Node IPs as DHCP Relay Address(es).
◦ If the NDFC LAN Device Management Connectivity option in the NDFC Server Settings is set to Management (default value), set the DHCP Relay Address to the management interface IP (bond1br) of all the Nexus Dashboard nodes.
◦ If the NDFC LAN Device Management Connectivity option in the NDFC Server Settings is set to Data, set the DHCP Relay Address to the data interface IP (bond0br) of all the Nexus Dashboard Nodes.
Deployment Modes and Design for LAN Fabrics
The following sections provide information about deployment modes and design for LAN fabrics. The example assumes a Layer 2 ND cluster adjacency, but the general guidelines are also applicable at Layer 3 ND adjacency.
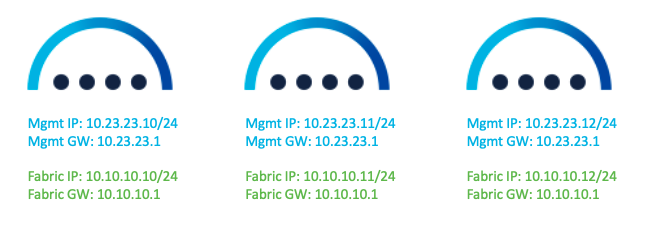
Figure 7: Nexus Dashboard Interface IP Addresses.
The following figure shows the Nexus Dashboard physical node interfaces.
● eth1-1 and eth1-2 must be connected to the management network.
● eth2-1 and eth2-2 must be connected to the data network.
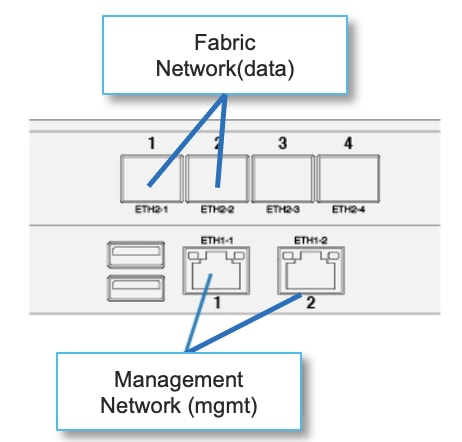
Figure 8: Physical Nexus Dashboard Interface Mapping.
The interfaces are configured as Linux bonds—one for the data interfaces and one for the management interfaces—running in active-standby mode. All interfaces must be connected to individual host ports. Port-Channel or vPC links are not supported.
Figure 9: Deploying NDFC on pND Deployment Model 1.
In this model, the Nexus Dashboard management and data interfaces are connected to a network infrastructure that provides reachability to the switch’s mgmt0 interfaces and front-panel ports. The ND interfaces are connected to a pair of upstream switches in this setup.
Sample Configurations
On both uplink switches (marked as yellow) for Nexus Dashboard management-
Interface eth1/1, eth1/3, eth1/5
switchport mode access
switchport access vlan 23
On both uplink switches (marked as yellow) for Nexus Dashboard fabric-
Interface eth1/2,eth1/4,eth1/6
switchport mode access
switchport access vlan 10
OR
Interface eth1/2,eth1/4,eth1/6
switchport mode trunk
switchport trunk native vlan 10
switchport trunk allowed vlan 10
OR
Interface eth1/2,eth1/4,eth1/6
switchport mode trunk
switchport trunk allowed vlan 10
Note for option 3 under “Nexus Dashboard fabric”: if the trunk native VLAN is not specified on the switch, you provide a VLAN tag of VLAN ID 10 during Nexus Dashboard installation and interface bootstrap.
Figure 10: Deploying NDFC on pND Deployment Model 2.
In this model, two separate network infrastructures provide access to the switch mgmt0 interfaces and front-panel ports. Consequently, the ND management and data interfaces are connected to those separate networks.
Sample Configurations
On both uplink switches (marked as blue) for Nexus Dashboard management-
Interface eth1/1-3
switchport mode access
switchport access vlan 23
On both uplink switches (marked as green) for Nexus Dashboard fabric-
Interface eth1/1-3
switchport mode access
switchport access vlan 10
OR
Interface eth1/1-3
switchport mode trunk
switchport trunk native vlan 10
switchport trunk allowed vlan 10
OR
Interface eth1/1-3
switchport mode trunk
switchport trunk allowed vlan 10
Note: For option 3 under “Nexus Dashboard fabric,” without the trunk native VLAN specified on the switch, you must provide a VLAN tag of VLAN ID 10 during Nexus Dashboard installation and interface bootstrap.
A vND node can be deployed as an OVA in ESXi with or without a vCenter.
Figure 11: vND VM Settings.

Figure 12: NDFC on vND Deployment Model 1.
In this model, we are using a common set of switches that can provide IP reachability to the fabric switches via the Nexus Dashboard management and data interfaces. This infrastructure also uses separate ESXi uplinks for management and data traffic.
Sample Configurations
On both uplink switches (marked as yellow) for Nexus Dashboard management-
interface port-channel1
switchport
switchport mode trunk
switchport trunk allowed vlan 23
spanning-tree port type edge trunk
mtu 9216
vpc 1
interface Ethernet1/1
description To-ESXi-vND1-mgmt
switchport
switchport mode trunk
switchport trunk allowed vlan 23
mtu 9216
channel-group 1 mode active
no shutdown
You must repeat the configuration for the remaining interface(s) attached to the server(s) hosting vND.
On both uplink switches (marked as yellow) for Nexus Dashboard fabric-
interface port-channel2
switchport
switchport mode trunk
switchport trunk allowed vlan 10
spanning-tree port type edge trunk
mtu 9216
vpc 2
interface Ethernet1/2
description To-ESXi-vND1-fabric
switchport
switchport mode trunk
switchport trunk allowed vlan 10
mtu 9216
channel-group 2 mode active
no shutdown
You must repeat the configuration for the remaining interface(s) attached to the server(s) hosting vND.
Deployment Model 2
Figure 13: NDFC on vND Deployment Model 2.
In this model, we are using a common set of switches that can provide IP reachability to the fabric switches via the Nexus Dashboard management and data interfaces. This infrastructure also uses shared ESXi uplinks for both management and data traffic.
On both uplink switches (marked as yellow) for Nexus Dashboard management and fabric-
interface port-channel1
switchport
switchport mode trunk
switchport trunk allowed vlan 23, 10
spanning-tree port type edge trunk
mtu 9216
vpc 1
interface Ethernet1/1
description To-ESXi-vND1
switchport
switchport mode trunk
switchport trunk allowed vlan 23, 10
mtu 9216
channel-group 1 mode active
no shutdown
You must repeat the configuration for the remaining interface(s) attached to the server(s) hosting vND.
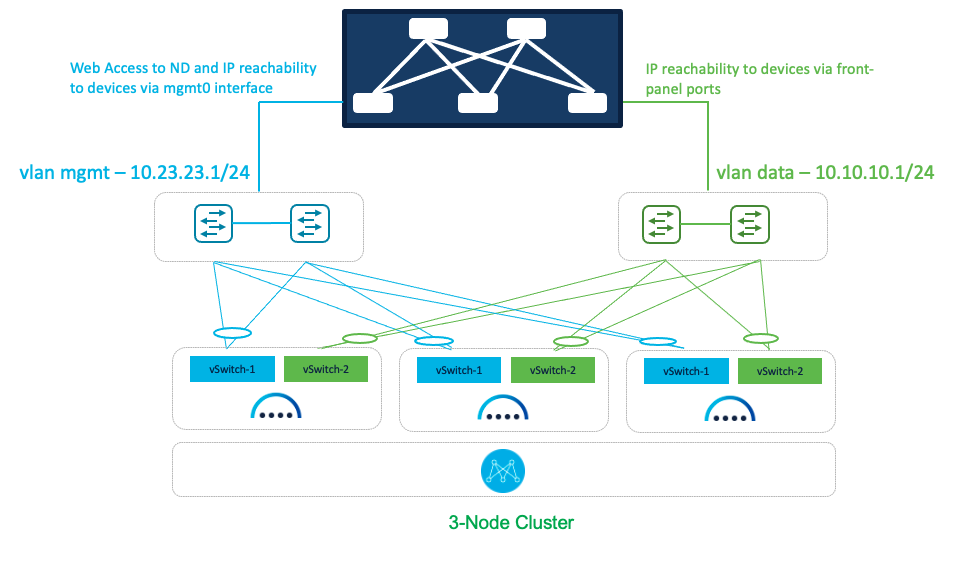
Figure 14: NDFC on vND Deployment Model 3.
In this model, a dedicated pair of switches provides IP reachability to the fabric via the Nexus Dashboard management and data interfaces. This infrastructure also uses separate uplinks for management and data traffic.
Sample Configurations
On both uplink switches (marked as blue) for Nexus Dashboard management-
interface port-channel1
switchport
switchport mode trunk
switchport trunk allowed vlan 23
spanning-tree port type edge trunk
mtu 9216
vpc 1
interface Ethernet1/1
description To-ESXi-vND1-mgmt
switchport
switchport mode trunk
switchport trunk allowed vlan 23
mtu 9216
channel-group 1 mode active
no shutdown
You must repeat the configuration for the remaining interface(s) attached to the server(s) hosting vND.
On both uplink switches (marked as green) for Nexus Dashboard fabric-
interface port-channel1
switchport
switchport mode trunk
switchport trunk allowed vlan 10
spanning-tree port type edge trunk
mtu 9216
vpc 1
interface Ethernet1/1
description To-ESXi-vND1-fabric
switchport
switchport mode trunk
switchport trunk allowed vlan 10
mtu 9216
channel-group 1 mode active
no shutdown
You must repeat the configuration for the remaining interface(s) attached to the server(s) hosting vND.
Deployment Modes and Design for SAN Fabrics
When NDFC is enabled with the SAN Controller persona selected, the resulting application can then be employed for managing and monitoring SAN Fabrics. This includes the ability to enable SAN Insights for deep analytics via streaming telemetry. SAN fabrics typically comprise the Cisco MDS family of switches that support SAN traffic over the Fibre Channel. Recall that for NDFC SAN Controller deployments, both a single and a 3-node vND/pND deployment are supported. Refer to the NDFC Verified Scalability Guide for more details on the supported scale, especially with SAN Insights.
An important distinction to note about SAN deployments is that, in opposition to LAN and IPFM deployments, SAN management and data networks can be in the same subnet if desired by the user.
Deploying SAN Controller on pND
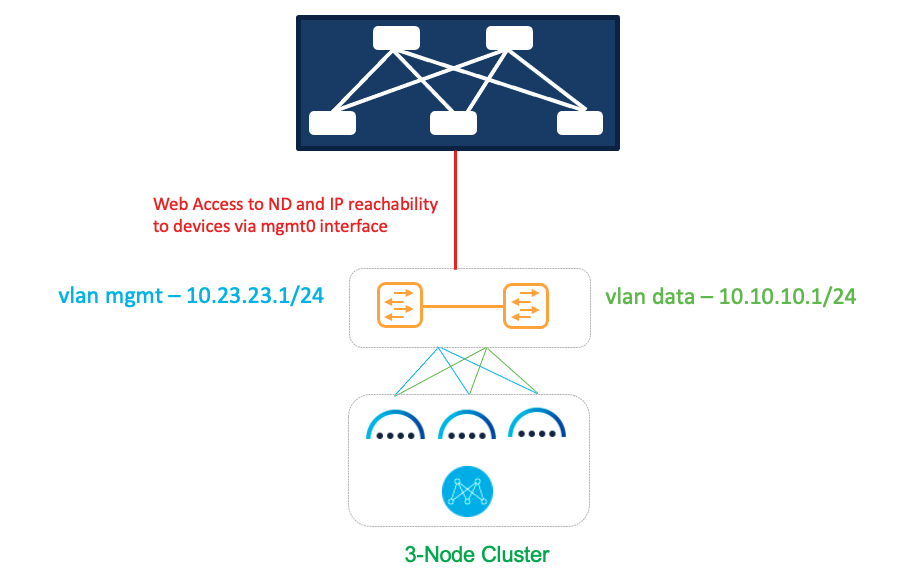
Figure 15: Deploying SAN Controller on pND.
In this option, we are using a common set of switches that can provide IP reachability to fabric switches via the Nexus Dashboard management or data interfaces.
Sample configurations
On both uplink switches (marked as yellow) for Nexus Dashboard management-
Interface eth1/1, eth1/3, eth1/5
switchport mode access
switchport access 23
On both uplink switches (marked as yellow) for Nexus Dashboard fabric-
Interface eth1/2,eth1/4,eth1/6
switchport mode access
switchport access vlan 10
OR
Interface eth1/2,eth1/4,eth1/6
switchport mode trunk
switchport trunk native vlan 10
switchport trunk allowed vlan 10
OR
Interface eth1/2,eth1/4,eth1/6
switchport mode trunk
switchport trunk allowed vlan 10
For the last option without the trunk native VLAN, provide VLAN ID 10 as the VLAN tag during Nexus Dashboard installation and interface bootstrap (as shown in Figure 3) from the Networking Requirements section.
Deploying SAN Controller on vND
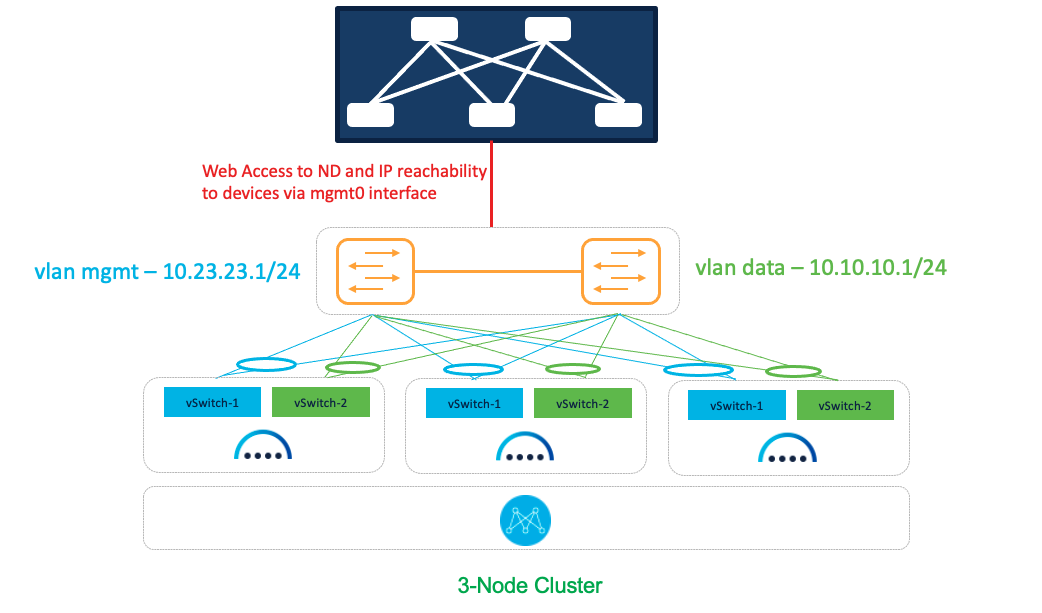
Figure 16: SAN Controller on vND Deployment Option 1.
In this option, we are using a common set of switches that can provide IP reachability to the fabric switches via the Nexus Dashboard management or data interfaces. It also uses separate uplinks for management and data traffic.
Sample Configurations
On both uplink switches (marked as yellow) for Nexus Dashboard management-
interface port-channel1
switchport
switchport mode trunk
switchport trunk allowed vlan 23
spanning-tree port type edge trunk
mtu 9216
vpc 1
interface Ethernet1/1
description To-ESXi-vND1-mgmt
switchport
switchport mode trunk
switchport trunk allowed vlan 23
mtu 9216
channel-group 1 mode on
no shutdown
You must repeat the configuration for the remaining interfaces that are attached to servers hosting vND.
On both uplink switches (marked as yellow) for Nexus Dashboard fabric-
interface port-channel2
switchport
switchport mode trunk
switchport trunk allowed vlan 10
spanning-tree port type edge trunk
mtu 9216
vpc 2
interface Ethernet1/2
description To-ESXi-vND1-fabric
switchport
switchport mode trunk
switchport trunk allowed vlan 10
mtu 9216
channel-group 2 mode on
no shutdown
You must repeat the configuration for the remaining interfaces that are attached to servers hosting vND.
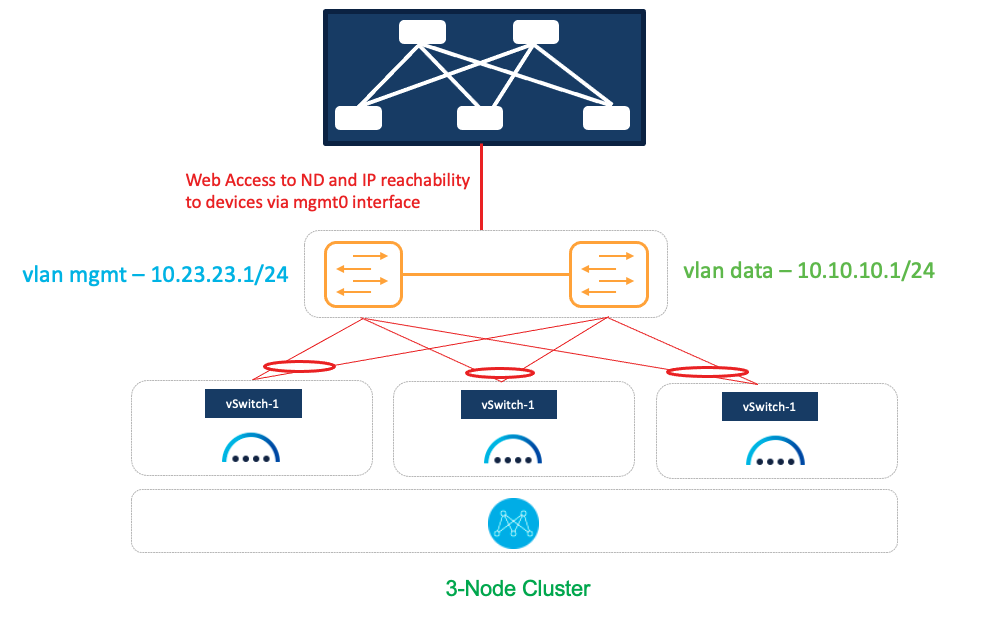
Figure 17: SAN Controller on vND Deployment Option 2.
In this option, we are using a common set of switches that can provide IP reachability to fabric switches via the Nexus Dashboard management or data interfaces. It also uses shared uplinks for both management and data traffic.
On both uplink switches (marked as yellow) for Nexus Dashboard management and fabric-
interface port-channel1
switchport
switchport mode trunk
switchport trunk allowed vlan 23, 10
spanning-tree port type edge trunk
mtu 9216
vpc 1
interface Ethernet1/1
description To-ESXi-vND1
switchport
switchport mode trunk
switchport trunk allowed vlan 23, 10
mtu 9216
channel-group 1 mode on
no shutdown
You must repeat the configuration for the remaining interfaces that are attached to servers hosting vND.
Deployment Mode Options:
The NDFC 12.1.3b release introduces IPv6-only deployment and management capability for the cluster nodes and services. This release also continues to support dual-stack deployment and management.
When defining IP deployment guidelines, it is important to note that all nodes/networks in the cluster MUST have uniform IP configuration—that is, pure IPv4, pure IPv6, or dual-stack IPv4/IPv6. Additionally, the deployment mode MUST be set at the time of initial Nexus Dashboard configuration. If you want to change the deployment mode at any point in time after initial deployment, a clean install is required.
To access NDFC, first deploy Nexus Dashboard, either on pND or vND (as demonstrated above). Once the individual nodes have been configured, navigate to the node’s management IP address to access the cluster configuration user interface.
- Example: if your management IP is 192.168.10.3/24 (with a default gateway of 192.168.10.1), use https://192.168.10.3.
- If you are configuring a 3-node cluster, you can navigate to any of the three management IPs you have configured—you will import the others into the fabric during cluster configuration.
This section covers how to specify the deployment mode (IPv4, IPv6 or dual stack) after you’ve deployed all nodes and have loaded the cluster configuration user interface. For further information on general Nexus Dashboard installation, refer to the Nexus Dashboard deployment guide.
For all deployment models, the following information is required on the “Cluster details” page:
- NTP Host
- DNS Provider IP Address
- Proxy server
- Note: the NTP host and DNS provider IP address must be in the same deployment mode as the management and data addresses—that is, IPv4 for pure IPv4 or IPv6 for pure IPv6. For dual stack deployments, you can pick which mode you would like to use for NTP and DNS.
- 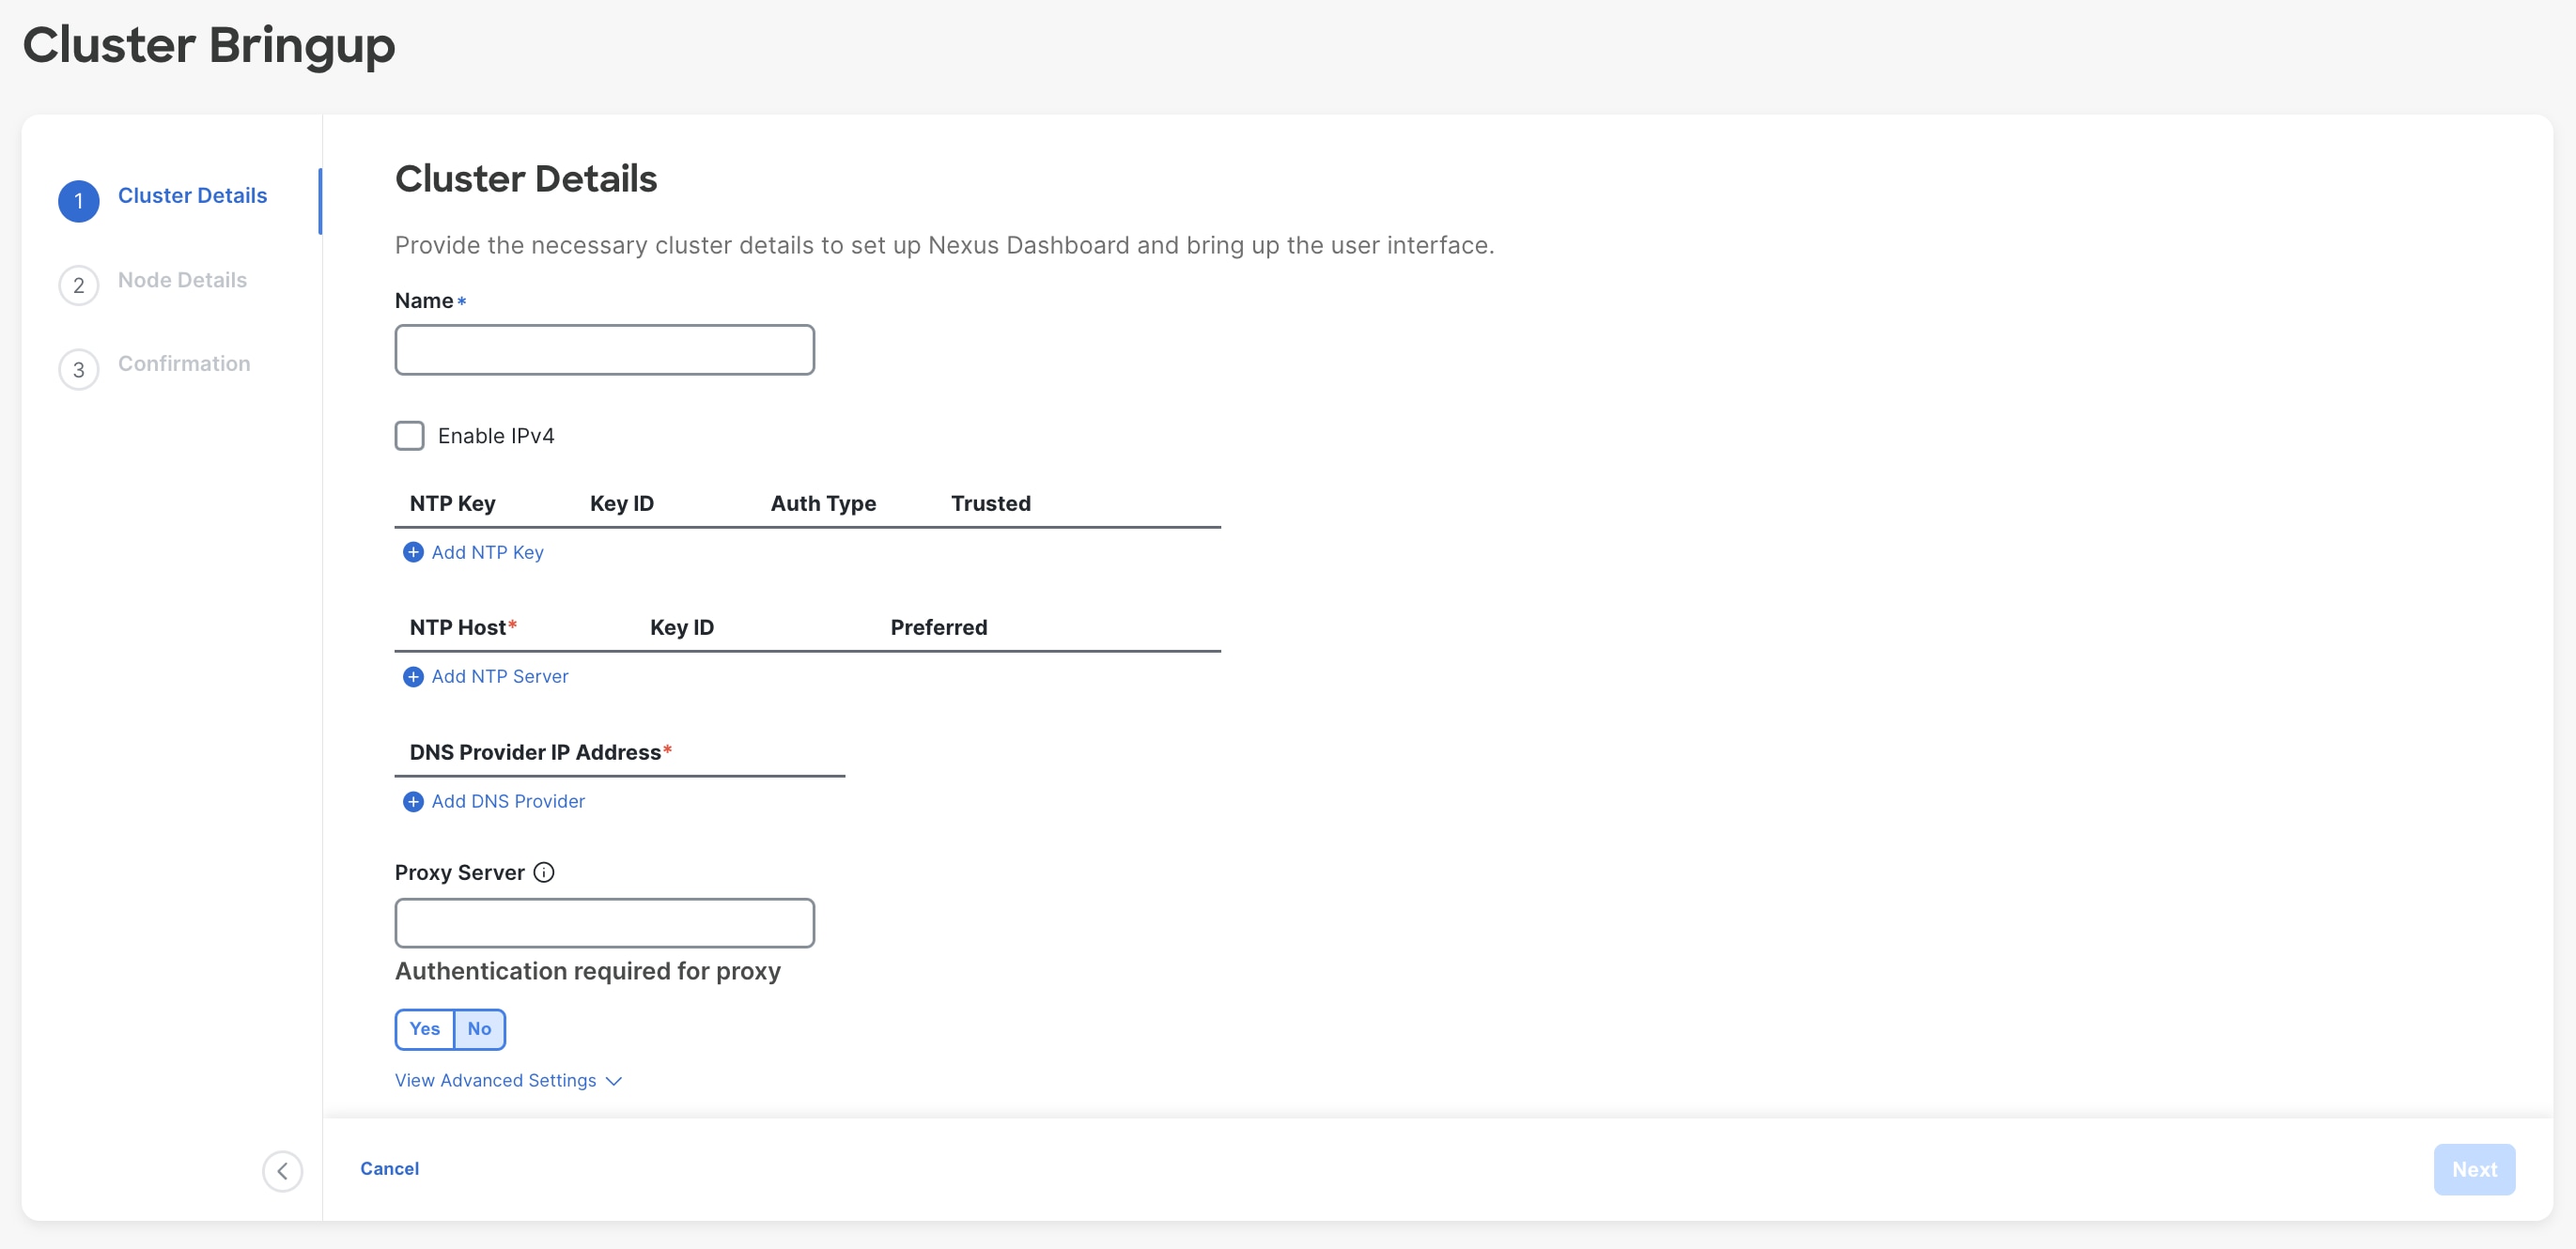
Figure 18: Nexus Dashboard Web Installer– Cluster Details UI.
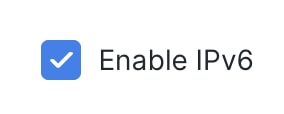
o In the above environment, the initial management IPs were IPv6 addresses—therefore, you have the option to “Enable IPv4” (which would create a dual-stack environment).
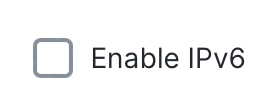
§ Note: if your initial configuration was in IPv4, you have the option to “Enable IPv6” for dual-stack.
o To skip proxy server configuration, click the encircled “i” icon next to “Proxy server” and select “skip.” A warning comes up that you can either “confirm” or “cancel.”
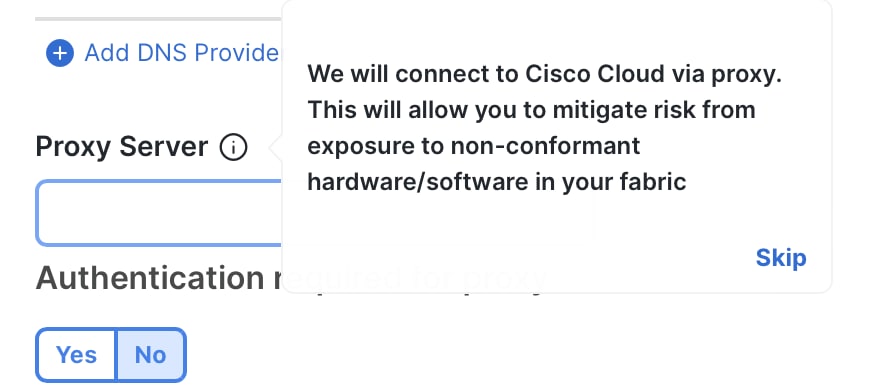
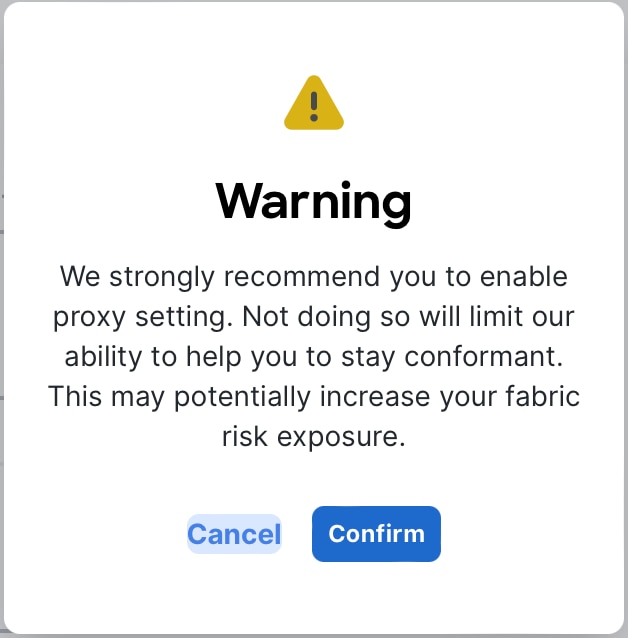
§ Note: It is best practice to configure a proxy, if one is available.
Pure IPv4
To deploy a pure IPv4 NDFC configuration, use IPv4 management addresses in the initial Nexus Dashboard node creation process.
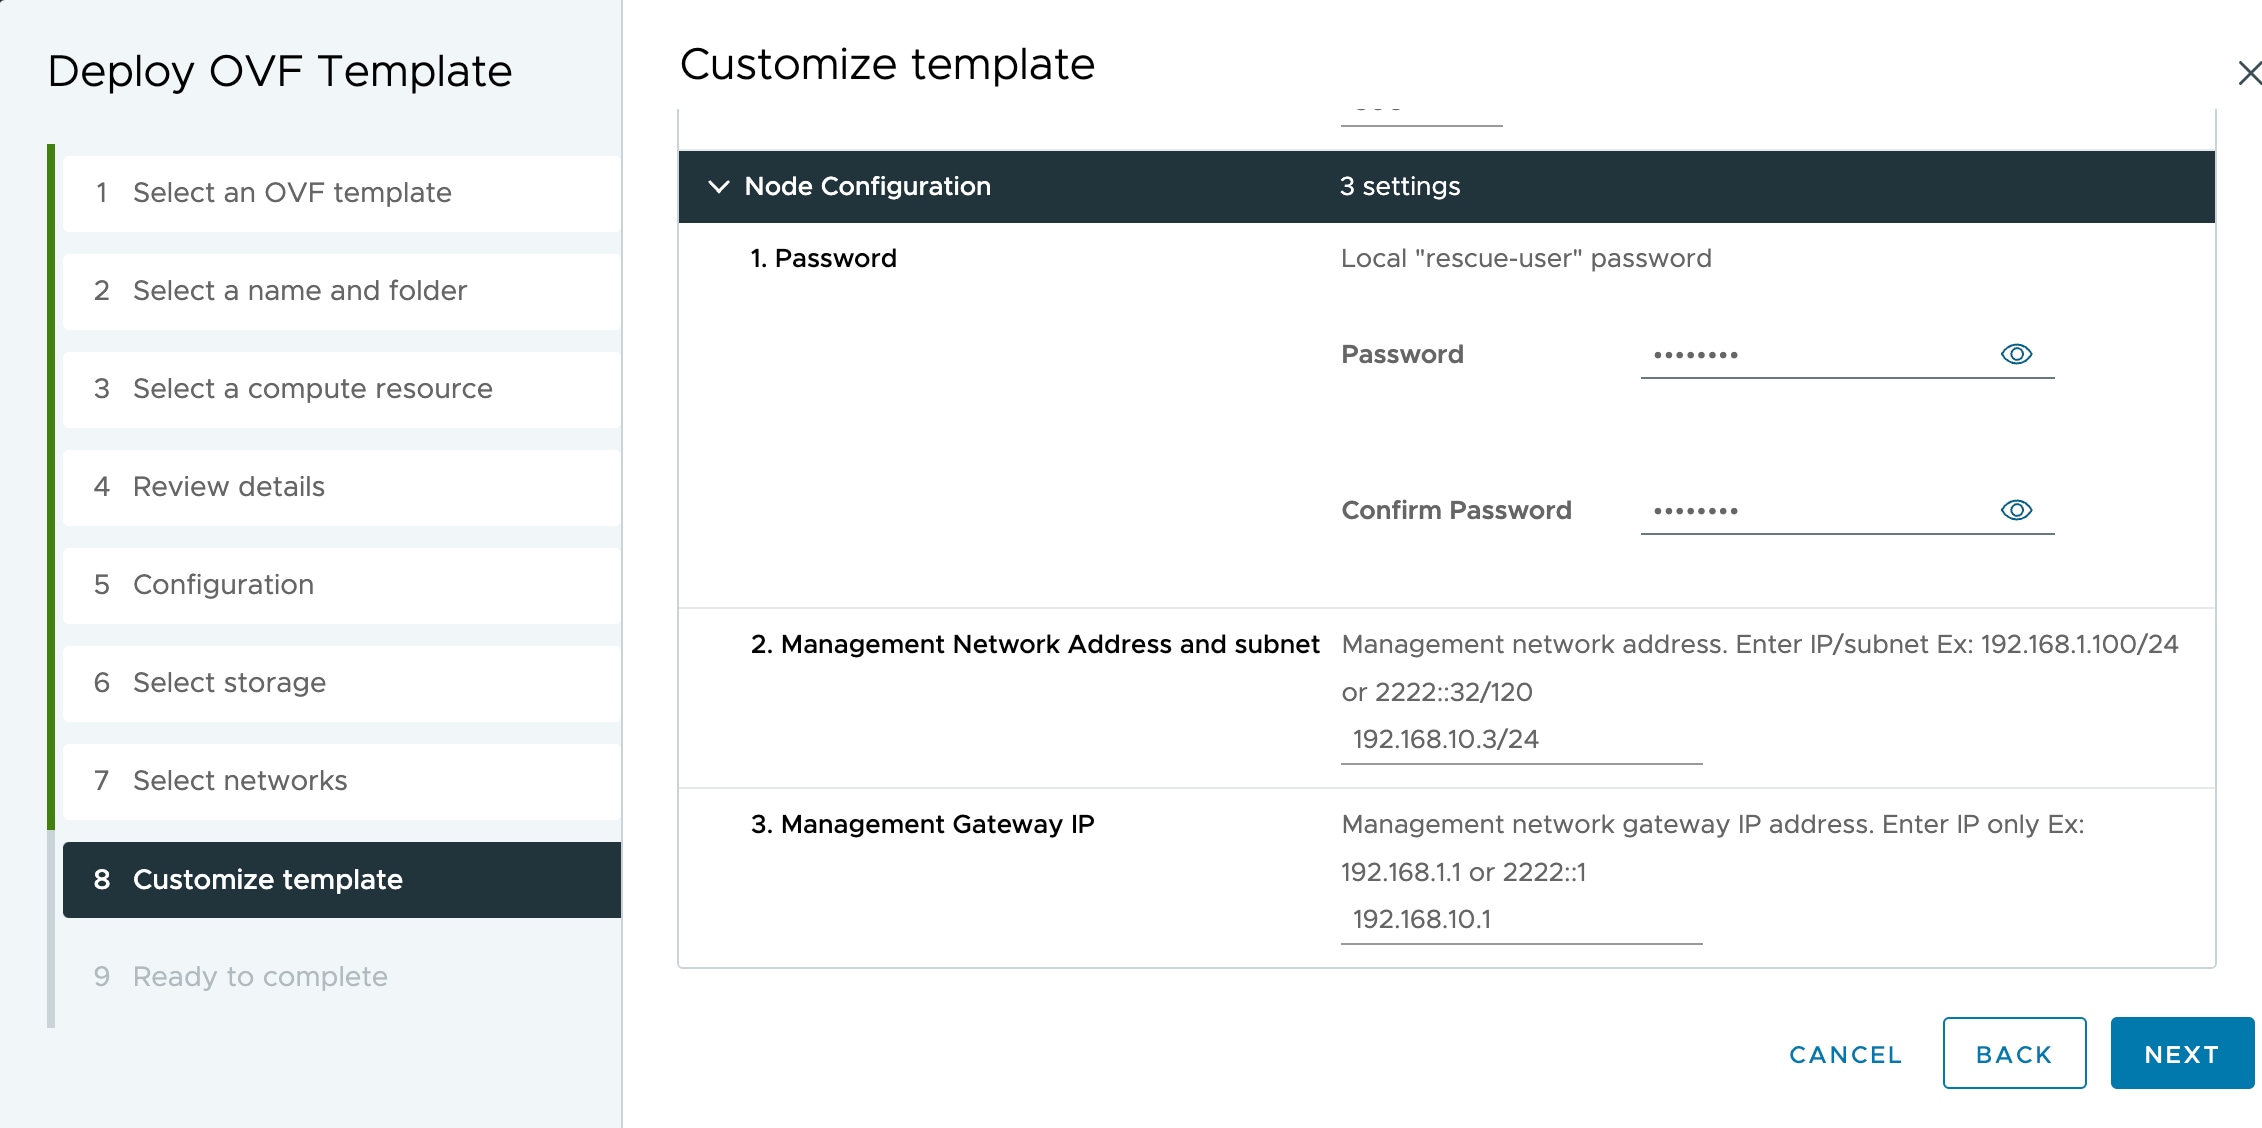
Figure 19: Nexus Dashboard vND IPv4 Deployment.
Then, when you access the Cluster Bringup section, do not check “Enable IPv6.” Instead, for a 3-node cluster, follow these steps:
● Input the NTP, DNS, and proxy information as described in the previous section. Do not enable IPv6. Click “Next.” NTP and DNS addresses should be IPv4.
● Configure the Nexus Dashboard data interface of your ND node by clicking the “Edit” (pen icon) button.
● Enter the Nexus Dashboard data network and default gateway for IP access to NDFC in-band management.
o If connected via a trunk interface, also include the VLAN ID.
o 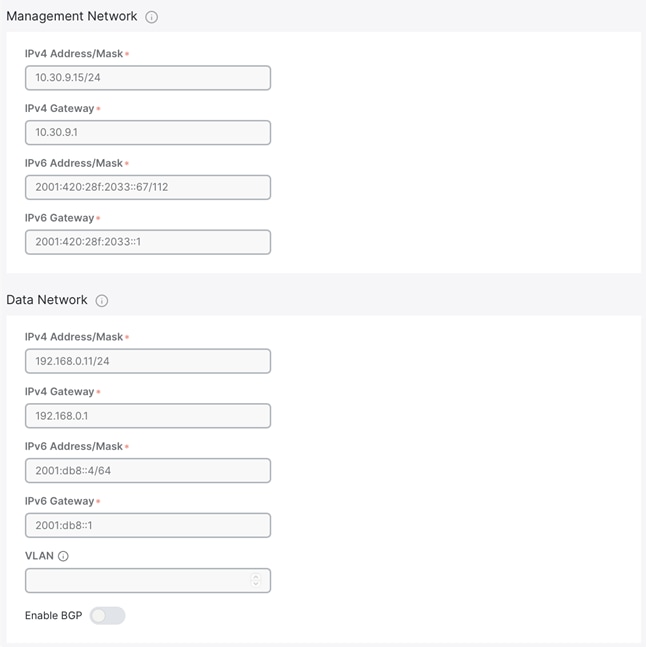
o
Figure 20: Nexus Dashboard Web Installer– Data Network UI in Cluster Details.
● Input the other nodes in the fabric (if configuring a 3-node):
o Select the “Add Node” option.
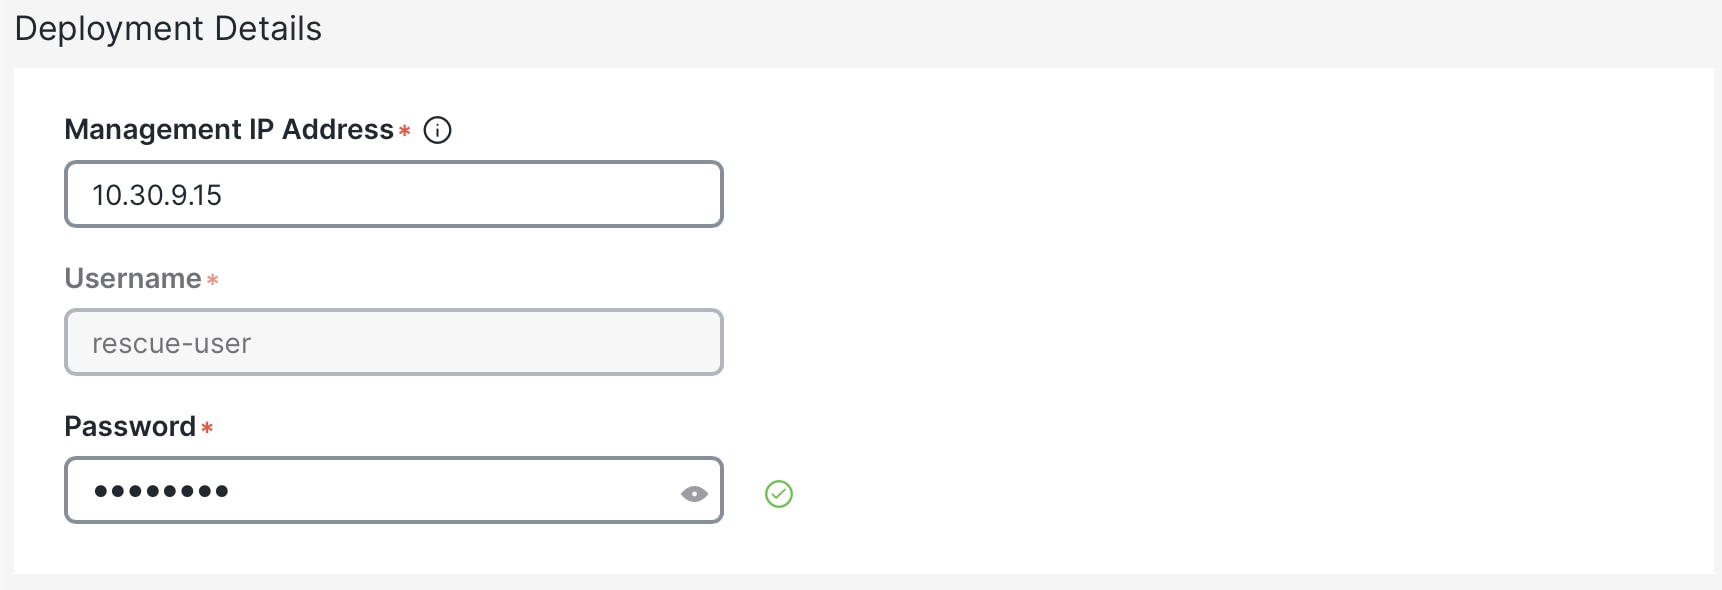
o Under “Deployment Details,” input the management IP address and password that you configured when initially deploying node 2 of your 3-node cluster. Validate the information.
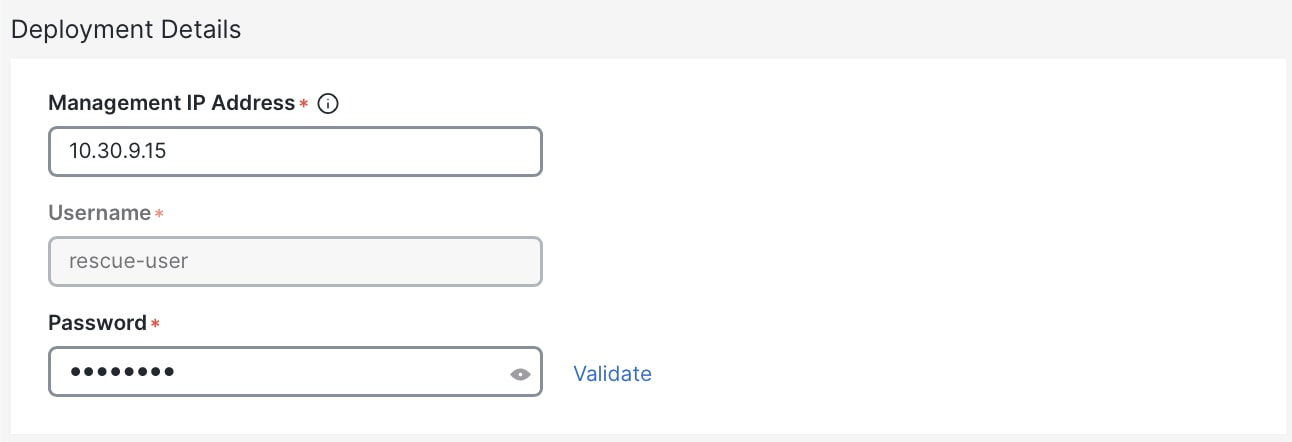
o If the information is validated, a green checkmark appears in place of “validate,” and the management network IP/mask and default gateway you configured are imported directly.
o Add the data network IP/mask and gateway, as with the previous node.
o Repeat the above steps for node 3.
o When all nodes have been added (as in the sample screenshot below), click “Next” to review the information and “Configure” to start the bootstrap.
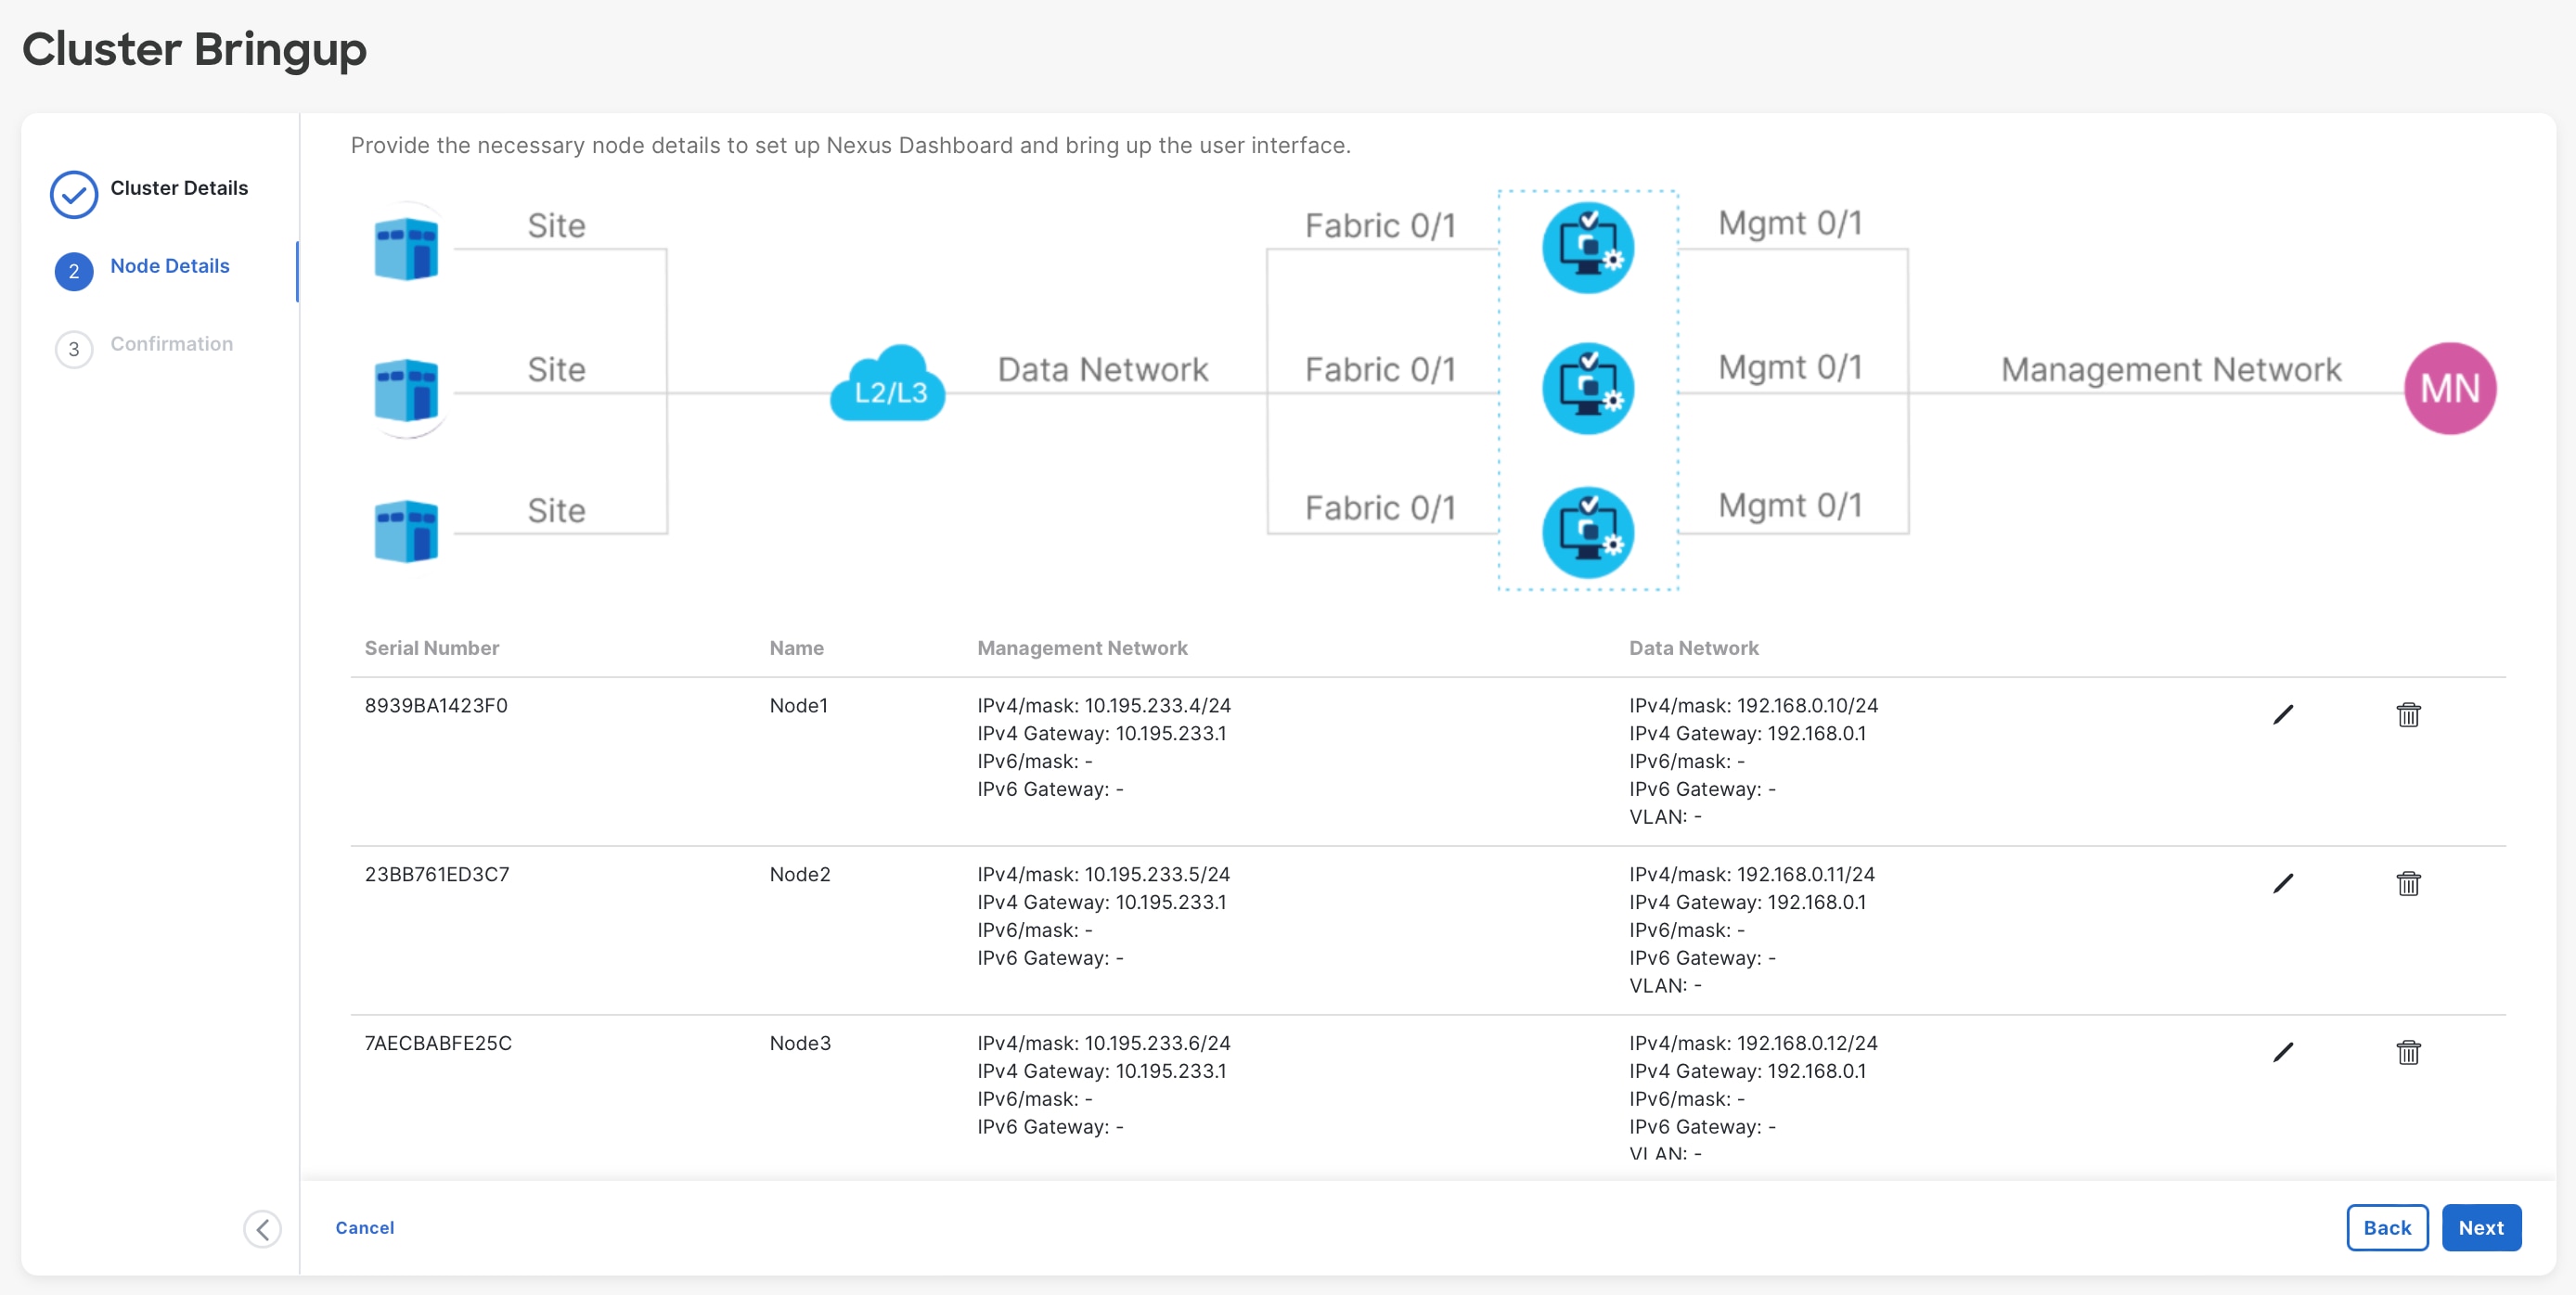
Figure 21: Nexus Dashboard Web Installer– 3-Node Cluster.
Dual-Stack
Dual-stack means that both IPv4-based and IPv6-based fabrics are supported in the network. This can be enabled on both pND and vND. All core services including authentication domains, DNS, NTP, and PTP are usable in dual-stack mode.
As mentioned above, note that dual-stack cannot be implemented through an upgrade. If your environment has either a pure IPv4 or pure IPv6 configuration already deployed, you will have to do a clean install and enable both deployment models during the initial cluster configuration.
During initial node bring-up, you can configure either IPv4 or IPv6 addresses for the nodes’ management network, but you MUST provide both types of IPs during the cluster bootstrap workflow. Mixed configurations, such as an IPv4 data network and dual-stack management network, are not supported.
· Note: regardless of whether you choose to initially provide an IPv4 or IPv6 management IP address, you will use this address to access the cluster bootstrap workflow. Once the system has bootstrapped, Nexus Dashboard will be accessible through both the IPv4 and/or IPv6 management IP address(es).
Full configuration steps are below, assuming an initial IPv4 setup and an “Enable IPv6” selection option:
● Input the NTP, DNS, and proxy info as described in the previous section. NTP and DNS addresses can be either IPv4 or IPv6.
● Click “Enable IPv6” (or “Enable IPv4,” if your initial configuration was in IPv6) to deploy as dual stack. The wording for this option will depend on what kind of address you used for the initial management IP(s).
● Configure the Nexus Dashboard data interface by clicking the “Edit” (pen icon) button.
● Under “Management Network,” input the required IPv4 and IPv6 address/masks and default gateways.
● Under “Data Network,” input the required IPv4 and IPv6 address/masks and default gateways.
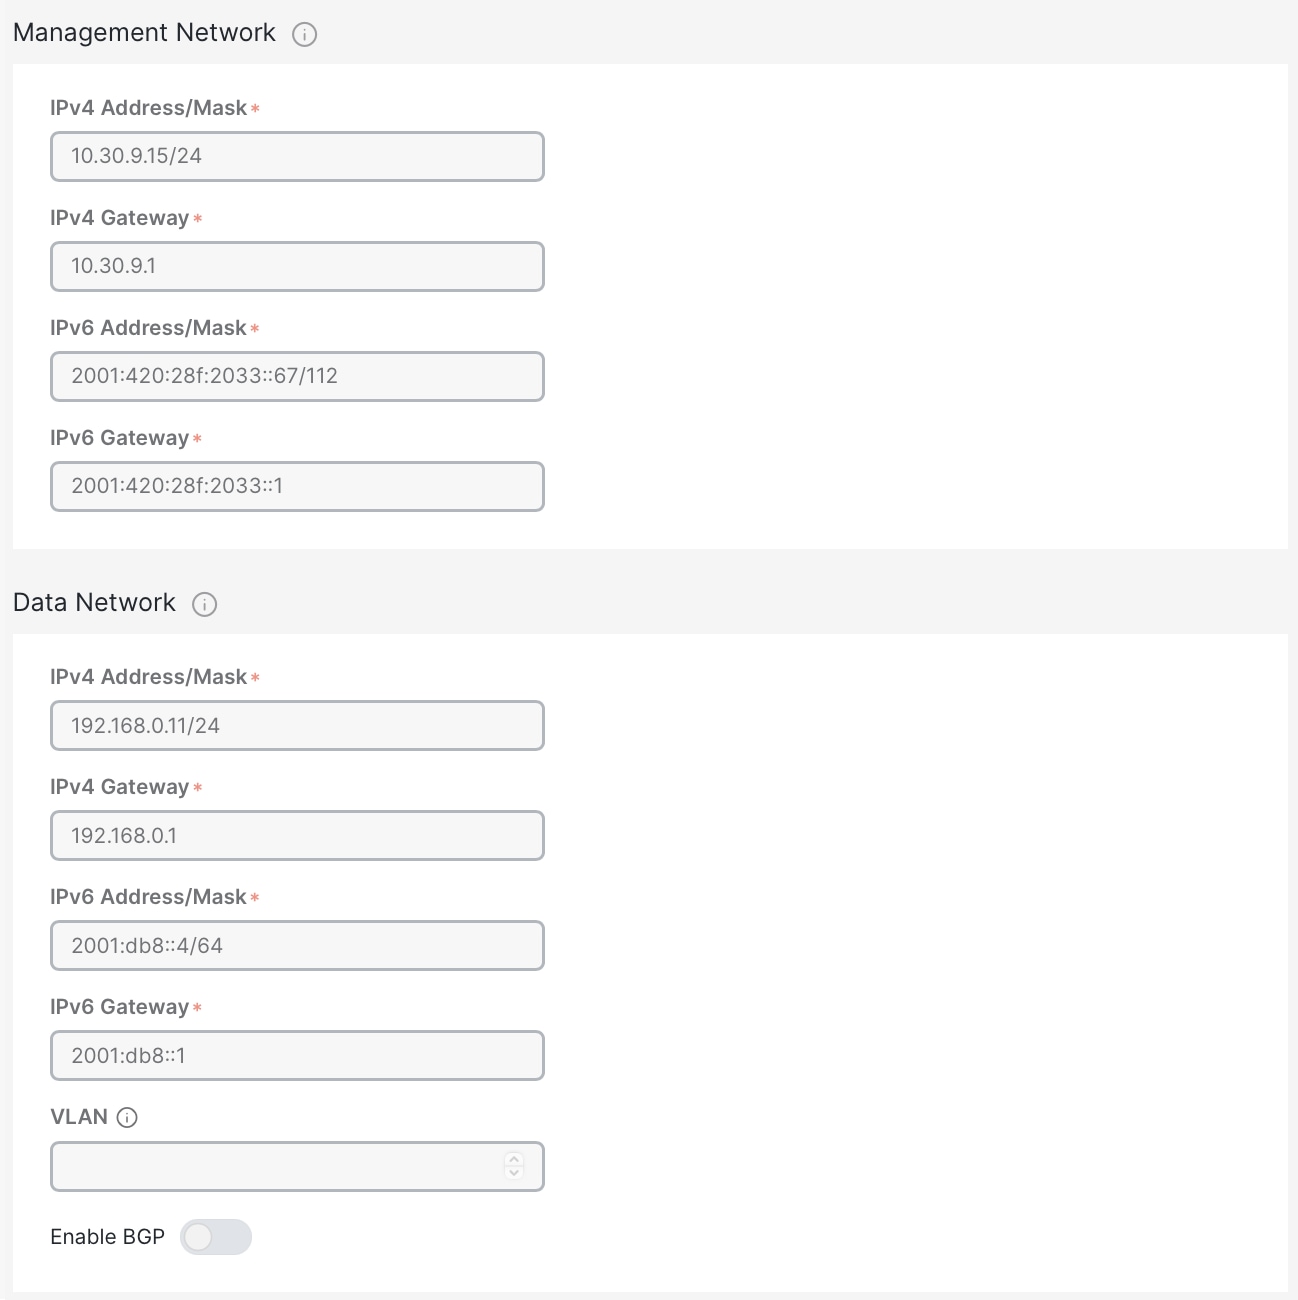
◦ If connected via a trunk interface, also include the VLAN ID.
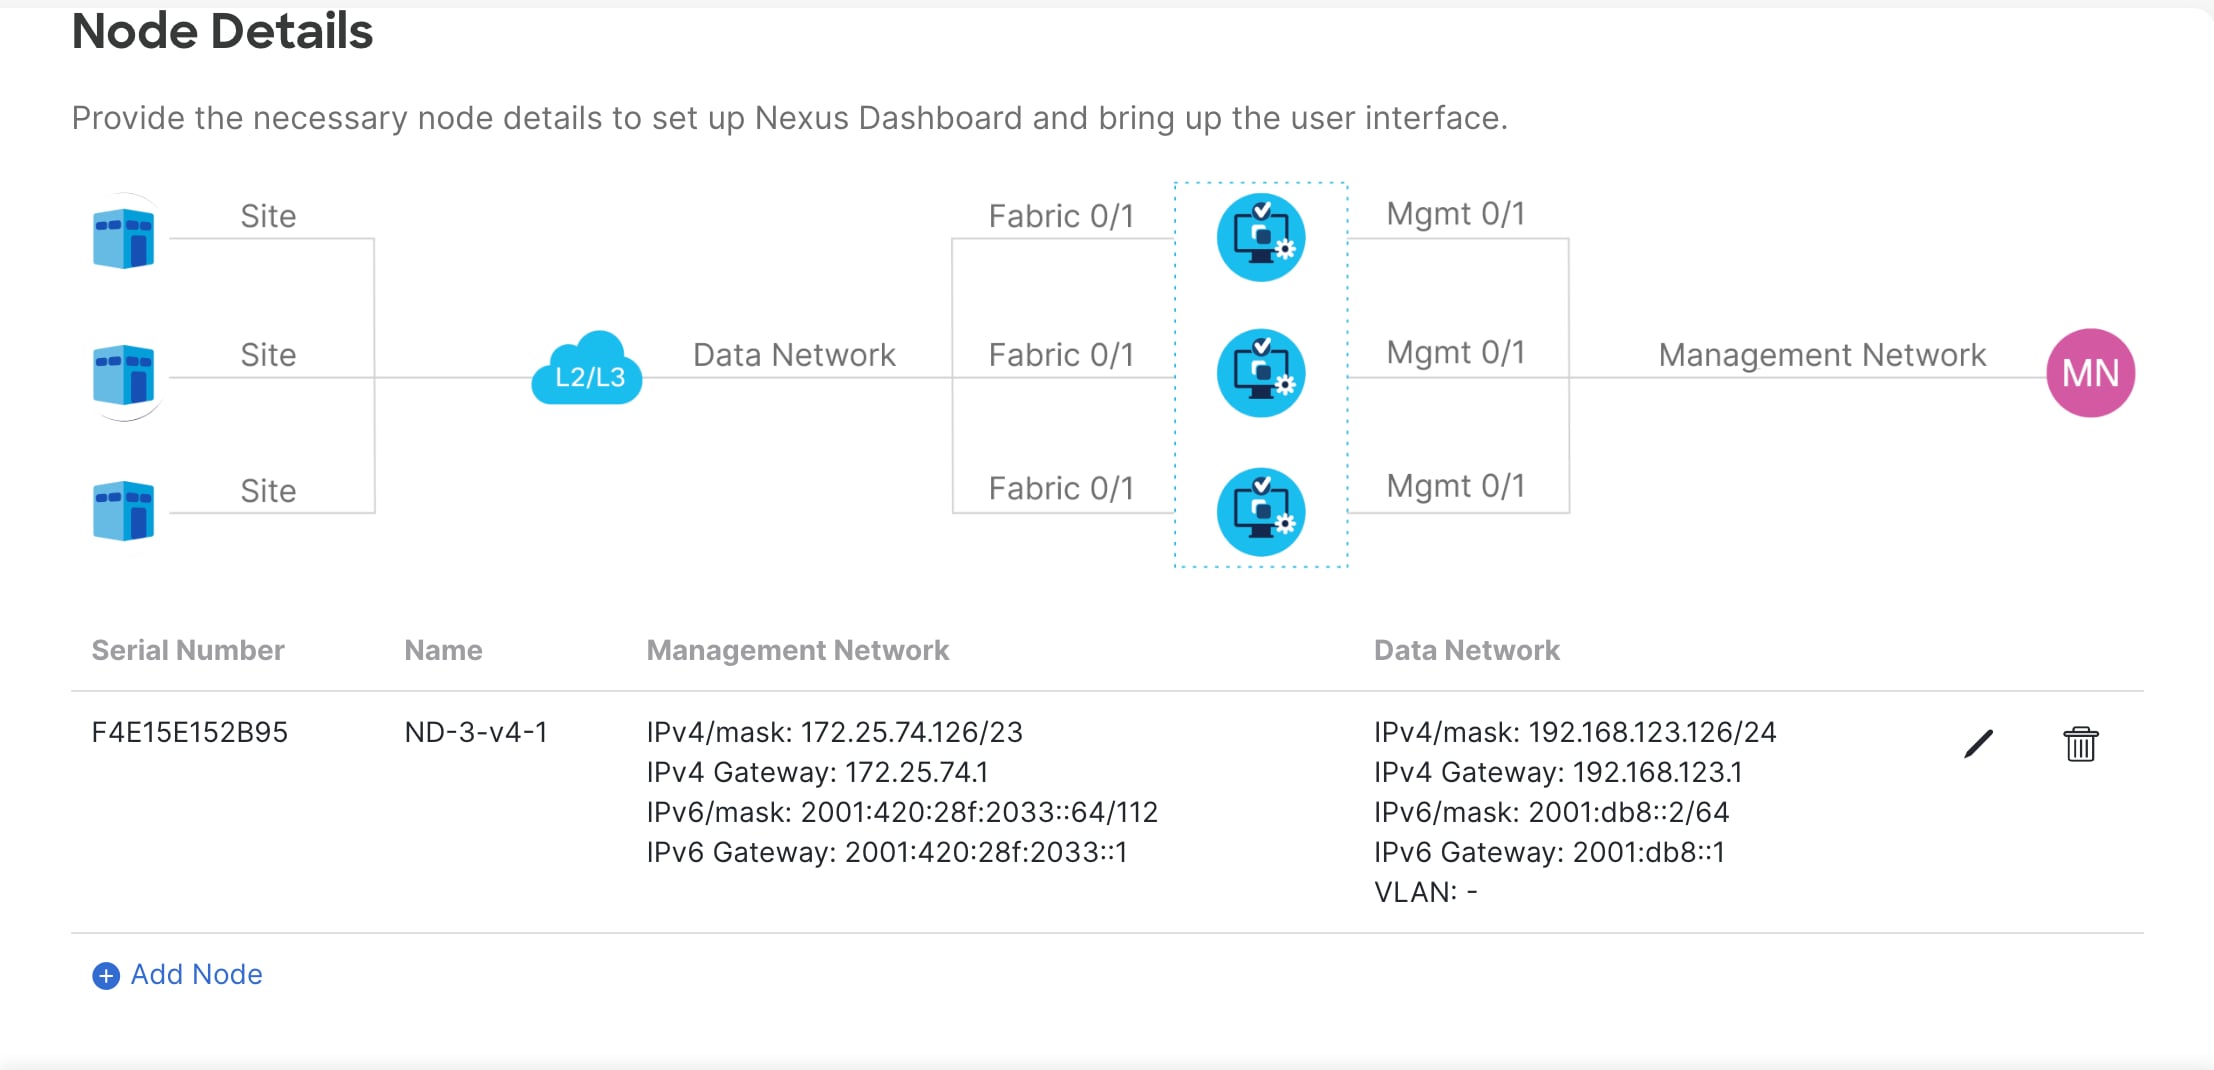
Figure 22: Nexus Dashboard Web Installer– Dual-Stack 1-Node Cluster.
● Input the other fabric nodes, using the same steps as above with the following additions:
o Select the “Add Node” option.
o Under “deployment details,” use the management IP address and password you configured when initially deploying node 2 of your 3-node cluster. Validate this information.
o After the management IP has been auto-populated, input the IPv6 address/mask and default gateway.
o Under “Data Network,” input both an IPv4 and IPv6 address/mask and default gateways.
o Repeat the above steps for node 3.
o When all nodes have been added, click “Next” to review the information and “Configure” to start the bootstrap.
Note: if you make a mistake during your initial configuration, you must re-validate the management IP and password. Click the “Edit” (pen icon) button on the node that you want to amend, input the management IP and password, and re-validate for full edit access.
Note: you can only deploy Nexus Dashboard as a 1- or 3-node cluster. If you deploy two nodes, you cannot proceed with the install until you either add or delete one. 
Figure 23: Incomplete Nexus Dashboard Cluster Bringup.
Pure IPv6
IPv6 deployments are supported on physical and virtual form-factors. When initially configuring the node(s), IPv6 management IP address(es) (and default gateway(s)) must be supplied. Once the nodes are up, these are the addresses that are used to log into the UI and continue the cluster bootstrap process. IPv6 addresses are also required for the data network and gateway, as well as NTP and DNS.
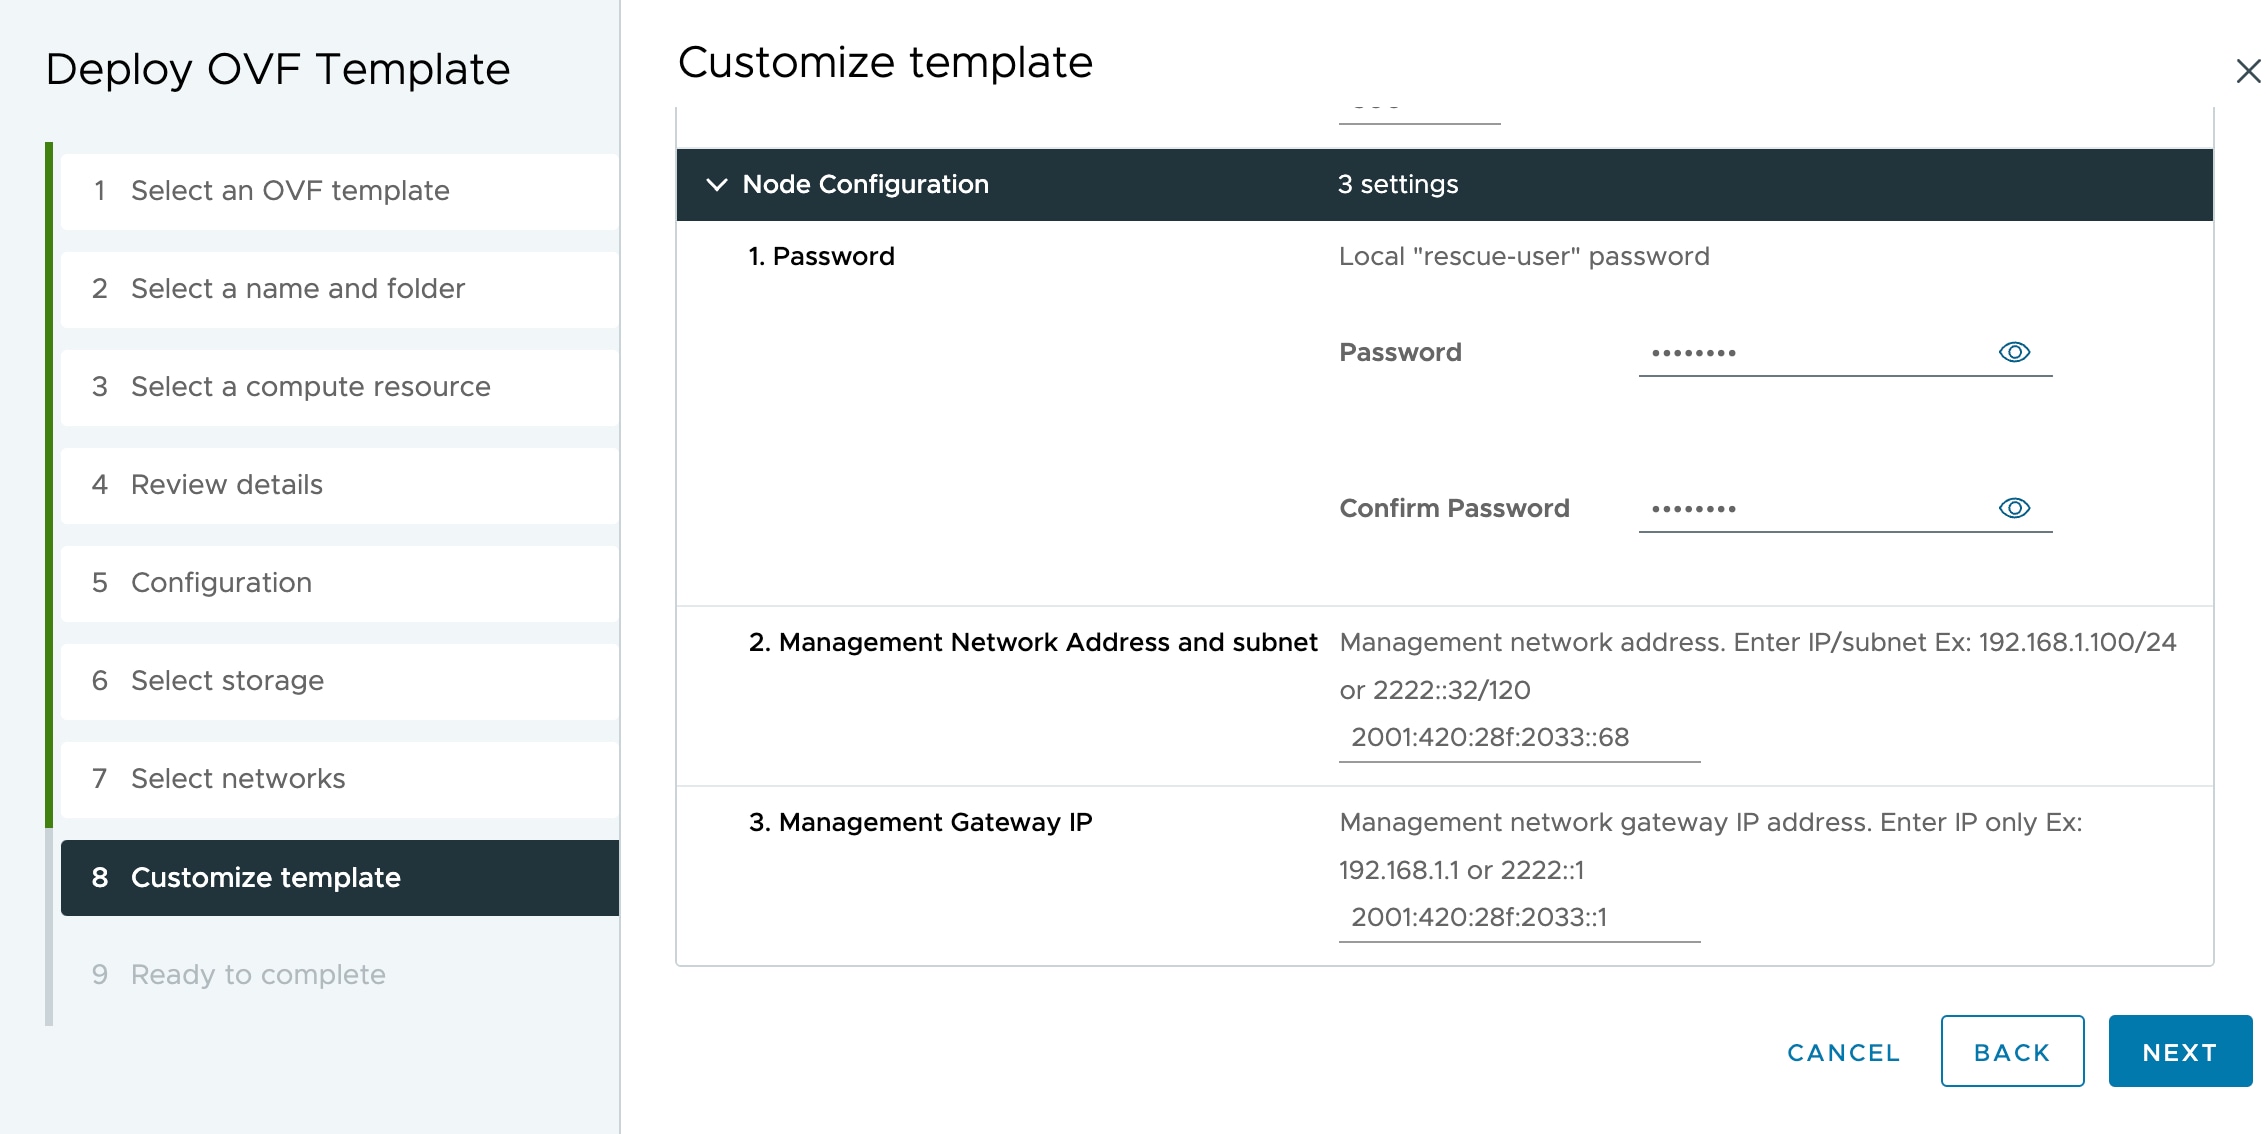
Figure 24: Nexus Dashboard vND IPv6 Deployment.
Note that during the cluster bootstrap process, you will see an option to enable IPv4—if you select to do so, your configuration will be dual-stack. If you do not enable IPv4, the system works in pure IPv6 mode.
As mentioned above regarding dual-stack, once the ND cluster has been deployed, the operational mode cannot be changed. If you would like to enable dual-stack, a new cluster deployment is required.
Full configuration steps are below:
● Input the NTP, DNS, and proxy info as described in the previous section. NTP and DNS addresses should be IPv6. Do not enable IPv4.
● Configure the Nexus Dashboard data interface by clicking the “Edit” (pen icon) button.
● Under “Data Network,” input the IPv6 address/mask and default gateway.
o If connected via a trunk interface, also include the VLAN ID. 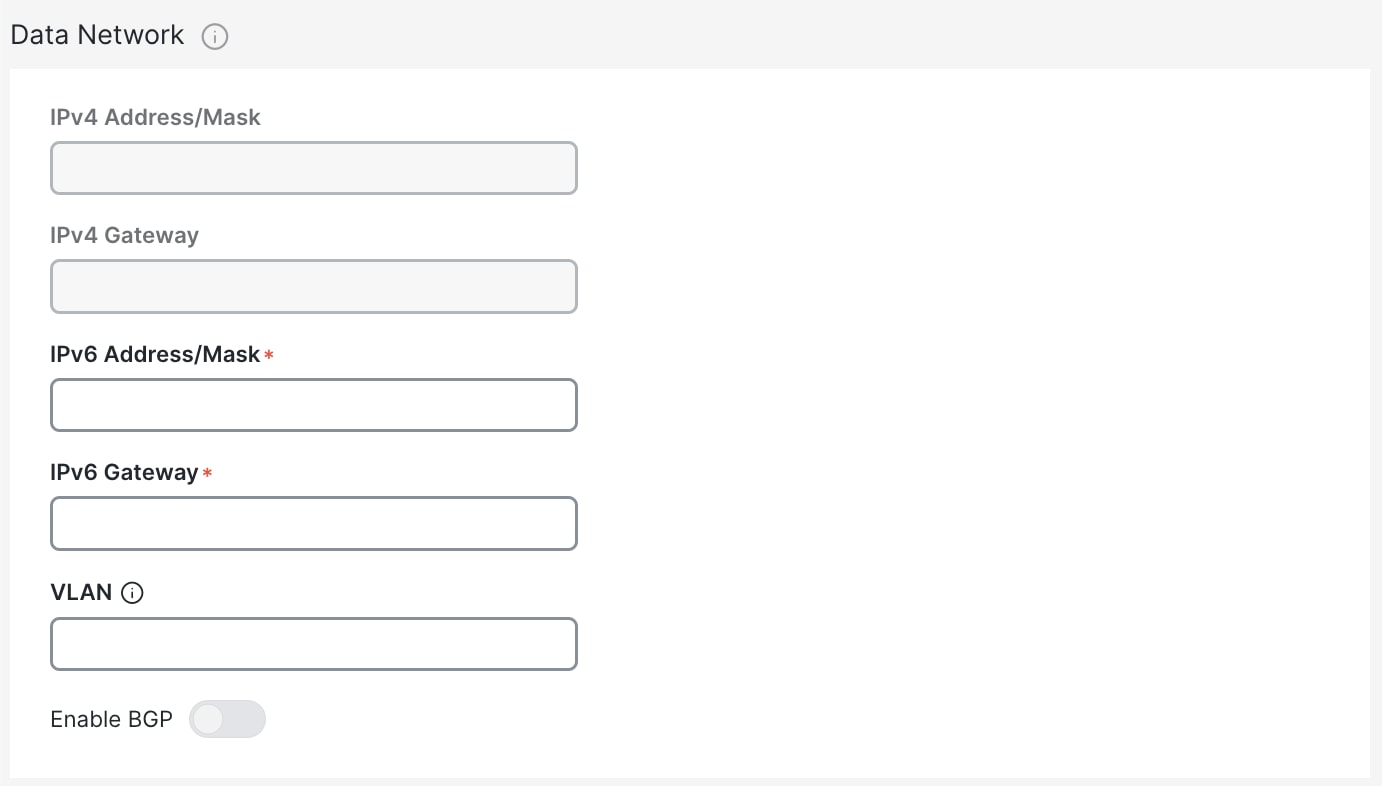
● Input the other fabric nodes, using the same steps as above with the following changes:
o Select the “Add Node” option.
o Under “deployment details,” use the management IP address and password that you configured when initially deploying node 2 of your 3-node cluster. Validate this information.
o If validated, the management network IP/mask and default gateway that you configured are imported directly.
o Under “Data Network,” input the IPv6 address/mask and default gateway, as with the previous node.
o Repeat the above steps for node 3.
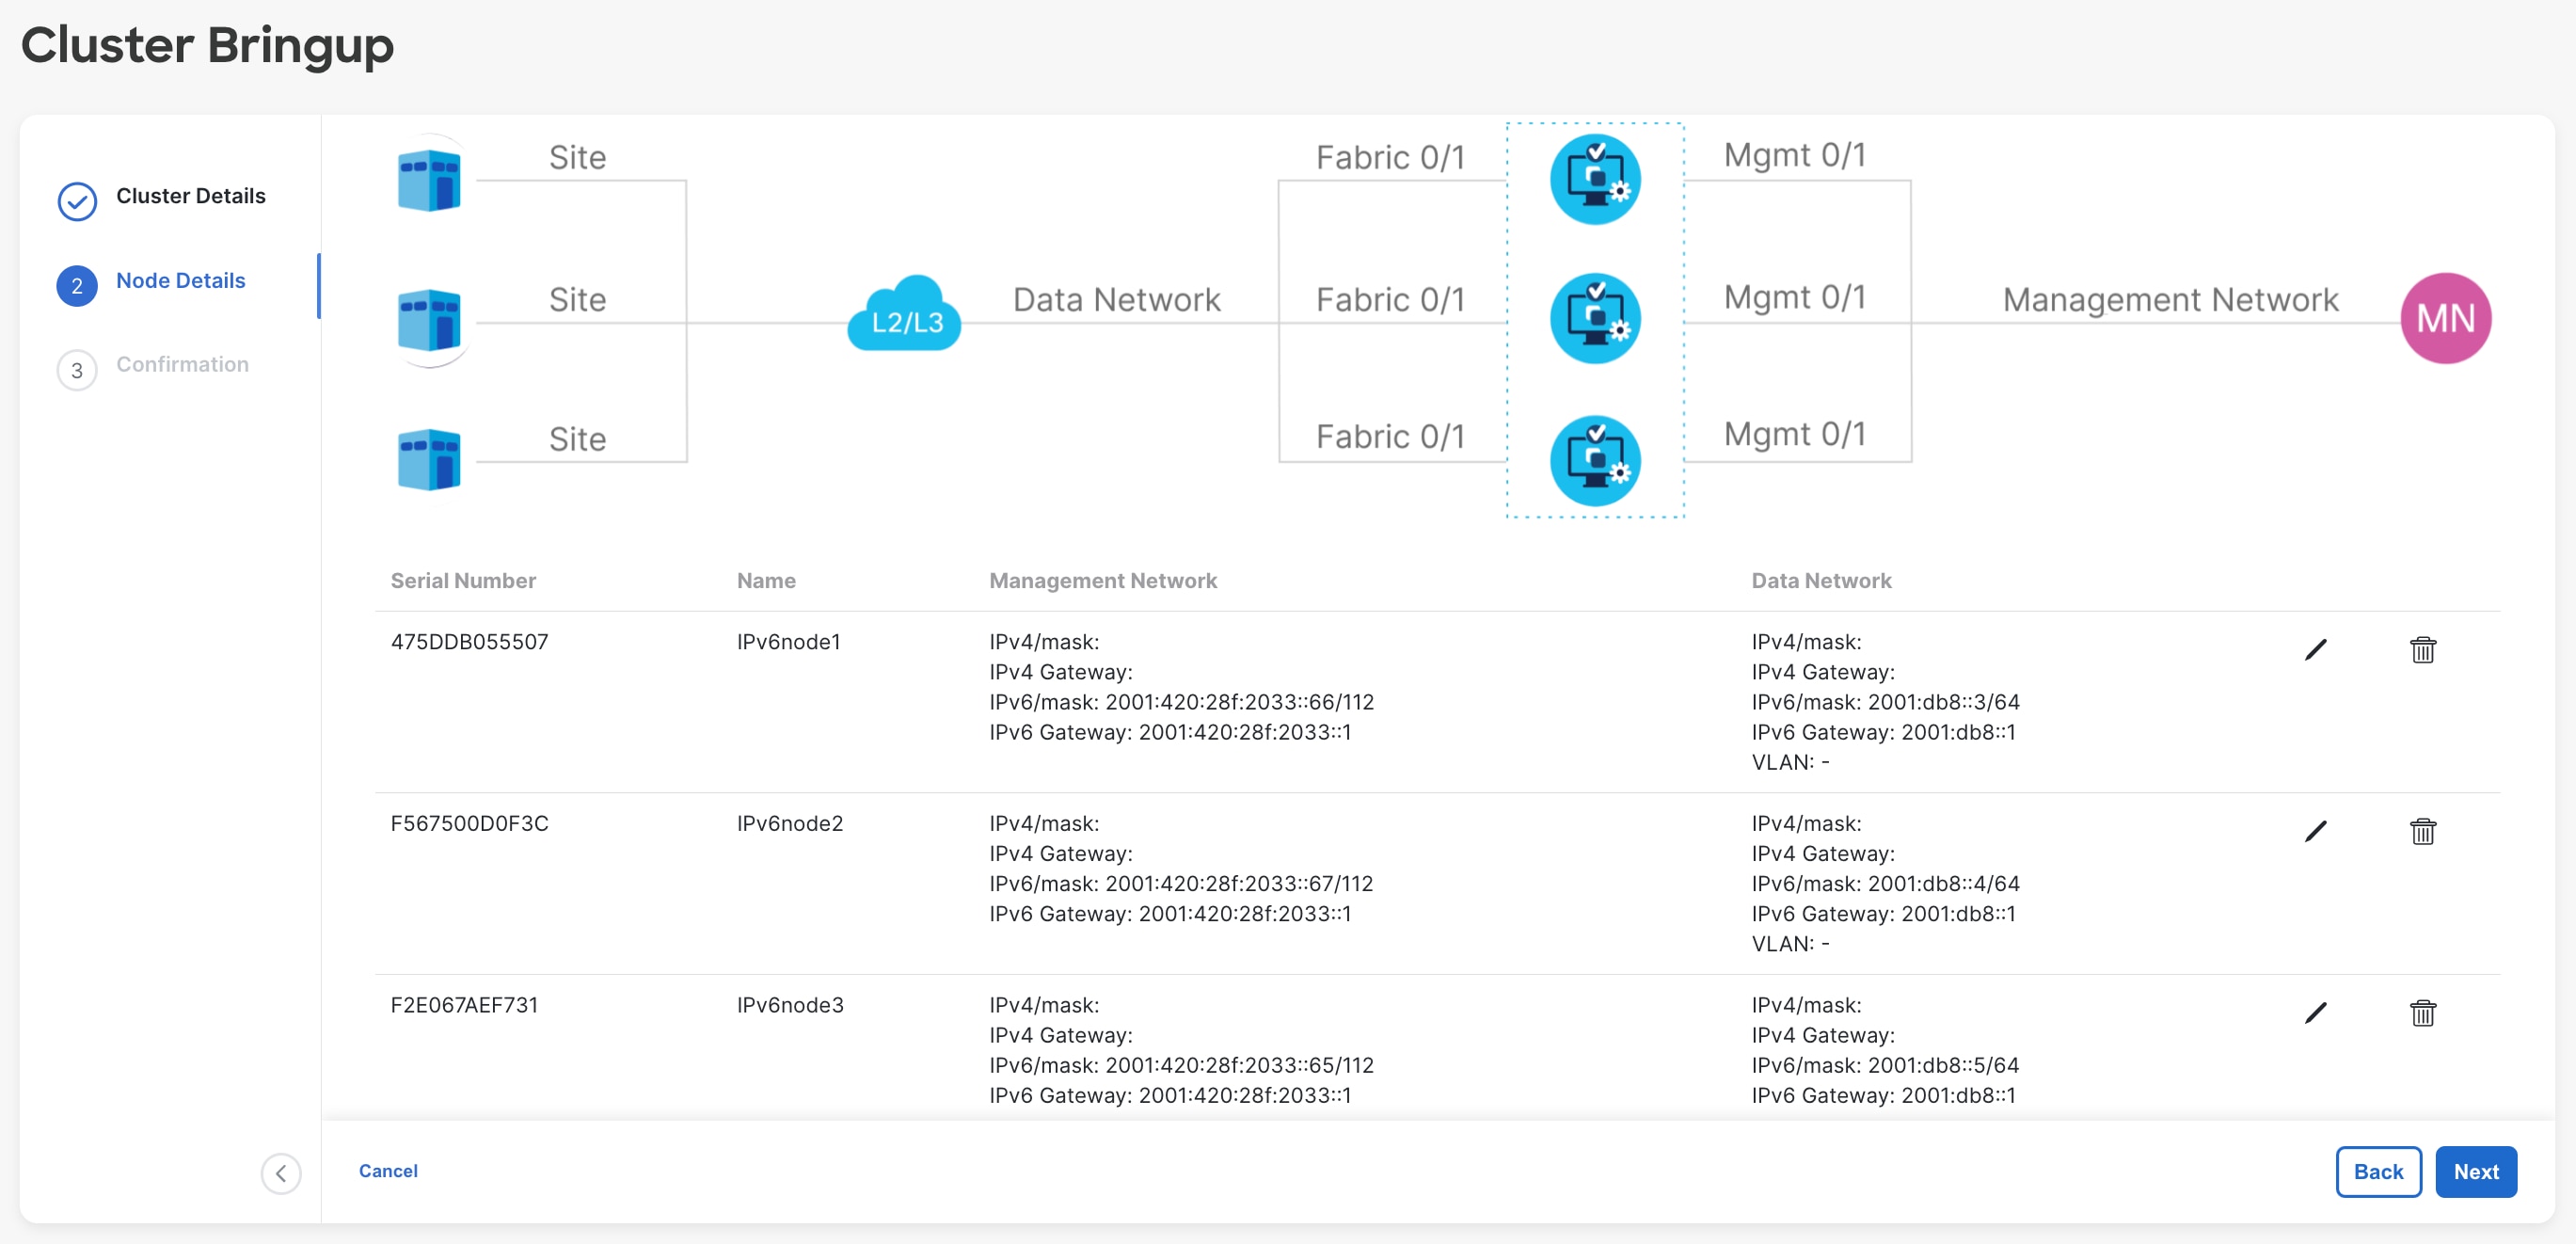
Figure 25: Nexus Dashboard Web Installer– IPv6 3-Node Cluster.
◦ When all nodes have been added (as in the sample screenshot above), click “Next” to review the information and “Configure” to start the bootstrap (as in the screenshot below).
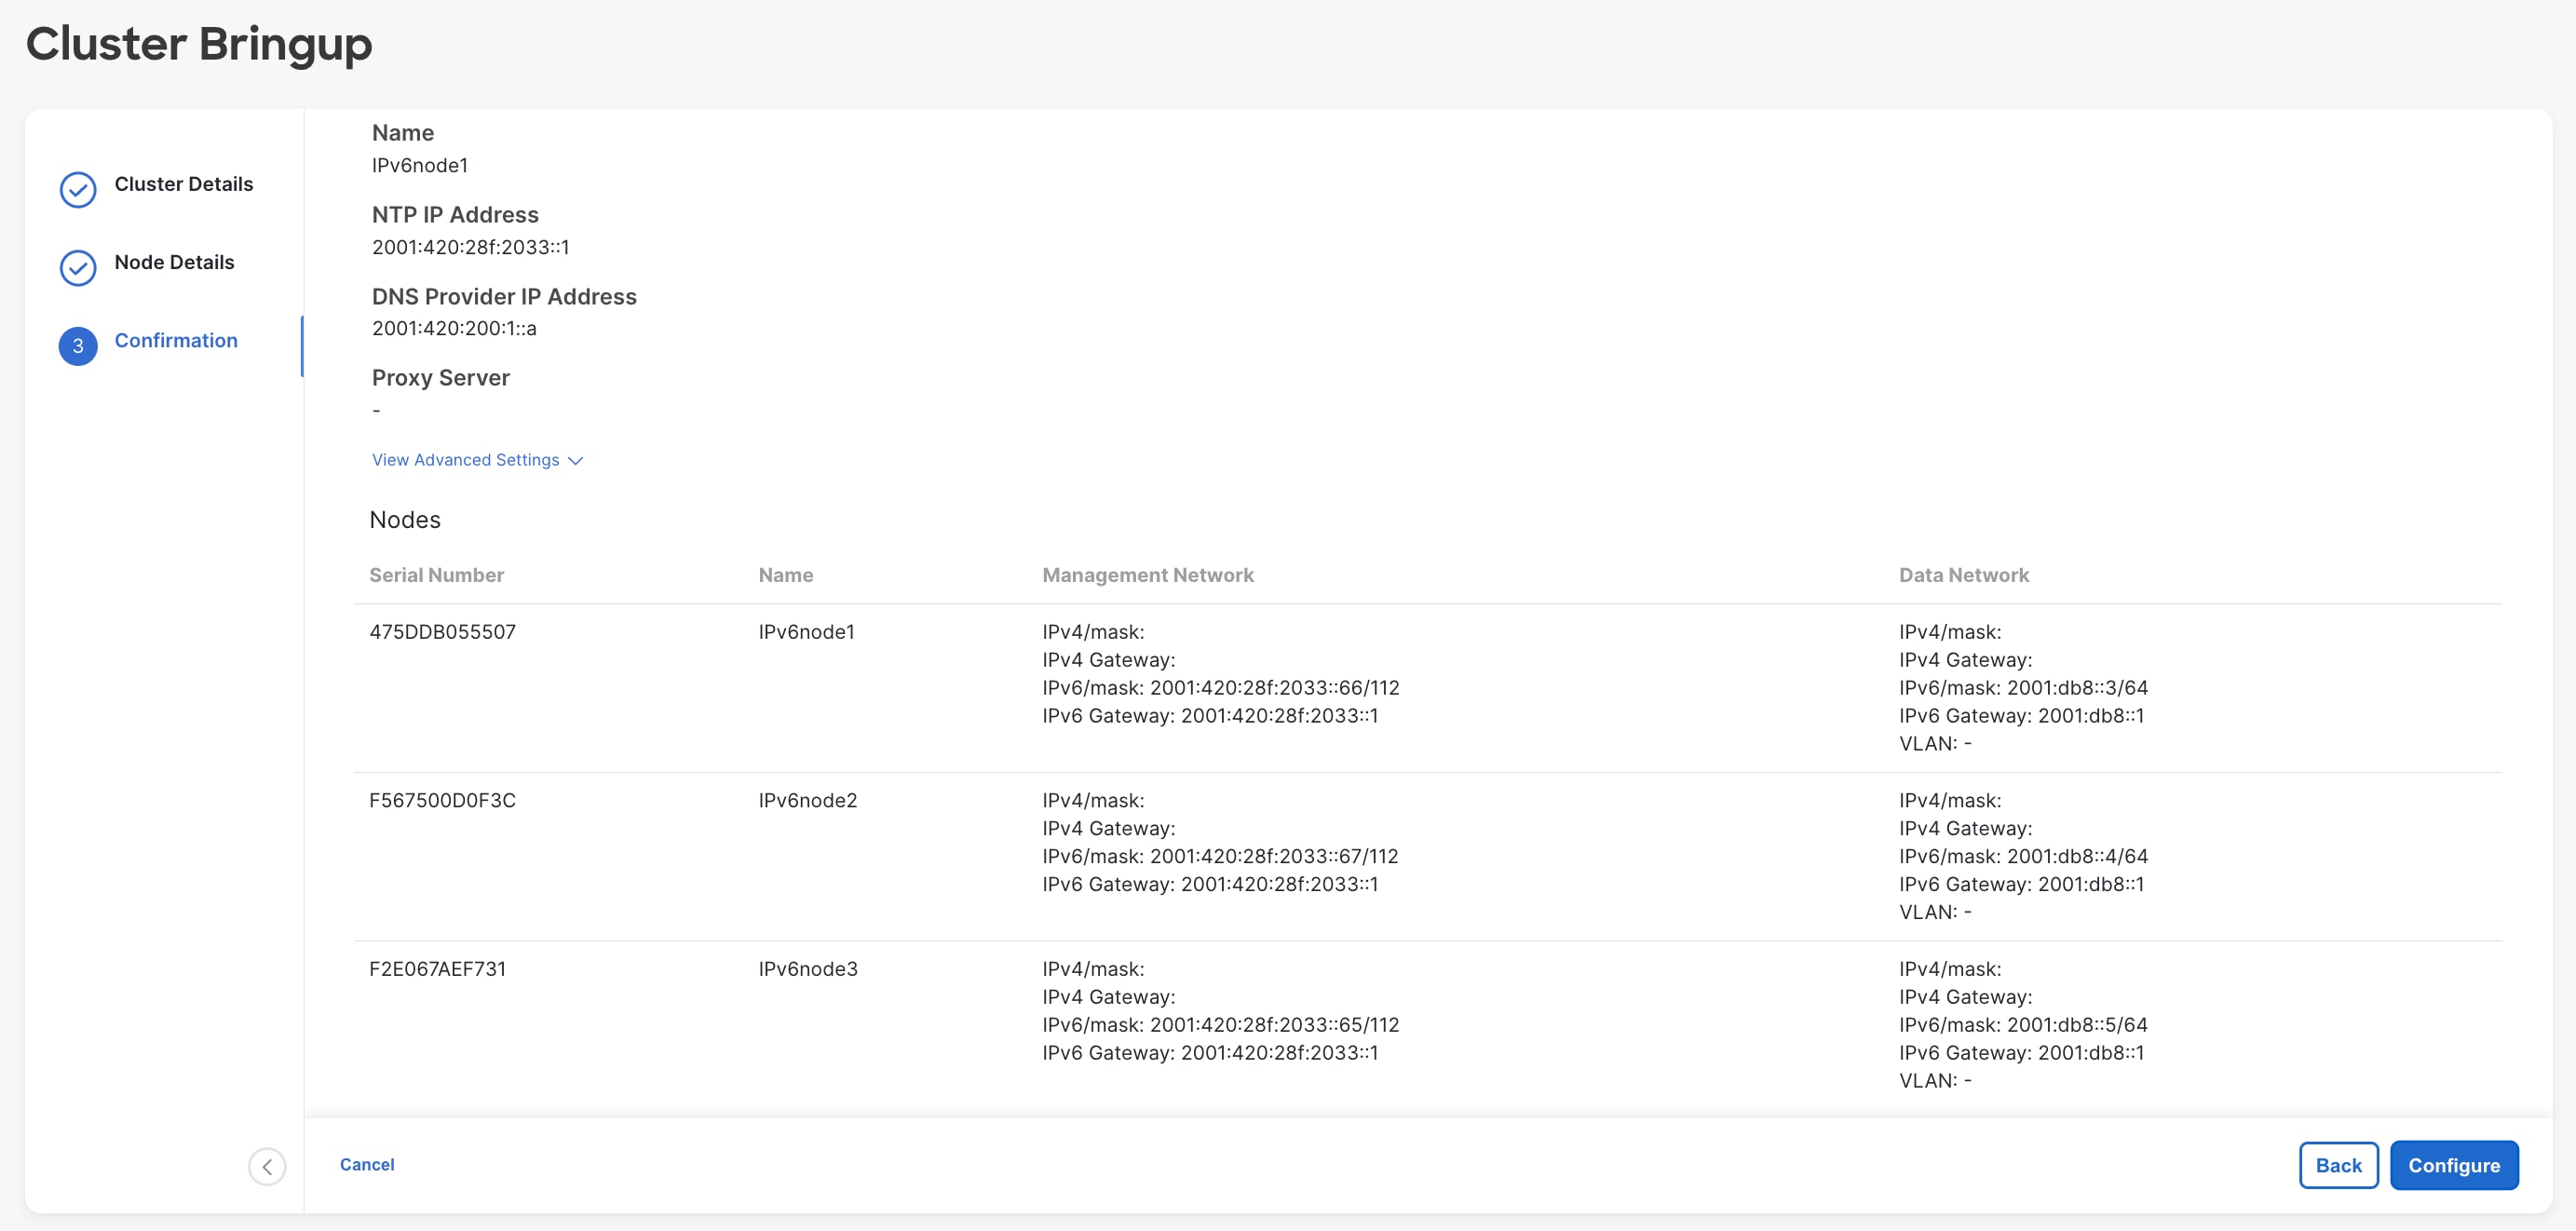
Figure 26: Nexus Dashboard Web Installer– IPv6 3-Node Cluster.
Installing NDFC on ND:
When you load Nexus Dashboard for the first time after bootstrapping, you see the “Journey: Getting Started” page. You have the option to install NDFC during step 5, “Manage Services.” Alternatively, you can navigate directly to this option by going to “Operate > Sites > App Store.”
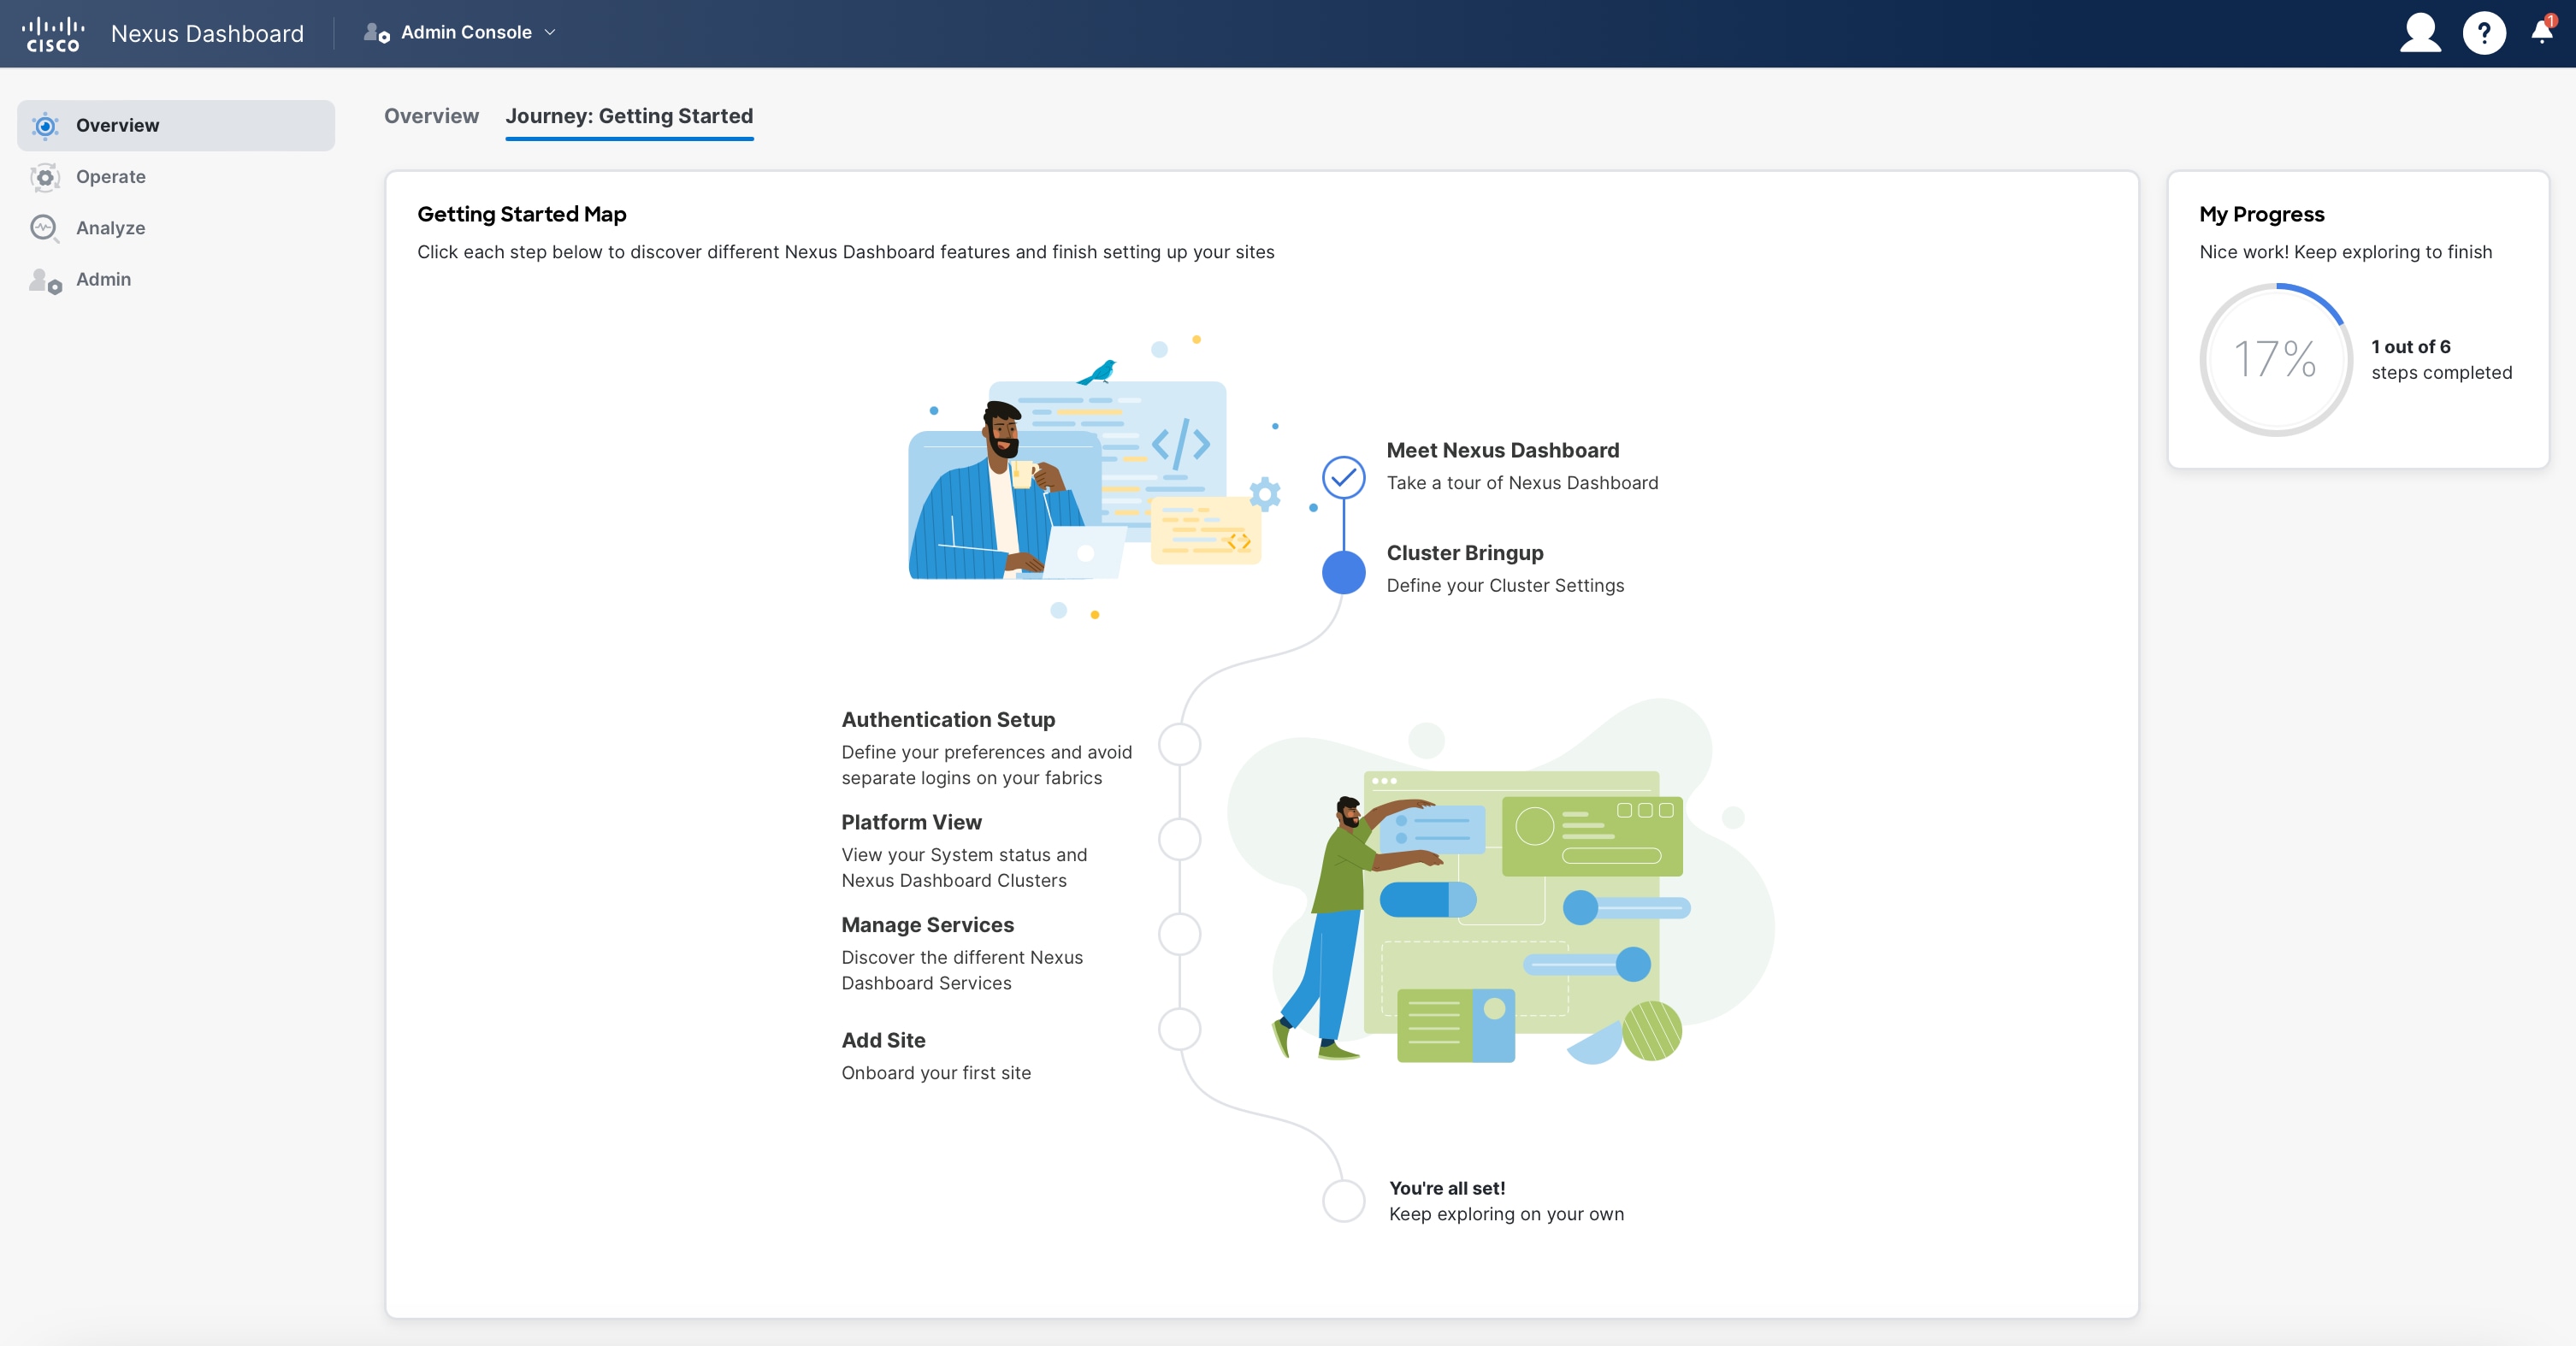
Figure 27: Nexus Dashboard Journey.
The App Store gives you six service options to install on top of your Nexus Dashboard cluster. When you click “Install,” a pop-up terms and conditions window comes up. Once you accept the terms and conditions, the download begins. 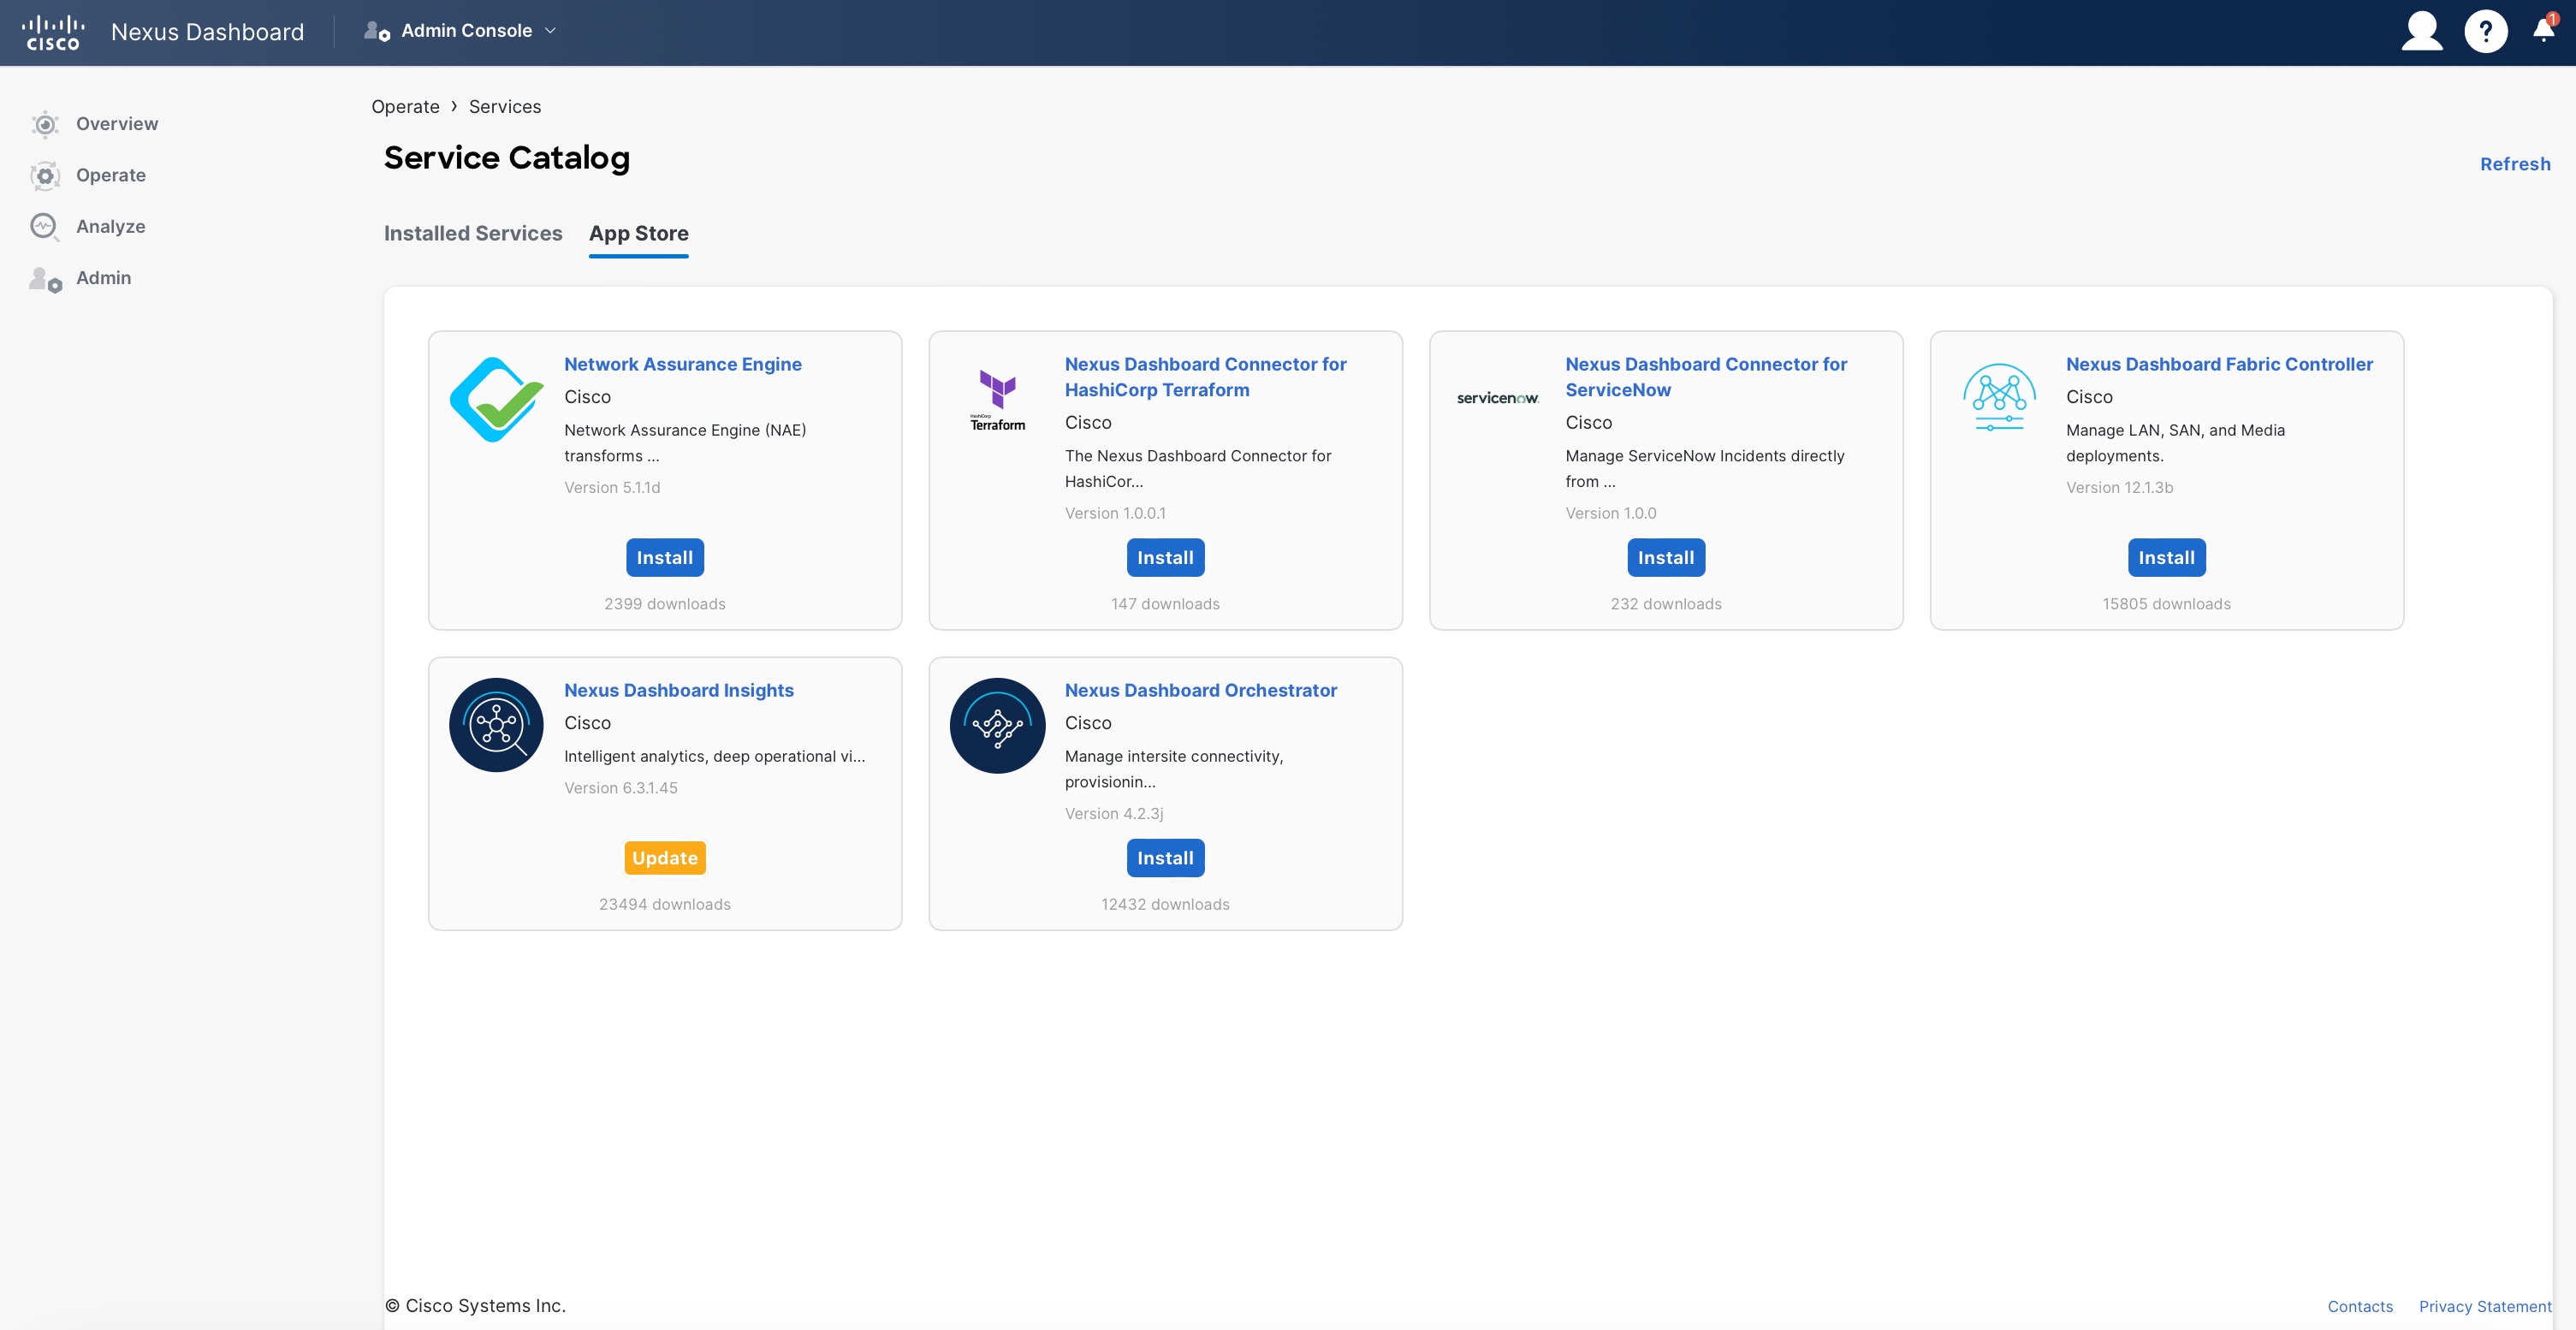
Figure 28: Nexus Dashboard Service Catalog.
You can track the progress of the download under the “Installed Services” tab.
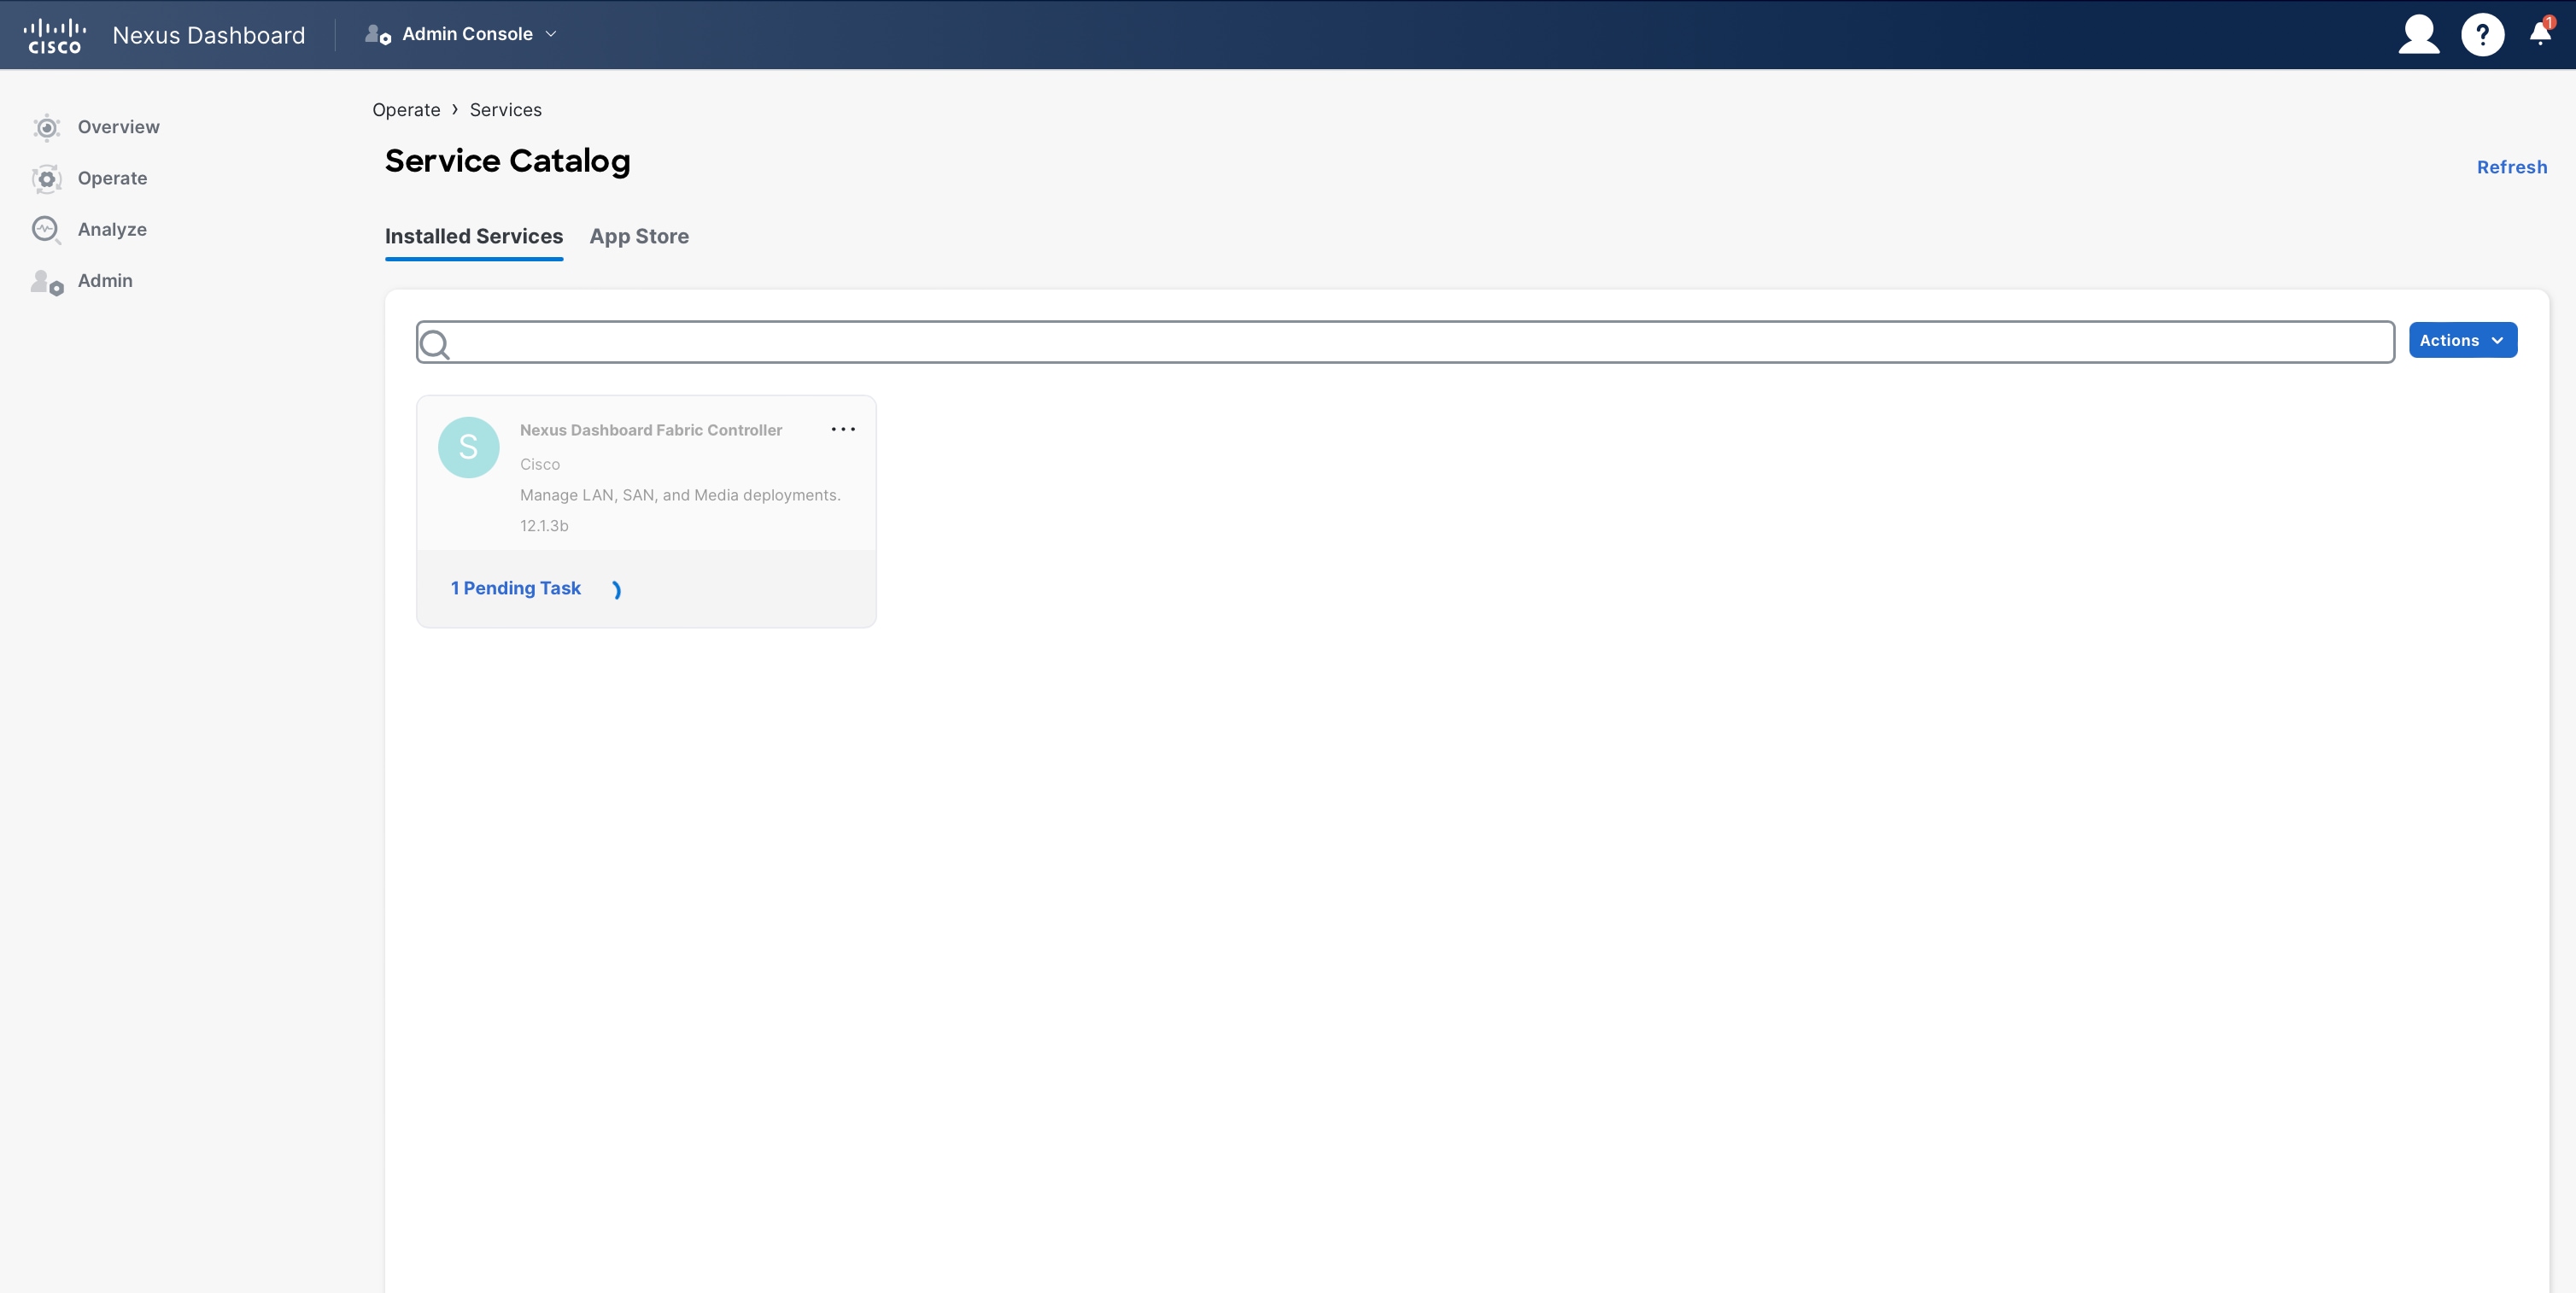
Figure 29: Nexus Dashboard Fabric Controller– Initial Installation in Progress.
Once NDFC has been installed, you must enable it separately. If you have navigated away from the Service Catalog, you can re-access it by navigating through “Operate > Services > Installed Services.”
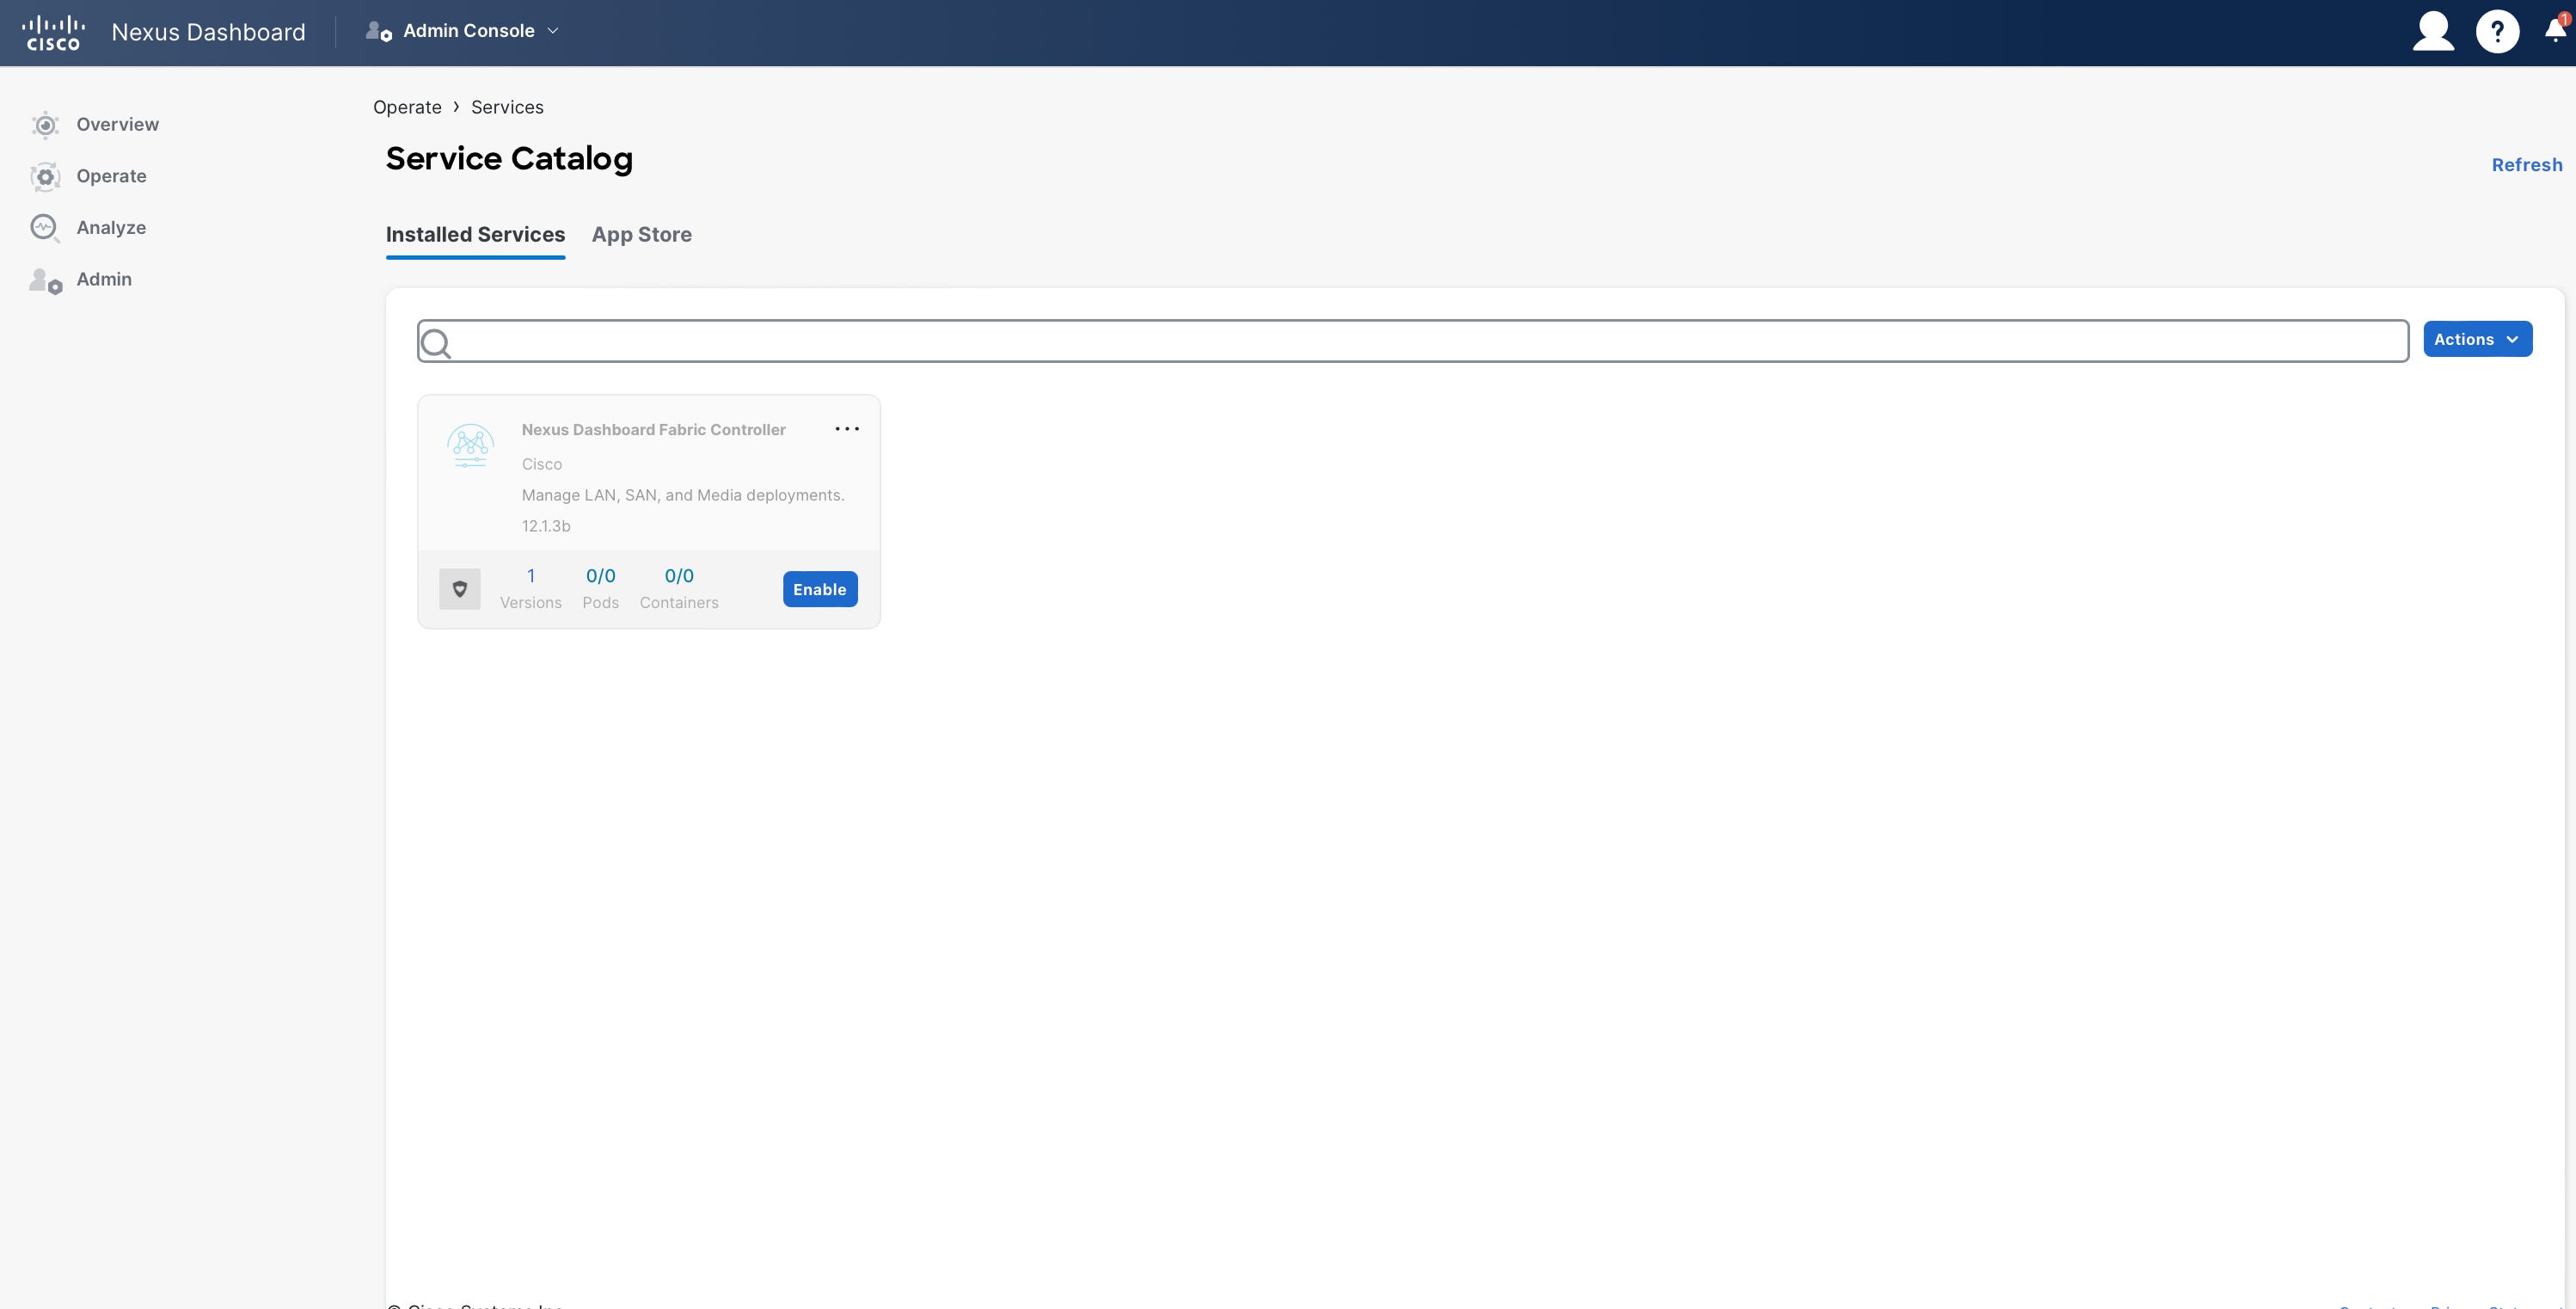
Figure 30: Nexus Dashboard Fabric Controller– Ready for Enablement.
You can track the progress of NDFC’s enablement by clicking on the pending task.
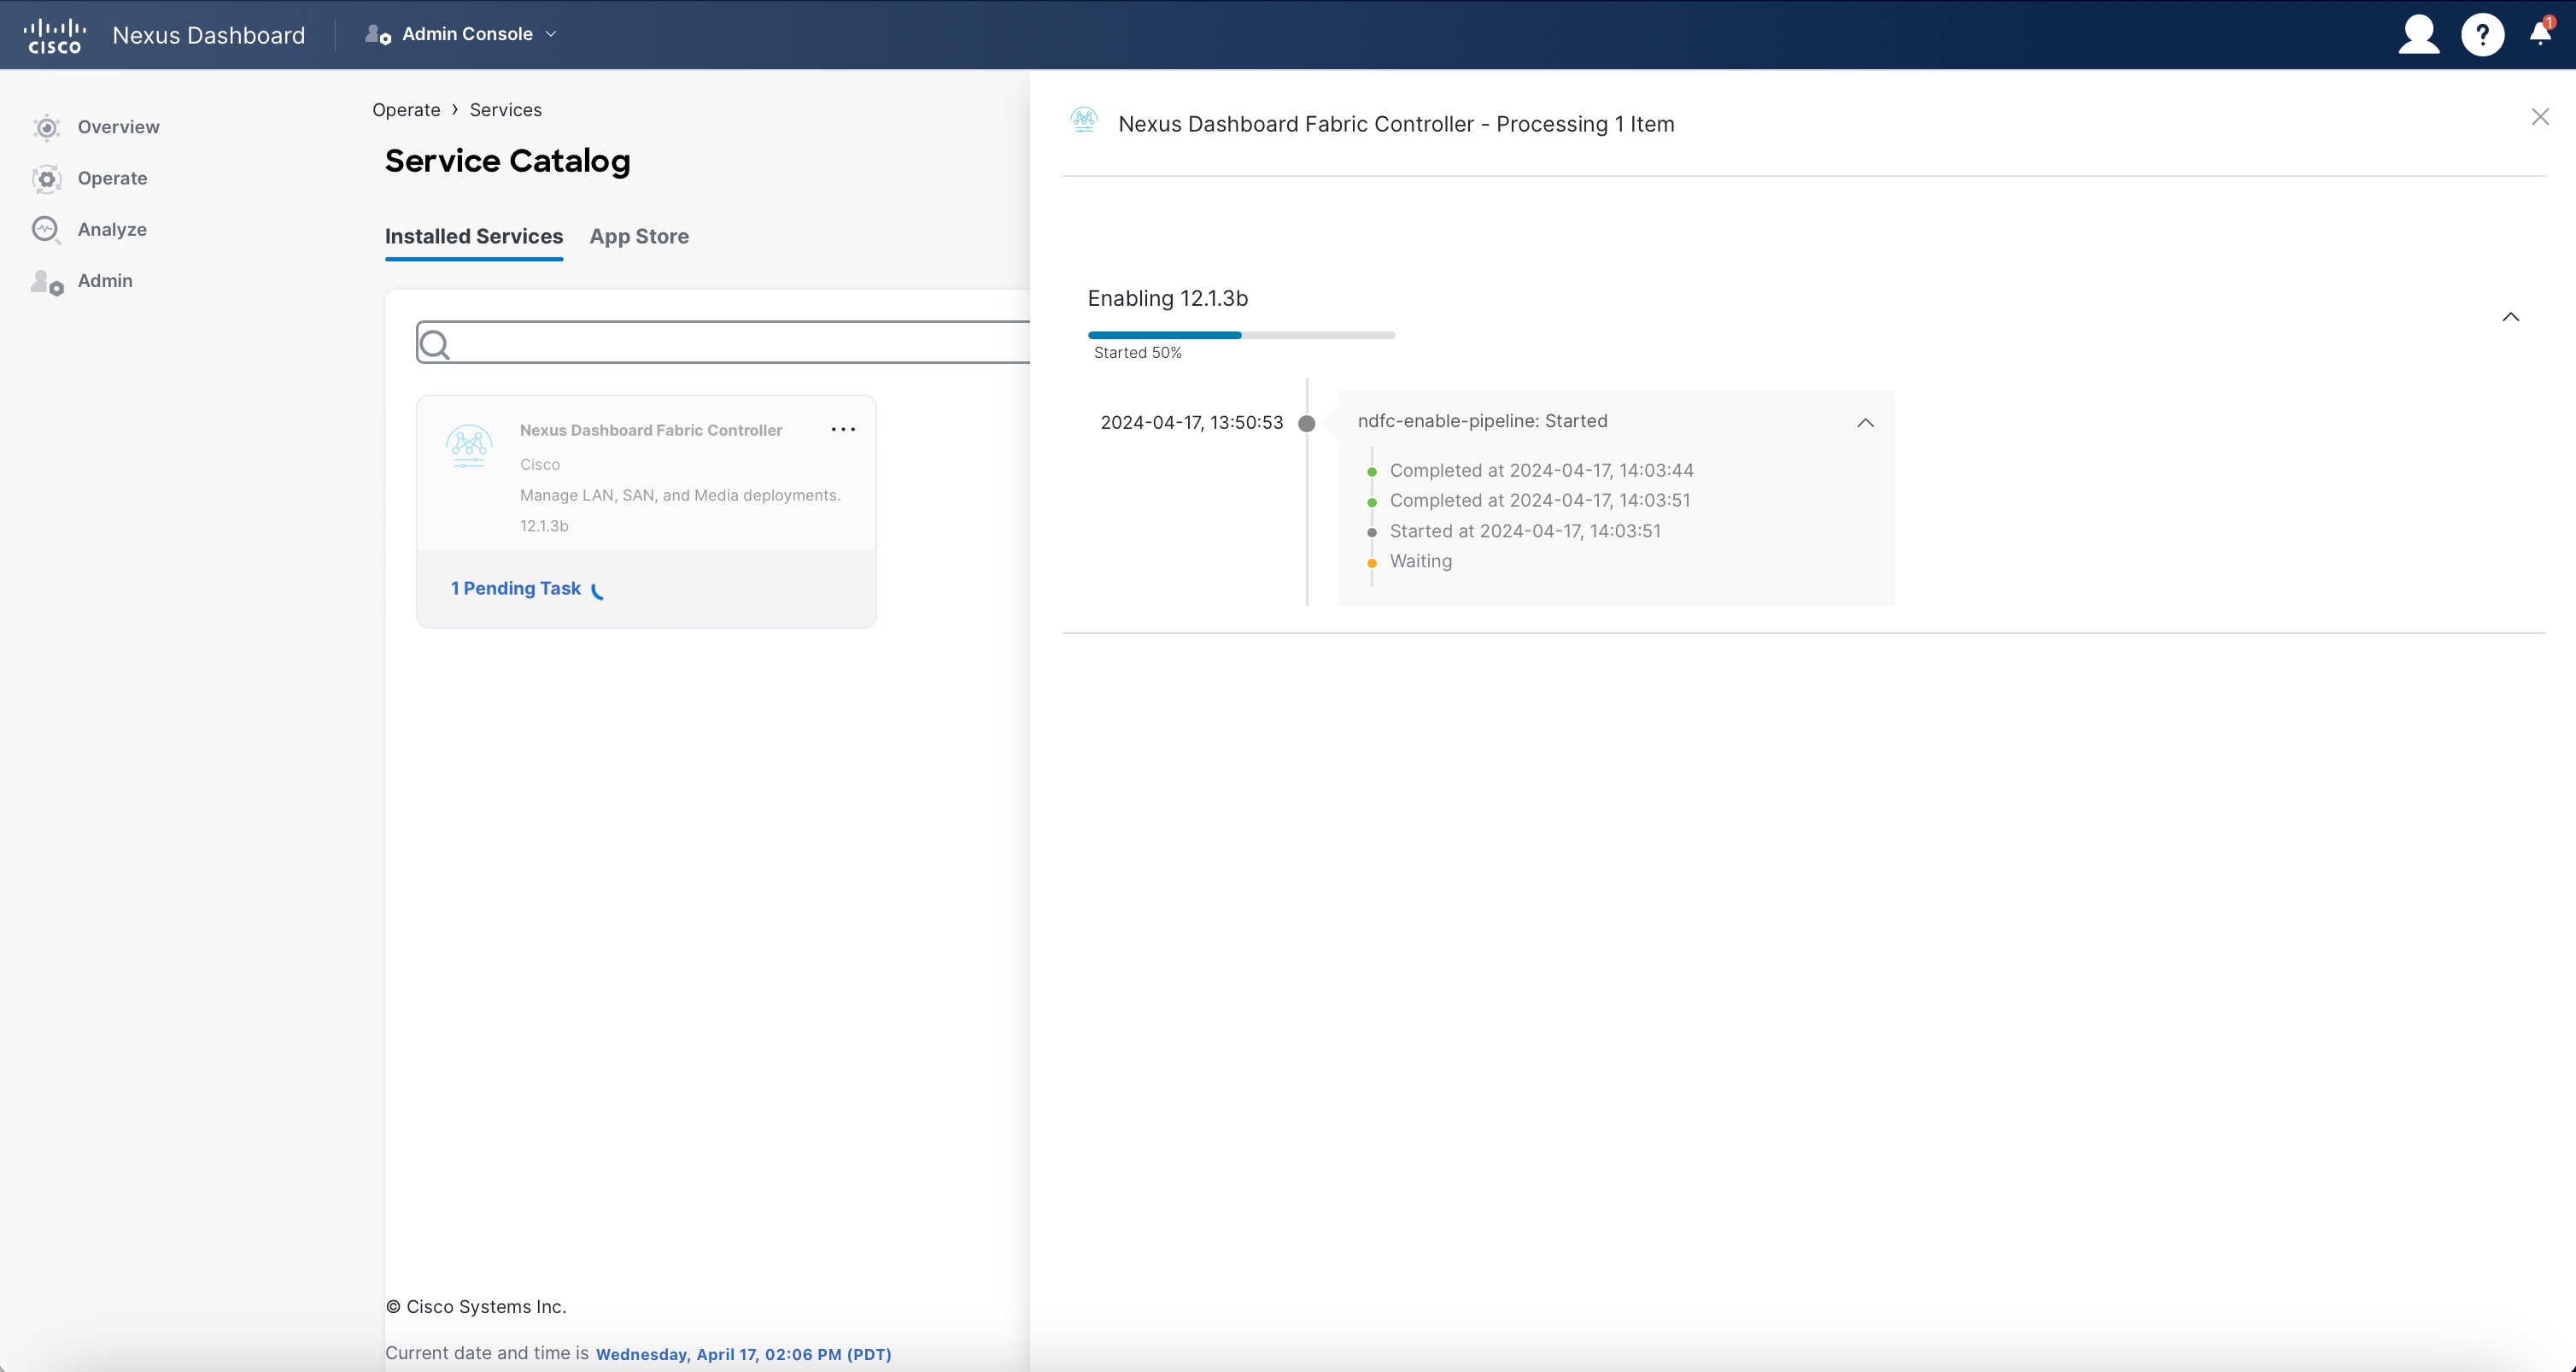
Figure 31: Nexus Dashboard Fabric Controller– Enablement Progress.
Once NDFC is successfully enabled, your “Installed Services” page looks like the below example.
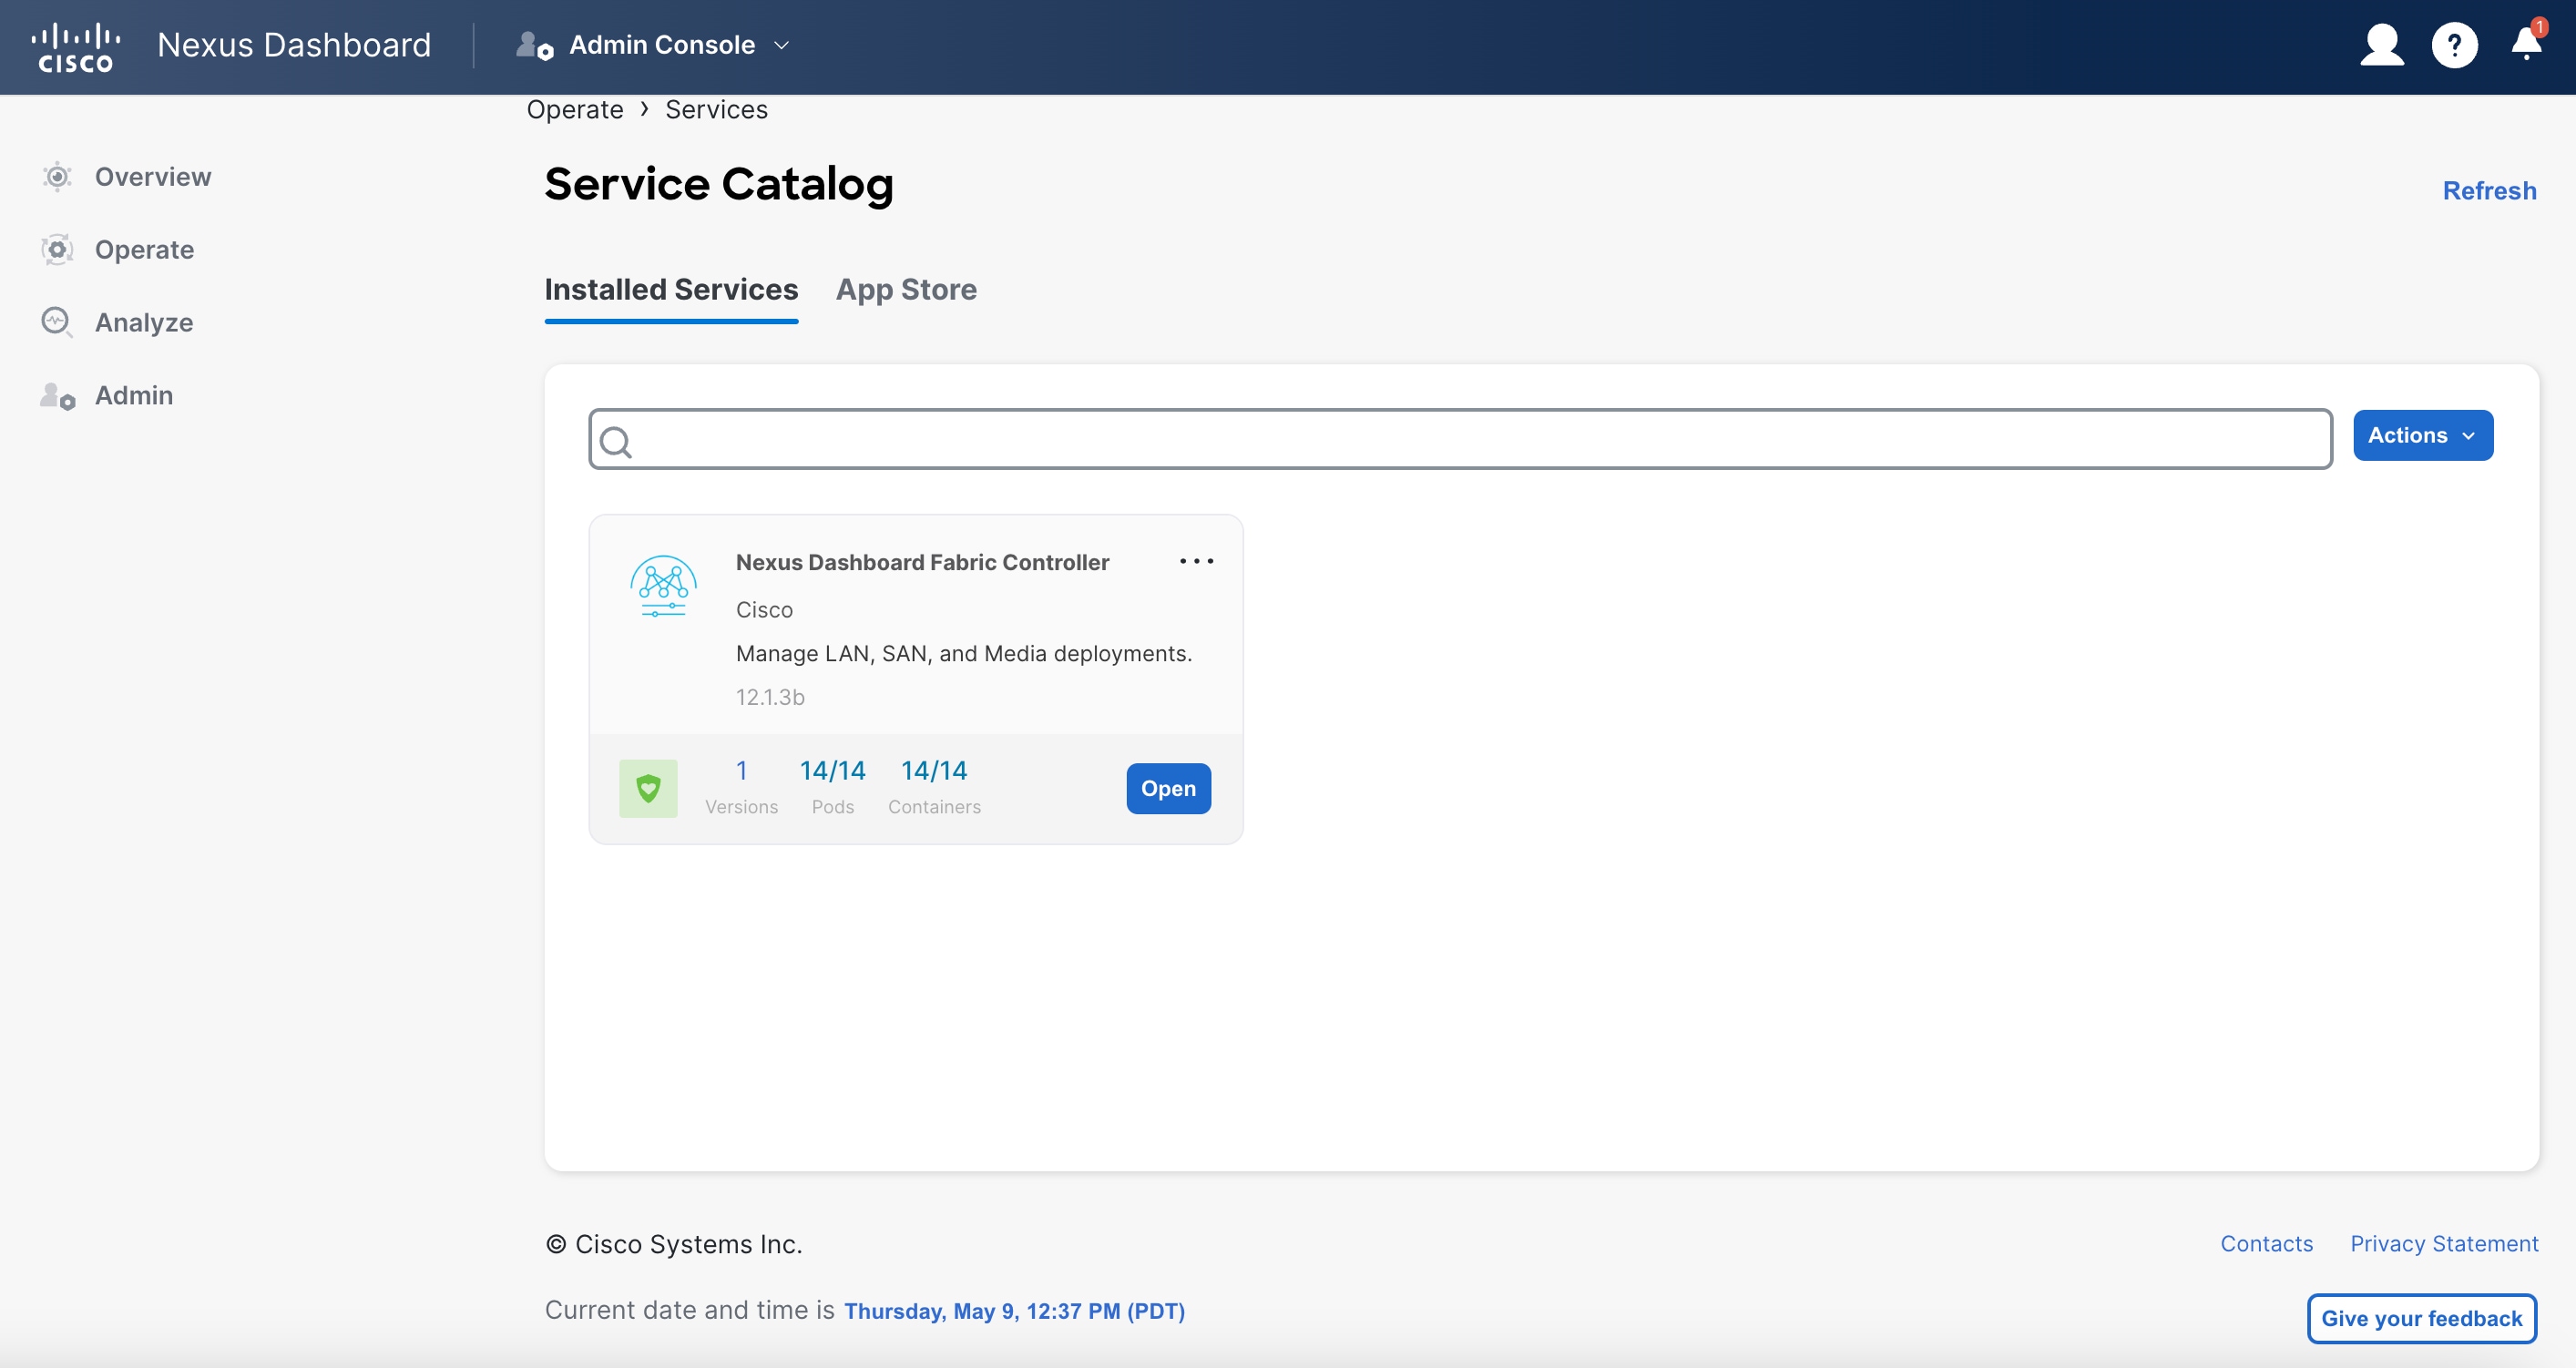
Figure 32: Nexus Dashboard Fabric Controller– Installed.
When you click “Open,” you see a “What’s new in 12.3.1b” pop-up window, and then a prerequisites guideline pop-up window appears.
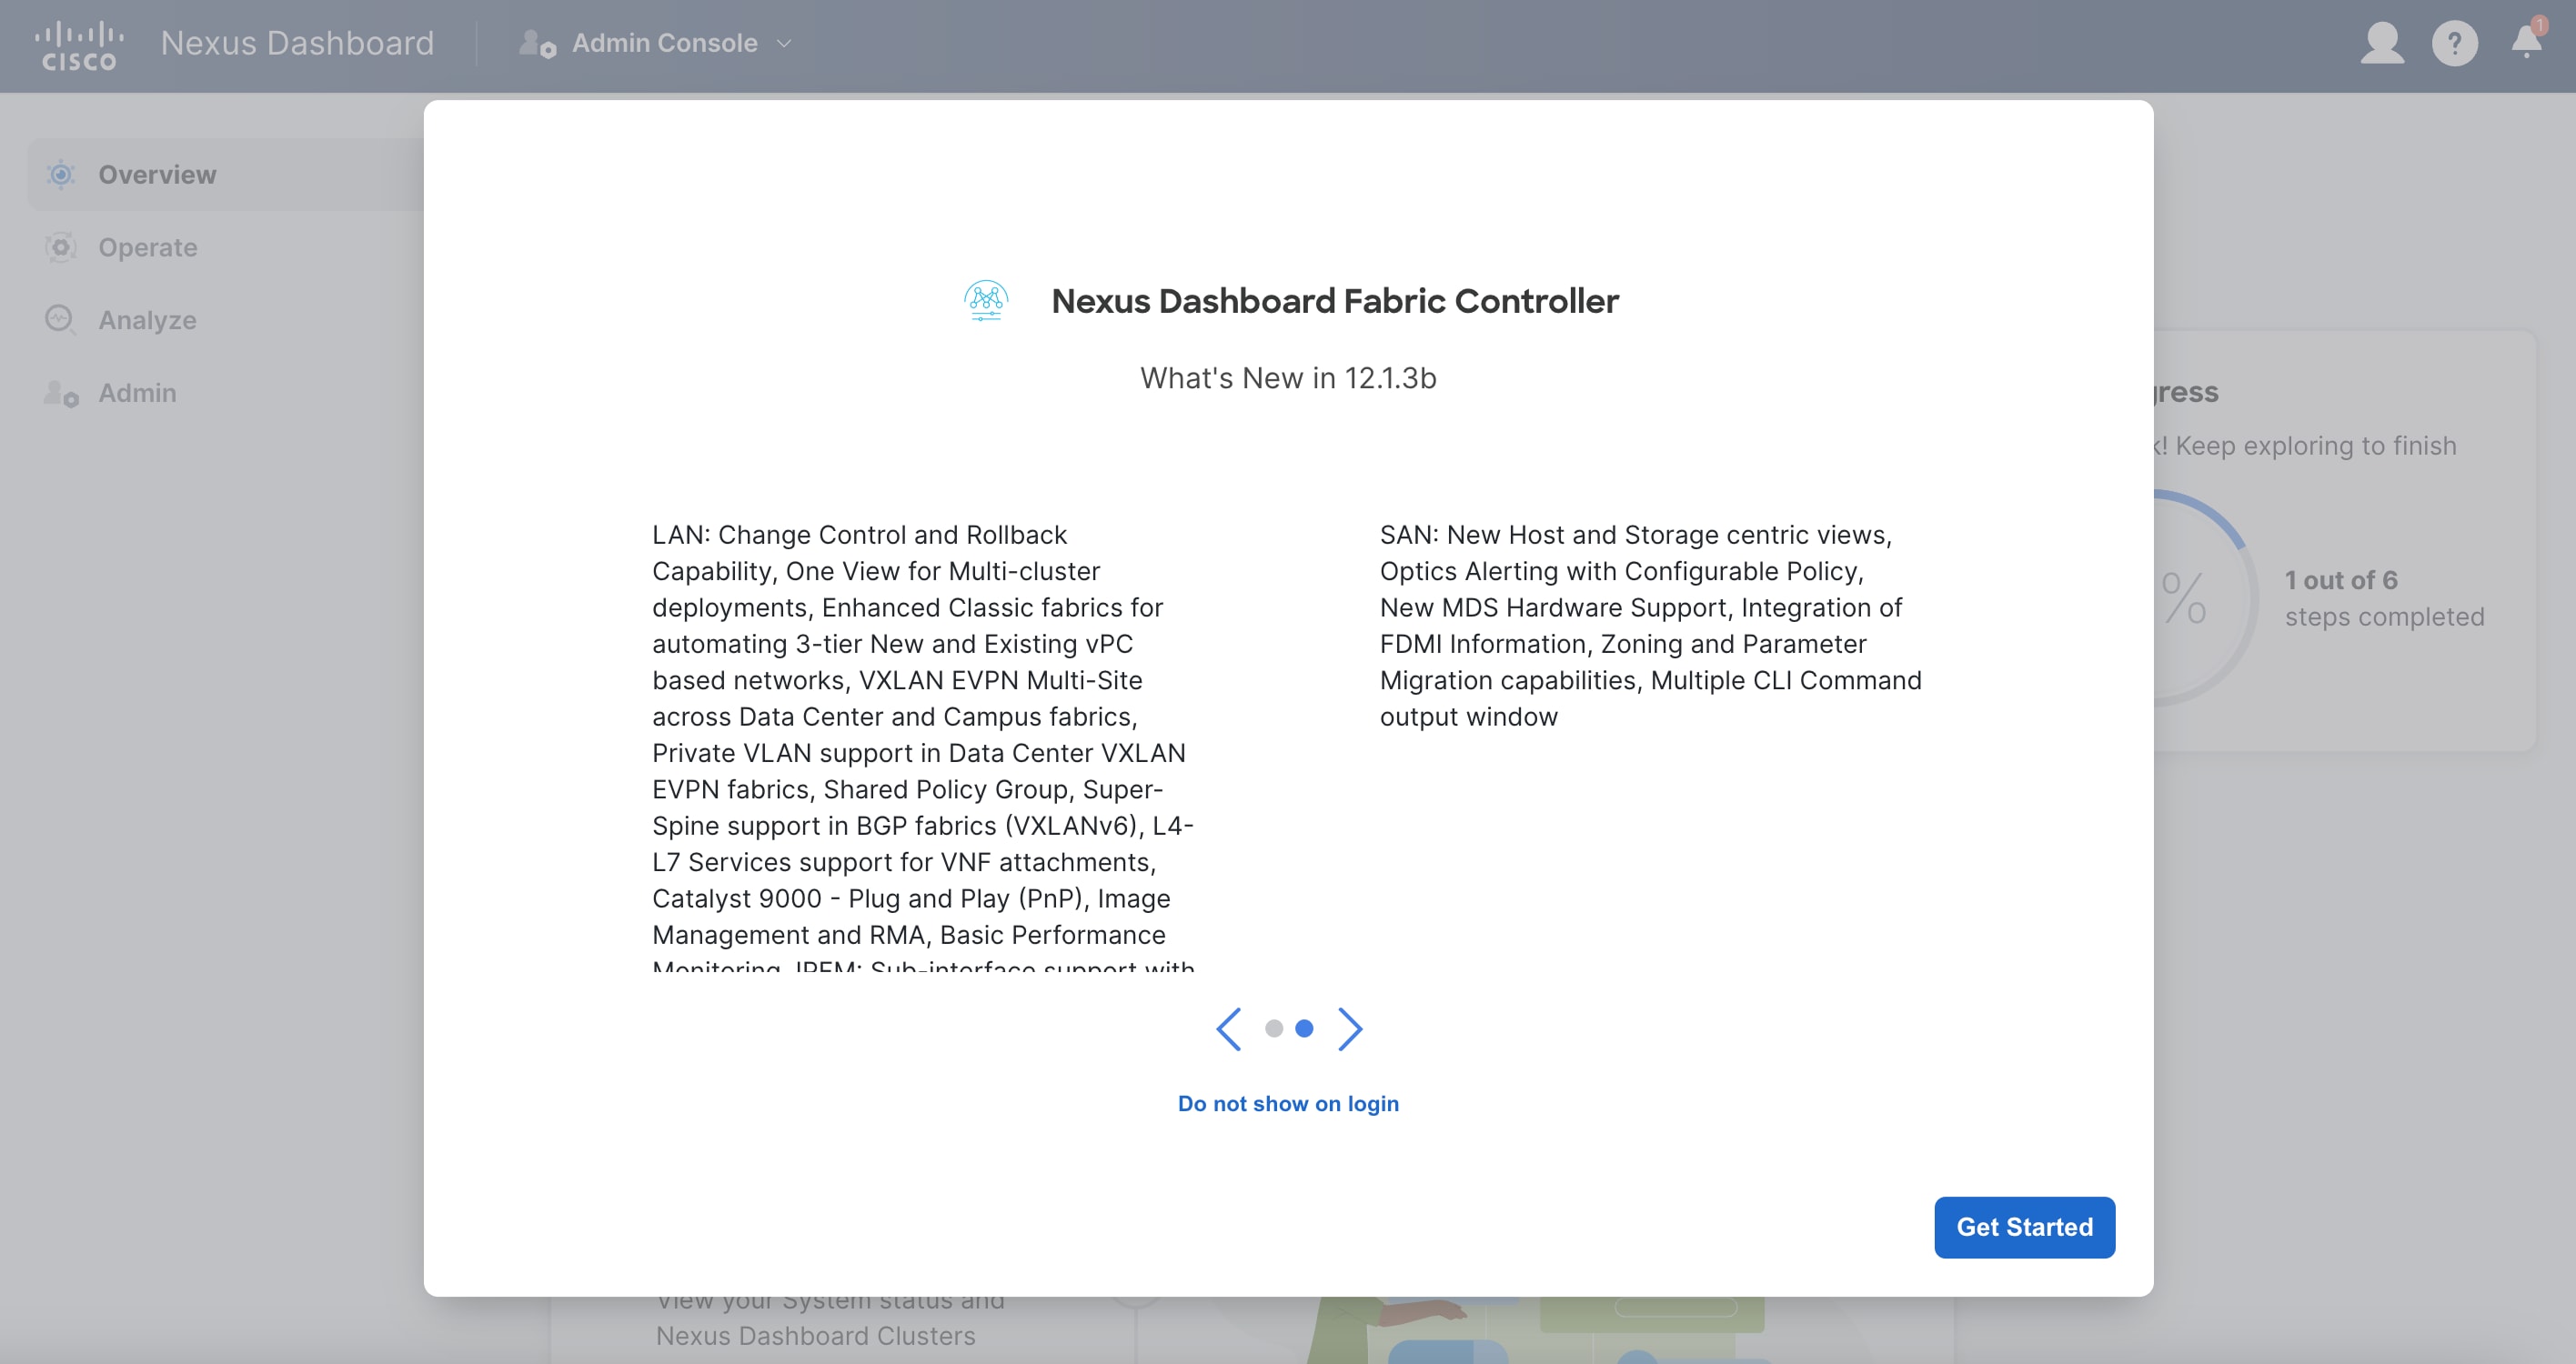
Figure 33: Nexus Dashboard Fabric Controller Updates Guide.
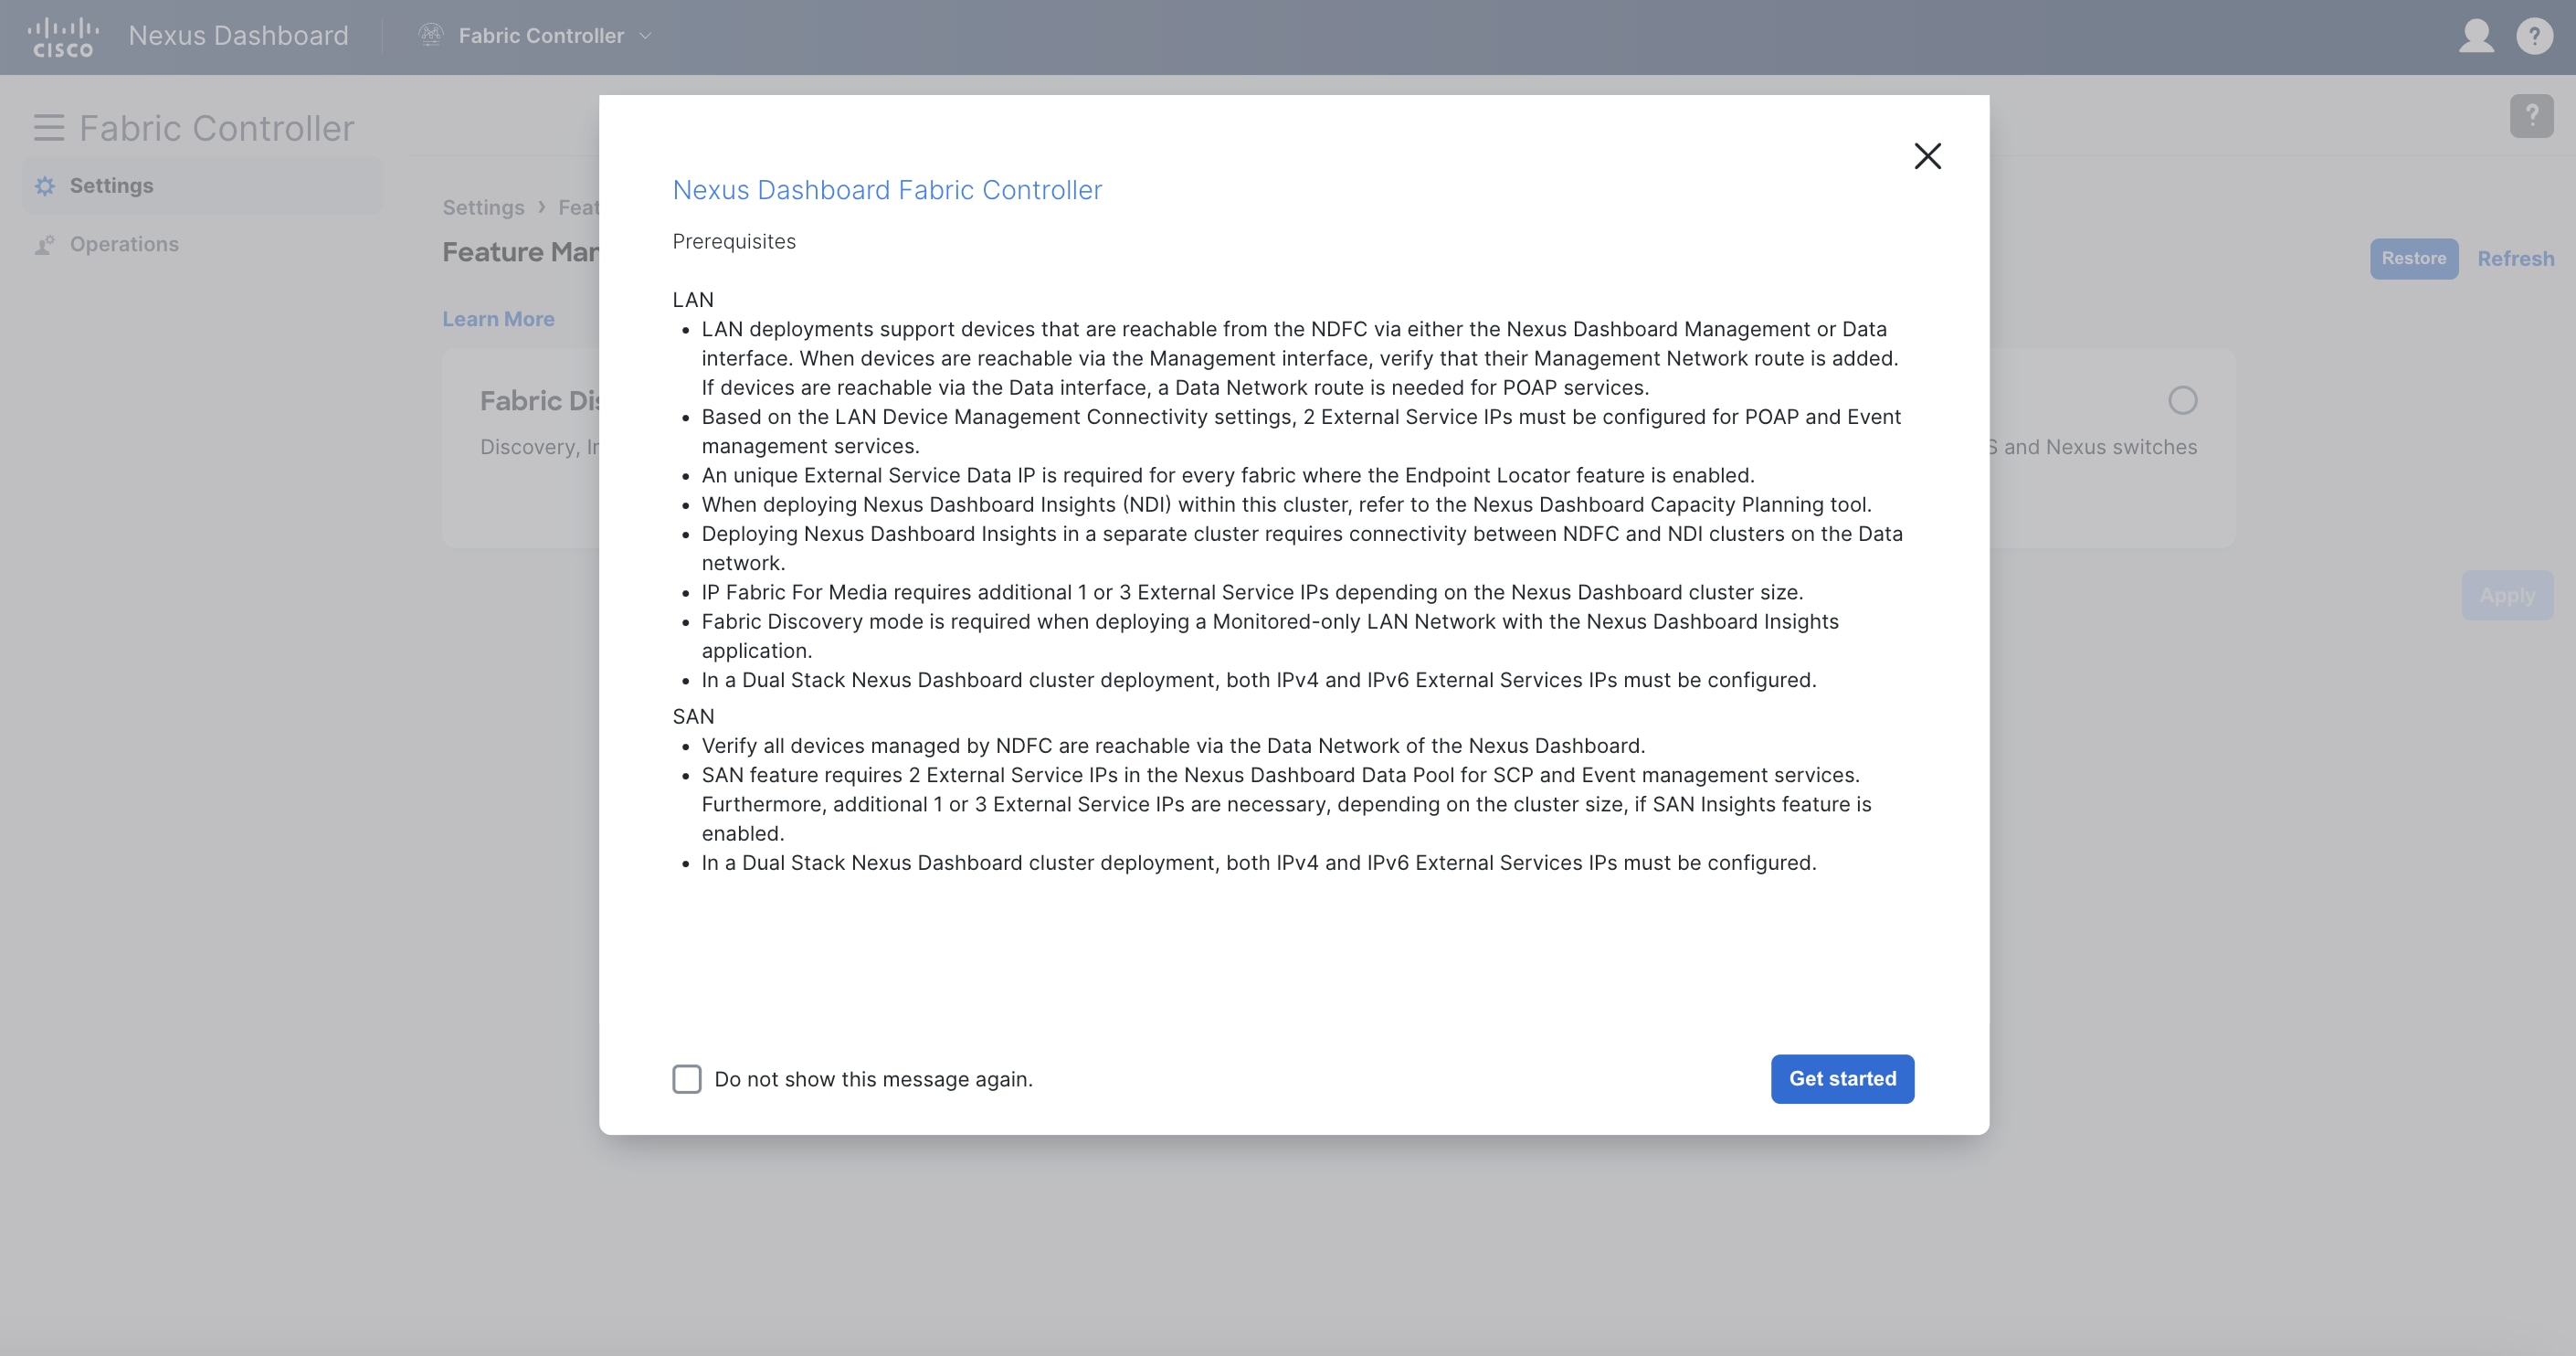
Figure 34: Nexus Dashboard Fabric Controller Prerequisites.
At this stage, you select your NDFC instance’s feature management mode—Fabric Discovery, Fabric Controller, or SAN Controller. Fabric Discovery is a lightweight version of NDFC; when enabled, it supports inventory discovery and monitoring only (NOT configuration or provisioning). This option helps minimize resource utilization and further customize NDFC, but if you require configuration or provisioning capability, select Fabric Controller as your feature management mode. The SAN controller is for MDS and Nexus Switch use cases.
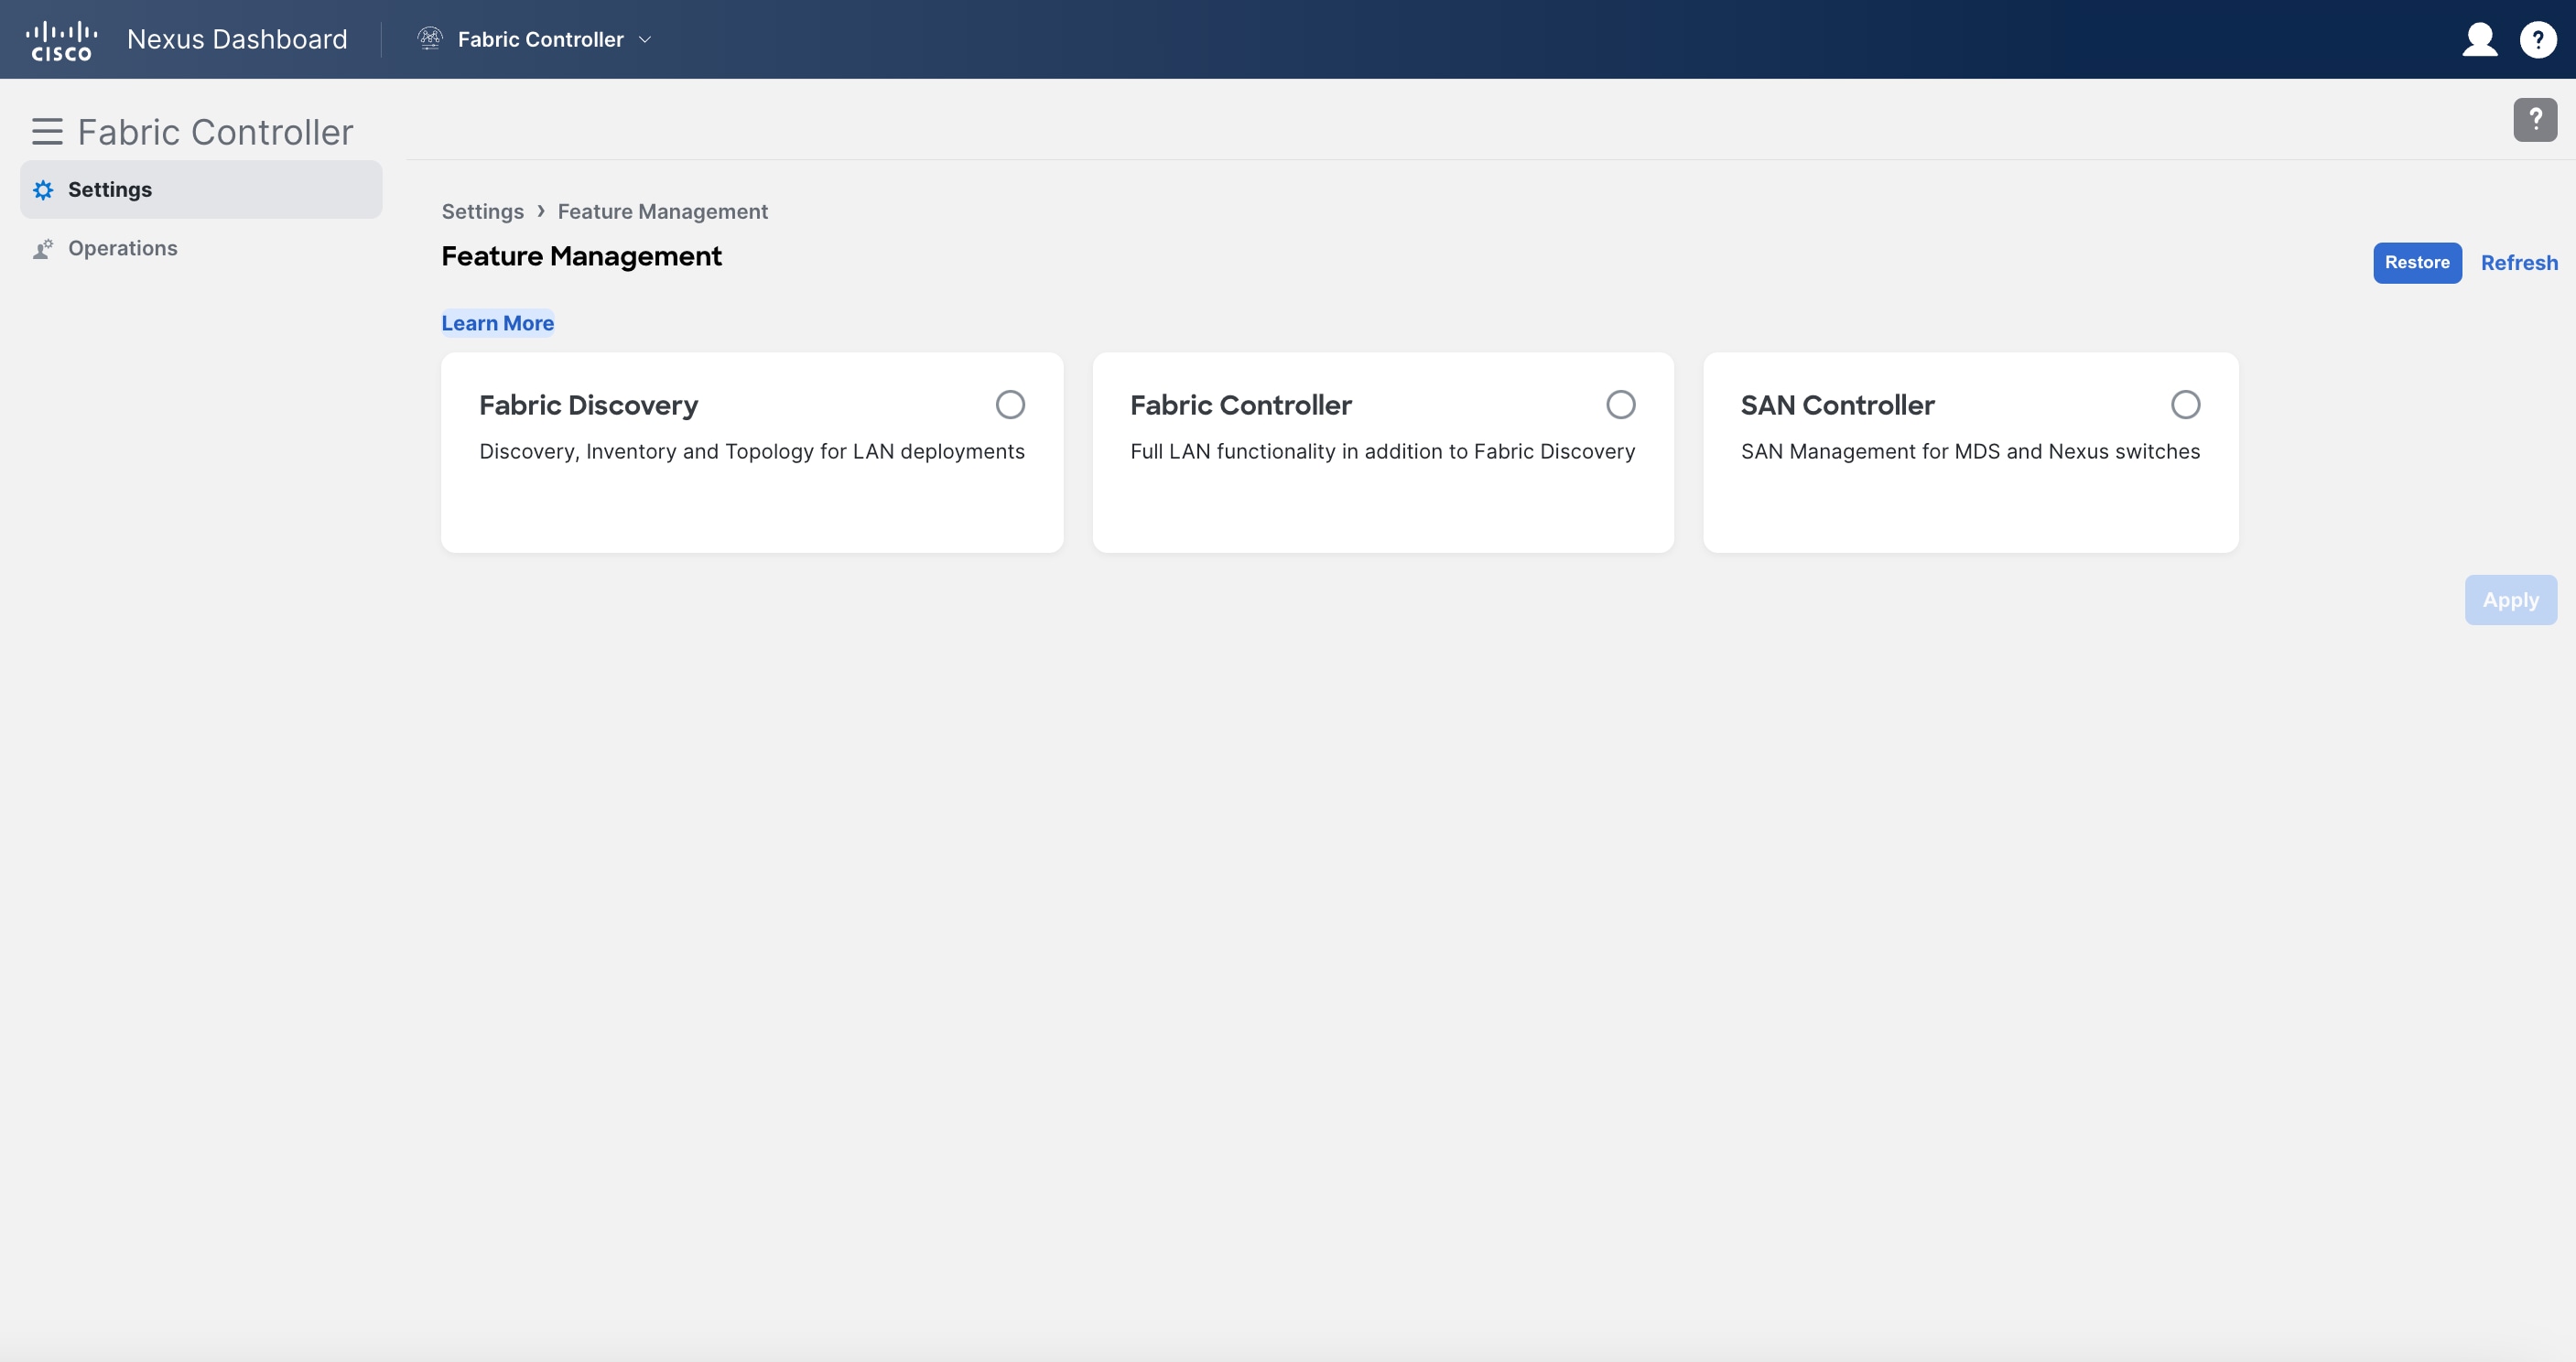
Figure 35: Nexus Dashboard Fabric Controller Feature Management Options.
If you elect for a full fabric controller, you have the option to enable specific features from the start.
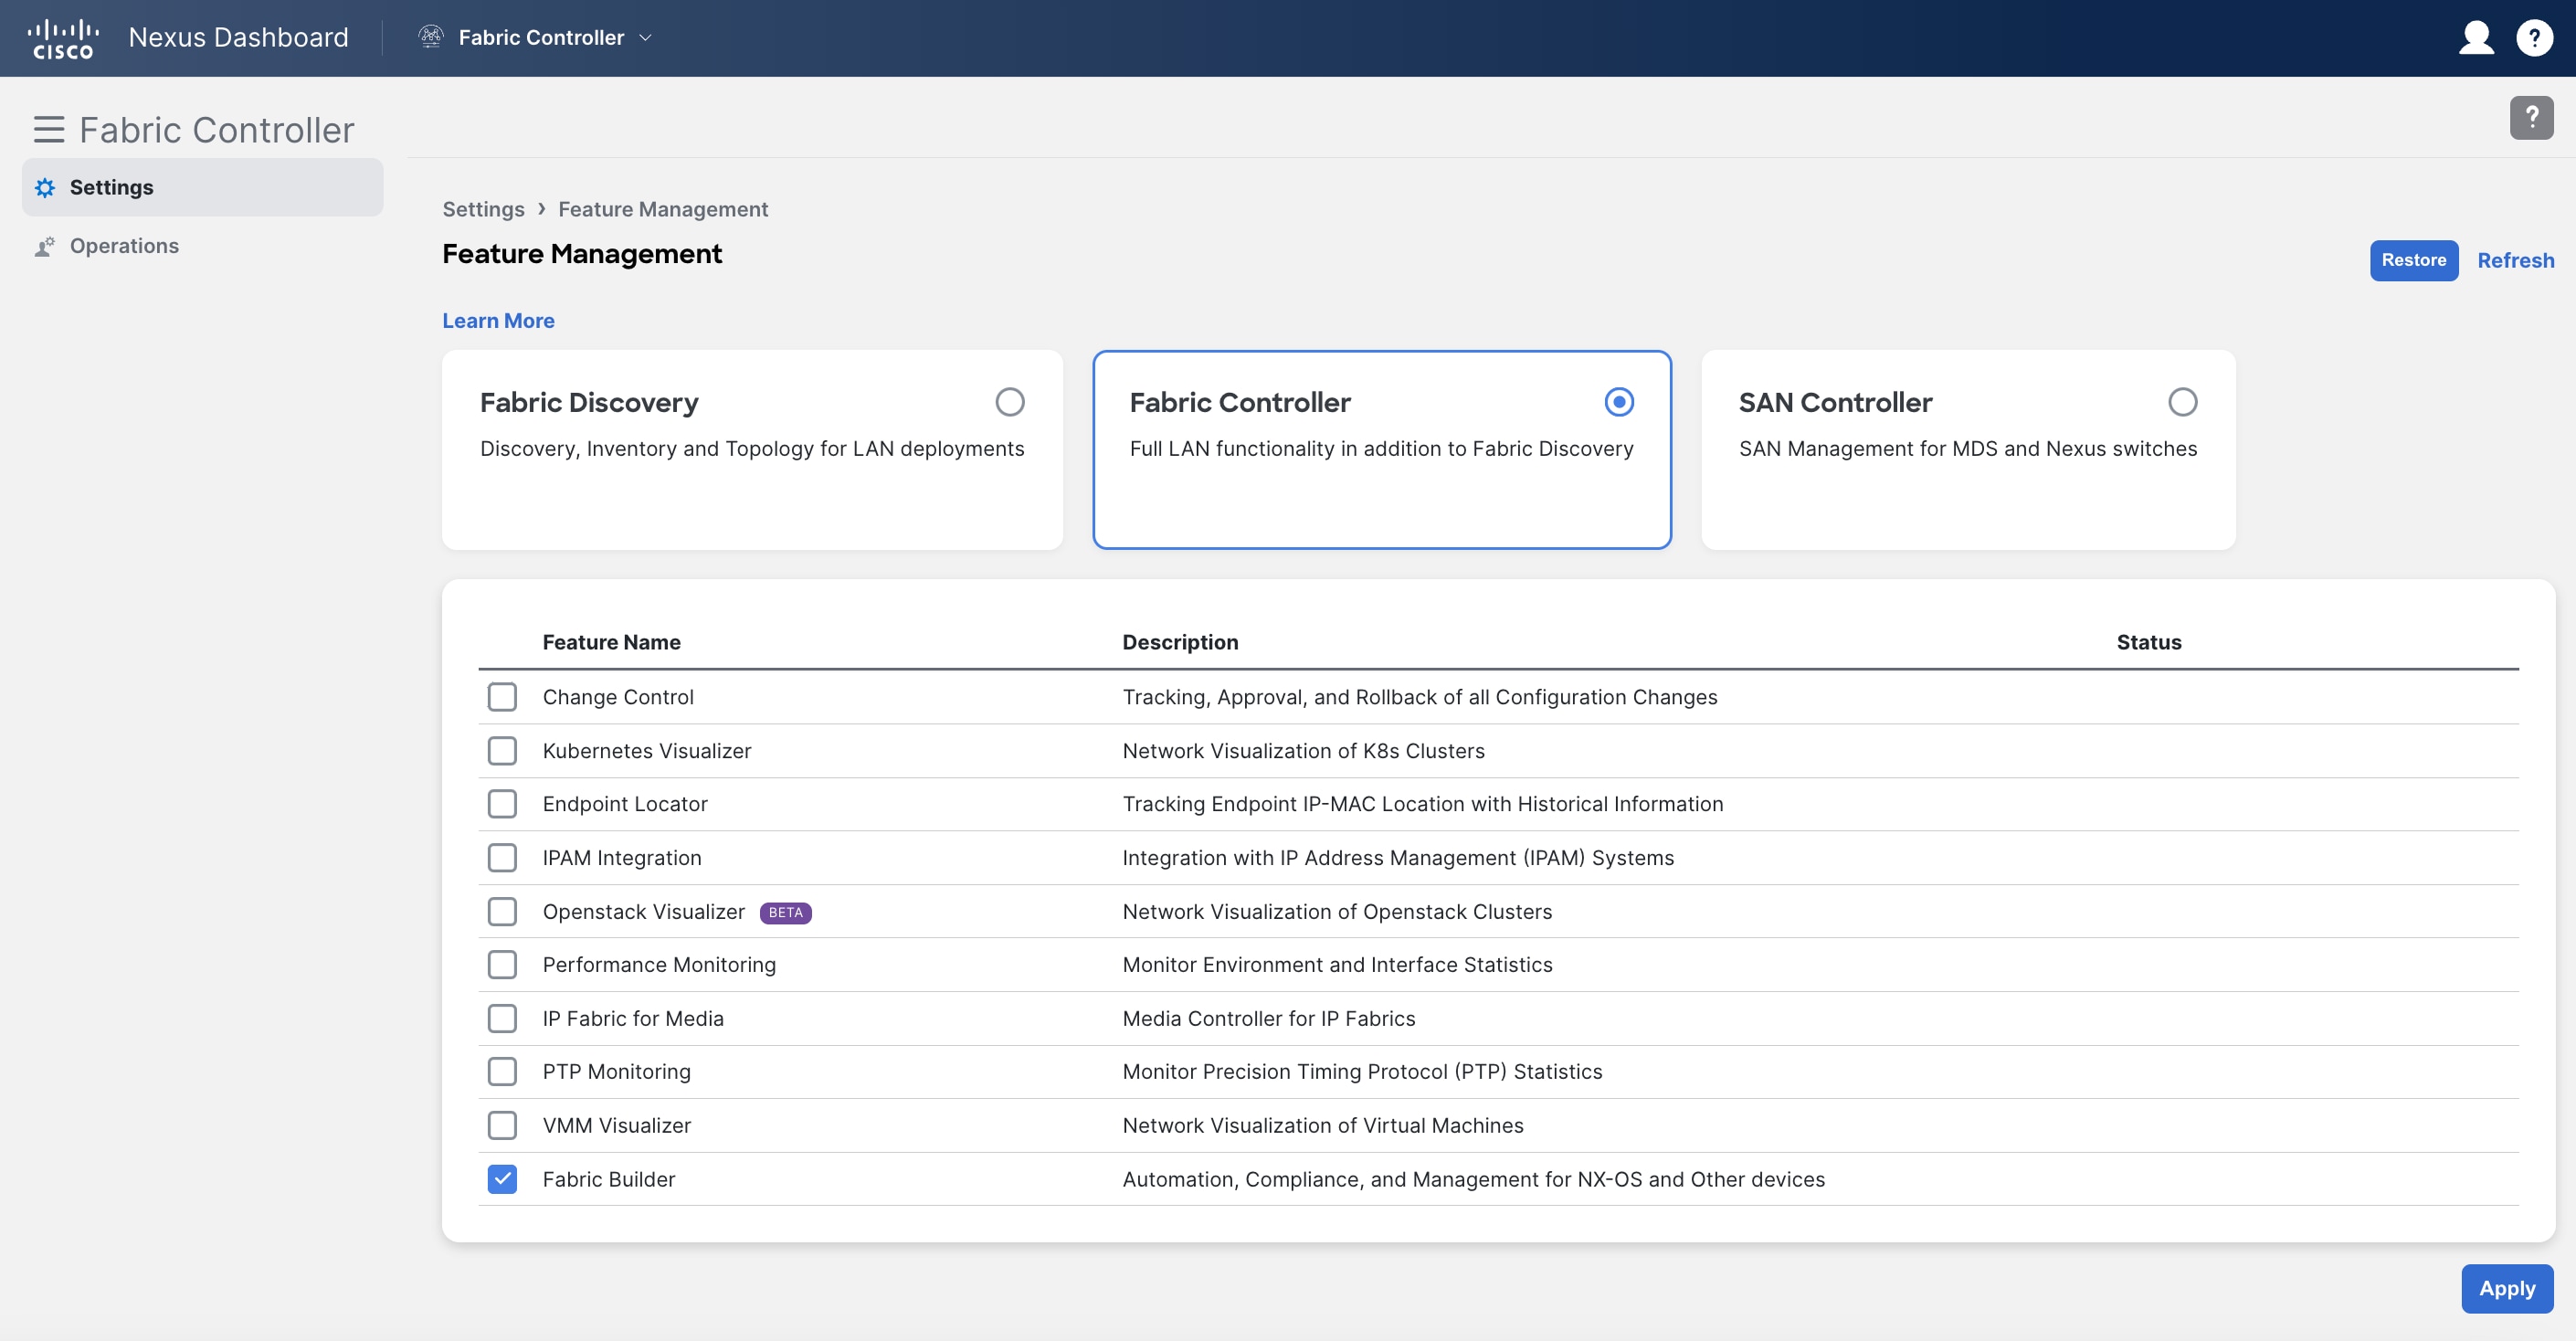
Figure 36: Nexus Dashboard Fabric Controller Customization Options.
Once you have selected the appropriate feature management mode, select “apply” to finish configuring your NDFC instance. For more information on NDFC modes and features, refer to the NDFC 12 Data Sheet.
Persistent IP Requirements for NDFC
Persistent IP addresses, also known as external service IP addresses, are required for pods/services in NDFC that require sticky IP addresses. In other words, pods that are provisioned with a persistent IP retain their IP address even if they are re-provisioned (either on the same Nexus Dashboard node or a different Nexus Dashboard node within the same Nexus Dashboard cluster). Persistent IP addresses are required because switches may be configured with a certain NDFC service as a destination (e.g., SNMP trap destination). For these use cases, a failure of the Nexus Dashboard node hosting the corresponding service/pod should not lead to a switch configuration change. For uninterrupted service, the associated service/pod must be respawned somewhere else in the Nexus Dashboard cluster (usually in another node) so that the pod/service IP remains the same.
Examples of persistent IP addresses include the following:
- SNMP Trap/Syslog Receiver.
- POAP/SCP.
- EPL (Endpoint Locator).
- PMN (for IPFM deployments).
- SAN.
Since the Nexus Dashboard nodes are typically Layer 2-adjacent, from a network reachability point of view, nothing else is required for traffic to be redirected to the new location of that destination service/pod. Note that with the introduction of Layer 3 reachability for an ND cluster hosting NDFC, eBGP is employed to dynamically advertise the updated location of the service following a node failure. Consequently, from a network reachability point of view, as soon as the pod has been re-deployed in the new location, service resumes without any user intervention.
External service IP addresses are configured under Nexus Dashboard cluster configuration. The usage of persistent IP addresses is based on what features are enabled on NDFC, the deployment model, and the way NDFC connects to the switches. Based on your specific use case, you may need IP addresses in the Nexus Dashboard management pool, data pool, or both.
For virtual Nexus Dashboard deployments, enable (or accept) promiscuous mode on the port groups associated with the Nexus Dashboard management and/or data vNICs where IP stickiness is required. The persistent IP addresses are given to the PODs (examples include an SNMP trap/syslog receiver, Endpoint Locator instance per fabric, SAN Insights receiver, etc.). Every POD in Kubernetes can have multiple virtual interfaces. Specifically for IP stickiness, an additional virtual interface is associated with the pod that is allocated an appropriate free IP from the appropriate external service IP pool.
The vNIC has its own unique MAC address that is different from the MAC addresses associated with the vND’s virtual vNICs. Moreover, all communication to and from the pods towards an external switch goes out of the same bond interface for north-to-south traffic flows. The data vNIC maps to the bond0 (also known as bond0br) interface and the management vNIC maps to the bond1 (also known as bond1br) interface. By default, the VMware system checks if the traffic flows out of a particular vNIC are matched with the source-MAC associated with the vNIC. In the case of NDFC, the traffic flows are sourced with the persistent IP address and associated MAC of the given pods. Therefore, you must enable the required settings on the VMware side.
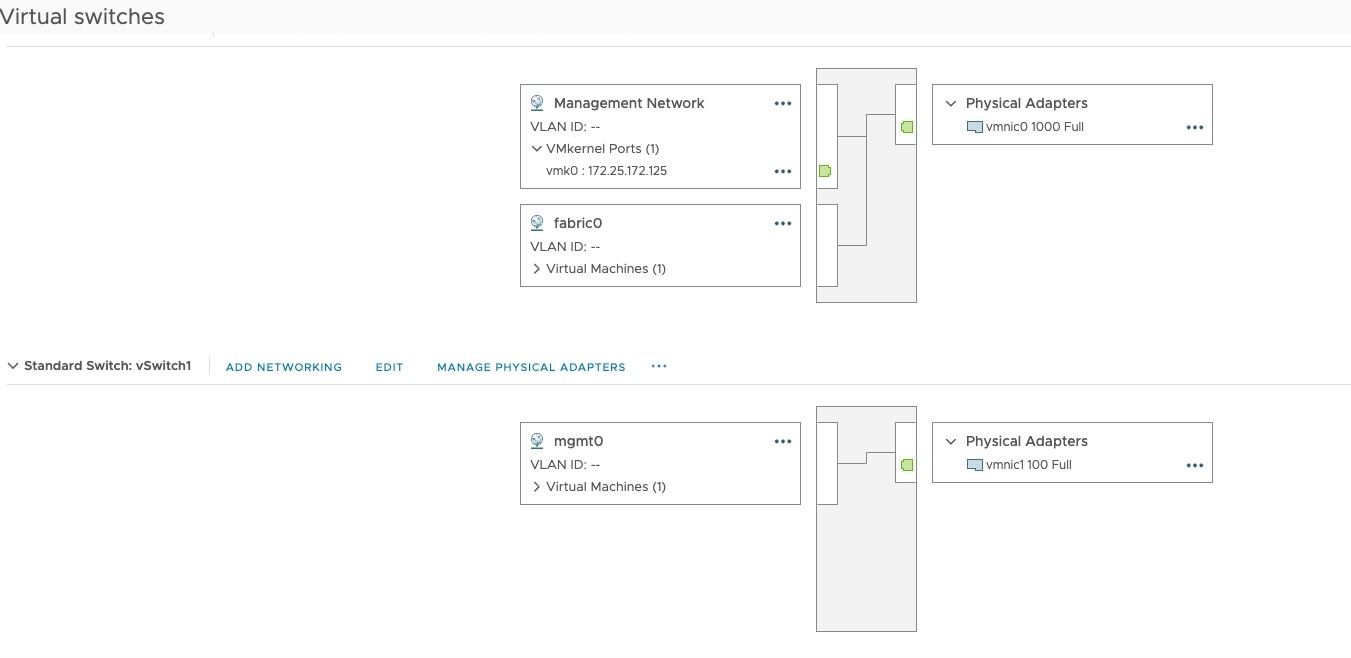
Figure 37: vSphere Network Setup.
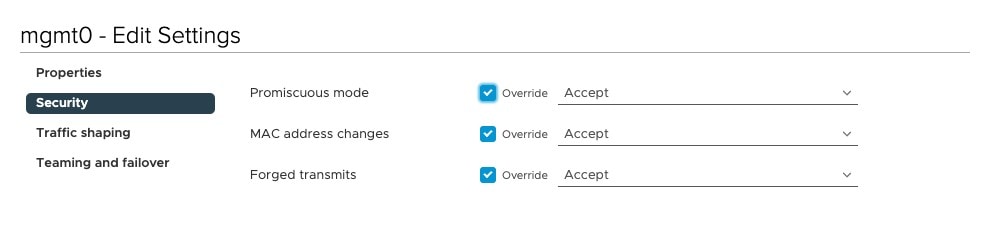
Figure 38: vSphere mgmt0 Network Settings.
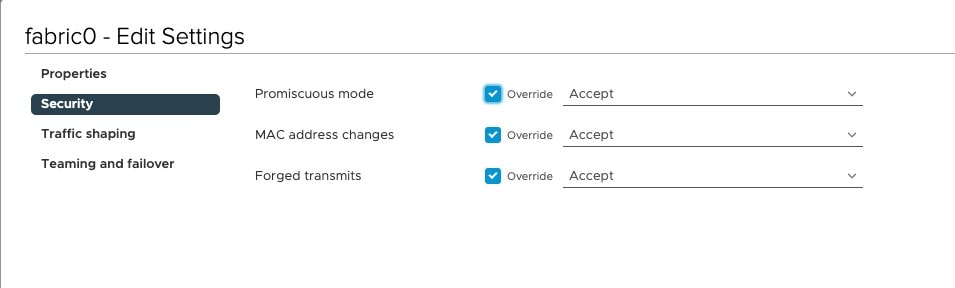
Figure 39: vSphere fabric0 Settings.
Note: You are not able to activate an NDFC feature if appropriate persistent IP addresses are not available. NDFC has a precheck that confirms that enough free external service IP addresses are configured on the Nexus Dashboard in the corresponding pool before a feature that has such a requirement can be enabled.
Depending on the specific use case and the selected interface for communicating with the switch’s mgmt0 interfaces, the persistent IP addresses must be associated with the ND management interface or data interface.
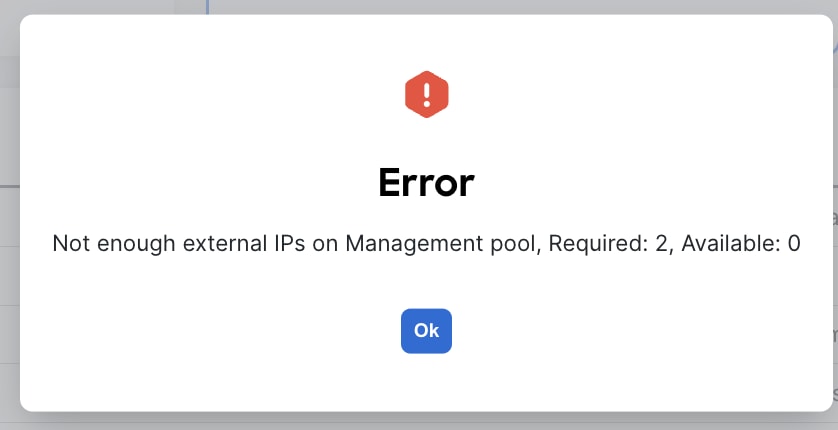
Figure 40: Error Message
Cisco NDFC Release 12.1.2e introduced the capability for NDFC to be run on top of a virtual Nexus Dashboard (vND) instance with promiscuous mode disabled on port groups that are associated with Nexus Dashboard interfaces where External Service IP addresses are specified. It is recommended to disable promiscuous mode for the port groups after upgrading to ND 2.3.1/NDFC 12.1.2, in case customers are upgrading from a previous version. Recall that vND comprises a management interface and a data interface. By default, for LAN deployments, two external service IP addresses are required for the Nexus Dashboard management interface subnet. Similarly, by default, for SAN deployments, two external service IP addresses are required for the Nexus Dashboard data interface subnet.
Note: Disabling promiscuous mode is supported from Cisco Nexus Dashboard Release 2.3.1c.
Note: You can disable promiscuous mode when Nexus Dashboard nodes are Layer 3-adjacent to the data network, BGP is configured, and fabric switches are reachable through the data interface.
Note: You can now disable promiscuous mode even when Nexus Dashboard interfaces are Layer-2 adjacent on the management and data networks.
Note: Default option for promiscuous mode on VMware ESXi environments is Reject, meaning promiscuous mode is disabled.
Configuring Persistent IP Addresses
To configure the Persistent IP addresses (also known as External Service IP) perform the following steps:
Step 1. Navigate to Nexus Dashboard Admin console.
Step 2. Click on the System Settings tab.
Step 3. Stay under the General tab and scroll down to External Service pools.
Step 4. Based on the deployment model and use-case, edit the External Service Pools and associate the persistent IP addresses to the management or data interfaces.
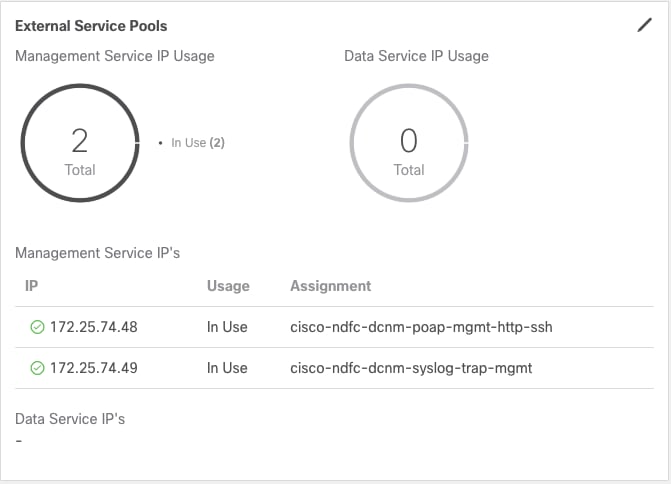
Figure 41: Nexus Dashboard Persistent IPs in Management Pool for LAN Deployments.
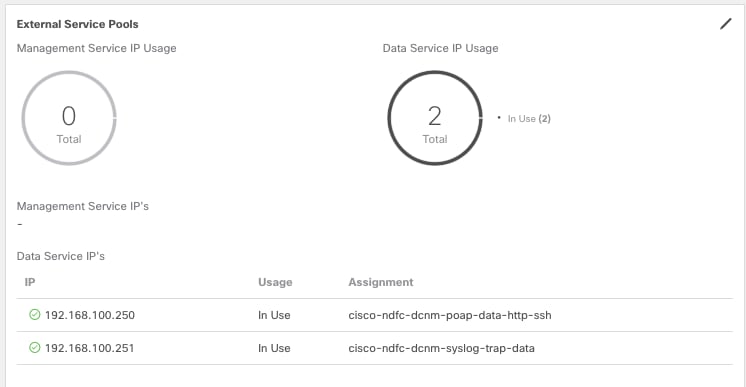
Figure 42: Nexus Dashboard Persistent IPs in Data Pool for LAN Deployments.
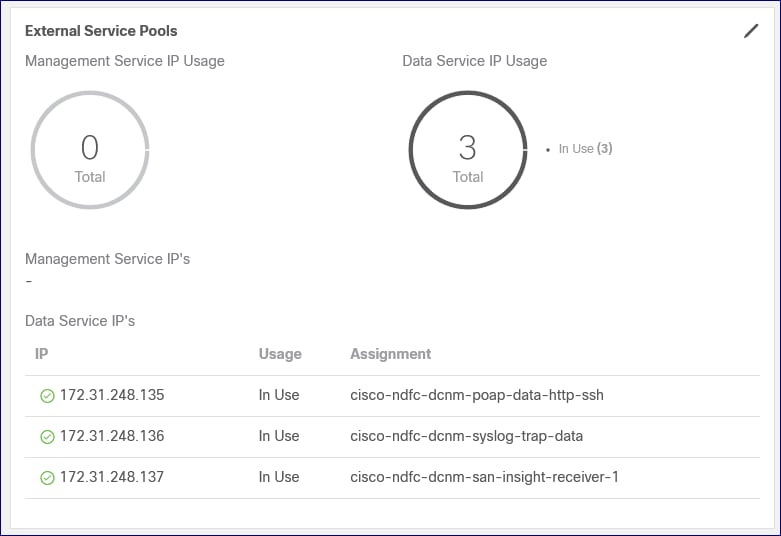
Figure 43: Nexus Dashboard Persistent IPs in Data Pool for SAN Deployments.
As with the above deployment section, your persistent IP addresses need to match your selected IP version—that is, an IPv4 deployment requires IPv4 addresses, and an IPv6 deployment requires IPv6 addresses. If you have a dual-stack deployment, you must provide both IPv4 and IPv6 addresses as persistent IPs.
As a reminder, if you use the ND data interface to communicate with the switch’s mgmt0 interfaces before assigning any persistent IP addresses, you must also override the default global server settings for LAN Device Management Connectivity. To do this, navigate to the NDFC server settings, go to the Admin tab, and specify data in the LAN Device Management Connectivity field.
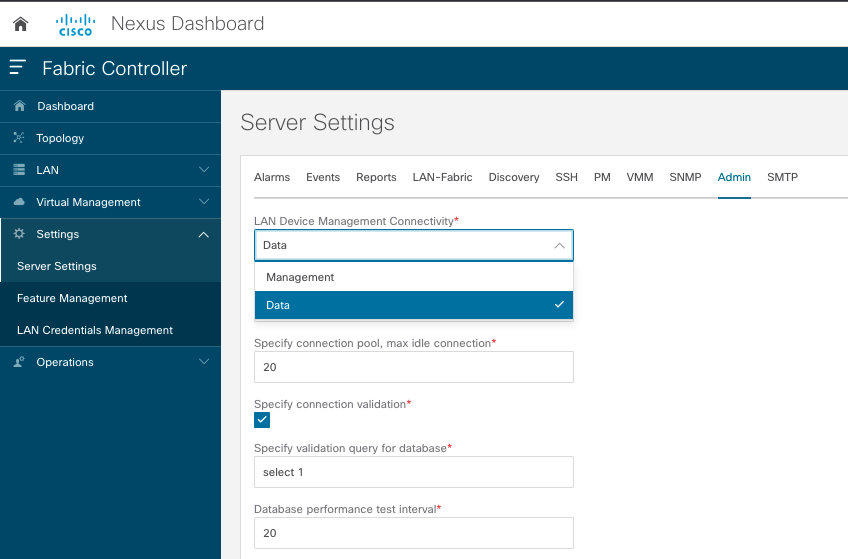
Figure 44: Server Settings for LAN Device Management.
For SAN deployments, recall that all NDFC SAN controller-to-device reachability is over the Nexus Dashboard data interface. Therefore, the requirements are the same as above: two free IP addresses are required in the Nexus Dashboard External Service Data IP Pool. Additionally, one IP address per cluster node is required to receive SAN Insights streaming data.
Taking the time to plan your upgrade from DCNM to NDFC is very important. DCNM has entered its End of Life, with support scheduled to stop completely in April 2026 and no new features being added in the meantime. New features will continue to be introduced in NDFC, and new NX-OS image support will include NDFC exclusively. Additionally, NDFC Verfiied Scalability Guidelines are now greater than DCNM 11.5, with additional increases planned in future releases.
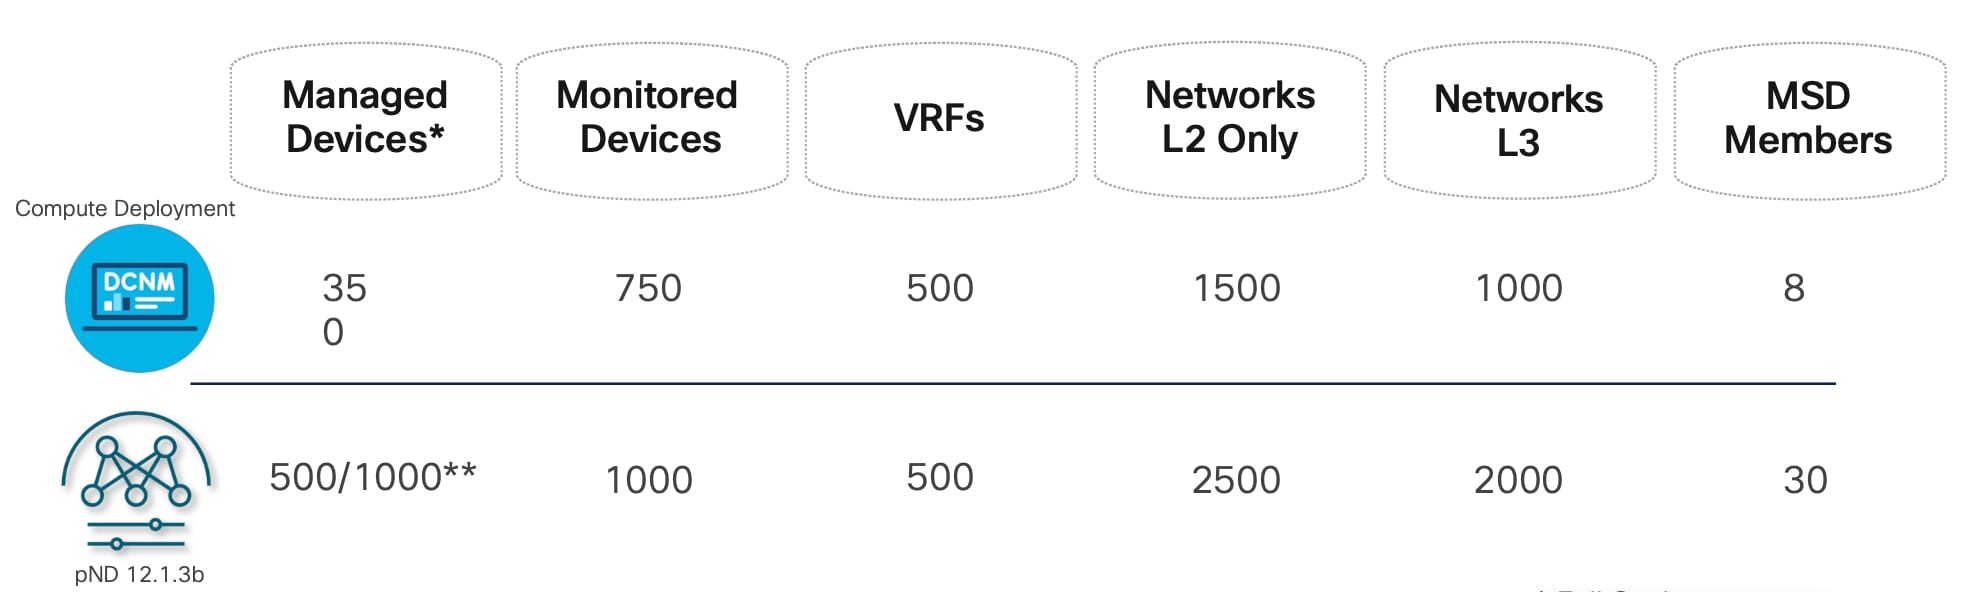
Figure 45: NDFC Verified Scalability Guidelines.
To start with, it is important to note that NDFC has higher minimum appliance requirements than DCNM, as depicted in the above figure. These requirements will differ as well, depending on which NDFC version is deployed. A large standalone DCNM deployment requires 16 vCPUs and 32 GB of RAM; a single NDFC 12.1.3b vND cluster requires the same, a significant reduction as compared to a pre-12.1.3b deployment.
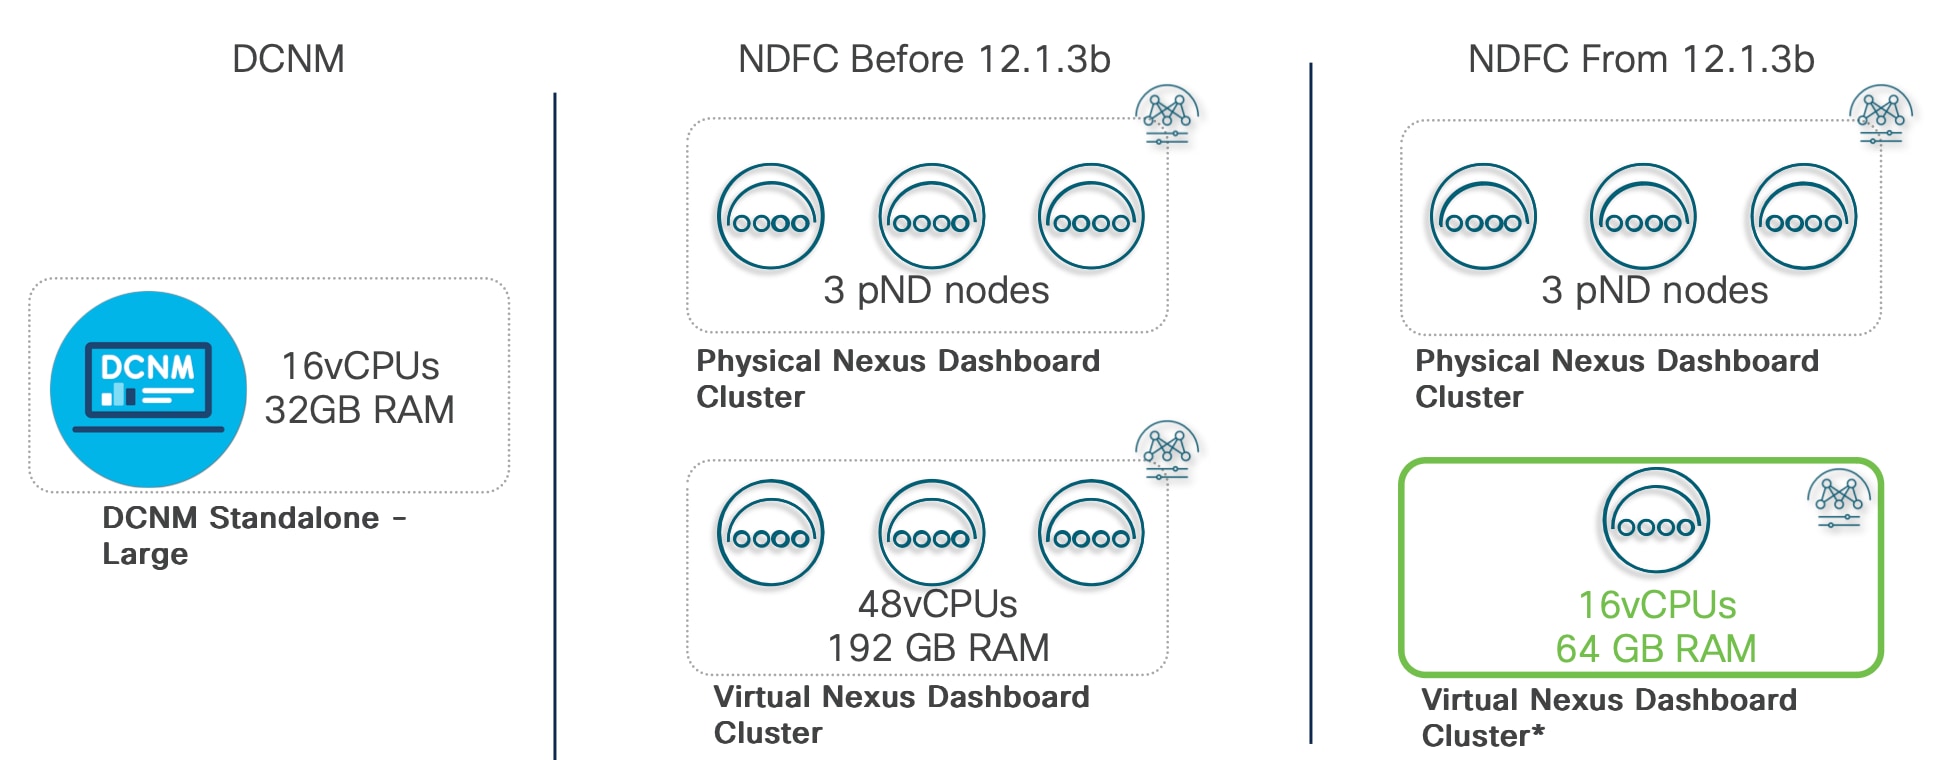
Figure 46: Minimum Requirements for a Single-Node Virtual Nexus Dashboard Deployment vs DCNM
The deployment language between DCNM and NDFC differs as well. DCNM had 3 deployment methods:
· Standalone: a single node deployment without HA.
· Native HA: a dual node deployment with Active-Standby failover.
· Cluster deployment: containers run in the compute nodes, with an active/standby redundancy for the controllers.
NDFC, in contrast, has 2 deployment methods:
· Single node: beginning with NDFC 12.1.3b and available only on the NDFC application, this has a limited scale. Application backups are mandatory for this deployment method.
· Cluster: this is the original NDFC deployment option, with a minimum of 3 master nodes (all active). Depending on your scale and platform type, additional nodes may be added.
When it comes to planning your upgrade and migration, there are two main paths to consider; migrating to the newest version of NDFC (12.2.2), on the Unified Nexus Dashboard (starting with the ND 3.2 release), or migrating to the previous version of NDFC (12.1.x), which runs on the Nexus Dashboard but is still a separate product. Your decision will depend on what works best for your use case(s) and environment. Regardless of which path you choose to follow, the upgrade procedure is smooth and does not require any network downtime.
We will focus first on migrating to Unified ND.
DCNM to NDFC Migration on Unified ND (NDFC Version: 12.2.2)
NDFC on Unified ND supports a migration or upgrade option for customers using the DCNM 11.5(4) release. Upgrading directly to NDFC on Unified ND offers several key benefits. These include an integrated, unique look and feel across all DC applications, as well as better resiliency and performance, provided by Nexus Dashboard with NDFC running as a guest application on top. NDFC 12.2.2 requires an ND 3.2 deployment.
For detailed instructions on how to perform the upgrade from DCNM 11.5(4) to NDFC 12.2.1 (available through Unified ND), refer to the “Migrating from DCNM to NDFC” chapter in the Cisco Nexus Dashboard and Services Deployment and Upgrade Guide, Release 3.2.x . To check fabric requirements, refer to the “Prerequisites: Fabric Controller” chapter in the same guide. Please note that some features and configurations in DCNM will not be carried over to NDFC, which may result in configuration and/or data loss.
Once you have reviewed the deployment guide, proceed with the initial ND installation (remember: download/deploy ND 3.2). The installation process will be very similar to the deployment process described in this guide, with one key difference—you will have the option to enable NDFC during initial ND deployment. For detailed instructions on how to deploy ND 3.2, refer to the ND 3.2 deployment guide.
Once ND and NDFC have been installed, please back up your DCNM instance. Steps are as follows:
1. Run a last Save and Deploy to ensure no configurations are pending.
2. Download the backup tool binary from the Cisco Software Portal and upload it to the DCNM server.
3. Run the script, generate the NDFC readable backup, and download it.
4. Download your DCNM backup.
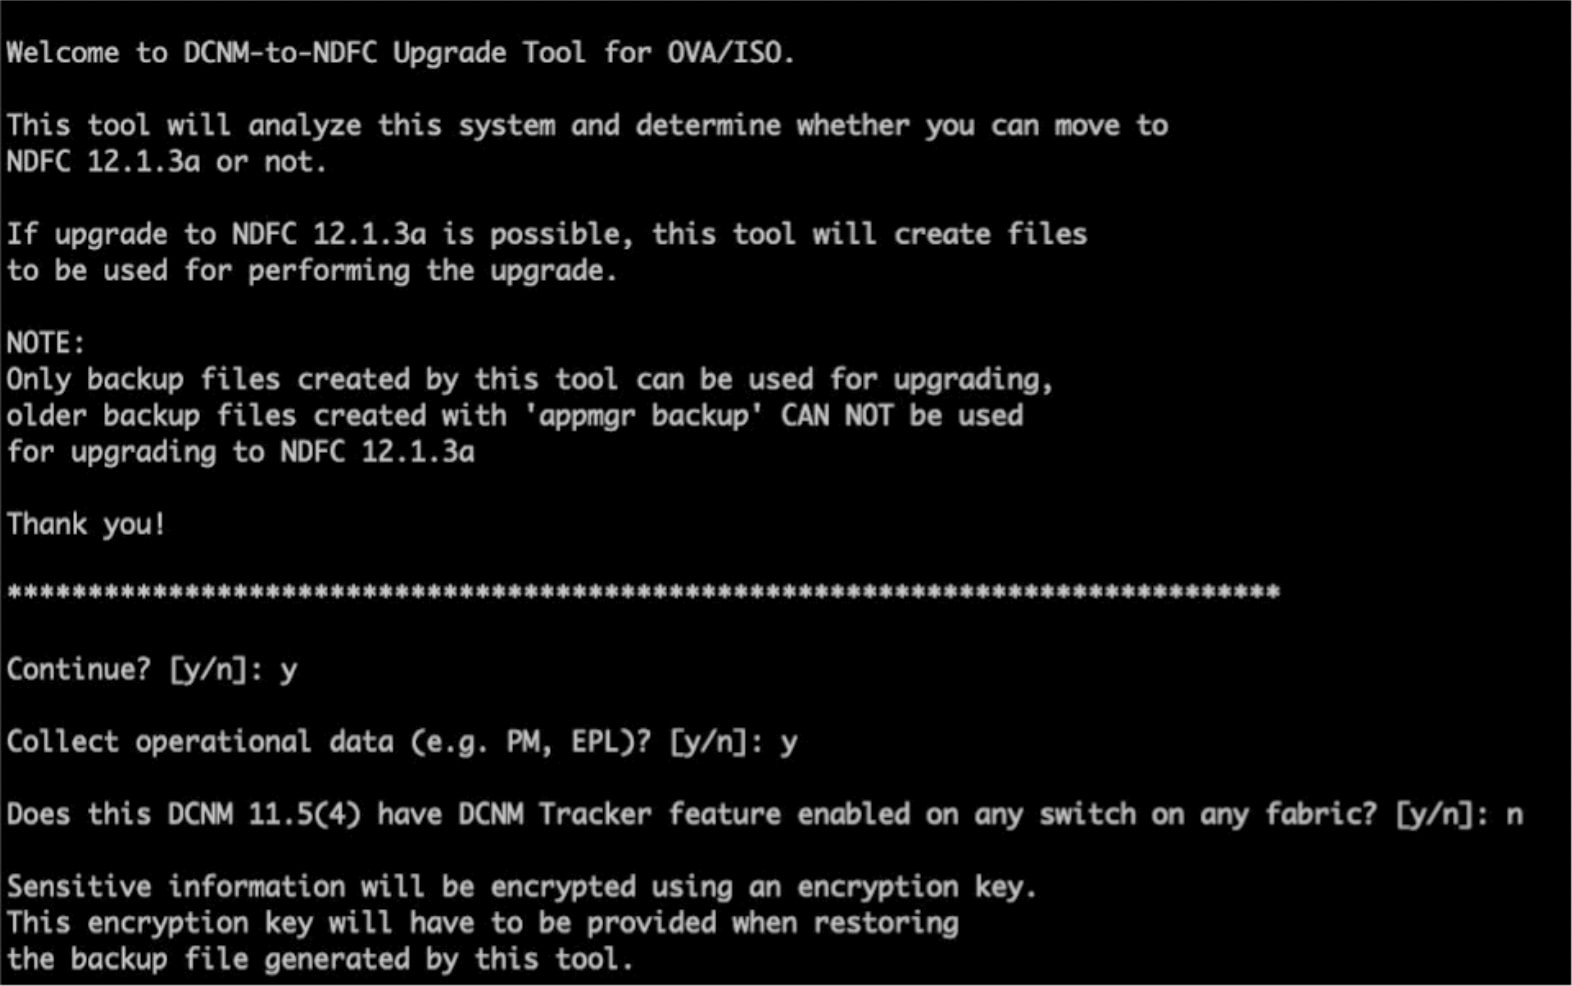
Figure 47: DCNM to NDFC Upgrade Tool CLI.
Note: If the DCNM IP will be migrated automatically, disconnect your DCNM to avoid IP conflicts. Please verify your IP auto-migration status in the table at the bottom of the migration guide.
Once the DCNM backup has been downloaded and the new NDFC instance has been installed, load the backup into NDFC and provide the encryption passphrase.
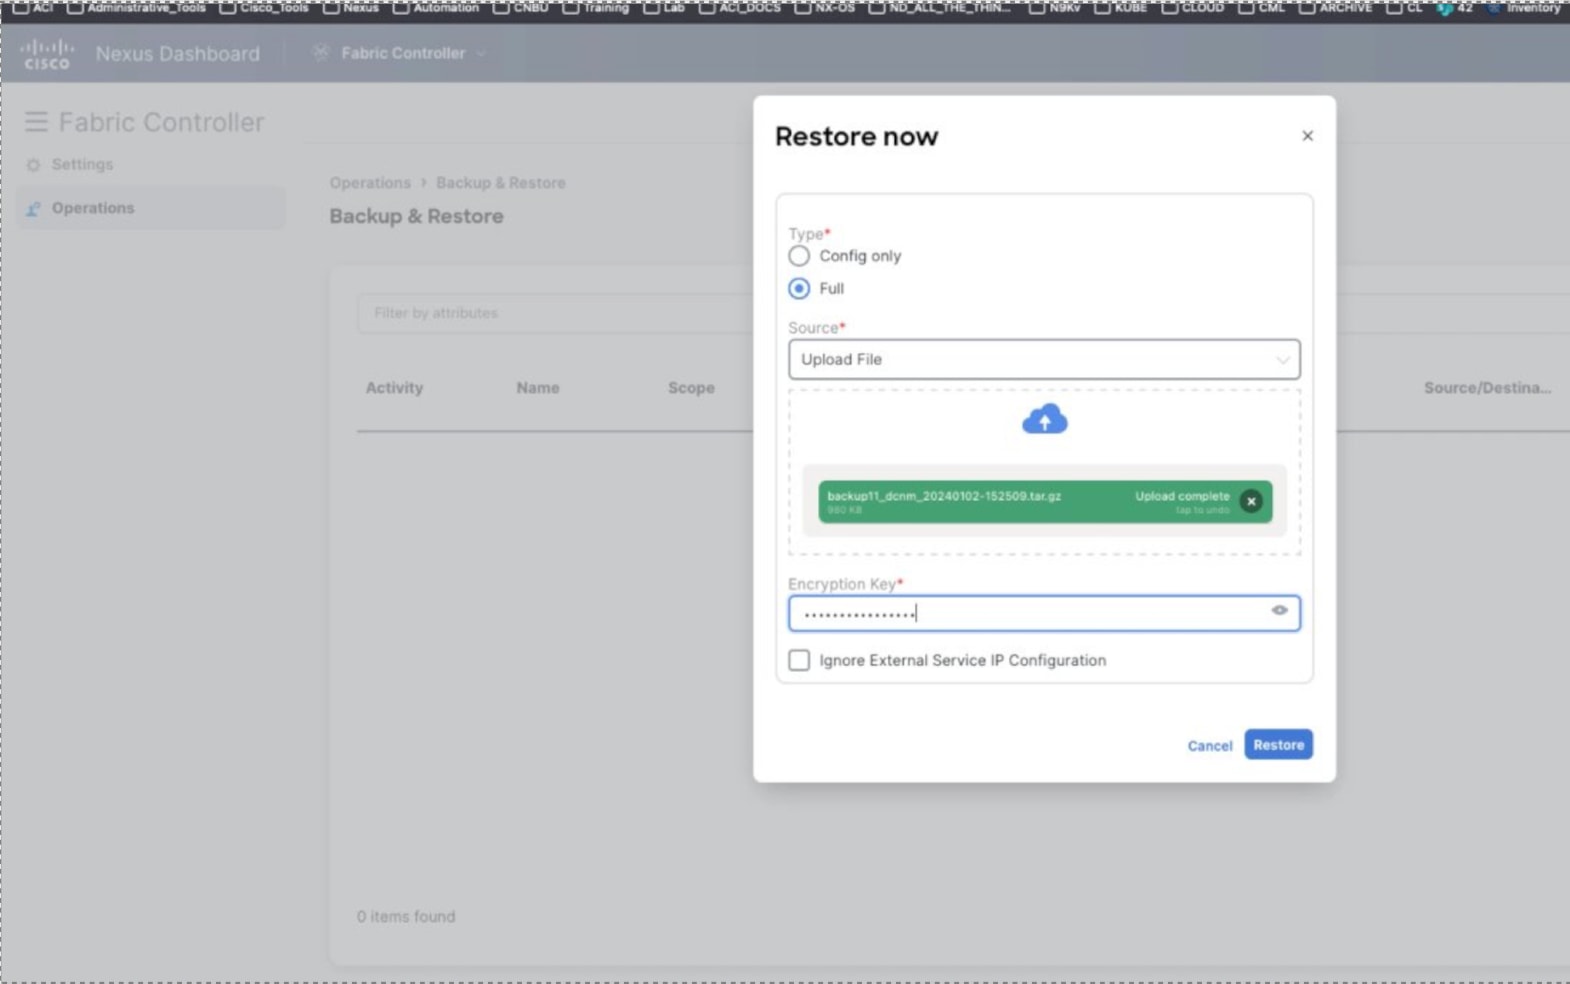
Figure 48: Restore the DCNM Backup to NDFC.
Note: Depending on the number of fabrics and devices, this procedure may take several minutes.
Once the DCNM backup has been deployed on the new NDFC instance, run a recalculate and deploy on every fabric to make sure no configurations are deviating from NDFC intent. If this is the case, verify they are legitimate changes. Next, restore the topology layout, and finally restore the configurations that were not migrated from DCNM.
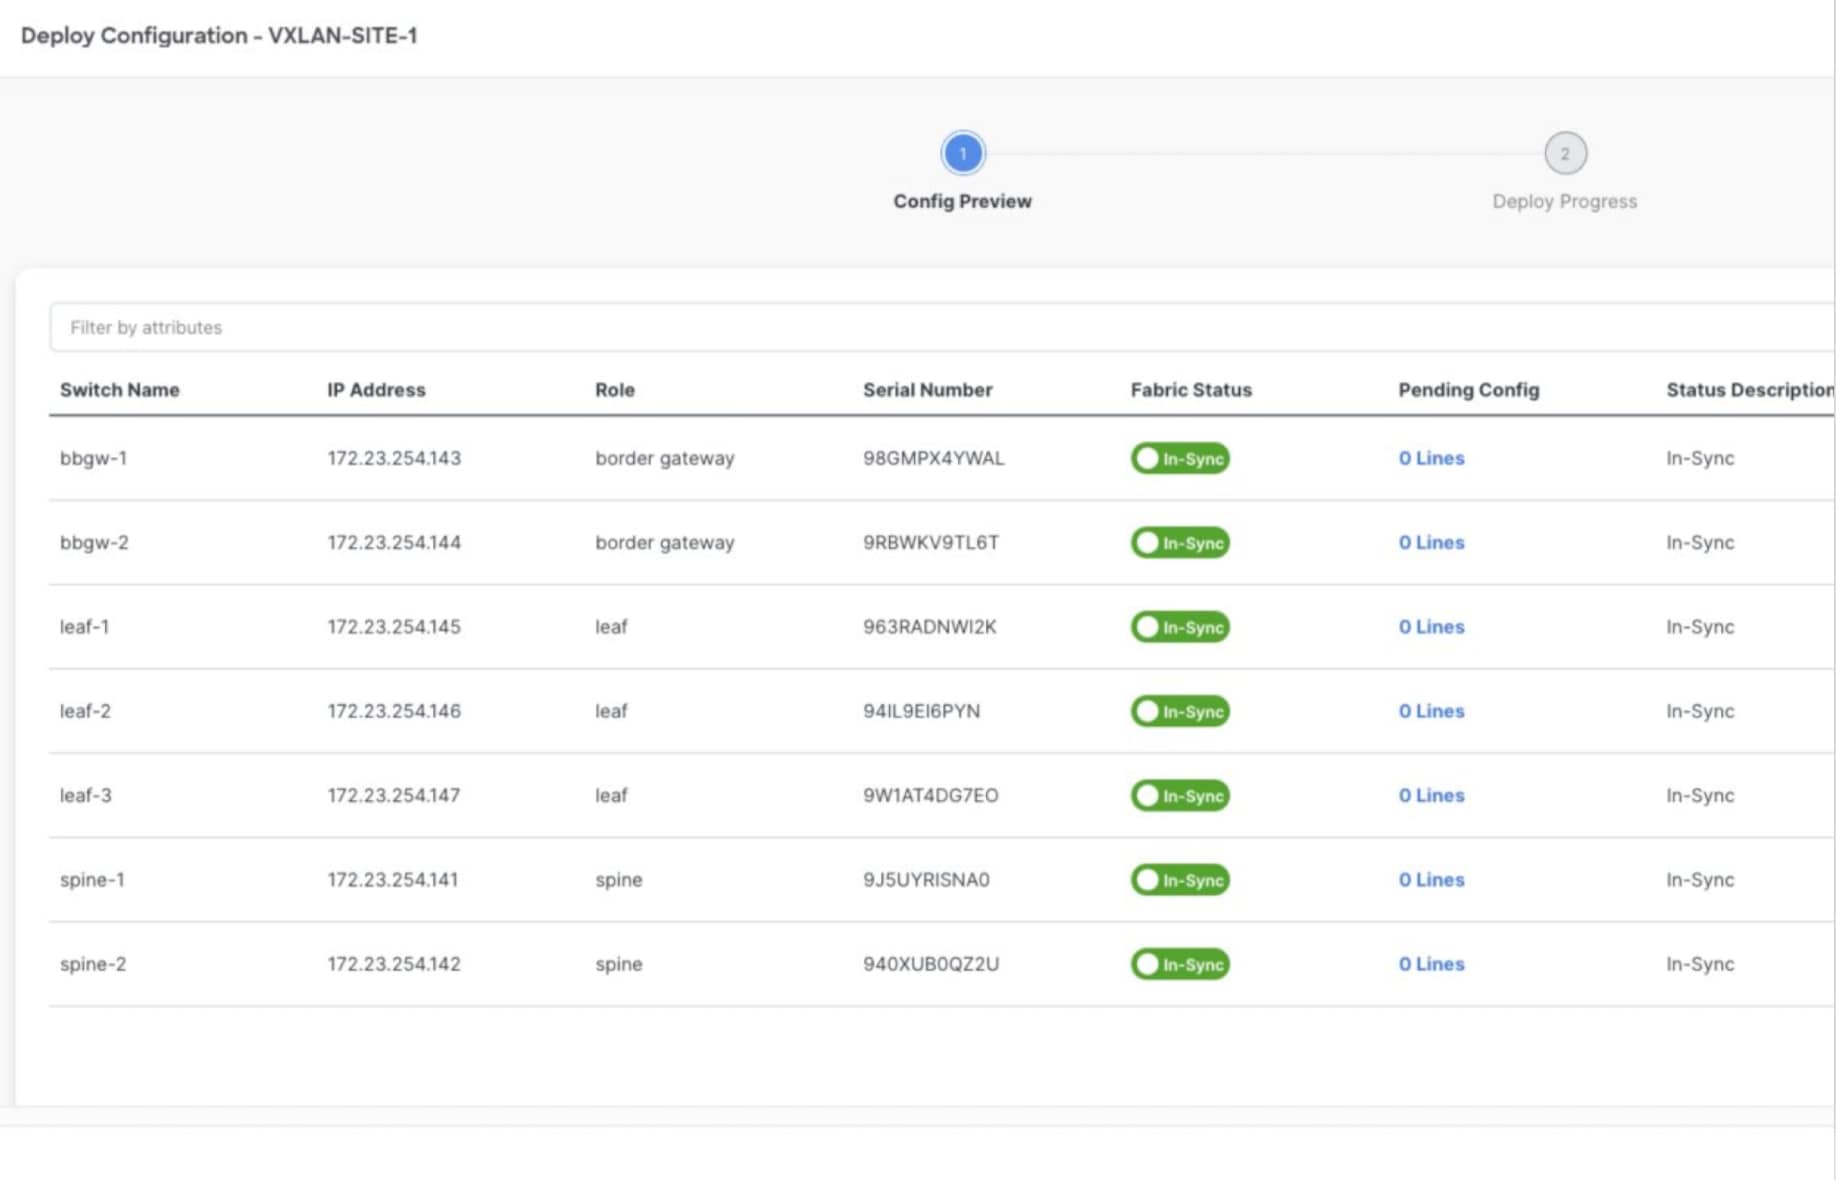
Figure 49: NDFC Config Preview.
DCNM to NDFC Migration on Non-Unified ND (NDFC Version: 12.1.x)
NDFC supports a seamless migration or upgrade option for LAN, SAN, and IPFM customers using the DCNM 11.x release. At a high level, this requires a backup to be taken on the DCNM 11.x instance, which in turn can then be fully restored on a new NDFC instance deployed on a Nexus Dashboard cluster. For detailed instructions on how to perform the upgrade from DCNM 11.x to NDFC 12.1.3b, refer to the NDFC 12.1.3 Installation and Upgrade guide.
Recall that for DCNM 11.x, there are various deployment options supported for customer deployments.
DCNM SAN:
● DCNM Windows Installer
● DCNM Linux Installer
● OVA/ISO for ESXi
● Appliance (DCNM on SE (Service Engine))
DCNM LAN/IP Fabric for Media:
● OVA/ISO for ESXi
● QCOW2 for KVM
● Appliance (DCNM on SE)
In addition, for LAN environments, standalone, native HA (recommended) and native HA cluster-based DCNM deployments are supported. Upgrades to NDFC 12.0 are supported for all these DCNM 11 deployments. The minimum DCNM version required for NDFC upgrade is 11.5(1).
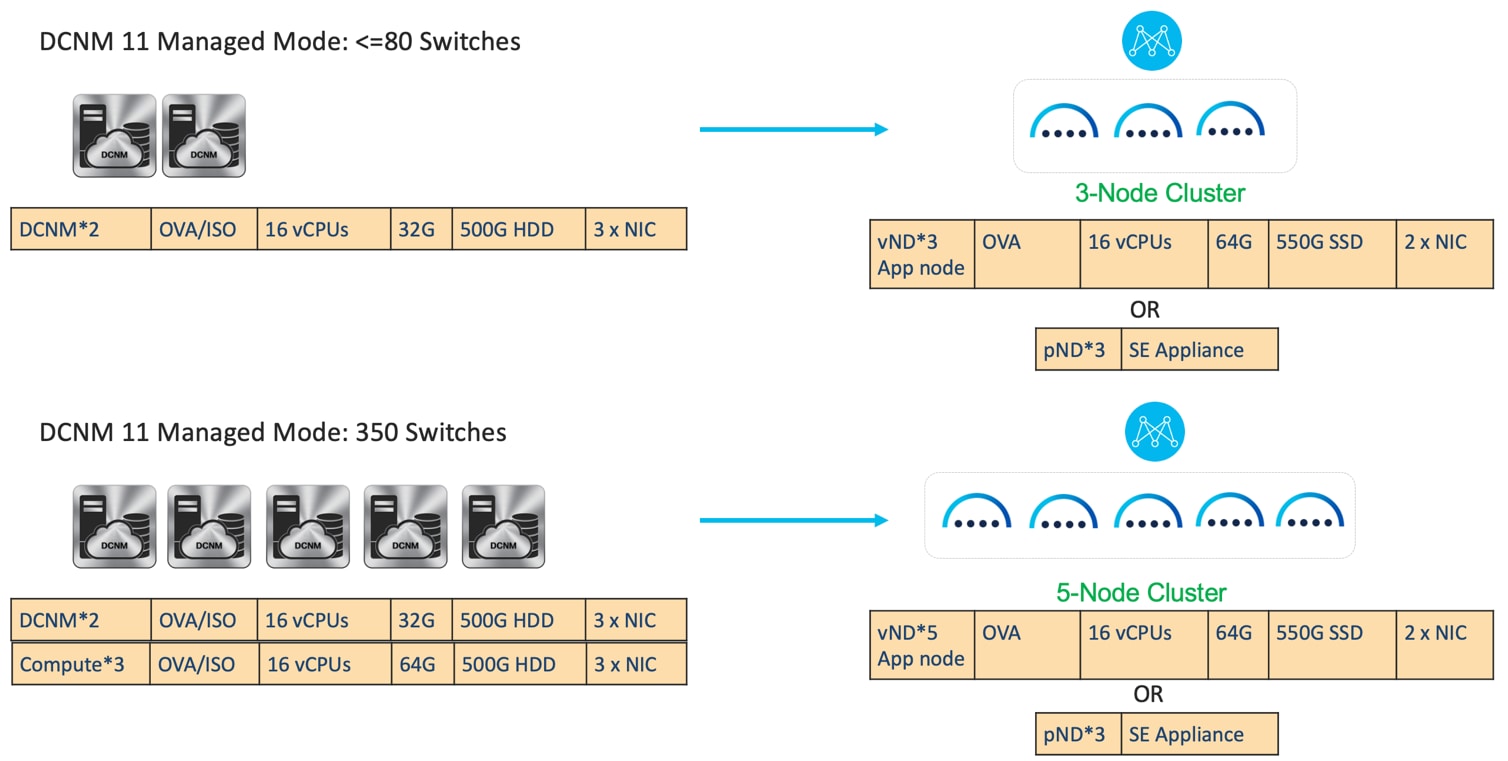
Figure 50: DCNM 11 Managed Mode.
● NDFC 12.0.1 supports up to 80 switches.
● NDFC 12.0.2 supports up to 350 switches
● NDFC 12.1.3b supports up to 1000 switches
This document does not include the system requirements for pND. See Additional Information section for links that provide access to the Cisco websites specific to Nexus Dashboard.
DCNM LAN Standalone to NDFC Migration
Case 1 - eth0/eth1 in different subnets and eth2 is not used
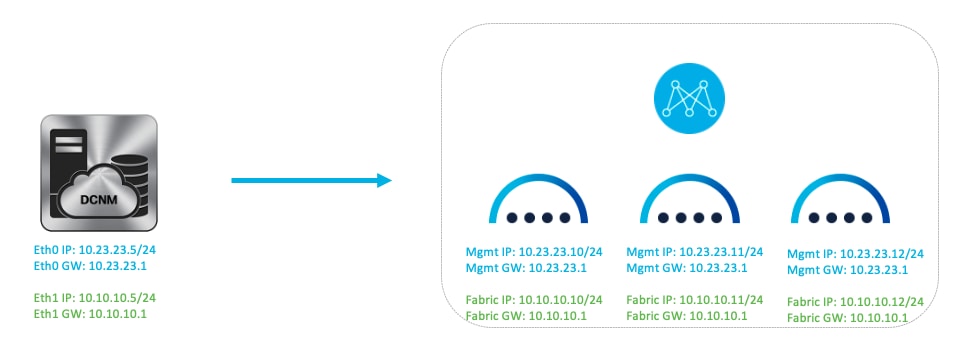
Figure 51: DCNM LAN Standalone to NDFC Migration Case 1
Case 2 - eth0/eth1 are in same subnets and eth2 is not used.
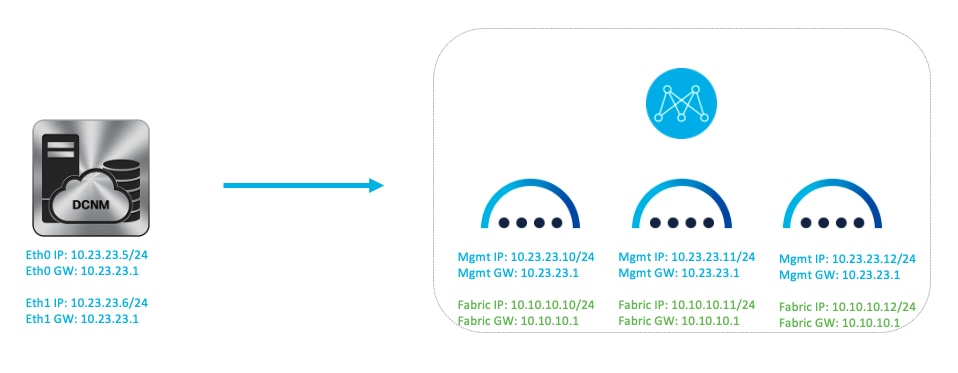
Figure 52: DCNM LAN Standalone to NDFC Migration Case 2.
Case 3 - eth0/eth1 are in different subnets and eth2 is used for In-band
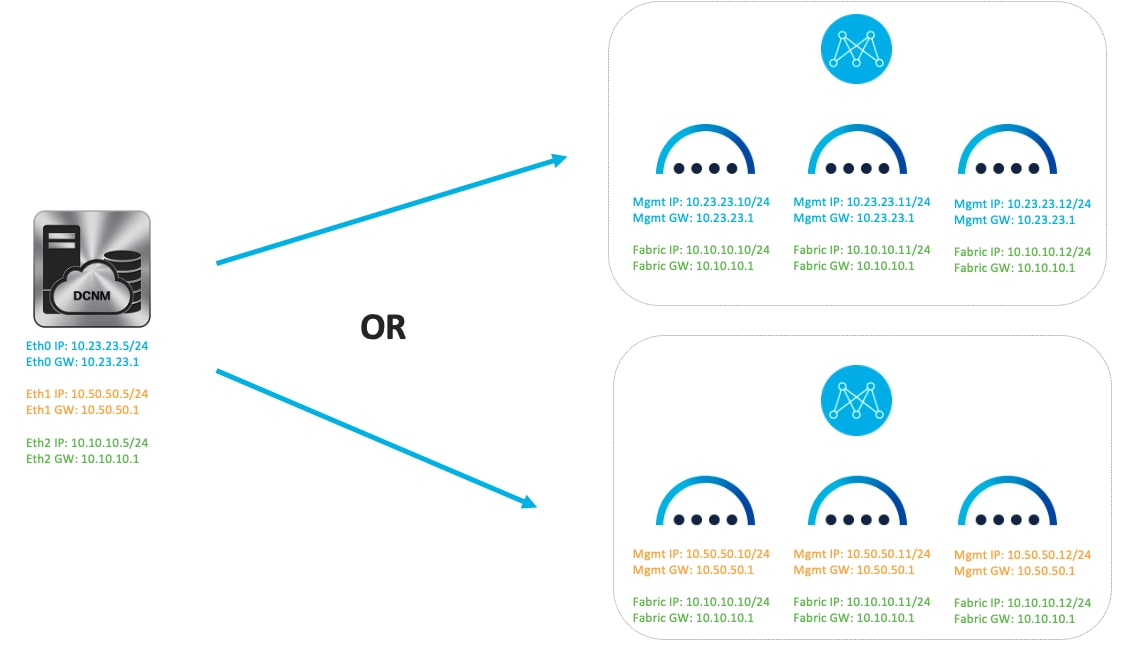
Figure 53: DCNM LAN Standalone to NDFC Migration Case 3.
Case 4 - eth0/eth1 are in same subnet and eth2 is used for In-band.
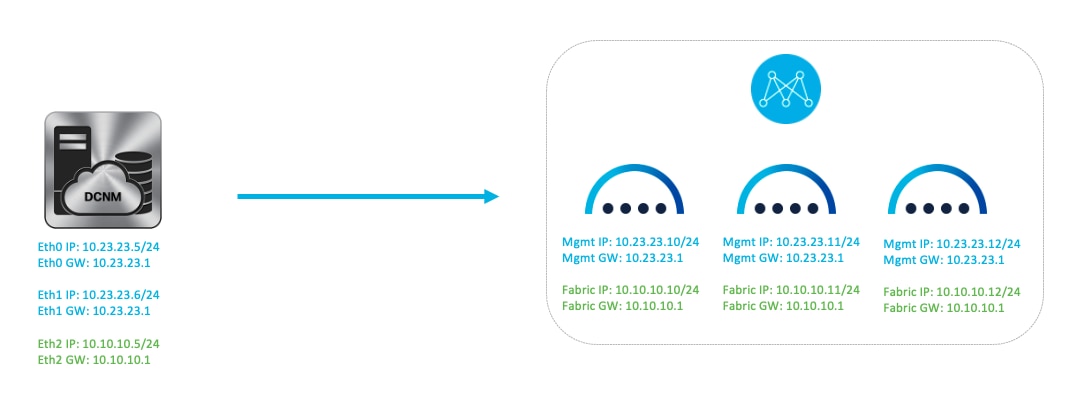
Figure 54: DCNM Figure 1. LAN Standalone to NDFC Migration Case 3.
DCNM LAN Native HA to NDFC Migration
Case 1 - eth0/eth1 are in the different subnets and eth2 is not used
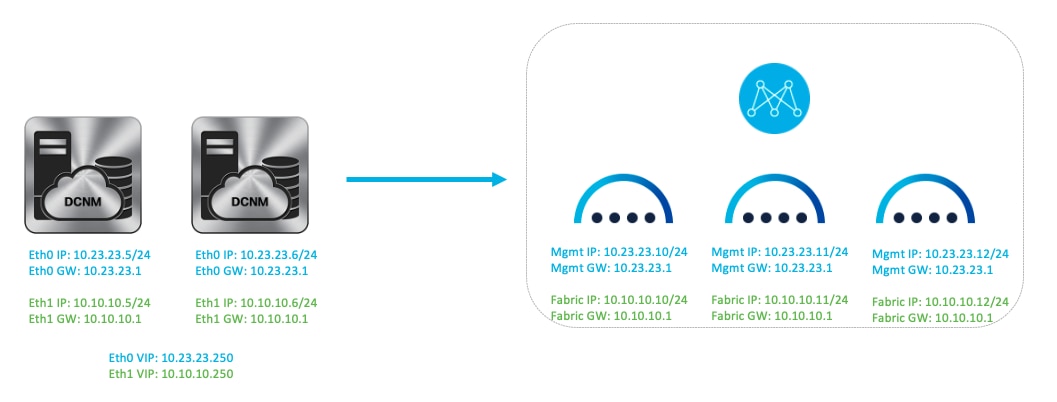
Figure 55: DCNM LAN Native HA to NDFC Migration Case 1.
Case 2 - eth0/eth1 are in the same subnet and eth2 is not used
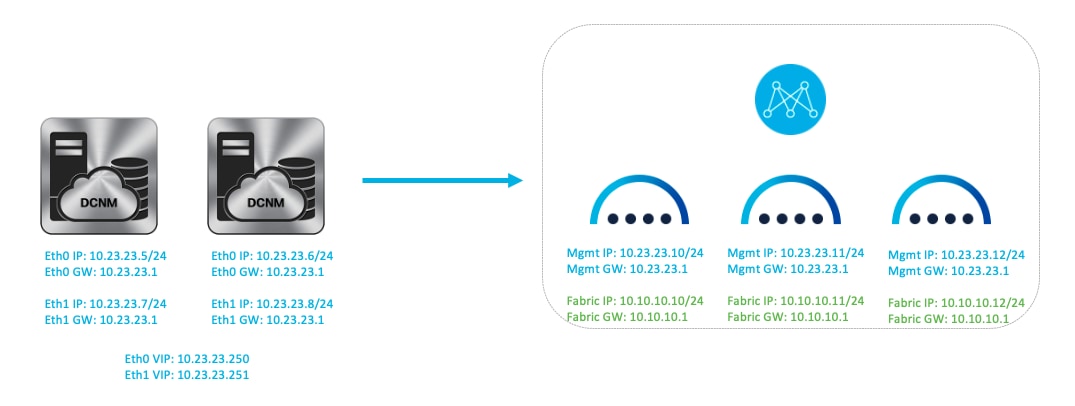
Figure 56: DCNM LAN Native HA to NDFC Migration Case 2.
Case 3 - eth0/eth1 are in different subnets and eth2 is used for In-band
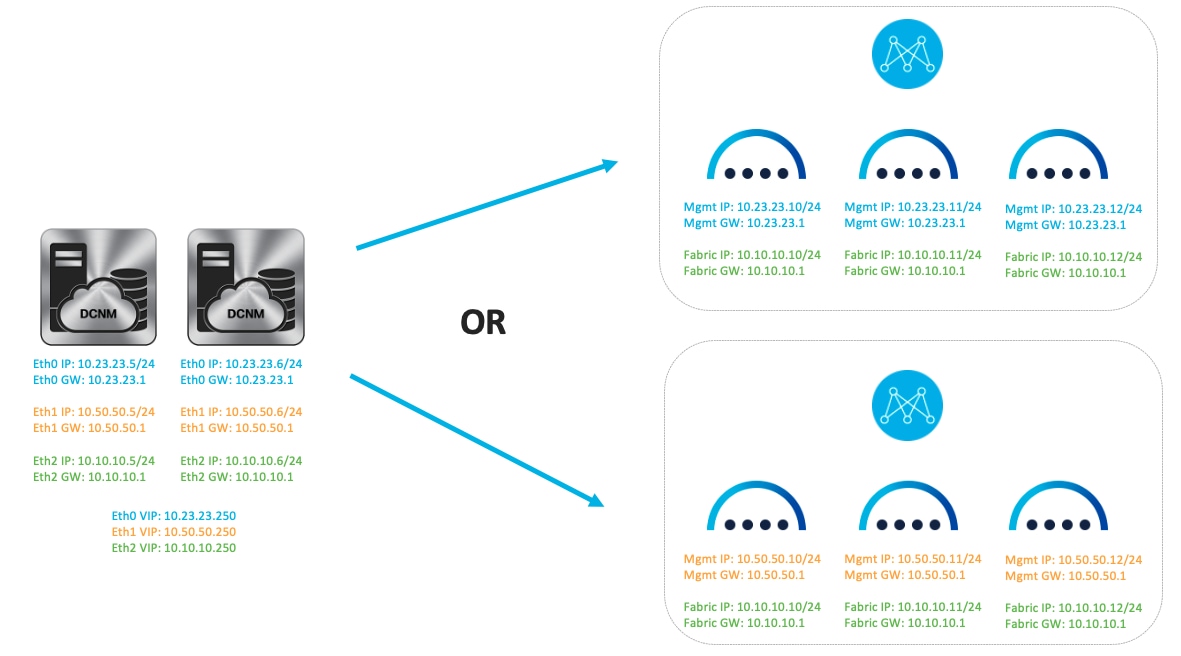
Figure 57: DCNM LAN Native HA to NDFC Migration Case 3.
Case 4 - eth0/eth1 are in same subnet and eth2 is used for In-band
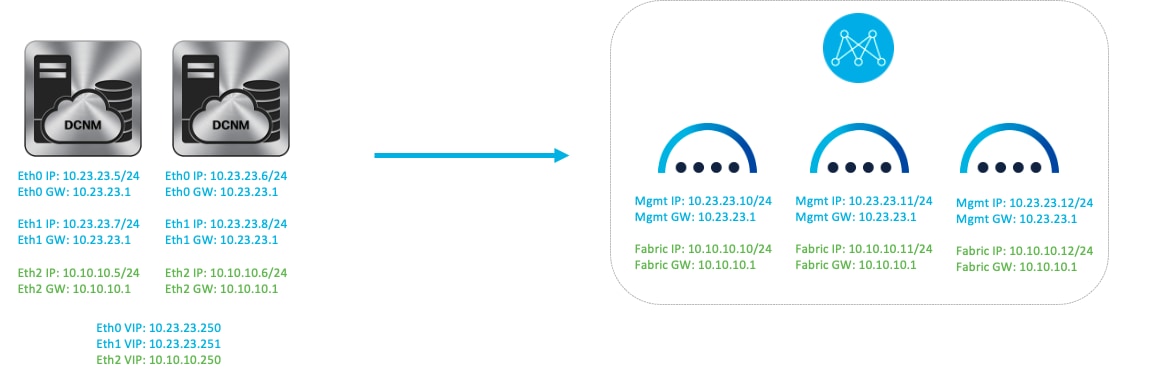
Figure 58: DCNM LAN Native HA to NDFC Migration Case 4.
DCNM LAN Cluster to NDFC Migration
DCNM 11.x Cluster mode supports 350 managed and 750 monitor switches. NDFC 12.0.1a release supports 80 switches with a 3-node deployment. NDFC 12.0.2 supports up to 350 switches with a 5-node vND or 3-node pND. NDFC 12.1.3b release supports 1000 switches with a 5-node vND (app node) and either a 1 or 3-node pND.
Case 1 - eth0/eth1 are in different subnets
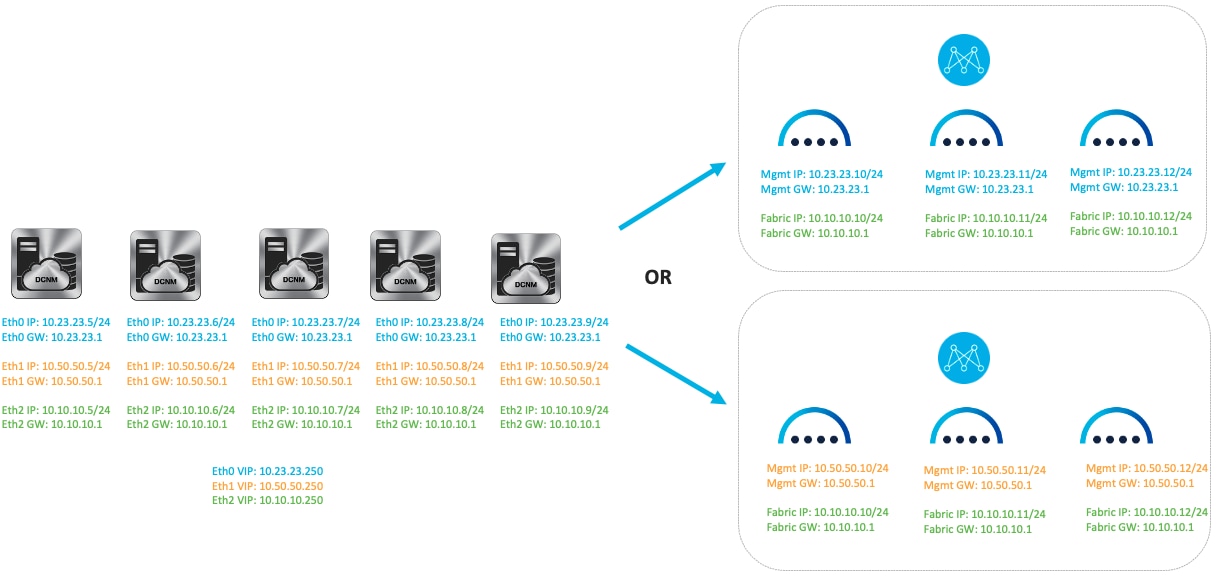
Figure 59: DCNM LAN Cluster to NDFC Migration Case 1.
Case 2 - eth0/eth1 are in same subnet
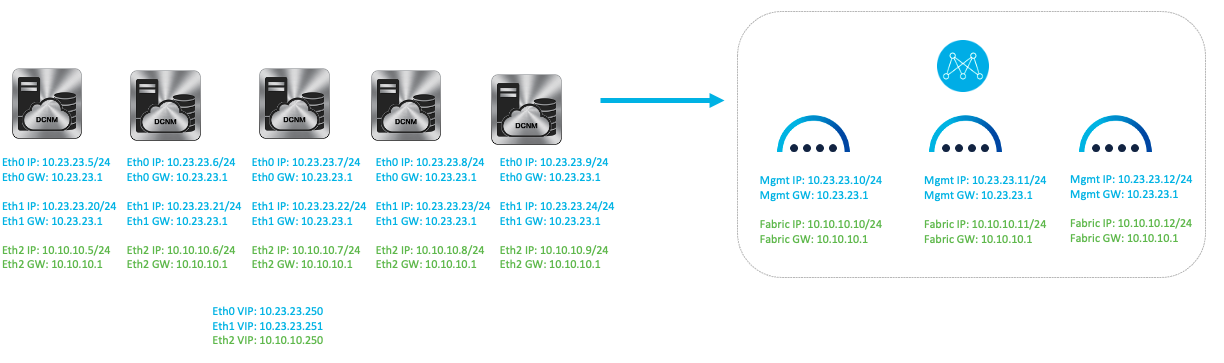
Figure 60: DCNM LAN Cluster to NDFC Migration Case 2.
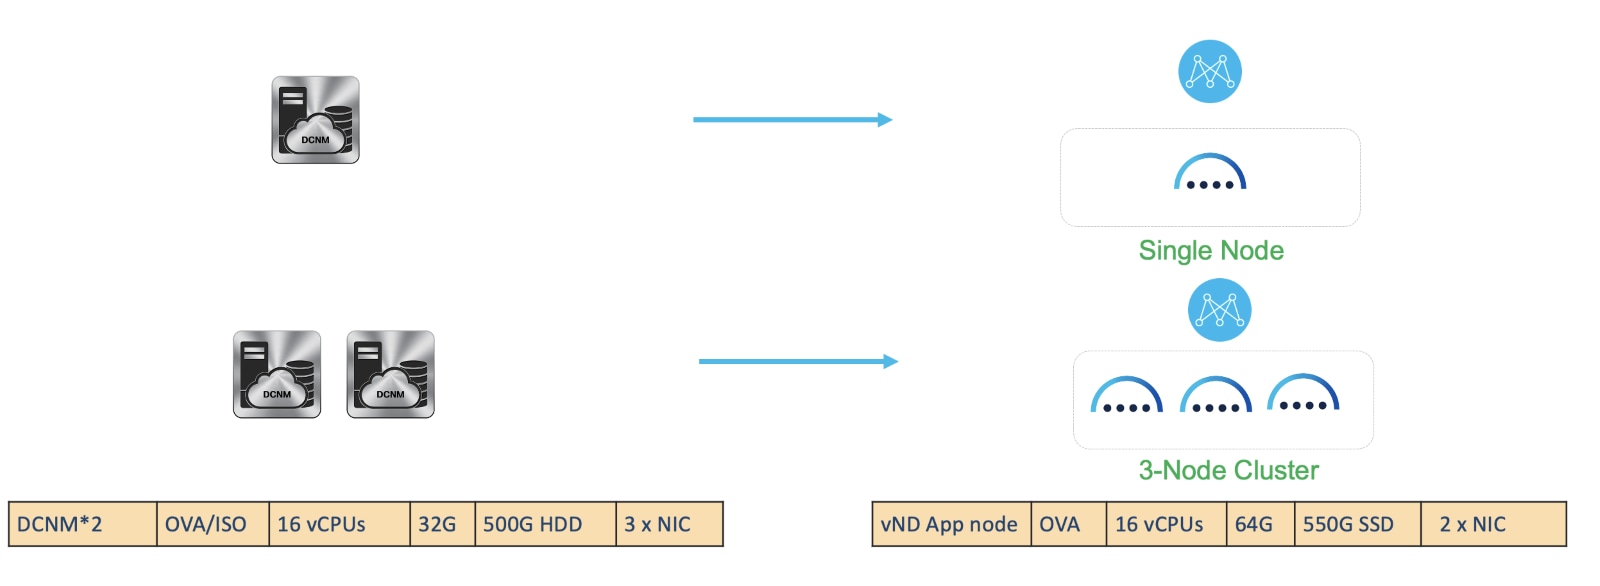
Figure 61: IPFM Fabric Specs.
DCNM IPFM Standalone to NDFC Migration
This document does not cover the scale requirements for IPFM. See the Additional Information section for links that provide access to the Cisco websites specific to the IPFM scalability guide.
Case 1 - eth0/eth1 are in different subnets
Figure 62: DCNM IPFM Standalone to NDFC Migration Case 1.
Case 2 - eth0/eth1 are in same subnet
Figure 63: DCNM IPFM Standalone to NDFC Migration Case 2.
DCNM IPFM Native HA to NDFC Migration
Case 1 - eth0/eth1 are in different subnets
Figure 64: DCNM IPFM Native HA to NDFC Migration Case 1.
Case 2 - eth0/eth1 are in same subnet
Figure 65: DCNM IPFM Native HA to NDFC Migration Case 2.
Figure 66: SAN Fabric Specs.
This document does not cover the scale requirements for SAN. See the Additional Information section for links that provide access to the Cisco websites specific to the SAN scalability guide.
Case 1 - eth0 is used for Web and Device access, eth1 is no used
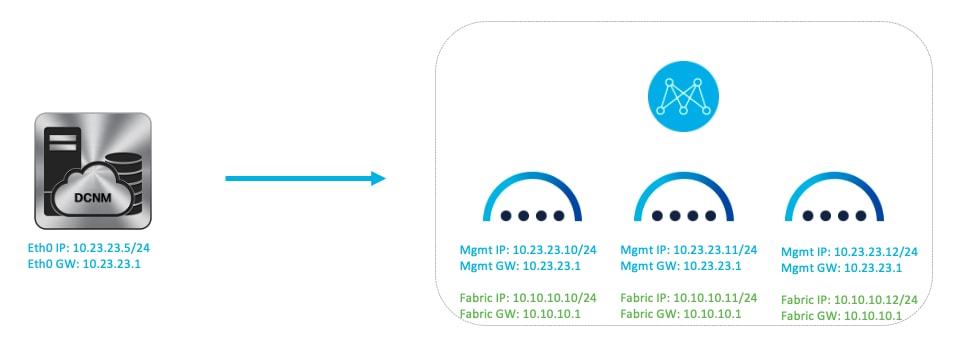
Figure 67: DCNM SAN to NDFC Migration Case 1.
Case 2 - eth0 is used for Web access and eth1 is used for Device access
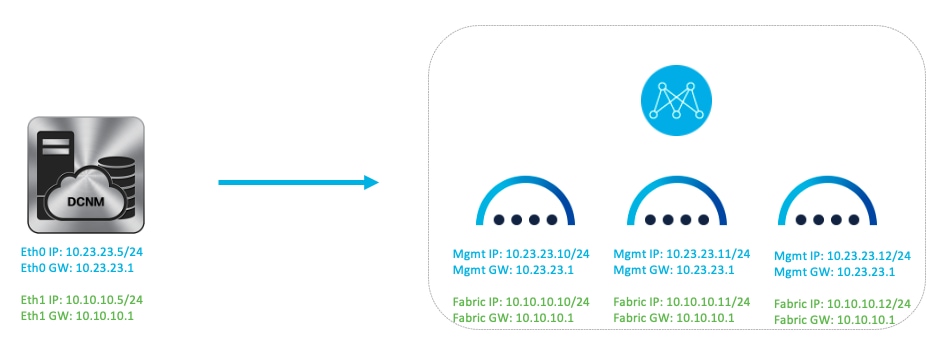
Figure 68: DCNM SAN to NDFC Migration Case 2.
Cisco Nexus Dashboard Controller (NDFC) 12.1.3b introduces pure-IPv6 deployment and management capability, in addition to the preexisting pure-IPv4 and dual-stack options. The cluster’s operational mode must be specified during the initial Nexus Dashboard deployment, and it must have a uniform IP configuration. If you want to change your cluster’s operational mode (for example, from pure IPv4 to dual-stack) after initial configuration, a clean install is required.
A single-node ND cluster deployment supports an NDFC LAN Controller lab deployment (≤25 switches), while a minimum of three ND nodes is required for all NDFC LAN Controller production deployments. Once you have deployed your Nexus Dashboard nodes and bootstrapped your cluster configuration, you then have the option to configure your persistent IP addresses, download and enable NDFC on your ND instance, select its feature management capability, and begin taking advantage of its many functionalities.
If you are still running on DCNM, you can upgrade your system directly from DCNM to NDFC (version-dependent). The upgrade procedure is straightforward, smooth, and does not require any network downtime.
Glossary
BGP: Border Gateway Protocol
CLI: Command Line Interface
DHCP: Dynamic Host Configuration Protocol
DNS: Domain Name System
EPL: Endpoint Locator
GUI: Graphical User Interface
HA: High Availability
IB: In-Band
IPFM: IP Fabric for Media
NDFC: Nexus Dashboard Fabric Controller
NTP: Network Time Protocol
OOB: Out-of-Band
PMN: Programmable Media Network
pND: Physical Nexus Dashboard Cluster
PTP: Precision Time Protocol
SAN: Storage Area Networking
SCP POAP: Secure Copy Protocol PowerOn Auto Provisioning
SMTP: Simple Mail Transfer Protocol
SNMP: Simple Network Management Protocol
SNMP Trap: Simple Network Management Protocol Trap
SVI: Switched Virtual Interface
vND: Virtual Nexus Dashboard Cluster
vPC: virtual Port Channel
VRF: Virtual Routing and Forwarding
Additional Information
Additional documentation about Cisco Nexus Dashboard and Cisco Nexus Fabric Controller and related topics can be found at the sites listed here.
ND 3.0.1 Deployment Guide: https://www.cisco.com/c/en/us/td/docs/dcn/nd/3x/deployment/cisco-nexus-dashboard-deployment-guide-301.html
ND 3.0.1 User Content: https://www.cisco.com/c/en/us/td/docs/dcn/nd/3x/collections/nd-user-content-301.html
ND 3.2.x Deployment Guide: https://www.cisco.com/c/en/us/td/docs/dcn/nd/3x/deployment/cisco-nexus-dashboard-and-services-deployment-guide-321/nd-deploy-physical-32x.html
Nexus Dashboard Fabric Controller
NDFC 12.1.3b Release Notes: https://www.cisco.com/c/en/us/td/docs/dcn/ndfc/1213/release-notes/cisco-ndfc-release-notes-1213.html
Compatibility Matrix: https://www.cisco.com/c/dam/en/us/td/docs/Website/datacenter/dcnm-compatibility/index.html
NDFC 12.1.3b Scalability Guide: https://www.cisco.com/c/en/us/td/docs/dcn/ndfc/1213/verified-scalability/cisco-ndfc-verified-scalability-1213.html
NDFC Configuration Guide Library: https://www.cisco.com/c/en/us/support/cloud-systems-management/prime-data-center-network-manager/products-installation-and-configuration-guides-list.html
Migrating from DCNM to NDFC, 12.2.2 Release: https://www.cisco.com/c/en/us/td/docs/dcn/nd/3x/deployment/cisco-nexus-dashboard-and-services-deployment-guide-321/nd-upgrade-dcnm.html
Upgrading from DCNM to NDFC, 12.1.3 Release: https://www.cisco.com/c/en/us/td/docs/dcn/ndfc/1213/installation/cisco-ndfc-install-and-upgrade-guide-1213/upgrading-ndfc.html#concept_pqb_yzz_fyb
Cisco and the Cisco logo are trademarks or registered trademarks of Cisco and/or its affiliates in the U.S. and other countries. To view a list of Cisco trademarks, go to this URL: http://www.cisco.com/go/trademarks. Third-party trademarks mentioned are the property of their respective owners. The use of the word partner does not imply a partnership relationship between Cisco and any other company. (1721R)
Any Internet Protocol (IP) addresses and phone numbers used in this document are not intended to be actual addresses and phone numbers. Any examples, command display output, network topology diagrams, and other figures included in the document are shown for illustrative purposes only. Any use of actual IP addresses or phone numbers in illustrative content is unintentional and coincidental.
© 2022-2023 Cisco Systems, Inc. All rights reserved.