Get Started

This section contains the key workflows and an overview of Change Automation and Health Insights dashboard:

Getting started

After installing the Change Automation and Health Insights applications, there are a few initial steps that administrators must complete to ensure the application is properly configured and ready for use. For installation details, see the Cisco Crosswork Network Controller Installation guide.

Change Automation can be used independently or as part of workflows that leverage Health Insights or other applications.

Before you begin:

This initial setup includes configuring system settings, assigning appropriate user access levels, creating device access groups, and device tags. The following sections provide detailed guidance on each of these steps.

Verify installation and configure system settings

This section describes the system settings that must be configured to begin using Change Automation.

Change Automation provides several ways to run playbooks. As part of the initial activation process, you will need to select your preferred method for running playbooks.

  • Manually ("on demand") or via scheduled execution. These two methods are typically used for playbooks that accomplish data collection, configuration changes, or SMU deployment independent of any KPI-related fault detected in the network.

  • Manually or automatically when the playbook is tied to a KPI. These methods are typically used when you want to run a playbook intended to remediate a fault detected in the network. Key parameters needed to run the playbook are populated when the alert tied to the KPI is triggered.

To verify application installation and configure system settings:

  1. Navigate to Network automation > Dashboard.

    The first time you access Change Automation, you will see the Welcome to network automation page where the system will prompt you to complete the application's configuration.

    Figure 1. Welcome to network automation
    Welcome to network automation
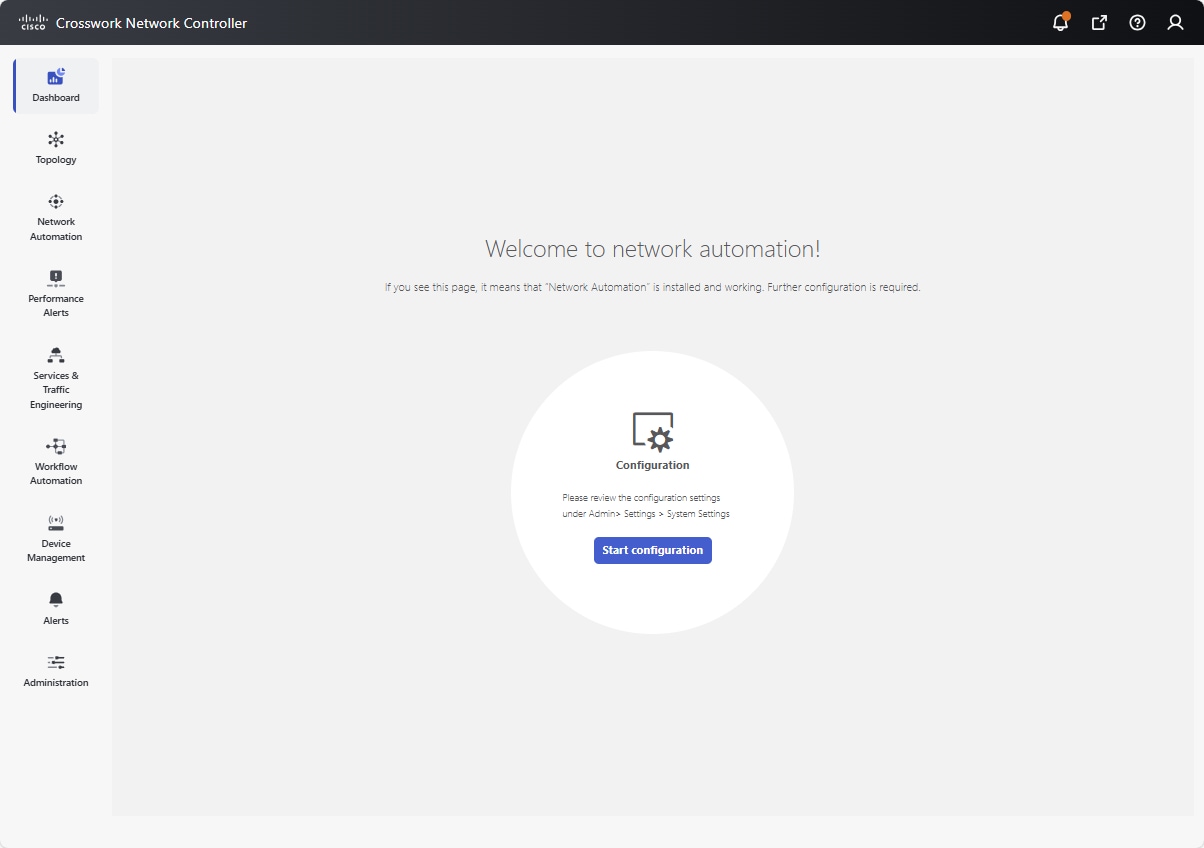
  2. Click Start configuration or optionally, navigate to Administration > Settings > System settings > Network automation > Device override credentials to make the settings.

    Figure 2. System settings - Device override credentials
    System settings - Device override credentials
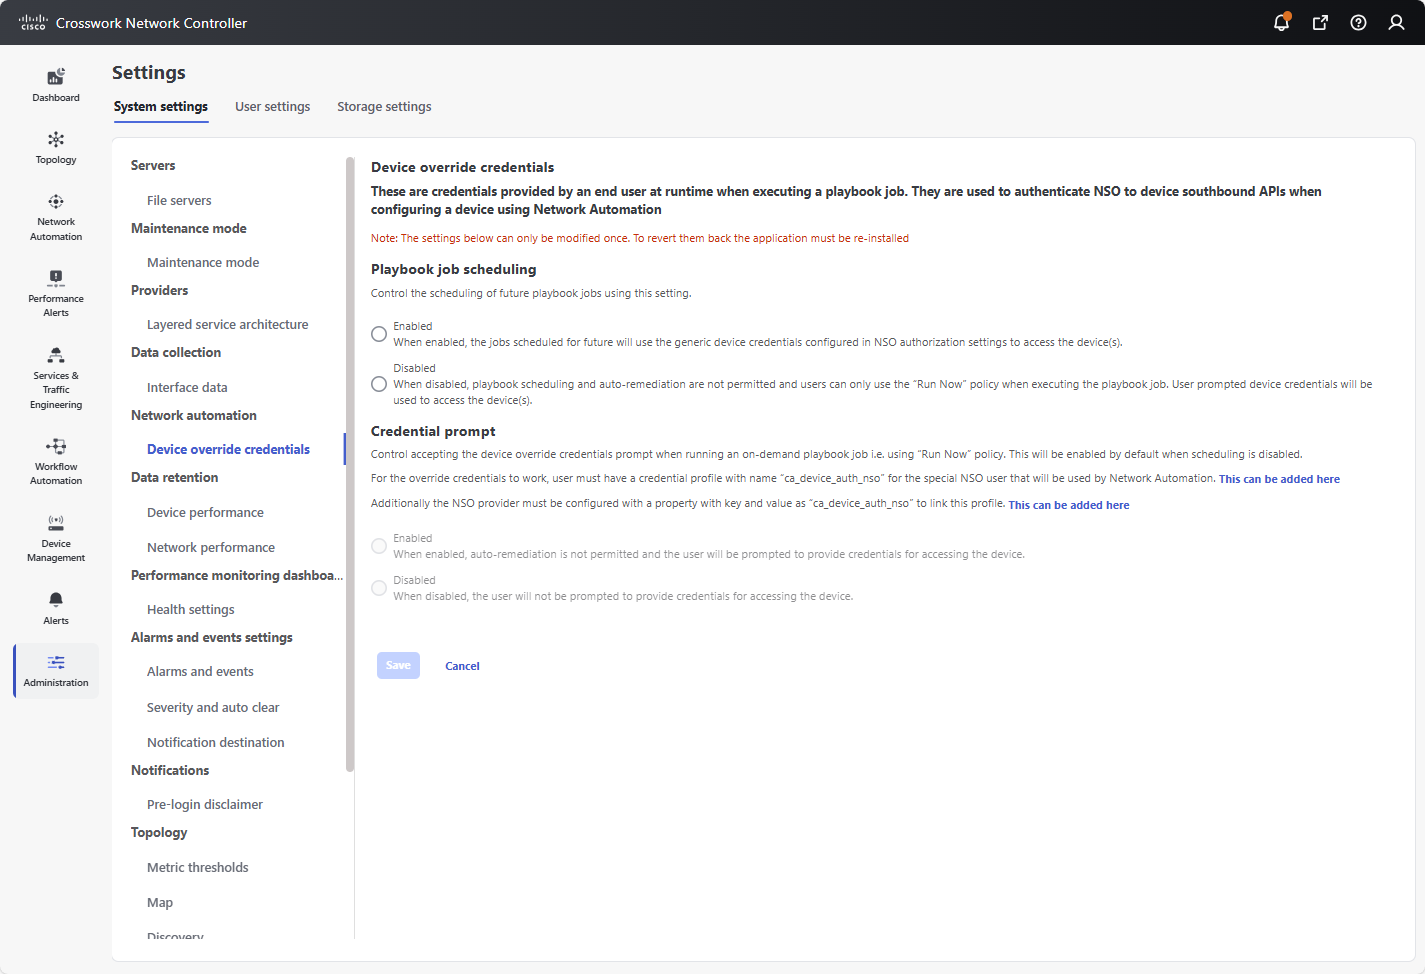
  3. During this initial setup, you will be required to configure device override credential settings for Playbook job scheduling and Credential prompt. These settings work together to determine whether playbooks can be run unattended, either as a scheduled task or as automatic remediation to changes detected in the network by Health Insights.


    Note


    The Change Automation settings can only be configured once. If you need to modify them later, Change Automation must be re-installed. Before re-installing, export any plays or playbooks you have created, and after re-installing, import them. For more information, see Export plays, Import custom plays, Export playbooks, and Import playbooks.


    Playbook job scheduling: This setting enables or disables the ability to schedule playbook jobs.

    Credential prompt: This setting determines whether user interaction is required when running an on-demand playbook.


    Note


    In addition to the administrative user account needed to allow Crosswork Network Controller to communicate with NSO, a second credential profile with name "ca_device_auth_nso" must be created for the override credentials to work when running playbooks. For details on creating credential profile in NSO, see Cisco Crosswork Change Automation NSO Function Pack Installation Guide.


    If Playbook job scheduling is...

    and the Credential prompt is...

    This will...

    enabled

    disabled

    enable both automatic playbook scheduling and auto-remediation. With this setting:

    • future jobs will use generic device credentials configured in Cisco NSO to access the devices.

    • you will not be prompted to provide credentials for accessing the device.

    • the system will be able to automatically detect network issues and take corrective actions without requiring manual intervention.

    • you can run playbooks automatically whenever the KPI linked to that playbook raises an alert of sufficient severity.

    enabled

    enabled

    only enable automatic playbook scheduling. With this setting:

    • automatic remediation is not permitted.

    • you will be prompted to provide credentials for accessing the device.

    • future jobs will use generic device credentials configured in Cisco NSO to access the devices.

    • you can run playbooks automatically whenever the KPI linked to that playbook raises an alert of sufficient severity.

    disabled

    enabled (by default)

    disable both automatic playbook scheduling and auto-remediation. With this setting:

    • you can only use Run Now to run the playbook job.

    • you will be prompted to provide credentials for accessing the device.

    • credential prompt is enabled by default and cannot be disabled.

    Special considerations

    • If Credential prompt is enabled: While executing Device Config plays, entering incorrect device override credentials will cause the playbook execution to fail. However, for a Check play or Data Collection play, the device override credentials are not validated and the playbook will execute successfully irrespective of their accuracy.

    • If Credential prompt is disabled: Only user IDs with write permissions for Administration APIs under Change Automation can complete the credential profile and provider setup tasks. If you are unsure if your user ID has the required privileges, you can check by selecting Administration > Users and Roles > Roles and inspecting the ID's privileges.

  4. Once you have made your selections as per your requirements, click Save to commit to these settings.

Assign user access levels

Once the system settings are configured, an administrator should review user roles to ensure that all users have the appropriate level of access required for Change Automation and Health Insights management.

Change Automation API permissions allow users to run, import, and create plays and playbooks. Only users with write permissions for Administration APIs can disable or enable playbook execution access and assign labels.

Health Insights KPI Management APIs allow users to:

  • Create, edit, or delete KPIs and KPI profiles.

  • Monitor the status of KPI-related jobs.

  • Configure alerts to proactively manage network performance.

To enable user access for Change Automation and Health Insights:

Procedure


Step 1

Go to Administration > Users and Roles > Roles.

Step 2

Under the Roles pane, select the role to which you want to grant access.

Step 3

Under Global API permissions, find Change Automation.

Step 4

For Play and Playbook APIs, enable Read and Write check boxes (as necessary).
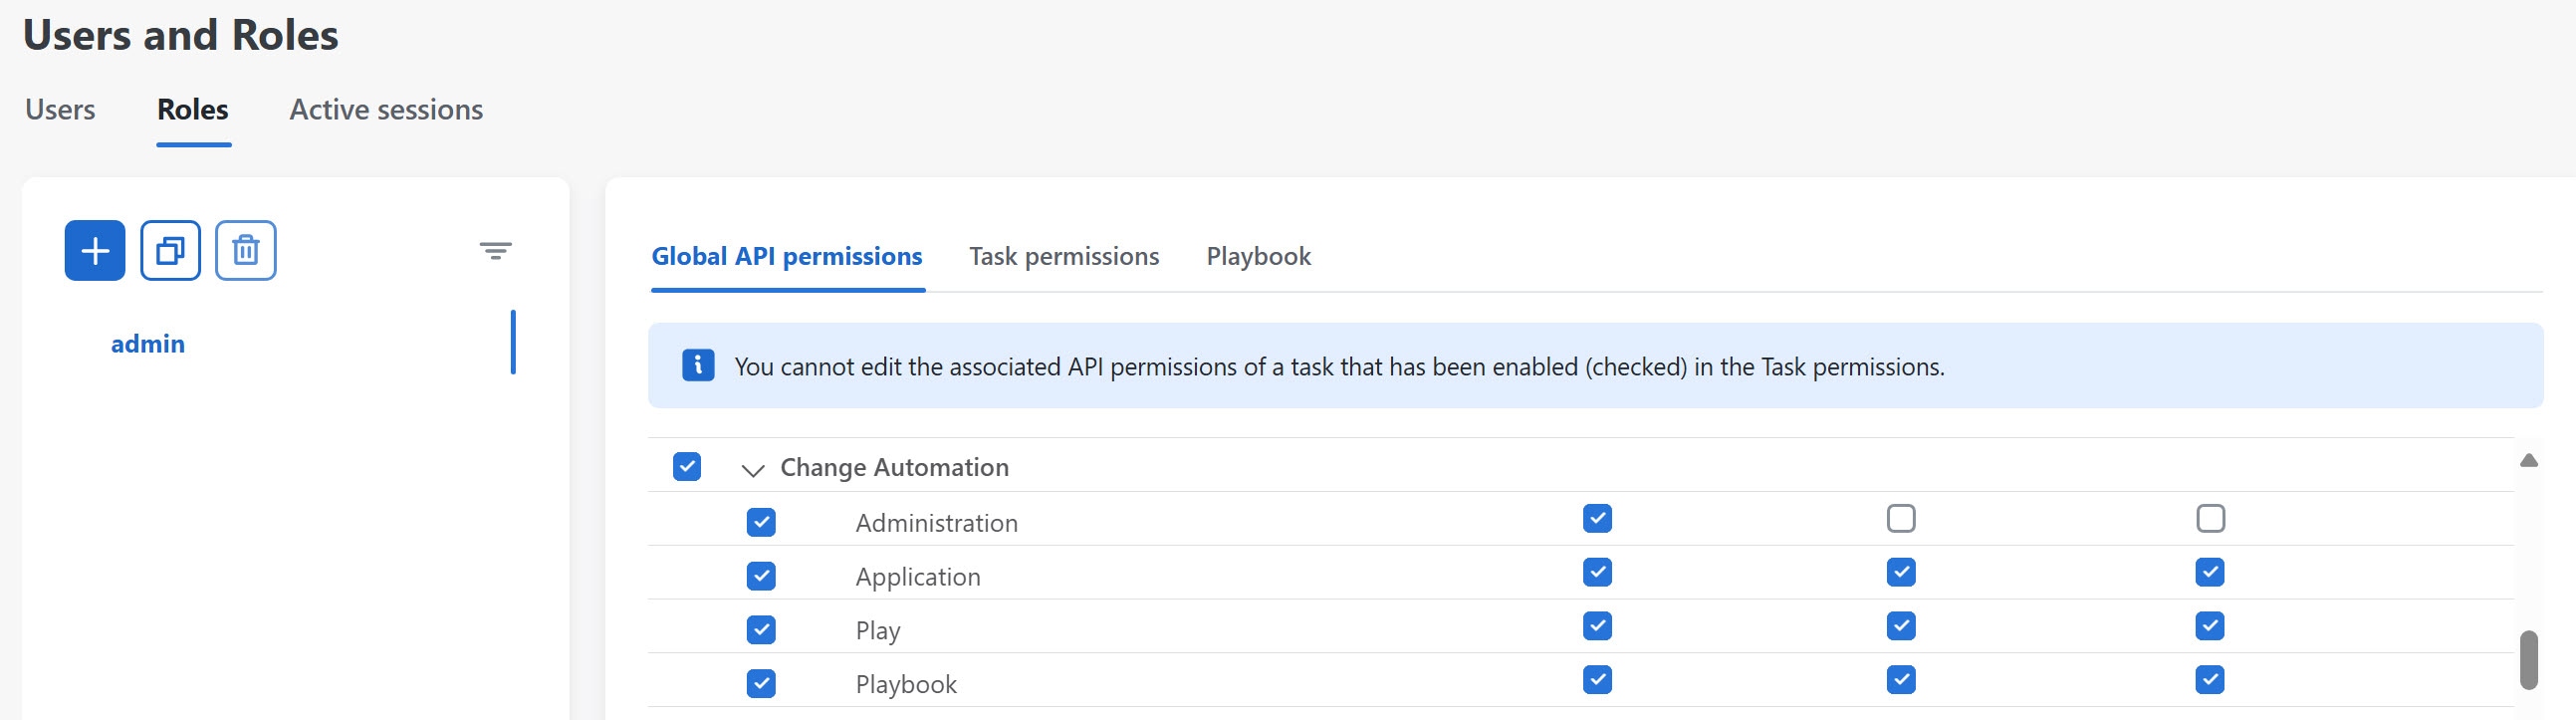
Figure 3. Global API permissions - Change Automation
Global API permissions - Change Automation

Step 5

Scroll down to find Health Insights.

Step 6

For Health Insight KPI Management, enable Read and Write check boxes (as necessary).
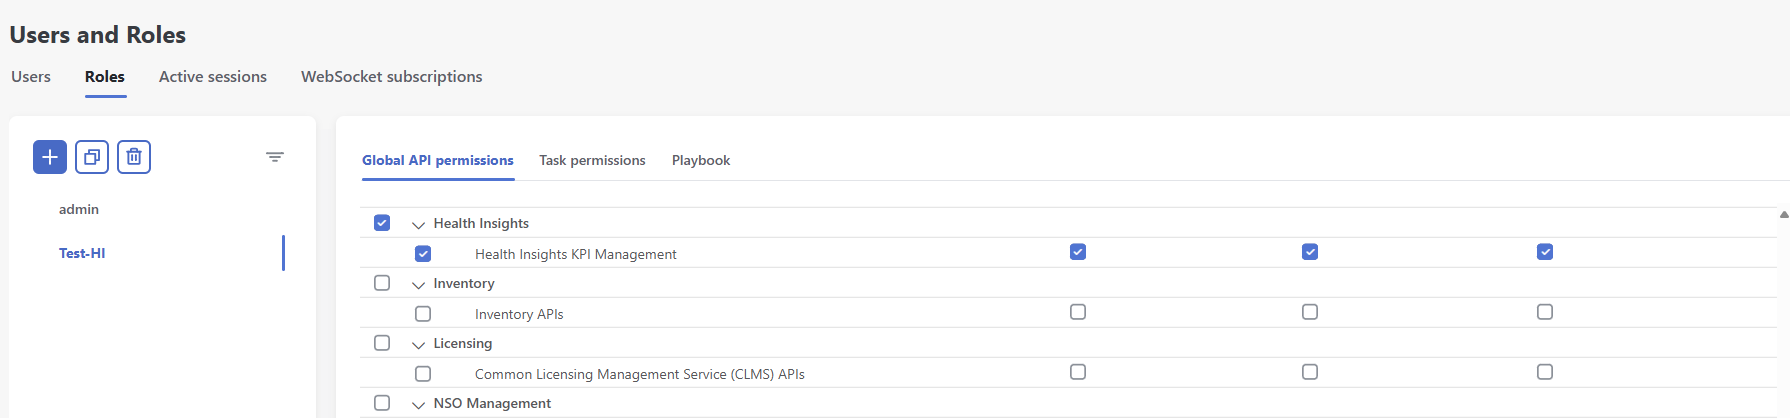
Figure 4. Global API permissions - Health Insights
Global API permissions - Health Insights

Step 7

Click Save.


Create Device Access Groups

After administrators have assigned the required permissions to users, they can further control which devices users are allowed to access and manage. This can be achieved using Device Access Groups, which logically group devices to streamline access control. Non-administrative users with the system-level task of Device Access Groups management can create and manage these groups as needed.

For more information on Device Access Groups and how to associate a user with a Device Access Group, see the Manage Device Access Groups section in the Cisco Crosswork Network Controller Administration guide.

Create device tags

Device tags in Crosswork Network Controller are optional but highly beneficial for organizing and streamlining network management. They allow you to group devices based on shared attributes, making it easier to run playbooks or create KPI profiles. Tags can also provide useful information, such as a device’s physical location or its administrator’s email ID. Once you have a set of devices with the same tag, you can use it to:

  • run playbooks on a specific group of devices. For example, if devices are tagged by region, you can run a playbook exclusively on devices in that region.

  • build KPI profiles tailored to a group of devices. Newly tagged devices are automatically included in the existing KPI profiles, eliminating the need for manual updates.

For more information on creating device tags, see the Manage Tags section in the Cisco Crosswork Network Controller Administration guide.

Using Change Automation

This section outlines various workflow scenarios that illustrate how to effectively use Change Automation. These scenarios demonstrate only a fraction of the capabilities of the Crosswork Network Controller and highlight the platform flexibility. By using these concepts and examples, you can build a virtually unlimited combination of tools to meet your unique operational needs.

Run playbooks manually

The workflow below describes the steps to run playbooks manually.

Workflow Action

1. Select the playbook you want to run. You can choose to run it manually from a list of devices or by leveraging device tags. You also specify the appropriate run-time parameters that you want the playbook to apply.

See About running playbooks

2. Select the playbook execution mode, which determines whether the playbook is being tested and validated or actively executed to gather data or make changes to the device.

See:

3. You can link any Health Insights KPI to your playbook. The playbook will automatically run whenever the linked KPI triggers an alert in response to events like threshold crossings, topology changes, or flapping conditions.

See: Link a playbook to a Health Insights triggered KPIs

Schedule playbooks

The workflow below describes the steps to automate routine network tasks and verify that each routine change is completed correctly.


Note


This workflow is applicable only if scheduling is enabled in the Change Automation settings. For more information, see Verify installation and configure system settings.


Workflow Action

1. Identify routine maintenance tasks (such as throughput checks, software upgrades, SMU installs, and so on) that you perform on a regular schedule, and that may be suitable for automation using one or more Change Automation playbooks.

See About running playbooks and View the playbook list.

2. Configure playbooks to perform these tasks at the desired time. You can choose to run it manually from a list of devices or by leveraging device tags. You also specify the appropriate parameters that you want the playbook to apply and select the execution mode.

See About running playbooks and Schedule playbook runs.

3. Review the Change Automation job history to review the current status of the playbook. If the job fails, the details will be available.

See Use the change automation dashboard and View or abort playbook jobs.

4. If you prefer to run the playbook manually on a scheduled basis, that’s perfectly fine. However, if you have identified scenarios where you would like it to run automatically, you can link the playbook to the KPIs. The playbook will automatically run whenever the linked KPI triggers an alert.

See: Link a playbook to a Health Insights triggered KPIs

Develop custom playbooks

The following workflow will enable you to develop a Change Automation custom play or playbook.

Workflow Action

1. Review the existing plays and playbooks to see if they fully or partially meet your needs.

From the main menu, choose Network Automation > Play List or Playbook List.

2. If required, build new plays and then a new playbook with new or existing plays, as necessary, to meet your requirements.

See About custom plays and About customizing playbooks.

3. Once you have build your playbook, you can decide to run it manually or schedule it to run as an automated routine task.

See:

4. If you prefer to run the playbook manually on a scheduled basis, that’s perfectly fine. However, if you have identified scenarios where you would like it to run automatically, you can link the playbook to the KPIs. The playbook will automatically run whenever the linked KPI triggers an alert.

See: Link a playbook to a Health Insights triggered KPIs

Using Health Insights

Before you begin:

  1. Confirm if the Yang modules provided include the data point you want to evaluate. If the Yang module contains the data you need, then review whether one of the four available KPI templates are adequate to collect data and evaluate the data point.

    • If yes, build a new KPI profile using the existing template.

    • If no, proceed to the next step

  2. If the Yang module contains the data point but there isn’t an existing KPI template to evaluate it, then build a new KPI with the tools available in the developer network (developer.cisco.com).

  3. If the Yang module does not include the data point you need:

    • Get the new Yang module that includes the required data point.

    • Load it on the data collection UI.

    • Build a new KPI.

Monitor device KPIs using Health Insights

The following table describes the steps to monitor device KPIs using Health Insights application.

Workflow

Actions

1. Plan which Cisco-supplied KPIs you want to begin using based on each device's function and the device performance characteristics you want to monitor.

See List of Health Insights KPIs.

To create a new KPI that fits your requirements, see Create a new KPI.

2. Based on your experience or by using the recommendation engine, group the KPIs to form KPI profiles.

See Create a new KPI profile.

3. Enable the appropriate KPI profiles on the devices you want to monitor.

See Enable KPI profiles on devices.

4. Make sure that the collections are provisioned on the device (MDT collections).

See Verify the deployment status of enabled KPIs

Develop custom KPIs

The following workflow describes the steps to determine whether developing custom Health Insights KPIs is necessary for your specific requirements and provides guidance on how to proceed if you choose to create them.

Workflow Action

1. Review the existing KPIs to ensure the telemetry you want to monitor is not already available.

See List of Health Insights KPIs.

2. Review the data available from the devices you want to monitor to see if they can supply the needed information:

  • If they can, proceed with building a custom KPI.

  • If they cannot, we must load a new Yang module.

See Create a new KPI.

3. Determine if the Yang module we have provided includes the data point you wish to evaluate. If it does, determine whether one of the available KPI templates can evaluate it. If it can, proceed with building a new KPI. If not, you must build the KPI with the tools available in the Cisco DevNet and then import it into Crosswork Network Controller. Once you import the KPI, you can add it to your profile.

4. Build the custom KPI and add it to a KPI profile.

See Create a new KPI and Create a new KPI profile.

5. Enable the new KPI profile on a test device.

See Enable KPI profiles on devices.

6. Confirm that collections are working.

7. Confirm that the data reported matches your expectations and, if necessary, investigate the alarms raised by the new KPI. Be aware that KPIs that depend on data over time to establish baseline performance will need some time to establish a baseline before they provide meaningful data.

See View alerts for network devices.

8. If the KPI profile meets expectations, enable it on all devices where applicable.

Warning


When enabling KPI profiles on many devices, ensure that sufficient capacity is available on Data Gateway. If adequate capacity is not available and if you enable the KPI profiles on a large number of devices, it may cause overload and outage. To check Data Gateway load, see Health Insights CDG load calculator at Cisco Crosswork Network Automation APIs.

See Enable KPI profiles on devices.

9. Make sure the KPI profile was deployed on the device (MDT only) and that the collection jobs are functioning.

See Verify the deployment status of enabled KPIs.

Closed-loop automation

The following workflow describes the steps to follow when using Health Insights to run a remediation playbook from Change Automation in response to the performance challenges detected in the network by a KPI. A remediation playbook can be:

  • Linked to a KPI, alerting the operator to run the playbook and make the remediation easier.

  • Linked to a KPI and selected for automatic execution without operator intervention.

Step Action

1. Research the KPIs that are triggering alerts and determine the best corrective action to take for the situation your network has experienced.

Follow the instructions in Monitor Network Health and KPIs, using the View alerts for network devices to research the alerts and their possible causes.

2. Review the plays and playbooks to determine which will best address the alerting KPI.

For example:

  • Look for an existing playbook that could resolve the issue.

  • Look for existing plays that could be combined to resolve the issue. Create a new playbook with those plays.

See Create a custom play using templates and Create a custom playbook through the UI.

3. Try out the selected playbooks and see if they are applicable to your purposes. As you experiment, adjust the playbook parameters as needed.

See:

Perform a dry run of a playbook

Run playbooks in single stepping mode

Run playbooks in continuous mode

4. If required, build new plays and then build new playbooks with the combination of plays needed to make the desired change(s) to the network.

See Create a custom play using templates and Create a custom playbook through the UI.

5. (Optional) Run playbook manually - Manual playbook execution allows you to maintain human oversight and ensures that the planned remediation effort effectively addresses the issue. It is particularly useful in situations where remediation may require prior notifications or scheduling during a maintenance window.

For frequently triggered KPIs with a known remediation playbook, link the playbook to the KPI and run it manually.

See Link KPIs to playbooks and run them manually. Use the Remediation icon shown in View alerts for network devices to trigger a run of a linked playbook from a device or KPI alert.

6. (Optional) Run playbook automatically - Automatically running playbooks for KPIs with known remediation eliminates the need for human intervention, ensuring a prompt resolution.

For frequently triggered KPIs with a known remediation playbook and minimal risk of unintended consequences, link the playbook to the KPI and configure it to run automatically. See Verify installation and configure system settings to ensure your setup is properly configured to enable automatic playbook execution.

See Link KPIs to playbooks and run them automatically