- Managing Cisco NFVI
- Cisco VIM REST API
- Monitoring Cisco NFVI Performance
- Managing Cisco NFVI Security
- Managing Cisco NFVI Storage
- Overview to Cisco VIM Insight
- Managing Cisco VIM through Insight
- Managing Blueprints
- Managing Pod Through Cisco VIM Insight
- Day 2 Operations of Cisco VIM Insight
- Overview to the Cisco Virtual Topology System
- Managing Backup and Restore Operations
- Troubleshooting
Monitoring Cisco NFVI Performance
The following topics tell you how to display logs to monitor Cisco VIM performance.
- Logging and Monitoring in Cisco NFVI
- Displaying Cisco VIM Log Files Using the CLI
- Logging Into the Kibana Dashboard
- Rotation of the Cisco VIM Logs
- Network Performance Test with NFVBench
Logging and Monitoring in Cisco NFVI
Cisco VIM uses a combination of open source tools to collect and monitor the Cisco OpenStack services including Elasticsearch, Fluentd, and the Kibana dashboard (EFK).
In VIM 2.2, we have moved our platform to use Fluentd, instead of logstash. However, to maintain backwards compatibility, the code and documentation refers to ELK, instead of EFK at various places. In VIM 2.2, these two acronyms are interchangeable, however it refers to the presence of EFK in the offering. OpenStack servicesthat are tracked by EFK include:
-
MariaDB—A relational database management system based on MySQL. All the OpenStack components store their data in MariaDB.
-
HAProxy—HAProxy is a free open source software that provides a high-availability load balancer, and proxy server for TCP and HTTP-based applications that spreads requests across multiple servers.
-
Keystone—Keystone is an OpenStack project that provides identity, token, catalog, and policy services for use specifically by projects in the OpenStack.
-
Glance—An OpenStack project that allows you to upload and discover data assets meant for use with other services.
-
Neutron—An OpenStack project that provides network connectivity between interface devices, such as vNICs, managed by other OpenStack services, such as Nova.
-
Nova—An OpenStack project designed to provide massively scalable, on demand, self-service access to compute resources.
-
HTTPD—The Apache HTTP Server Project, an effort to develop and maintain an open-source HTTP server.
-
Cinder—An OpenStack block storage service designed to present storage resources to end users that are consumed by the OpenStack compute project (Nova).
-
Memcached—A general purpose distributed memory caching system.
-
CloudPulse—Is an OpenStack tool that checks the health of the cloud. CloudPulse includes operator and endpoint tests.
-
Heat—The main OpenStack Orchestration program. Heat implements an orchestration engine to launch multiple composite cloud applications based on text file templates.
-
Other OpenStack services—RabbitMQ, Ceph, Open vSwitch, Linux bridge, Neutron VTS (optional), and others.
-
VMTP—Integrated control and data plane log for testing the cloud.
-
NFVbench—Network performance benchmarking tool.
A Fluentd container resides on each control, compute, and storage nodes. They forward logs to the Fluentd-aggr server residing on the management node. The following figure shows a high-level schematic of the Fluent service assurance architecture.
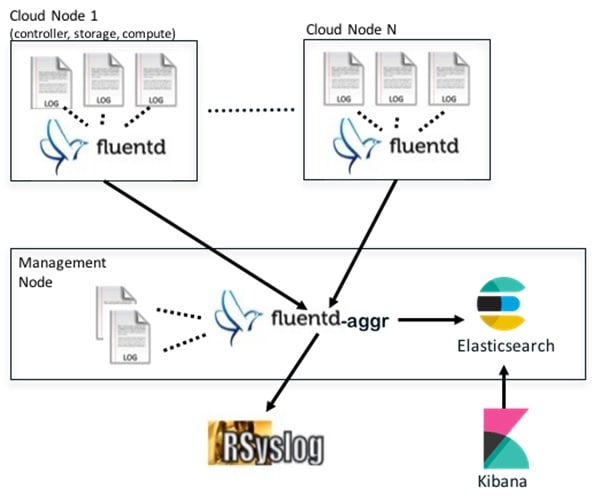
The EFK flow includes:
- Fluentd extracts the relevant data from the logs and tags them so that they will be used by later Kibana to display useful information about those logs
- Fluentd sends the logs from all the compute, controller, and storage nodes to the Fluentd-aggr server on the management node.
- Fluentd-aggr in the management node sends the structured logs into the Elasticsearch database.
- Elasticsearch stores the data, indexes it, and supports extremely fast queries against a large amount of log data
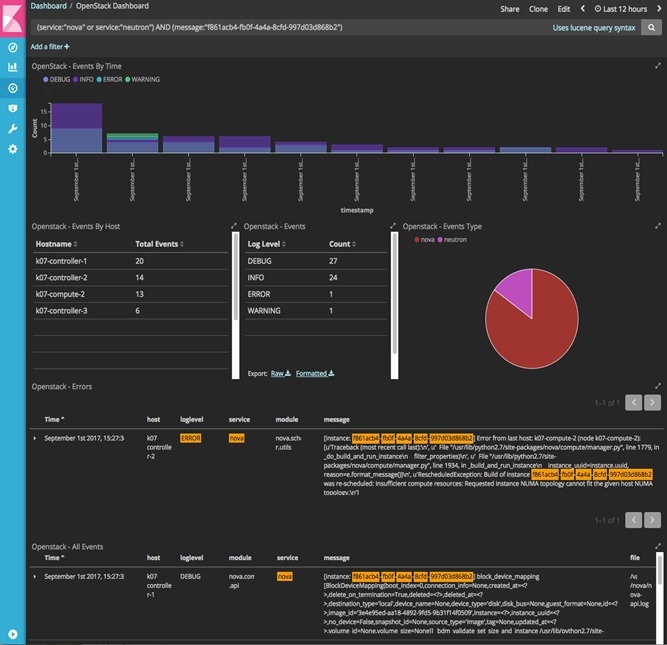
- Kibana visualizes the data stored in Elasticsearch using a custom dashboards with REST API calls to Elasticsearch. User can also add filters to the data to visualize interesting fragments of the log data.
Displaying Cisco VIM Log Files Using the CLI
Cisco VIM log file location depends on the node and log type. Installer logs can be found on the management node under /var/log/mercury/<install_uuid>/ directory. The last twenty log directories are tarred and kept in this directory. These files contain logs related to bootstrap, buildorchestration, baremetal, common setup, and OpenStack orchestration. If the installer fails, look at the last tar.gz file for logs, for example:
[root@mgmtnode mercury]# ls -lrt
total 20
drwxr-xr-x. 2 root root   80 Jul 19 23:42 573f2b7f-4463-4bfa-b57f-98a4a769aced
drwxr-xr-x. 2 root root 4096 Jul 20 03:29 installer
drwxr-xr-x. 2 root root   79 Jul 20 03:29 e9117bc5-544c-4bda-98d5-65bffa56a18f
drwxr-xr-x. 2 root root   79 Jul 20 04:54 36cdf8b5-7a35-4e7e-bb79-0cfb1987f550
drwxr-xr-x. 2 root root   79 Jul 20 04:55 bd739014-fdf1-494e-adc0-98b1fba510bc
drwxr-xr-x. 2 root root   79 Jul 20 04:55 e91c4a6c-ae92-4fef-8f7c-cafa9f5dc1a3
drwxr-xr-x. 2 root root   79 Jul 20 04:58 1962b2ba-ff15-47a6-b292-25b7fb84cd28
drwxr-xr-x. 2 root root   79 Jul 20 04:59 d881d453-f6a0-448e-8873-a7c51d8cc442
drwxr-xr-x. 2 root root   78 Jul 20 05:04 187a15b6-d425-46a8-a4a2-e78b65e008b6
drwxr-xr-x. 2 root root 4096 Jul 20 06:47 d0346cdd-5af6-4058-be86-1330f7ae09d1
drwxr-xr-x. 2 root root   79 Jul 20 17:09 f85c8c6c-32c9-44a8-b649-b63fdb11a79a
drwxr-xr-x. 2 root root   67 Jul 20 18:09 179ed182-17e4-4f1f-a44d-a3b6c16cf323
drwxr-xr-x. 2 root root   68 Jul 20 18:13 426cb05f-b1ee-43ce-862d-5bb4049cc957
drwxr-xr-x. 2 root root   68 Jul 20 18:13 1d2eec9d-f4d8-4325-9eb1-7d96d23e30fc
drwxr-xr-x. 2 root root   68 Jul 20 18:13 02f62a2f-3f59-46a7-9f5f-1656b8721512
drwxr-xr-x. 2 root root   68 Jul 20 18:14 c7417be9-473e-49da-b6d0-d1ab8fb4b1fc
drwxr-xr-x. 2 root root   68 Jul 20 18:17 b4d2077b-c7a9-46e7-9d39-d1281fba9baf
drwxr-xr-x. 2 root root   68 Jul 20 18:35 21972890-3d45-4642-b41d-c5fadfeba21a
drwxr-xr-x. 2 root root   80 Jul 20 19:17 d8b1b54c-7fc1-4ea6-83a5-0e56ff3b67a8
drwxr-xr-x. 2 root root   80 Jul 20 19:17 23a3cc35-4392-40bf-91e6-65c62d973753
drwxr-xr-x. 2 root root   80 Jul 20 19:17 7e831ef9-c932-4b89-8c81-33a45ad82b89
drwxr-xr-x. 2 root root   80 Jul 20 19:18 49ea0917-f9f4-4f5d-82d9-b86570a02dad
drwxr-xr-x. 2 root root   80 Jul 20 19:18 21589a61-5893-4e30-a70e-55ad0dc2e93f
drwxr-xr-x. 2 root root   80 Jul 20 19:22 6ae6d136-7f87-4fc8-92b8-64cd542495bf
drwxr-xr-x. 2 root root 4096 Jul 20 19:46 1c6f4547-c57d-4dcc-a405-ec509306ee25
drwxr-xr-x. 2 root root   68 Jul 20 21:20 c6dcc98d-b45b-4904-a217-d25001275c85
drwxr-xr-x. 2 root root   68 Jul 20 21:40 ee58d5d6-8b61-4431-9f7f-8cab2c331637
drwxr-xr-x. 2 root root 4096 Jul 20 22:06 243cb0f8-5169-430d-a5d8-48008a00d5c7
drwxr-xr-x. 2 root root 4096 Jul 20 22:16 188d53da-f129-46d9-87b7-c876b1aea70c
On controller and compute nodes, all services are run within their respective Docker™ containers. To list the Docker containers in the node, execute the following:
[root@control-server-2 ~]# docker ps -a
CONTAINER ID        IMAGE                                                          COMMAND                  CREATED          STATUS          PORTS      NAMES
258b2ca1d46a        172.31.228.164:5000/mercury-rhel7-osp8/nova-scheduler:4780     "/usr/bin/my_init /no"   25 minutes ago   Up 25 minutes              novascheduler_4780
ffe70809bbe0        172.31.228.164:5000/mercury-rhel7-osp8/nova-novncproxy:4780    "/usr/bin/my_init /st"   25 minutes ago   Up 25 minutes              novanovncproxy_4780
12b92bcb9dc0        172.31.228.164:5000/mercury-rhel7-osp8/nova-consoleauth:4780   "/usr/bin/my_init /st"   26 minutes ago   Up 26 minutes


……
novaconsoleauth_4780
7295596f5167        172.31.228.164:5000/mercury-rhel7-osp8/nova-api:4780            "/usr/bin/my_init /no"   27 minutes ago   Up 27 minutes              novaapi_4780
To view the Docker logs of any container, execute the following on the corresponding host:
ls –l /var/log/<service_name>/<log_filename>
e.g. ls -l /var/log/keystone/keystone.log
To get into a specific container, execute the following:
[root@control-server-2 ~]# alias | grep container
     root@control-server-2 ~]# source /root/.bashrc
#execute the alias:
	 [root@control-server-2 ~]# novaapi
novaapi_4761 [nova@control-server-2 /]$
	novaapi_4761 [nova@control-server-2 /]$ exit
exit
If the Docker status indicates a container is down (based on output of “docker ps –a”), collect the Docker service logs as well:
cd /etc/systemd/system/multi-user.target.wants/
ls docker* # get the corresponding service name from the output
systemctl status <service_name> -n 1000 > /root/filename # redirects the output to the file
For storage nodes running Ceph, execute the following to check the cluster status:
ceph –v # on monitor nodes (controller), show’s ceph version

ceph –s # on monitor nodes (controller), show cluster status

ceph osd lspools #on monitor nodes (controller),list pools

ceph mon stat # summarize monitor status

ceph-disk list # on OSD / storage nodes; List disks, partitions, and Ceph OSDs

rbd list images # on monitor nodes (controller); dump list of image snapshots

rbd list volumes # on monitor nodes (controller); dump list of volumes
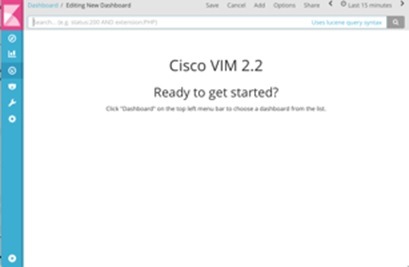
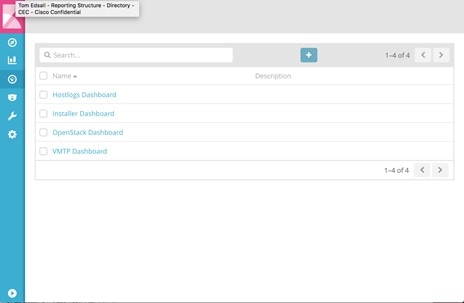
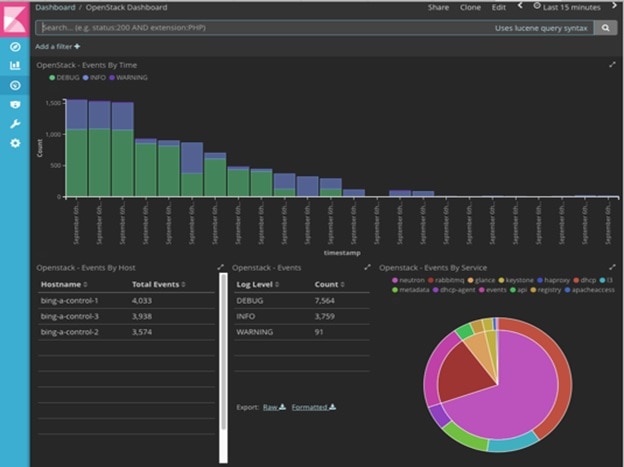
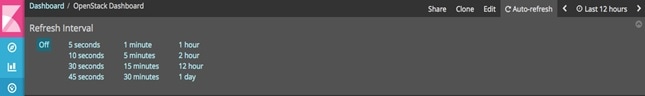
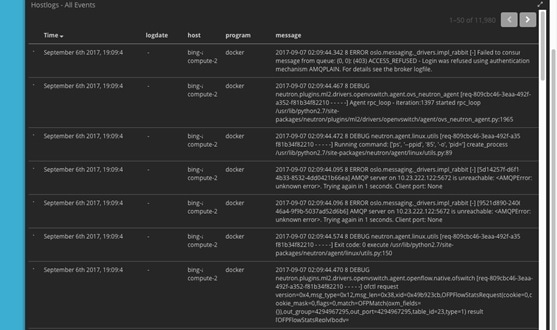
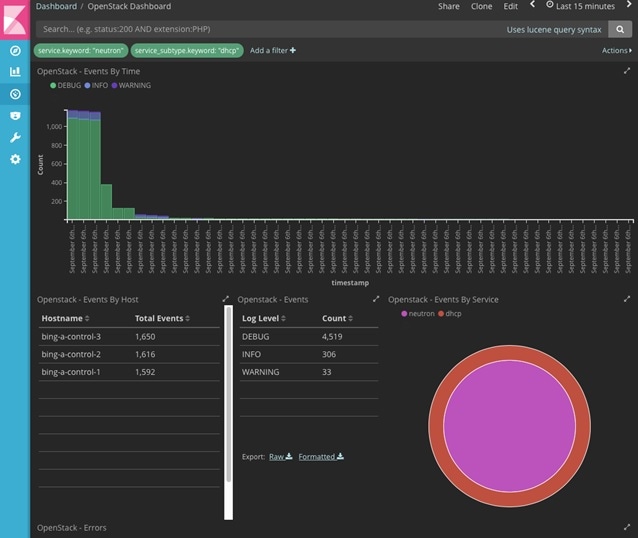
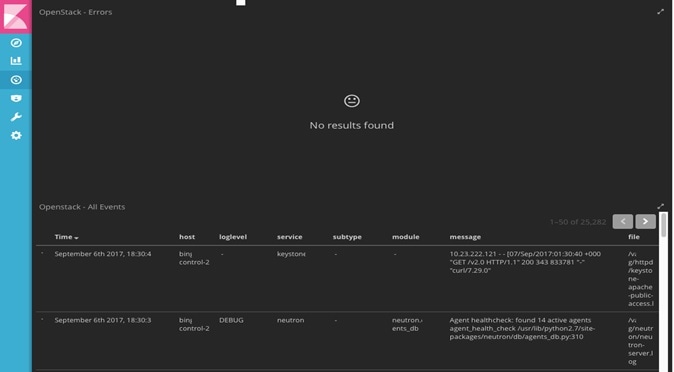
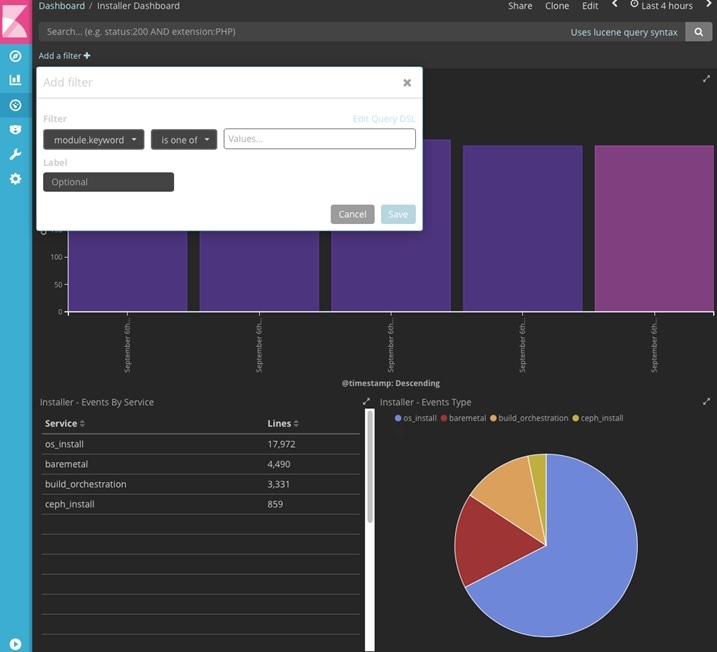
Logging Into the Kibana Dashboard
Kibana is an open source data visualization platform that you can use to explore Cisco VIM logs.
To log into the Kibana dashboard:


Rotation of the Cisco VIM Logs
Cisco VIM stores all logs in Elasticsearch. Elasticsearch indices are rotated on a periodic basis to prevent disk space overflow by creating snapshots. Snapshots are defined in openstack_config.yaml as listed below:
# vi ~/openstack-configs/openstack_config.yaml
…
# Elk rotation parameters
elk_rotation_frequency: "monthly"  # Available: "daily", "weekly", "fortnightly", "monthly"
elk_rotation_size: 2               # Unit is in Gigabytes (float is allowed)
elk_rotation_del_older: 10         # Delete older than 10 units (where units depends on the value set on elk_rotation_frequency)
…
You can change the frequency of the rotation by changing the values. For more information on how to set the Elasticsearch parameters via VIM API/CLI, please refer to the section Reconfiguring Passwords and OpenStack Configurations.
Cisco VIM uses the open source Elasticsearch Curator tool to manage the Elasticsearch indices and snapshots. For more information about Elasticsearch handles snapshots, please look at the official information on Elastic.co (version 5.2).
Network Performance Test with NFVBench
NFVBench is a network performance benchmarking tool integrated with Cisco VIM. For more details, refer to NFVBench section of Chapter 1 in the admin guide for details.
 Feedback