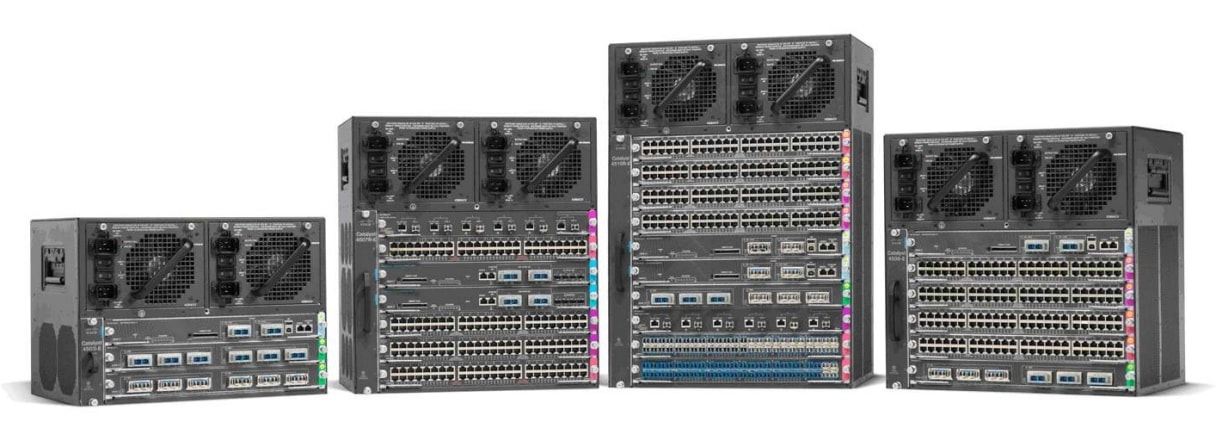
Cisco Catalyst 4500 Series Switches
| Product Type | Campus LAN Switches - Access |
|---|---|
| Status |
End of Support
EOL Details
|
| Series Release Date | 17-SEP-2002 |
| End-of-Sale Date | 30-OCT-2020 |
| End-of-Support Date | 31-OCT-2025 |
| Diagram | Visio Stencil (4 MB .zip file) |
|
This product is supported by Cisco, but is no longer being sold. Consider switching to something new: The Cisco Catalyst 9400 Series Switches offer greater speed, performance and security. View the benefits of upgrading >
|
|


- US/Canada 800-553-2447
- Worldwide Support Phone Numbers
- All Tools
 Feedback
 Feedback
-
Log in to see full product documentation.
-
Data Sheets and Product Information
-
Supervisor Engine
- Cisco Catalyst 4500E Supervisor Engine 9-E Data Sheet
- Cisco Catalyst 4500E Supervisor Engine 8-E: Wired and Wireless Convergence Data Sheet
- Cisco Catalyst 4500E Supervisor Engine 8L-E: Enhanced Campus Access and Aggregation Supervisor Engine Data Sheet
- Catalyst 4500E Supervisor Engine 7-E: Leading Borderless Network Access and Aggregation Supervisor Engine Data Sheet
- Cisco Catalyst 4500E Supervisor Engine 7L-E: Enhanced Borderless Campus Access and Aggregation Supervisor Engine Data Sheet
- Cisco Catalyst 4500 Supervisor Engine 6L-E - High Performance Access Supervisor Data Sheet
- Power over Ethernet on the Cisco Catalyst 4500E Series Platform Data Sheet
-
Line Cards, Chassis and Power Supplies
- Cisco 4500 Series Supervisor Engine II-Plus-TS for 4503-E and 4503 Switches
- Cisco Catalyst 4500 Series Supervisor Engine II-Plus
- Cisco Catalyst 4500 Series Supervisor Engine V-10GE
- Cisco Catalyst 4500 Series Switch Data Sheet
- Cisco Catalyst 4500 Supervisor Engine 6-E with CenterFlex Technology: Secure, Flexible, Nonstop Communications Data Sheet
Data Sheets
- End-of-Sale and End-of-Life Announcement for the Cisco Universal Images for Catalyst 4500 switches
- End-of-Sale and End-of-Life Announcement for the Cisco Catalyst C4500E Series
- End-of-Sale and End-of-Life Announcement for the Cisco Catalyst 4500 Supervisor Engine 9E
- End-of-Sale and End-of-Life Announcement for the Cisco Catalyst 4500 Supervisor Engine 7L-E
- End-of-Sale and End-of-Life Announcement for the Cisco IOS XE 3.10E(x) for Cisco Catalyst 4500-E/X Series Switches and Cisco IOS 15.2(6)E(x) for Cisco Catalyst 2960-X/XR,2960-Plus,2960-L,2960-C/CX, 3560-CX,4900,Cisco Digital Building Series Switches
- End-of-Sale and End-of-Life Announcement for the Cisco Catalyst 4500 Supervisor Engine 7-E
- End-of-Sale and End-of-Life Announcement for the Cisco Catalyst 4500E Line Cards
- End-of-Sale and End-of-Life Announcement for the Cisco Catalyst 4500 FE (10/100) 48-Port RJ45 Non-E-Series PoE IEEE 802.3af Line Card
- End-of-Sale and End-of-Life Announcement for the Cisco Catalyst 4500 Supervisor Engine 6L-E
- End-of-Sale and End-of-Life Announcement for the Cisco Catalyst 4500 (Non-E Series) 48-Port 802.3afPoE and 802.3atPoEP 10/100/1000 (RJ45) Line Card
- End-of-Sale and End-of-Life Announcement for the Cisco Catalyst 4500 FE (10/100) 48-Port Non-E-Series Line Card
- End-of-Sale and End-of-Life Announcement for the Cisco Catalyst 4500E Series Supervisor Engine V-10GE and Select Line Cards
- End-of-Sale and End-of-Life Announcement for the Select Cisco Catalyst 4500E Series Chassis
- End-of-Sale and End-of-Life Announcement for the Cisco Catalyst 4500E Series Supervisor Engine V—10GE
- End-of-Sale and End-of-Life Announcement for the Cisco Catalyst 4500 Memory PIDs
End-of-Life and End-of-Sale Notices
-
Log in to see available downloads.
Below are the models within the Cisco Catalyst 4500 Series Switches.
Unless specified, documentation for the Cisco Catalyst 4500 Series Switches is applicable to all models.
- Supported Models:
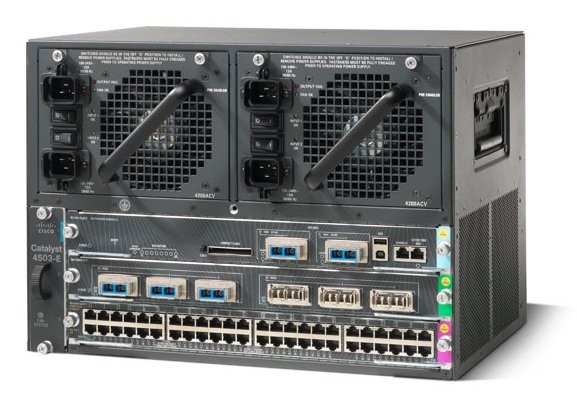
- Catalyst 4503-E Switch
- Catalyst 4506-E Switch
- Catalyst 4507R+E Switch
- Catalyst 4510R Switch
- Catalyst 4510R+E Switch
- Retired Models:
- Catalyst 4503 Switch
- Catalyst 4506 Switch
- Catalyst 4507R Switch
- Catalyst 4507R-E Switch
- Catalyst 4510R-E Switch
-