-
Cisco CallManager Serviceability Administration Guide, Release 3.1(1)
-
Index
-
Preface
-
Overview
-
Alarms
-
Trace
-
Control Center
-
Admin Serviceability Tool
-
Cisco Secure Telnet
-
The Show Command Line Interface
-
Monitor Performance Counters
-
Message Translator
-
Manage With CiscoWorks2000
-
The Path Analysis Interface
-
System Log Management
-
SNMP Instrumentation
-
Cisco Discovery Protocol Support
-
Cisco CallManager Perfmon Counters, AST, and CCM_SNMP_MIB
-
 Feedback
Table Of Contents
Configure Cisco Database Layer Monitor
Configure Cisco IP Voice Media Streaming Application
Configure Cisco Messaging Interface
Configure Cisco MOH Audio Translator
Configure Cisco RIS Data Collector
Configure Cisco Telephony Call Dispatcher
Configure Device Name Based Trace Monitoring
Search Criteria and Display Fields
Search Criteria and Display Fields
Trace
This chapter provides general and procedural information on the Cisco CallManager Serviceability Trace tool.
This chapter contains the following topics:
•
Configure Cisco Database Layer Monitor
•
•
•
•
•
•
•
•
Trace Overview
Cisco CallManager Serviceability provides a web-based trace tool to assist the system administrator and support personnel in troubleshooting Cisco CallManager problems. Trace provides three main functions:
•
•
•
The Trace and Alarm tools work together. You configure trace and alarm settings for Cisco CallManager services. A Cisco TAC engineer receives the results. You can direct alarms to the Win2000 event viewer, CiscoWorks2000 Syslog, SDI or SDL trace log files, or to all destinations. You can base traces for Cisco CallManager services on debug levels, specific trace fields, and Cisco CallManager devices such as phones or gateways. You can perform a trace on the alarms that are sent to the SDI or SDL trace log files.
You configure trace parameters for Cisco CallManager services that are available on any Cisco CallManager server in the cluster. The following configurable services for trace exist:
•
•
•
•
•
•
•
•
•
Use the Trace Collection tool to collect trace information for any Cisco CallManager service, the time and date of the trace for that service, and the trace type (SDI or SDL) for that service. Trace Collection takes the information you selected and writes it into a single file. You can display the collected results or download them to a file, which you use to troubleshoot the system.
The Trace Analysis tool, a post-processing tool that displays XML files, provides greater trace detail to help narrow system problems. Using the Trace Analysis tool, you can specify an SDI or SDL trace, a device name, or an IP address for a Cisco CallManager service.
Note
Trace Troubleshooting Example
The following example describes how to use the Trace tools to troubleshoot a call- forwarding problem.
Customer Problem
The customer has an IP phone (its directory number is 2000) that is configured for Call Forward all Calls to another IP phone (directory number 3000). The customer network includes five Cisco CallManager servers in its cluster.
Verify Correct Configuration
Perform the following procedure to troubleshoot the customer problem.
Step 1
In this example, call the server "node A."
Step 2
Step 3
Step 4
In this example, call the server "node B."
Step 5
In this example, it is correctly configured.
Step 6
In this example, the call completes. Because the call is completing, enable trace to determine why the phone does not correctly forward calls.
Set Up Trace
Perform the following procedures to set up trace to determine why the Call Forward all Calls from DN 2000 to DN 3000 does not work properly.
Step 1
Step 2
Step 3
See Configure Cisco CallManager, for details.
Step 4
See Configure Device Name Based Trace Monitoring, for details.
Step 5
Step 6
Step 7
Step 8
Tips
Collect Trace
Perform the following procedures to set up trace to collect information about the call between the IP phones.
Step 1
Step 2
Step 3
Step 4
Note
Step 5
Step 6
Note
Review Results
In this example, you review the results of the SDI and SDL trace collection. You can use a text file or an XML file. Use Trace Analysis tool to view XML file results. By reviewing the SDL information, a skilled engineer can determine what type of problem is happening between the two phones.
Trace Configuration
Use the Trace Configuration tool to specify the parameters you want to trace for troubleshooting Cisco CallManager problems. The Trace Configuration window provides two types of settings: trace filter and trace output.
Specify the following trace parameters:
•
•
•
•
•
If the service is a call-processing application such as Cisco CallManager or Cisco CTIManager, you can configure a trace on devices such as phones and gateways; for example, you can narrow the trace to all enabled phones with a directory number beginning with 555.
Note
The following sections describe the configuration procedures for all Cisco CallManager services and for Device Name Based Trace Monitoring:
•
•
•
•
•
•
•
Related Topics
Trace Filter Settings
Use the trace filter settings to set the type of trace you want (Table 3-1). Click the Trace On check box to access the trace filter settings.
Table 3-1 Trace Configuration Filter Settings
Debug trace level
Setting specifies the level of information you want traced (see Table 3-9). Levels range from error to detailed.
Trace fields
Each Cisco CallManager service provides specific trace fields. The configuration procedures for each service describes the trace fields.
Device Name Based Trace Monitoring
Setting applies to Cisco CallManager and Cisco CTIManager services only. This filter setting configures trace for devices such as phones and gateways. See Configure Device Name Based Trace Monitoring.
Trace Output Settings
Use the trace output settings to specify the output log file and its format (Table 3-2).
Note
Trace Service Parameters
For proper operation, you must configure SDL trace service parameters for the Cisco CallManager service using the Cisco CallManager Administration program. Refer to the Cisco CallManager Administration Guide for service parameters configuration details.
The following list identifies the SDL trace service parameters:
•
•
•
•
•
•
•
•
Cisco recommends that you use the defaults unless a Cisco engineer instructs otherwise. To view the service parameter help information, click the i button on the service parameters configuration page.
Configure Cisco CallManager
Perform these procedures to configure trace parameters for the Cisco CallManager service.
Step 1
The Cisco CallManager Serviceability window displays.
Step 2
Step 3
The server you chose displays next to the Current Services title, and a box with configured services displays.
Step 4
The service you chose displays next to the Current Service title, along with the current server you chose. The trace parameters display for the service you chose.
Note
Step 5
Step 6
Step 7
A list with six debug trace levels displays.
Step 8
Step 9
Table 3-3 describes the 17 options from which to choose.
Step 10
If you want trace to apply to non-devices in addition to devices, check the Include non-device traces check box. If check box is checked, set the appropriate debug trace level as described in Table 3-9.
Step 11
The default log file name and the default parameters display in the fields. If you want to send the trace information to another file, specify the filename and pathname by clicking the File Name field. Change the default parameters by clicking the appropriate field and entering the information.
Note
The following default Trace log file name applies for the Cisco CallManager: C:\ProgramFiles\Cisco\Trace\CCM\ccm.txt. See Table 3-10 for the Trace log file default parameters.
Step 12
Step 13
Step 14
The changes to trace configuration take effect immediately for Cisco CallManager.
Note
Configure Cisco CTIManager
Perform these procedures to configure trace parameters for the Cisco CTIManager.
Step 1
The Cisco CallManager Serviceability window displays.
Step 2
Step 3
The server you chose displays next to the Current Server title, and a box with configured services displays.
Step 4
The service you chose displays next to the Current Service title, along with the current server you chose. The trace parameters display for the service you chose.
Note
Step 5
Step 6
Step 7
A list with seven debug trace levels displays.
Step 8
Step 9
Step 10
Step 11
If you want trace to apply to non-devices in addition to devices, check the Include non-device traces check box. If check box is checked, set the appropriate debug trace level as described in Table 3-9.
Step 12
The default log file name and the default parameters display in the fields. If you want to send the trace information to another file, specify the filename and pathname by clicking the File Name field. Change the default parameters by clicking the appropriate field and entering the information.
Note
The following default Trace log file name applies for the Cisco CTIManager: C:\ProgramFiles\Cisco\Trace\CTI\cti.txt. See Table 3-10 for the Trace log file default parameters.
Step 13
Step 14
Step 15
Cisco CTIManager supports a trace polling mechanism; changes to trace configuration take affect at the next polling interval. The default polling interval is 5 minutes. To change the polling interval, refer to the Cisco CallManager Administration Guide for service parameters configuration procedures.
Note
Configure Cisco Database Layer Monitor
Perform these procedures to configure trace parameters for the Cisco Database Layer Monitor.
Step 1
The Cisco CallManager Serviceability window displays.
Step 2
Step 3
The server you chose displays next to the Current Server title, and a box with configured services displays.
Step 4
The service you chose displays next to the Current Service title, along with the current server you chose. The trace parameters display for the service you chose.
Note
Step 5
Step 6
Step 7
A list with seven debug trace levels displays.
Step 8
Step 9
Table 3-4 describes the 11 options from which to choose.
Step 10
The default log file name and the default parameters display in the fields. If you want to send the trace information to another file, specify the filename and pathname by clicking the File Name field. Change the default parameters by clicking the appropriate field and entering the information.
Note
The following default Trace log file name applies for the Cisco Database Layer Monitor: C:\ProgramFiles\Cisco\Trace\DBL\Aupair.txt. See Table 3-10 for the Trace log file default parameters.
Step 11
Step 12
The changes to trace configuration take affect immediately for Cisco Database Layer Monitor.
Note
Configure Cisco IP Voice Media Streaming Application
Perform these procedures to configure trace parameters for the Cisco IP Voice Media Streaming Application.
Step 1
The Cisco CallManager Serviceability window displays.
Step 2
Step 3
The server you chose displays next to the Current Servers title, and a box with configured services displays.
Step 4
The service you chose displays next to the Current Service title, along with the current server you chose. The trace parameters display for the service you chose.
Note
Step 5
Step 6
Step 7
A list with seven debug trace levels displays.
Step 8
Step 9
Table 3-5 describes the 12 options from which to choose.
Step 10
The default log file name and the default parameters display in the fields. If you want to send the trace information to another file, specify the filename and pathname by clicking the File Name field. Change the default parameters by clicking the appropriate field and entering the information.
Note
The following default Trace log file name applies for the Cisco IP Voice Media Streaming Application: C:\ProgramFiles\Cisco\Trace\CMS\cms.txt. See Table 3-10 for the Trace log file default parameters.
Step 11
Step 12
The changes to trace configuration take effect immediately for Cisco IP Voice Media Streaming Application.
Note
Configure Cisco Messaging Interface
Perform these procedures to configure trace parameters for the Cisco Messaging Interface.
Step 1
The Cisco CallManager Serviceability window displays.
Step 2
Step 3
The server you chose displays next to the Current Server title, and a box with configured services displays.
Step 4
The service you chose displays next to the Current Service title, along with the current server you chose. The trace parameters display for the service you chose.
Note
Step 5
Step 6
Step 7
A list with seven debug trace levels displays.
Step 8
Step 9
Step 10
Step 11
The default log file name and the default parameters display in the fields. If you want to send the trace information to another file, specify the filename and pathname by clicking the File Name field. Change the default parameters by clicking the appropriate field and entering the information.
Note
The following default Trace log file name applies for the Cisco Messaging Interface: C:\ProgramFiles\Cisco\Trace\CMI\csumi.txt. See Table 3-10 for the Trace log file default parameters.
Step 12
Step 13
The changes to trace configuration take effect in 3 to 5 minutes for Cisco Messaging Interface.
Note
Configure Cisco MOH Audio Translator
Perform these procedures to configure trace parameters for the Cisco MOH Audio Translator.
Step 1
The Cisco CallManager Serviceability window displays.
Step 2
Step 3
The server you chose displays next to Current Server title, and a box with configured services displays.
Step 4
The service you chose displays next to the Current Service title, along with the current server you chose. The trace parameters display for the service you chose.
Note
Step 5
Step 6
Step 7
A list with seven debug trace levels displays.
Step 8
Step 9
Step 10
Step 11
The default log file name and the default parameters display in the fields. If you want to send the trace information to another file, specify the filename and pathname by clicking the File Name field. Change the default parameters by clicking the appropriate field and entering the information.
Note
The following default Trace log file name applies for the Cisco MOH Audio Translator: C:\ProgramFiles\Cisco\Trace\CMS\at.txt. See Table 3-10 for the Trace log file default parameters.
Step 12
Step 13
The changes to trace configuration take effect within 1 minute for Cisco MOH Audio Translator.
Note
Configure Cisco RIS Data Collector
Perform these procedures to configure trace parameters for the Cisco RIS Data Collector.
Step 1
The Cisco CallManager Serviceability window displays.
Step 2
Step 3
The server you chose displays next to the Current Server title, and a box with configured services displays.
Step 4
The service you chose displays next to the Current Service title, along with the current server you chose. The trace parameters display for the service you chose.
Note
Step 5
Step 6
Step 7
A list with seven debug trace levels displays.
Step 8
Step 9
Table 3-6 describes the seven options from which to choose.
Step 10
The default log file name and the default parameters display in the fields. If you want to send the trace information to another file, specify the filename and pathname by clicking the File Name field. Change the default parameters by clicking the appropriate field and entering the information.
Note
The following default Trace log file name applies for the Cisco RIS Data Collector: C:\ProgramFiles\Cisco\Trace\RIS\ris.txt. See Table 3-10 for the Trace log file default parameters.
Step 11
Step 12
The changes made to trace configuration take effect immediately; however, trace configuration changes affect two Cisco RIS Data Collector DLLs (RISX.dll and ASTIsapi.dll). These DLLs belong to the Internet Information Services (IIS) processes, which means that trace configuration changes require a restart of the IIS process. Refer to Microsoft Windows documentation for IIS starting and stopping procedures.
Note
Note
Configure Cisco Telephony Call Dispatcher
Perform these procedures to configure trace parameters for the Cisco Telephony Call Dispatcher.
Step 1
The Cisco CallManager Serviceability window displays.
Step 2
Step 3
The server you chose displays next to the Current Services title, and a box with configured services displays.
Step 4
The service you chose displays next to the Current Service title, along with the current server you chose. The trace parameters display for the service you chose.
Note
Step 5
Step 6
Step 7
A list with seven debug trace levels displays.
Step 8
Step 9
Step 10
Table 3-7 describes the two options from which to choose.
Table 3-7 Telephony Call Dispatcher Trace Fields
Enable low level trace
Activates low-level trace.
Enable high level trace
Activates high-level trace.
Step 11
The default log file name and the default parameters display in the fields. If you want to send the trace information to another file, specify the filename and pathname by clicking the File Name field. Change the default parameters by clicking the appropriate field and entering the information.
Note
The following default Trace log file name applies for the Cisco Telephony Call Dispatcher: C:\ProgramFiles\Cisco\Trace\TCD\tcdsrv.txt. See Table 3-10 for the Trace log file default parameters.
Step 12
Step 13
Note
Configure Cisco TFTP
Perform these procedures to configure trace parameters for the Cisco TFTP.
Step 1
The Cisco CallManager Serviceability window displays.
Step 2
Step 3
The server you chose displays next to the Current Servers title, and a box with configured services displays.
Step 4
The service you chose displays next to the Current Service title, along with the current server you chose. The trace parameters display for the service you chose.
Note
Step 5
Step 6
Step 7
A list with seven debug trace levels displays.
Step 8
Step 9
Table 3-8 describes the three options from which to choose.
Step 10
The default log file name and the default parameters display in the fields. If you want to send the trace information to another file, specify the filename and pathname by clicking the File Name field. Change the default parameters by clicking the appropriate field and entering the information.
Note
The following default Trace log file name applies for the Cisco TFTP: C:\ProgramFiles\Cisco\Trace\TFTP\ctftp.txt. See Table 3-10 for the Trace log file default parameters.
Step 11
Step 12
Step 13
The changes to trace configuration take effect immediately for Cisco TFTP.
Note
Configure Device Name Based Trace Monitoring
Use this Trace Configuration option to narrow the number of trace logs generated and reduce the impact on call processing. This option traces only the selected devices.
Perform these procedures to configure device-name-based trace monitoring parameters for the Cisco CallManager and Cisco CTIManager services.
Step 1
The Cisco CallManager Serviceability window displays.
Step 2
Step 3
The server you chose displays next to the Current Server title, and a box with configured services displays.
Step 4
The service you chose displays next to the Current Service title, along with the current server you chose. The trace parameters display for the service you chose.
Step 5
Step 6
A list with seven debug trace levels displays.
Step 7
Step 8
See Table 3-3 for Cisco CallManager trace fields information.
Step 9
Step 10
The Device Selection for Tracing window displays.
Tips
Step 11
Step 12
•
•
•
•
•
•
•
Step 13
Step 14
•
•
•
•
•
Step 15
Step 16
•
•
•
•
•
•
Step 17
Step 18
Step 19
•
•
•
Step 20
Step 21
This box applies for gateways; otherwise, Endpoints displays NoData.
Step 22
•
•
Step 23
The window with the search results displays with the following fields:
•
•
•
•
•
If more pages of search results to view exist, click the First, Previous, Next, or Last button.
Step 24
Step 25
Step 26
Step 27
Step 28
View Trace Log Files
You can view the contents of the SDI or SDL trace log file in text or XML format. Use Trace Analysis to view the log files in XML format (see Trace Analysis) or use a text editor to view the log files in text format.
Microsoft Windows 2000 documentation provides detailed information about Microsoft text editors.
Perform the following procedure to view the contents of a trace log file in text format.
Step 1
The Run window displays.
Step 2
Step 3
The Trace folder window displays. The trace directory includes folders for CCM, CMI, CMS, CTI, DBL, RIS, TCD, and TFTP. The trace log files for the Cisco CallManager services exist in these folders.
Step 4
A window with all the trace log files contained within the folder displays; for example, cti001.txt, cti002.txt, cti003.txt.
Tips
Step 5
Table 3-10 contains the trace log file descriptions and defaults.
When the trace data exceeds either the maximum number of lines or the maximum number of minutes for one file, Cisco CallManager closes that file and writes the remaining trace data to the next file in the sequence. For example, you can set up trace files to store a full week of data, with one day of data in each file. To do this, set the number of files to 7, the number of minutes to 1440 (one day), and the number of lines to a large value such as 10000 (or larger for a busy system).
Trace Collection
After configuring trace parameters and running the trace, you can select trace information to collect for analysis. You can base the collection of information on SDL or SDI trace, type of Cisco CallManager service, and time and date of trace. Trace Collection focuses on traces for a specific period.
The following sections describe the procedures for collecting SDI and SDL information:
•
•
Related Topics
Collect SDI Trace Information
Perform these procedures to specify the criteria for an SDI trace collection.
Caution
Step 1
The Cisco CallManager Serviceability window displays.
Step 2
Step 3
Step 4
Step 5
The service you chose appears in the Selected Host:Services box.
Note
Step 6
Step 7
Step 8
Step 9
Step 10
Step 11
Step 12
The Reset Form button reloads the Trace Collection window with all the defaults. This action loses any selection criteria previously made.
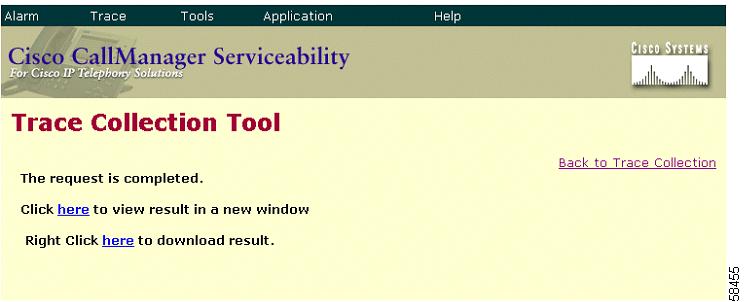
The Trace Collection Request Complete window displays. See Figure 3-1.
Figure 3-1 Trace Collection Results
Step 13
Tips
Step 14
Step 15
Step 16
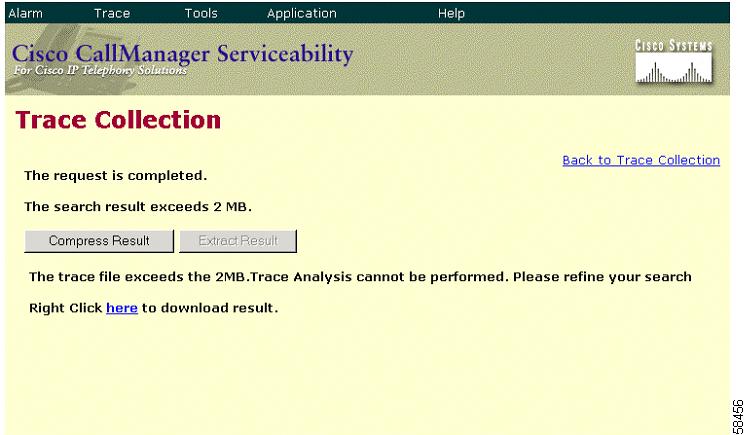
Note
Figure 3-2 Trace Collection Results Exceed 2 MB
Collect SDL Trace Information
Perform these procedures to specify criteria for an SDL trace collection.
Caution
Note
Step 1
The Cisco CallManager Serviceability window displays.
Step 2
Step 3
Step 4
Step 5
The service you chose displays in the Selected Host:Services box.
Note
Step 6
Step 7
Step 8
Step 9
Step 10
Step 11
Step 12
The Trace Collection Request Complete window displays. See Figure 3-1.
Step 13
Step 14
Step 15
Step 16
Trace Analysis
Cisco CallManager system administrators and Cisco engineers use Trace Analysis to debug system problems. After the trace is configured and collected, you request a list of SDI or SDL log files. From the list, you can choose a specific log file and request information from that log file such as host address, IP address, trace type, and device name.
An SDL Trace log file contains call-processing information from services such as Cisco CallManager, Cisco CTIManager, and Cisco TFTP. The system traces the signal distribution layer of the call and logs state transitions into a log file.
An SDI Trace log file contains information for all Cisco CallManager services. The system traces system diagnostic interface information from the services and logs run-time events and traces to a log file.
The easy-to-read SDI and SDL log files display in XML format. The format for contents of log files looks like a table with headings, rows, and columns of information. See Figure 3-4.
The following sections describe the procedure for obtaining trace results:
Related Topics
SDI Trace Analysis
An SDI trace analysis provides you with specific trace information from an SDI log file. After you choose the SDI log file from which you would like detailed information, you choose the search criteria and the fields you want displayed.
Search Criteria and Display Fields
Narrow the SDI Trace Analysis by choosing the search criteria and the display fields. The following list provides search critiera:
•
•
•
•
You can choose the following fields to display:
•
•
•
•
•
•
•
•
•
Procedure
Perform these procedures to obtain the trace results from an SDI Trace file.
Caution
Step 1
The Cisco CallManager Serviceability window appears.
Step 2
Step 3
Step 4
Step 5
Step 6
Step 7
Step 8
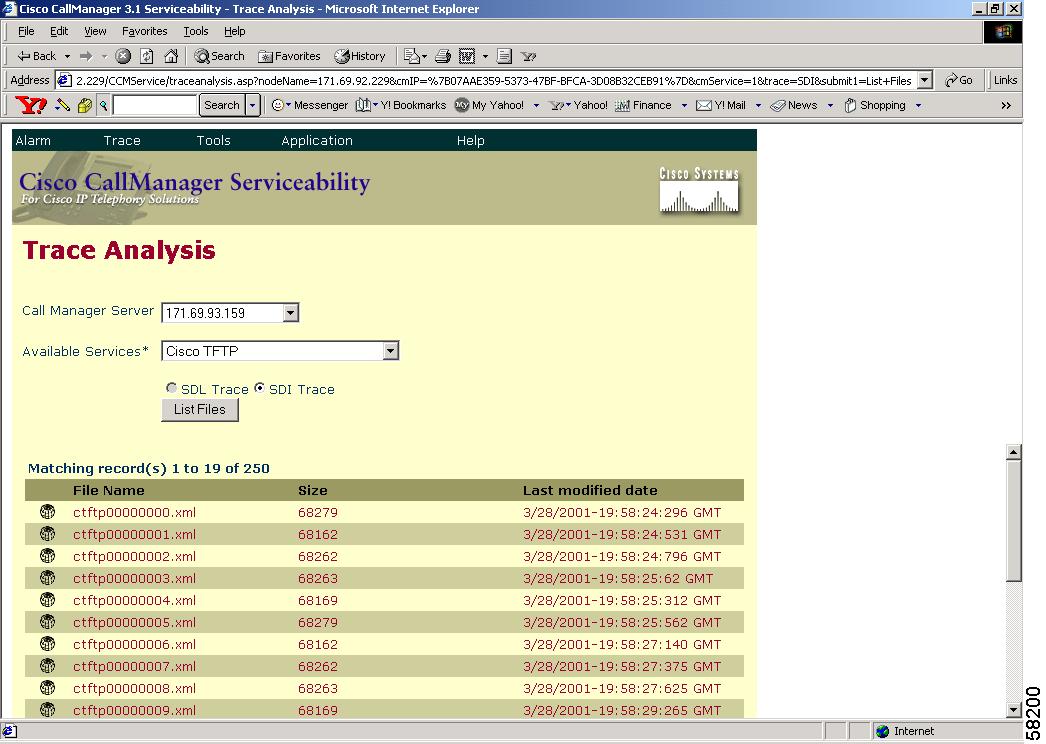
A window displays with a list of all files for the server and services you chose. The filename, size, and last modified date of each file displays. See Figure 3-3.
Note
Step 9
The SDI Trace Analysis window displays. Use this window to choose specific trace information to view and analyze.
Note
Step 10
Step 11
Step 12
Step 13
Step 14
Step 15
Step 16
Step 17
Step 18
Step 19
The trace analysis search results display.
SDL Trace Analysis
An SDL trace analysis provides you with specific trace information from an SDL log file. After you choose the SDL log file from which you would like detailed information, you choose the search criteria and the fields you want displayed.
Search Criteria and Display Fields
Narrow the SDL Trace Analysis by choosing the search criteria and the display fields. The following list provides the search critiera:
•
•
•
•
You can choose the following fields to display:
•
•
•
•
•
•
•
•
•
•
•
•
•
Procedure
Perform these procedures to obtain the trace results from an SDL Trace file.
Caution
Step 1
The Cisco CallManager Serviceability window appears.
Step 2
Step 3
Step 4
Step 5
Step 6
Step 7
Step 8
A window displays with a list of all files for the server and services you chose. The filename, size, and last modified date of each file displays. See Figure 3-3.
Figure 3-3 Trace Analysis Results
Note
Step 9
The SDL Trace Analysis window displays. Use this window to choose specific trace information to view and analyze.
Note
Step 10
Step 11
Step 12
Step 13
Step 14
Step 15
Step 16
Step 17
Step 18
Step 19
Step 20
Step 21
The trace analysis search results display. See Figure 3-4.
Figure 3-4 Trace Records in XML Format