-
Configuring Remote Serviceability for Cisco CallManager, Release 3.0
-
Index
-
About this Guide
-
Introduction to Remote Serviceability
-
Cisco Bridged Telnet
-
The Show Command Interface
-
Using the Performance Console
-
Using the Message Translator
-
Managing with CiscoWorks2000
-
The Path Analysis Interface
-
System Log Management
-
SNMP Instrumentation
-
Cisco Discovery Protocol Support
-
 Feedback
Table Of Contents
Monitoring Cisco CallManager System Performance
Objects, Counters and Instances in Cisco CallManager Release 3.0
Using Performance with Cisco CallManager
Cisco CallManager Release 3.0 Counters
Generating Performance Statistics
Reporting Cisco CallManager Performance Statistics
Using the Performance Console
Performance is a Windows 2000 server application that can display the activities and status of your Cisco CallManager system. It reports both general and specific information in real time.
Cisco CallManager Release 3.0 was designed to run in a Windows 2000 environment. Using the Windows 2000 Performance console, you can monitor the performance of Cisco CallManager Release 3.0 on local or remote installations.
For more information about Performance, consult your Windows 2000 documentation.
Monitoring Cisco CallManager System Performance
You can use Windows 2000 Performance to collect and display system and device statistics for any Cisco CallManager installation. This administrative tool allows you to gain a full understanding of a system without studying the operation of each of its components.
You can use Performance to monitor a variety of system variables in real time. After adding the Cisco CallManager parameters, you can define the terms under which Cisco CallManager will display statistics generated by the system.
Performance Data Structure
Cisco CallManager uses the Performance framework to display performance monitoring statistics. Performance categorizes collections of data as object-oriented code, and the Cisco CallManager installation process expands this collection by adding a set of object counters which describe Cisco CallManager functions.
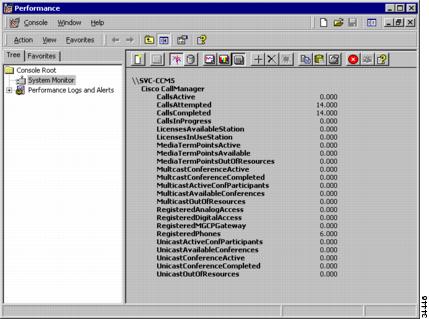
The Cisco CallManager counters are available for display in the Performance interface (see Figure 4-1). The Windows 2000 documentation gives additional information on objects and counters available from the operating system or from other applications.
Figure 4-1 Text Report of Cisco CallManager Release 3.0 Counters
Objects, Counters and Instances in Cisco CallManager Release 3.0
Each Cisco CallManager object includes counters that keep track of statistics like the number of calls in progress or number of calls attempted. These counters define current conditions within groups of related information.
Each group of related information can be considered an object which contains multiple counters, and each of those objects can have more than one instance. All of the objects and counters are automatically added during the Cisco CallManager installation process, and the system parses this information before any statistics are displayed.
This arrangement allows you to retrieve detailed, relevant and timely information from the system for display. You can also customize Performance to track additional objects and counters.
Using Performance with Cisco CallManager
You may want to use Performance to monitor any number of conditions on a Cisco CallManager Release 3.0 system. For example, you can discover the number of calls in progress on a particular Cisco CallManager system at any time, or the number of calls currently being attempted on a Cisco CallManager system.
Starting Performance
To launch the Performance tool:
Step 1
From the Windows 2000 desktop, go to Start > Programs > Administrative Tools > Performance.
Step 2
Once the tool has been launched, you can start setting up, generating, and reporting Cisco CallManager performance data.
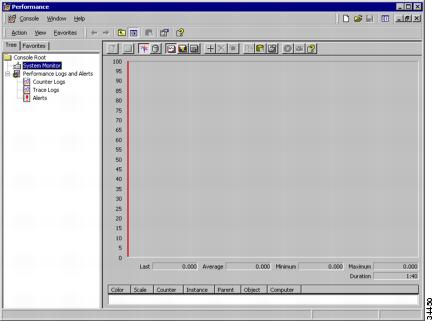
Figure 4-2 Windows 2000 Performance Monitoring Tool
Setting up Performance
Setting up Performance can yield statistics that are customized to reflect your Cisco CallManager system. For example, you may use the information Performance returns to manage traffic on the system by monitoring the number of calls in progress at any particular moment. (See Figure 4-3.)
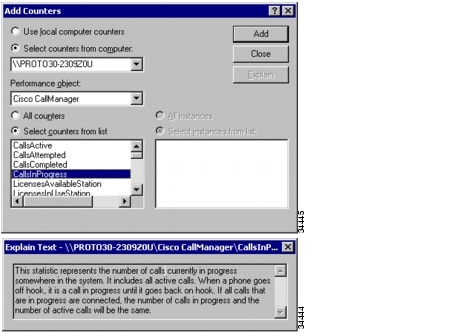
Figure 4-3 Setting Up Performance Monitoring
To set up performance monitoring:
Step 1
Step 2
Step 3
Step 4
Step 5
Cisco CallManager Release 3.0 Counters
This table describes each of the counters available for Cisco CallManager Release 3.0.
Generating Performance Statistics
The statistical data that is retrieved through Performance provides the structure for analysis and interpretation of any local or remote Cisco CallManager system. You may have selected specific counters to return data describing changing activity levels in your system, or you may have chosen to simply react as events occur.
Performance visually formats the statistical data to facilitate your quick comprehension of the state of the system. Using the visual formats provided, you can display Cisco CallManager data in graphical, histogram or report form.
Reporting Cisco CallManager Performance Statistics
To report Cisco CallManager performance statistics:
Step 1
Step 2
Step 3
Extending Your Data Display
Each report form offers a different visual rendition of the statistical data. You may want to repeat the process to choose the most effective display.
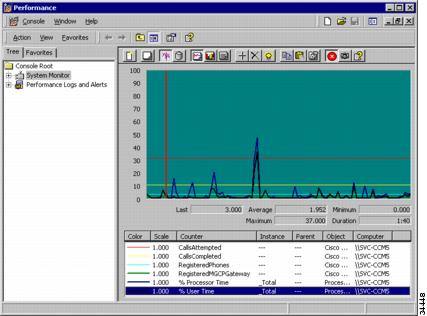
You may want to try adding counters from other objects to see how dynamic data affects your Cisco CallManager data. For purposes of illustration, Figure 4-4 shows active operating system conditions with inactive Cisco CallManager data. When your Cisco CallManager data is added, you can interpret that information in the context of any number of system counters.
By combining standard counters with the Cisco CallManager criteria, you can get a clear picture of your systems so that you can manage them more efficiently.
Figure 4-4 Line Graph of Static Call Data