-
Cisco MDS 9000 Family Troubleshooting Guide, Release 3.x
-
Index
-
New and Changed Information
-
Preface
-
Troubleshooting Overview
-
Troubleshooting Installs, Upgrades, and Reboots
-
Managing Storage Services Modules
-
Troubleshooting Hardware
-
Troubleshooting Mixed Generation Hardware
-
Troubleshooting Licensing
-
Troubleshooting Cisco Fabric Services
-
Troubleshooting Ports
-
Troubleshooting N-Port Virtualization
-
Troubleshooting PortChannels and Trunking
-
Troubleshooting VSANs, Domains, and FSPF
-
Troubleshooting SAN Device Virtualization
-
Troubleshooting IVR
-
Troubleshooting Zones and Zone Sets
-
Troubleshooting Distributed Device Alias Services
-
Troubleshooting FICON
-
Troubleshooting RADIUS and TACACS+
-
Troubleshooting Users and Roles
-
Troubleshooting FC-SP, Port Security, and Fabric Binding
-
Troubleshooting IP Storage Services
-
Troubleshooting IP Access Lists
-
Troubleshooting IPsec
-
Troubleshooting SANTap
-
Troubleshooting Digital Certificates
-
Troubleshooting Call Home
-
Troubleshooting Fabric Manager
-
Before Contacting Technical Support
-
Troublelshooting Tools and Methodology
-
Configuration Limits for Cisco MDS SAN-OS Release 3.x
-
 Feedback
Table Of Contents
Overview of the Troubleshooting Process
Gathering Information Using Common Fabric Manager Tools and CLI Commands
Verifying SAN Element Registration
Fibre Channel End-to-End Connectivity
Primary Troubleshooting Flowchart
Implementing Syslog with Fabric Manager
Implementing Syslog with the CLI
Viewing Logs with Fabric Manager
Viewing the Log from the Supervisor
Troubleshooting Overview
This chapter introduces the basic concepts, methodology, and general troubleshooting guidelines for problems that may occur when configuring and using the Cisco MDS 9000 Family of multilayer directors and fabric switches.
This chapter includes the following sections:
•
Overview of the Troubleshooting Process
•
Overview of the Troubleshooting Process
To troubleshoot your fabric environment, follow these general steps:
Step 1
Step 2
Step 3
To identify the possible problems, you need to use a variety of tools and understand the overall storage environment. For this reason, this guide describes a number of general troubleshooting tools in Appendix B, "Troubleshooting Tools and Methodology," including those that are specific to the Cisco MDS 9000 Family. This chapter also provides a plan for investigating storage issues. See other chapters in this book for detailed explanations of specific issues.
Best Practices
Best practices are the recommended steps you should take to ensure the proper operation of your fabric. We recommend the following general best practices for most SAN fabrics:
•
•
•
•
•
Troubleshooting Basics
This section provides a series of questions that may be useful when troubleshooting a problem with a Cisco MDS 9000 Family switch or connected devices. Use the answers to these questions to plan a course of action and to determine the scope of the problem. For example, if a host can only access some, but not all, of the logical unit numbers (LUNs) on an existing subsystem, then fabric-specific issues (such as FSPF, ISLs, or FCNS) do not need to be investigated. The fabric components can therefore be eliminated from possible causes of the problem.
This section contains the following topics:
•
•
•
General Steps
The two most common symptoms of problems in a storage network are:
•
•
By answering the questions in the following subsections, you can determine the paths you need to follow and the components that you should investigate further. These questions are independent of host, switch, or subsystem vendor.
Answer the following questions to determine the status of your installation:
•
•
•
•
•
To discover a SAN problem, use the following general SAN troubleshooting steps:
Step 1
Step 2
Step 3
Step 4
Step 5
Gathering Information Using Common Fabric Manager Tools and CLI Commands
This section highlights the Fabric Manager tools and CLI commands that are commonly used to troubleshoot problems within your fabric. These tools and commands are a subset of what you may use to troubleshoot your specific problem.
Each chapter in this guide may include additional tools and commands specific to the symptoms and possible problems covered in that chapter.
Common Fabric Manager Tools
Use the following navigation paths in Fabric Manager or Device Manager to access common troubleshooting information:
•
•
•
•
•
•
•
•
•
•
•
•
Fabric Manager and Device Manager also provide the following tools to proactively monitor your fabric:
•
•
•
Common CLI Commands
Issue the following commands and examine the outputs:
•
•
•
•
•
•
•
•
•
•
Note
Note
Verifying Basic Connectivity
Answer the following questions to verify basic connectivity between your end devices:
•
•
•
•
•
•
•
Examine the FLOGI database on the two switches that are directly connected to the host HBA and subsystem ports. Also, verify that both ports (attached to MDS-A and MDS-B) are members of the same VSAN. If both devices are listed in the FCNS database then ISLs are not an issue.
In Fabric Manager, choose Tools > Ping or Tools > Traceroute (or use the fcping or fctrace CLI commands) to verify connectivity. See the "FC Ping and FC Traceroute" section on page B-4.
Verifying SAN Element Registration
Answer the following questions to verify that your end devices are registered to the fabric:
•
–
–
•
–
–
•
–
–
•
–
–
Fibre Channel End-to-End Connectivity
Answering the following questions will help to determine if end-to-end Fibre Channel connectivity exists from a host or subsystem perspective:
•
•
•
•
•
You can use the HBA configuration utilities or the host system logs to determine if the subsystem pWWN or FC ID is listed as a device. This can validate that FSPF is working correctly.
Fabric Issues
Answering the following questions will help to determine the status of the fabric configuration:
•
•
•
•
•
•
•
Port Issues
Initial tasks to perform while investigating port connectivity issues include:
•
•
•
•
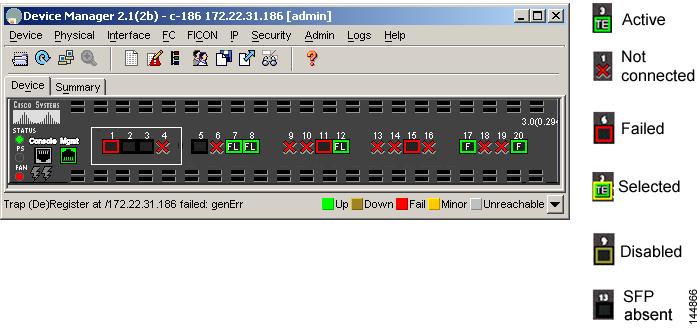
Basic port monitoring using Device Manager begins with the visual display in the Device View. (See Figure 1-1.) Port display descriptions include:
•
•
•
•
•
•
Figure 1-1 Device Manager: Device View
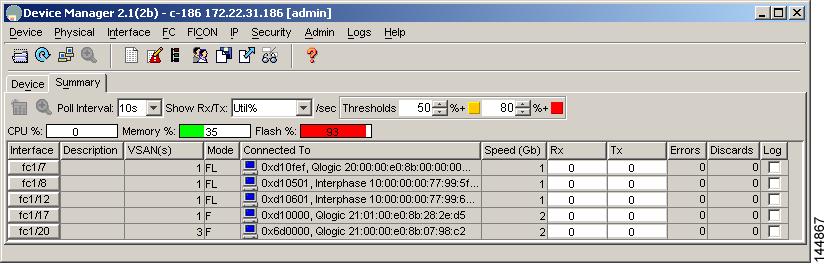
Device Manager: Summary View
In Device Manager, selecting the Summary View expands the information available for port monitoring. (See Figure 1-2.) The display includes the following:
•
•
•
•
•
•
Figure 1-2 Device Manager: Summary View
Device Manager: Port Selection
To drill down for additional port information, use the Device View or Summary View. Select and double-click any port. The initial display shows administrative settings for Mode, Speed, and Status, plus current operational status, failure cause, and date of the last configuration change.
Additional tabs include the following:
•
•
•
•
•
•
•
•
Device Manager: Port Monitoring
To display additional details about port traffic, use the Device View or Summary View. In Device View, choose one or more ports, right-click and choose Monitoring from the pop-up menu. In Summary View, choose one or more interfaces, and click the Monitor tool. The initial display shows traffic statistics for the selected interval, including bytes and frames transmitted and received.
Additional tabs include the following:
•
•
•
•
•
•
•
Device Manager: Oversubscription Information
Device Manager provides oversubscription information for supported switching modules and line cards. Use the Device View to view an individual module and then right-click to select from the following tasks:
•
•
•
•
Note
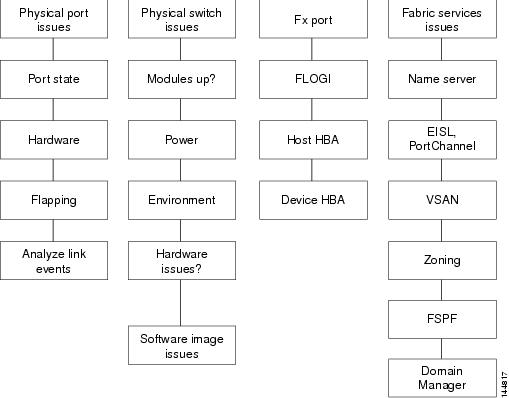
Primary Troubleshooting Flowchart
The flowchart in Figure 1-3 shows the overall troubleshooting process. Begin any troubleshooting investigation by checking one of the following four areas:
•
•
•
•
Figure 1-3 Troubleshooting Process Flowchart
System Messages
The system software sends these syslog (system) messages to the console (and, optionally, to a logging server on another system) during operation. Not all messages indicate a problem with your system. Some messages are purely informational, while others might help diagnose problems with links, internal hardware, or the system software.
This section contains the following topics:
•
•
System Message Text
Message-text is a text string that describes the condition. This portion of the message might contain detailed information about the event, including terminal port numbers, network addresses, or addresses that correspond to locations in the system memory address space. Because the information in these variable fields changes from message to message, it is represented here by short strings enclosed in square brackets ([ ]). A decimal number, for example, is represented as [dec].
PORT-3-IF_UNSUPPORTED_TRANSCEIVER: Transceiver for interface [chars] is not supported.Use this string to find the matching system message in the Cisco MDS 9000 Family System Messages Reference.
Each system message is followed by an explanation and recommended action. The action may be as simple as "No action required." It may involve a fix or a recommendation to contact technical support as shown in the following example:
Error Message    PORT-3-IF_UNSUPPORTED_TRANSCEIVER: Transceiver for interface [chars]
is not supported.
Explanation Transceiver (SFP) is not from an authorized vendor.
Recommended Action Enter the show interface transceiver CLI command or similar Fabric Manager/Device Manager command to determine the transceiver being used. Please contact your customer support representative for a list of authorized transceiver vendors.
Syslog Server Implementation
The syslog facility allows the Cisco MDS 9000 Family platform to send a copy of the message log to a host for more permanent storage. This can be useful if the logs need to be examined over a long period of time or when the Cisco MDS switch is not accessible.
This example will demonstrate how to configure a Cisco MDS switch to utilize the syslog facility on a Solaris platform. Although a Solaris host is being used, syslog configuration on all UNIX and Linux systems is very similar.
Syslog uses the concept of a facility to determine how it should be handled on the syslog server (the Solaris system in this example), and the message severity. Therefore, different message severities can be handled differently by the syslog server. They could be logged to different files or e-mailed to a particular user. Specifying a severity determines that all messages of that level and greater severity (lower number) will be acted upon.
Note
Syslog Client: switch1
Syslog Server: 172.22.36.211 (Solaris)
Syslog facility: local1
Syslog severity: notifications (level 5, the default)
File to log MDS messages to: /var/adm/MDS_logs
Implementing Syslog with Fabric Manager
To configure system message logging servers, follow these steps:
Step 1
In Device Manager, choose Logs > Syslog > Setup and click the Servers tab in the Syslog dialog box.
Step 2
Step 3
Step 4
Step 5
Step 6
Device Manager allows you to view event logs on your local PC as well as those on the switch. For a permanent record of all events that occur on the switch, you should store these messages off the switch. To do this the Cisco MDS switch must be configured to send syslog messages to your local PC and a syslog server must be running on that PC to receive those messages. These messages can be categorized into four classes:
•
•
•
•
Note
Implementing Syslog with the CLI
To configure a syslog server using the CLI, follow these steps:
Step 1
switch1# config terminalEnter configuration commands, one per line. End with CNTL/Z.switch1(config)# logging server 172.22.36.211 6 facility local1To display the configuration:
switch1# show logging serverLogging server: enabled{172.22.36.211}server severity: notificationsserver facility: local1Step 2
a.
#Below is for the MDS 9000 logginglocal1.notice /var/adm/MDS_logsb.
#touch /var/adm/MDS_logsc.
# /etc/init.d/syslog stop# /etc/init.d/syslog startsyslog service starting.d.
# ps -ef |grep syslogdroot 23508 1 0 11:01:41 ? 0:00 /usr/sbin/syslogdStep 3
# tail -f /var/adm/MDS_logsSep 17 11:07:41 [172.22.36.142.2.2] : 2004 Sep 17 11:17:29 pacific:%PORT-5-IF_DOWN_INITIALIZING: %$VSAN 1%$ Interface fc1/2 is down (Initializing)Sep 17 11:07:49 [172.22.36.142.2.2] : 2004 Sep 17 11:17:36 pacific: %PORT-5-IF_UP:%$VSAN 1%$ Interface fc1/2 is up in mode TESep 17 11:07:51 [172.22.36.142.2.2] : 2004 Sep 17 11:17:39 pacific:%VSHD-5-VSHD_SYSLOG_CONFIG_I: Configuring console from pts/0(dhcp-171-71-49-125.cisco.com)
Troubleshooting with Logs
Cisco SAN-OS generates many types of system messages on the switch and sends them to a syslog server. These messages can be viewed using Fabric Manager or the CLI to determine what events may have led up to the current problem condition you are facing.
This section contains the following topics:
•
•
Viewing Logs with Fabric Manager
Fabric Manager and Device Manager present concise views of the generated system messages and other logged events:
•
•
•
Viewing Logs with the CLI
The following CLI commands are available to access and view logs on a switch:
Musky-9506# show logging ?console Show console logging configurationinfo Show logging configurationlast Show last few lines of logfilelevel Show facility logging configurationlogfile Show contents of logfilemodule Show module logging configurationmonitor Show monitor logging configurationnvram Show NVRAM logserver Show server logging configuration<cr> Carriage ReturnExample 1-1 shows an example of the show logging CLI command output.
Example 1-1 show logging Command
Musky-9506# show logging serverLogging server: enabled{10.91.51.204}server severity: criticalserver facility: userViewing the Log from the Supervisor
You can view system messages from Device Manager if Device Manager is running from the same workstation as the Fabric Manager Server. Choose Logs > Events > current to view the system messages on Device Manager. The columns in the events table are sortable. In addition, you can use the Find button to locate text within the table.
You can view switch-resident logs even if you have not set up your local syslog server or your local PC is not in the switch's syslog server list. Because of memory constraints, these logs will wrap when they reach a certain size. The switch syslog has two logs: an NVRAM log that holds a limited number of critical and greater messages and a nonpersistent log that contains notice or greater severity messages. Hardware messages are part of these logs.
Use the show logging CLI command to view the logs on the supervisor.
Viewing NVRAM logs
System messages that are priority 0, 1, or 2 are logged into NVRAM on the supervisor module. After a switch reboots, you can display these syslog messages in NVRAM using the show logging nvram CLI command. See Example 1-2.
Example 1-2 Show logging nvram
switch# show logging nvram2005 Sep 16 13:19:20 172.20.150.82 %PLATFORM-2-PS_OK: Power supply 2 ok (Serialnumber )2005 Sep 16 13:19:20 172.20.150.82 %PLATFORM-2-PS_FANOK: Fan in Power supply 2 ok2005 Sep 16 13:19:20 172.20.150.82 %PLATFORM-2-FANMOD_FAN_OK: Fan module 1 (Front fan) ok2005 Sep 16 13:19:20 172.20.150.82 %PLATFORM-2-FANMOD_FAN_OK: Fan module 2 (Rear fan) ok2005 Sep 16 13:19:20 172.20.150.82 %PLATFORM-2-CHASSIS_CLKMODOK: Chassis clock module A ok2005 Sep 16 13:19:20 172.20.150.82 %PLATFORM-2-CHASSIS_CLKMODOK: Chassis clock module B ok2005 Sep 16 13:19:20 172.20.150.82 %PLATFORM-2-CHASSIS_CLKSRC: Current chassis clock source is clock-A2005 Sep 16 13:19:36 172.20.150.82 %PLATFORM-2-PFM_STDBY_BIOS_STUCK: standby supervisor bios failed2005 Sep 16 13:20:19 172.20.150.82 %IMAGE_DNLD-SLOT13-2-IMG_DNLD_STARTED: Module image download process. Please wait until completion...2005 Sep 16 13:20:32 172.20.150.82 %IMAGE_DNLD-SLOT13-IMG_DNLD_COMPLETE: Module image download process. Download successful.2005 Sep 16 15:44:46 172.20.150.82 %PLATFORM-2-PFM_STDBY_BIOS_STUCK: standby supervisor bios failed2005 Sep 16 15:44:53 172.20.150.82 %PLATFORM-2-MOD_ALL_PWRDN_NOXBAR: All modules powered down due to non-availability of xbar modules2005 Sep 16 15:45:41 172.20.150.82 %PLATFORM-2-MOD_PWRUP_XBAR: Modules powered up due to xbar availability2005 Sep 18 15:12:07 172.20.150.82 %MODULE-2-MOD_FAIL: Initialization of module 14 (serial: JAB092501FC) failedContacting Customer Support
If you are unable to solve a problem after using the troubleshooting suggestions in this guide, contact a customer service representative for assistance and further instructions. Before you call, have the following information ready to help your service provider assist you as quickly as possible:
•
•
•
•
•
•
After you have collected this information, see the "Obtaining Documentation, Obtaining Support, and Security Guidelines" section on page xxxii.
For more information on steps to take before calling Technical Support, see the "Before Contacting Technical Support" section on page A-1.