|
System Alerts with sFlow
|
Release 25.1.1 |
Introduced in this release on: Fixed Systems (8010 [ASIC: A100])
This feature is now supported on:
|
| System Alerts with sFlow |
Release 24.4.1 |
Introduced in this release on: Fixed Systems (8200 [ASIC: P100], 8700 [ASIC: P100, K100])(select variants only*); Modular
Systems (8800 [LC ASIC: P100])(select variants only*)
The syslog notifications with sFlow are now available on the following hardware.
*This feature is now supported on:
-
8212-48FH-M
-
8711-32FH-M
-
8712-MOD-M
-
88-LC1-12TH24FH-E
-
88-LC1-52Y8H-EM
-
88-LC1-36EH
|
|
System alerts related to sFlow
|
Release 7.5.3
|
The following syslog notifications are available with sFlow:
-
FLOW_SAMPLES_DROPPED - This alert is seen whenever the buffer becomes full with sampled flow data, either due to a high sampling
rate or an increase in the traffic rate.
-
FLOW_SAMPLES_DROPPING_STOPPED - This alert is seen when the buffer reverts to its regular state.
-
BUFFER_SIZE_EXCEEDED - This alert signals that the flow monitor buffer has reached its capacity with sampled flow data, which
could be a result of a low export rate limit or a high sampling rate.
-
BUFFER_EXCEEDING_STOPPED - This alert is seen when the flow monitor buffer reverts to its regular state.
|
|
Ingress sFlow enhancements
|
Release 25.4.1 |
Introduced in this release on: Fixed Systems (8010 [ASIC: A100])(select variants only*)
This feature is now supported on:
-
8011-12G12X4Y-A
-
8011-12G12X4Y-D
|
| Ingress sFlow enhancements |
Release 25.1.1 |
Introduced in this release on: Fixed Systems (8010 [ASIC: A100])
This feature is now supported on:
|
| Ingress sFlow enhancements |
Release 24.4.1 |
Introduced in this release on: Fixed Systems (8200 [ASIC: P100], 8700 [ASIC: P100, K100])(select variants only*); Modular
Systems (8800 [LC ASIC: P100])(select variants only*)
The Ingress sFlow enhancements added in Cisco IOS XR Release 7.3.3 now apply to the following hardware thus ensuring improved
scalability and decreased volume of packets received.*This feature is now supported on:
-
8212-48FH-M
-
8711-32FH-M
-
8712-MOD-M
-
88-LC1-12TH24FH-E
-
88-LC1-52Y8H-EM
-
88-LC1-36EH
|
|
Ingress sFlow enhancements
|
Release 7.3.3
|
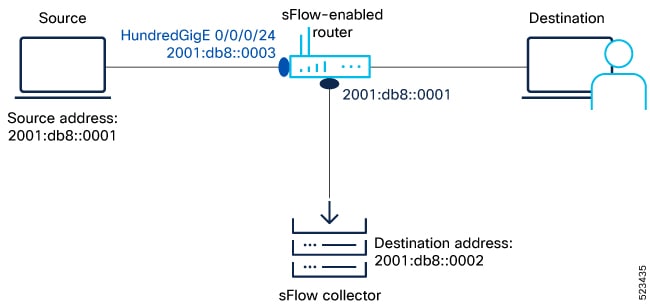
The incoming sFlow packet offers the following enhancements to improve scalability and decrease the volume of packets received:
-
Expansion of sFlow datagram size—from 1500B to 9KB
-
Tunnel encapsulation—The packet header now supports an extended structure encompassing tunnel header information. The egress
packet extracts the tunnel information during decapsulation.
-
sFlow collector indicates discarded packets and locally targeted packets at the output interfaces, in a specific format along
with drop value.
|
| sFlow on L2 interfaces |
Release 25.1.1 |
Introduced in this release on: Fixed Systems (8010 [ASIC: A100])
This feature is now supported on:
|
| sFlow on L2 interfaces |
Release 24.4.1 |
Introduced in this release on: Fixed Systems (8200 [ASIC: P100], 8700 [ASIC: P100, K100])(select variants only*); Modular
Systems (8800 [LC ASIC: P100])(select variants only*)
sFlow support on L2 interfaces is now extended on the following hardware to ensure efficient traffic monitoring on your network.*This feature is now supported on:
-
8212-48FH-M
-
8711-32FH-M
-
8712-MOD-M
-
88-LC1-12TH24FH-E
-
88-LC1-52Y8H-EM
-
88-LC1-36EH
|
|
sFlow for L2 interfaces
|
Release 7.3.1
|
Ingress sFlow on an L2 interface is introduced. Support for sFlow existed in earlier releases.
|
| Sampled flow |
Release 25.1.1 |
Introduced in this release on: Fixed Systems (8010 [ASIC: A100])
This feature is now supported on:
|
| Sampled flow |
Release 24.4.1 |
Introduced in this release on: Fixed Systems (8200 [ASIC: P100], 8700 [ASIC: P100, K100])(select variants only*); Modular
Systems (8800 [LC ASIC: P100])(select variants only*)
This feature is now supported on the following hardware thus allowing to monitor real-time traffic in your data networks and
forward the sample data to the central data collector using the sampling mechanism in the sFlow agent software.*This feature is now supported on:
-
8212-48FH-M
-
8711-32FH-M
-
8712-MOD-M
-
88-LC1-12TH24FH-E
-
88-LC1-52Y8H-EM
-
88-LC1-36EH
|
| Flow monitoring on Egress Interface
|
Release 25.1.1 |
Introduced in this release on: Fixed Systems (8010 [ASIC: A100])
This feature is now supported on:
|
| Flow monitoring on Egress Interface
|
Release 24.1.1 |
Introduced in this release on: Fixed Systems (8200 [ASIC: P100], 8700 [ASIC: P100, K100])(select variants only*); Modular
Systems (8800 [LC ASIC: P100])(select variants only*)
You can now get precise insights into encapsulated and decapsulated data, prioritize critical outbound traffic, and ensure
implementation of security measures. This is accomplished by activating egress flow monitoring on outbound interfaces within
your network using sFlow.
*This feature is now supported on:
-
8212-48FH-M
-
8711-32FH-M
-
8712-MOD-M
-
88-LC1-12TH24FH-E
-
88-LC1-52Y8H-EM
-
88-LC1-36EH
|
|
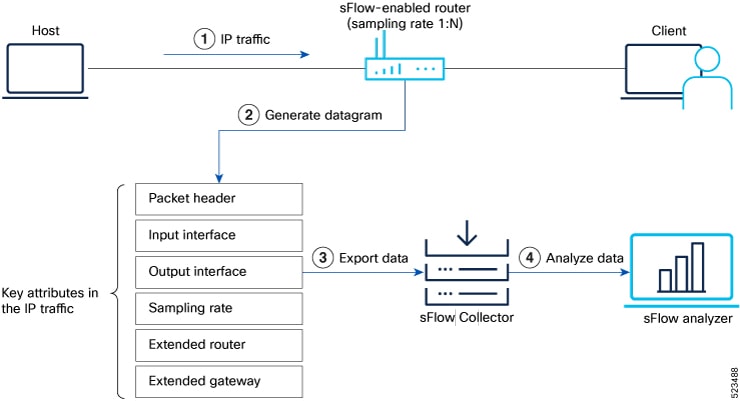
Sampled flow
|
Release 7.2.12
|
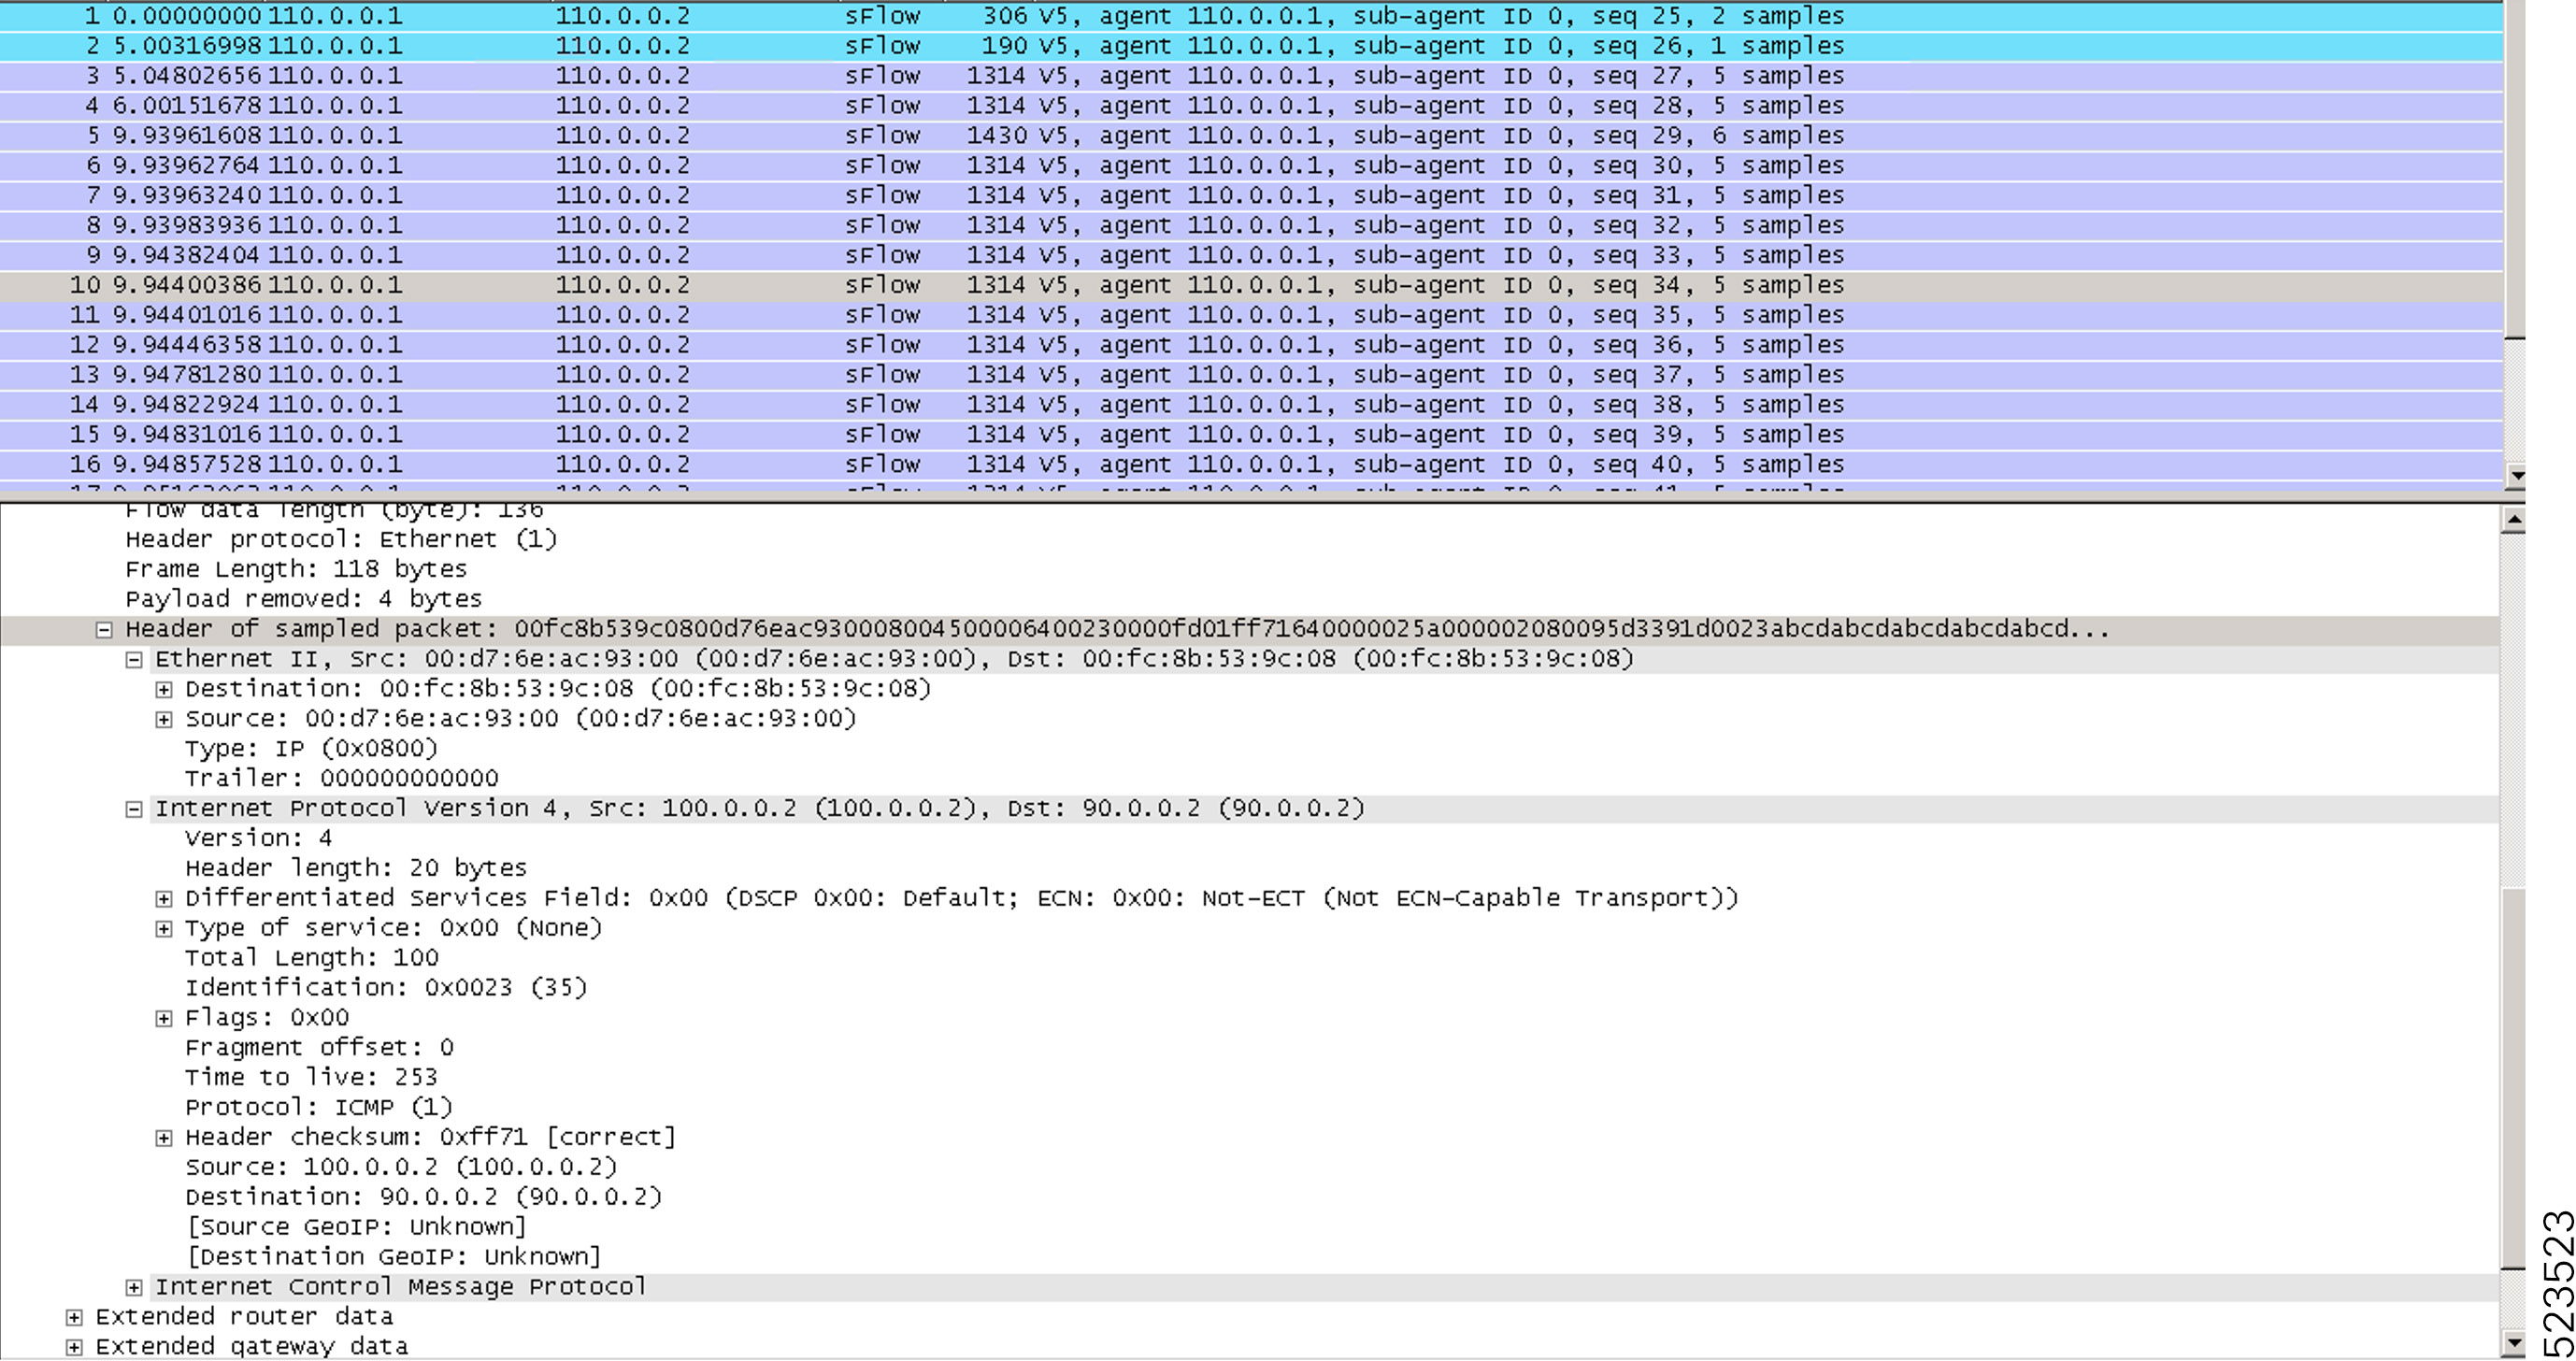
Sampled flow (sFlow) allows you to monitor real-time traffic in data networks. It uses sampling mechanism in the sFlow agent
software to monitor traffic and to forward the sample data to the central data collector.
|

 Feedback