SAN アナリティクスの設定

この章では、SAN アナリティクス機能とその設定方法について説明します。

SAN Analytics の構成の機能履歴

表 1. SAN Analytics の構成の機能履歴

機能名

リリース

機能情報

AMC をリセット

9.3(1)

AMC をリセットすることによる分析の中断のないリカバリのサポートが追加されました。

SAN Analytics

9.2(2)

Cisco MDS 9700 48-Port 64-Gbps Fibre Channel Switching Module がサポートされているハードウェアの一覧に追加されました。

一部のフロー メトリックが追加され、一部のフロー メトリックが非推奨になりました。詳細については、付録を参照してください。

Virtual Machine Identifier (VMID) Analytics

8.5(1)

VMID Analytics 機能は、VM レベルでパフォーマンスの問題を監視、分析、特定、およびトラブルシューティングするために導入されました。

analytics vm-tag veid コマンドが導入されました。

SAN Analytics

8.5(1)

NVMe トラフィックの分析は、IO フレームのみをカウントするように変更されました。以前は、管理フレームも含まれていました。

ShowAnalytics オーバーレイ CLI の使用

8.5(1)

ShowAnalytics コマンドの --appendfile および --outfile オプションが追加されました。

ShowAnalytics --help コマンドの出力が変更されました。

ShowAnalytics オーバーレイ CLI の使用

8.4(2)

ShowAnalytics コマンドとそのオプションのコマンド キーワードと変数を一覧表示するオプションが追加されました。

ShowAnalytics コマンドに Non-Volatile Memory Express (NVMe) メトリックのサポートが追加されました。

ShowAnalytics オーバーレイ CLI の使用

8.4(1a)

ShowAnalytics コマンドの --top オプションの --alias 引数を追加しました。

SAN Analytics

8.4(1)

NVMe 分析タイプのサポートが追加されました。

新しい NVMe ビュー インスタンスとフロー メトリックが追加されました。詳細については、フロー メトリックを参照してください。

次のコマンドが変更されました。

  • fc-all および fc-nvme キーワードが [no] analytics type {fc-all | fc-nvme | fc-scsi } コマンドに追加されました。

  • type fc-scsi キーワードが show analytics flow congestion-drops [vsan number] [module number port number] コマンドから削除されました。

  • ShowAnalytics コマンドに --errorsonly --evaluate-npuload --minmax --outstanding-io --top --vsan-thput , --alias --limit --key --module --progress 、および --refresh オプションを追加しました。

SCSI および NVMe 分析タイプのスキーマを表示するために、show analytics schema {fc-nvme | fc-scsi} {view-instance instance-name | views} コマンドが導入されました。

クエリ構文

8.4(1)

NVMe 分析タイプのサポートが追加されました。

次のクエリ構文は、fc-nvme 分析タイプをサポートしています。

select all | column1[, column2, column3, …] from analytics_type.view_type [ where filter_list1 [ and filter_list2 …]] [ sort column [asc | desc]] [ limit number]

SAN Analytics

8.4(1)

次のコマンドの出力は変更されました。

  • show analytics port-sampling module number

  • show analytics system-load

  • ShowAnalytics

SAN Analytics

8.4(1)

サポートされているハードウェアのリストに Cisco MDS 9396T 32 Gbps 96 ポート ファイバ チャネル ファブリック スイッチおよび Cisco MDS 9148T 32 Gbps 48 ポート ファイバ チャネル ファブリック スイッチを追加しました。

クエリ構文

8.3(2)

昇順または降順でのメトリックおよびメタデータ フィールドのソートのサポートが追加されました。

asc オプションと desc オプションがクエリ構文に追加されました。

select all | column1[, column2, column3, …] from analytics_type.view_type [ where filter_list1 [ and filter_list2 …]] [ sort column [asc | desc] ] [ limit number]

show analytics system-load コマンドが導入されました。

SAN Analytics

8.3(1)

次のコマンドが導入されました。

no analytics name query_name

Cisco MDS NX-OS リリース 8.2(1) から Cisco MDS NX-OS リリース 8.3(1) で変更されたコマンドについては、表 1を参照してください。

ポート サンプリング

8.3(1)

ポート サンプリング機能を使用すると、監視対象モジュール内のポートのサブセットからデータを収集し、ポートの複数のサブセットを循環し、定期的なポート サンプリング間隔でそれらのポートからのデータをストリーミングできます。

次のコマンドが導入されました。

  • analytics port-sampling module number size number interval seconds

  • show analytics port-sampling module number

SAN Analytics

8.3(1)

いくつかのフロー メトリックが導入されました。詳細については、「フロー メトリック」を参照してください。

Cisco MDS 9132T 32-Gbps 32-Port Fibre Channel Switch の SAN Analytics のサポート

8.3(1)

Cisco MDS 9132T 32-Gbps 32-Port Fibre Channel Switch がサポートされているハードウェアの一覧に追加されました。

Cisco N-Port Virtualizer(Cisco NPV)スイッチの SAN Analytics のサポート

8.3(1)

Cisco NPV スイッチで SAN Analytics 機能を使用する際の注意事項と制約事項が追加されました。

SAN Analytics

8.2(1)

Cisco MDS 9700 48-Port 32-Gbps Fibre Channel Switching Module がサポートされているハードウェアの一覧に追加されました。

SAN Analytics

8.2(1)

SAN Analytics 機能を使用すると、Cisco MDS 9000 シリーズ マルチレイヤ スイッチにおけるパフォーマンスの問題を監視、分析、特定、およびトラブルシューティングできます。

次のコマンドが導入されました。

  • analytics type fc-scsi

  • analytics query “query_string” type timer timer_val

  • clear analytics “query_string”

  • feature analytics

  • purge analytics “query_string”

  • ShowAnalytics

  • show analytics {query {“query_string” | id result} | type fc-scsi flow congestion-drops [ vsan number] [ module number port number]}

SAN アナリティクスの概要


(注)  

Cisco MDS NX-OS リリース 8.3(1) またはそれ以降のリリースでは、SAN Analytics 機能を使用することをお勧めします。


SAN アナリティクス機能を使用すると、Cisco MDS スイッチにおけるパフォーマンスの問題を監視、分析、特定、およびトラブルシューティングできます。サポートされているスイッチの一覧については、SAN アナリティクスのハードウェア要件を参照してください。

ファイバ チャネル SAN 環境では、すべてのデバイスのパフォーマンスをプロビジョニングおよび監視して、それらのデバイスのパフォーマンスの妨げになる問題を解決可能にすることが重要です。SAN アナリティクス機能は、フローを双方向で監視し、モジュールまたは個々のスイッチ内でネットワーク プロセッサ ユニット(NPU)のフローを関連付けて、完全に分析されたネットワーク データをユーザーに提供します。

次の図は、SAN アナリティクス機能の各機能を示しています。

図 1. SAN アナリティクスの概要

SAN アナリティクスのハードウェア要件

次の表は、SAN アナリティクス機能をサポートする Cisco MDS ハードウェアの一覧です。

表 2. サポートされているハードウェアの一覧

スイッチ

モジュール

Cisco MDS 9700 シリーズ マルチレイヤ ディレクタ

  • Cisco MDS 9700 48-Port 32-Gbps Fibre Channel Switching Module(DS-X9648-1536K9)

  • Cisco MDS 9700 48-Port 64-Gbps Fibre Channel Switching Module(DS-X9748-3072K9)

Cisco MDS 9396T 32-Gbps 96-Port Fibre Channel Fabric Switch

  • 96 x 32-Gbps 固定ポート

  • 32-Gbps Fibre Channel Expansion Module(M9XT-FC1632)

Cisco MDS 9148T 32-Gbps 48-Port Fibre Channel Fabric Switch

  • 96 x 32-Gbps 固定ポート

Cisco MDS 9132T 32-Gbps 32-Port Fibre Channel Fabric Switch

  • 32 Gbps 固定ポート X 16

  • 16-Port 32-Gbps Fibre Channel Expansion Module(M9XT-FC1632)

SAN Analytics の注意事項と制約事項

  • 次のような場合、この機能は VSAN ではサポートされません。

    • default zone permit が設定されている場合。

    • VSAN 間ルーティング(IVR)または Cisco MDS 9000 Input/Output Accelerator(IOA)機能が有効になっている場合。

    • 相互運用性モードが有効になってい場合。

    • インオーダー デリバリ(IOD)が有効になっている場合。

  • この機能には、次の制約事項があります。

    • プッシュ クエリの最大数は 8 です。プッシュ クエリの詳細については、SAN アナリティクスについてを参照してください。

    • 個々のメトリックのクリアや消去はサポートされていません。メトリックのクリアおよび消去の詳細については、SAN アナリティクスについてを参照してください。

    • クエリ構文の where 条件には、等号(=)演算子のみ使用できます。詳細については、「クエリ構文」を参照してください。

  • Cisco Nexus スイッチおよび Cisco UCS ファブリック インターコネクト(SAN ポート チャネル)に接続されているポート チャネルのメンバーであるポートでは、analytics type コマンドを設定しないことをお勧めします。これにより、欠落した誤ったメトリックが表示されるのを回避できます。

  • Cisco NPV モードで動作しているスイッチの場合、NX-OS による自動ロード バランシングまたはユーザによる手動リバランシングのいずれかによって、サーバ ログインがあるアップリンクから別のアップリンクに移動すると、show analytics system-load コマンド出力にそのスイッチの誤った ITL カウントが表示される場合があります。これは、自動負荷分散デバイスが別のアップストリーム リンク経由で再度ログインする必要がある場合に発生します。その場合、新しい FCID が割り当てられます。古い分析デバイスの FCID メトリックは自動的に削除されないため、これらの古いエントリにより、追加の ITL カウントが発生します。show analytics system-load コマンドを使用して正しいデータを取得する前に、最初にpurge analytics 「query_string」 コマンドを使用してメトリックをパージする必要があります。

  • VMID 分析機能を最初に有効にした後、show analytics system-load コマンド出力に誤った ITL カウントが表示されます。正しい ITL カウントを取得するには、purge analytics “select all from fc-scsi.port” コマンドを使用して正しいデータを取得する前に、まず show analytics system-load コマンドを使用してメトリックをパージする必要があります。

  • Cisco MDS 48 ポート 64 Gbps ファイバ チャネル スイッチング モジュール(DS-X9748-3072K9)で、分析エンジン ポート セットの ITL レコードの総数が 4000 を超えると、不完全な分析データが報告されることがあります。ポート セット内のフロー数を減らしてこの問題を回避する方法については、分析エンジン ポート セットのマッピング セクションを参照してください。

    この制限を超えると、次の syslog が表示されます。
    
    %ANALYTICS_LC_MGR-SLOT1-4-ANALYTICS_LC_MGR_4K_ITL_LIMIT_HIT: Analytics data may be incomplete on few ports : Affected ports are fc1/5,fc1/1,fc1/7,fc1/3
    
  • ポート チャネルの一部であるインターフェイスでの分析サポートは、全体的な分析スケールの数値に影響を与える可能性があります。

  • クエリ構文の select all オプションは、VMID メトリックを表示しません。VMID メトリックを表示するには、クエリ文字列で 1 つ以上の個別のメトリックを指定し、vmid キーを含める必要があります。たとえば、show analytics query "select port,vsan,app_id,vmid,target_id,initiator_id,lun, active_io_read_count,active_io_write_count from fc-scsi.scsi_initiator_itl_flow" のようになります。

  • この機能を DCNM(またはサード パーティ製のデバイスやアプリケーション)とともに使用する場合は、Network Time Protocol(NTP)を同期させる必要があります。NTP の詳細については、Cisco MDS 9000 シリーズ基本コンフィギュレーション ガイド [英語] の「Configuring NTP」セクションを参照してください。

  • この機能は、SD ポートと呼ばれる Switched Port Analyzer(SPAN; スイッチド ポート アナライザ宛先ポート、および NP ポートではサポートされていません。この機能をあるインターフェイスの範囲で有効にする場合は、そのインターフェイスの範囲に SD ポートや NP ポートが存在しないことを確認してください。存在する場合、この機能はいずれのインターフェイスでも有効になりません。

  • この機能は、標準ベースのコマンドを含むフレームのみを分析します。Cisco MDS NX-OS リリース 8.2(x) およびリリース 8.3(x) では、ファイバー チャネル プロトコル(FCP)SCSI 読み取りおよび書き込みコマンドがサポートされています。Cisco MDS NX-OS リリース 8.4(1) 以降、ファイバ チャネル SCSI とファイバ チャネル Non-Volatile Memory Express(NVMe)の両方の読み取りおよび書き込みコマンドがサポートされます。この機能は、独自のコマンドを含むフレームを分析しません。これらは通常、ストレージ レプリケーション テクノロジで使用されます。

  • feature analytics コマンドが Cisco MDS NX-OS リリース 8.2(1) またはリリース 8.3(1) で有効になっている場合、Cisco MDS NX-OS リリース 8.2(1) とリリース 8.3(1) 間でのアップグレードやダウングレードは、アップグレードやダウングレードの前に no feature analytics コマンドを使用してこの機能を無効にし、その後 feature analytics コマンドを使用してこの機能を再度、有効にした場合にのみサポートされます。

    Cisco MDS NX-OS リリース 8.3(1) 以降のリリースからリリース 8.2(1) にダウングレードした場合、この機能は、不具合 CSCvm19337 に記載されている回避策を実行した後にのみ機能します。

  • アップグレード、ダウングレード、スイッチのリロード、またはモジュールのリロード後は、すべてのフロー メトリックが消去されます。

  • スイッチがソフト ゾーニング モードの場合、この機能はサポートされません。

  • ストリーミング サンプル間隔(snsr-grp id sample-interval interval )、ポート サンプリング間隔(analytics port-sampling module number size number interval seconds )、およびプッシュ クエリ間隔(analytics query “query_string” name query_name type periodic [ interval seconds] [clear] [differential] )は、同じ値に設定することをお勧めします。また、最初にプッシュ クエリ間隔、次にポート サンプリング間隔、最後にストリーミング サンプル間隔を変更または設定することをお勧めします。


    注意    


  • ネットワーク プロセッサ ユニット(NPU)のキャパシティの超過および超過に伴う結果を回避するためには、ポート サンプリング機能を使用してフロー メトリックを分析します。詳細については、ポート サンプリングを参照してください。

  • ビュー インスタンスとその関連メトリックを消去後は、数秒待機してから、プル クエリを実行することをお勧めします。これは、消去操作が完了するまでは、フロー メトリックの一部のフィールドに無関係な値が含まれていることがあるためです。

  • NVMe 分析は、Fibre Channel Non-Volatile Memory Express - 1(FC-NVMe-1)および FC-NVMe-2 標準と互換性があります。

  • この機能は、ポート単位ですべてのフロー メトリックを追跡します。フローの要求と応答が 1 台のスイッチの異なる物理ポートにまたがっている場合、一部のフロー メトリックが正確に計算されない可能性があります。この条件は特に、Inter-Switch Link(ISL)ポート(E ポート)でこの機能が有効になっている場合に発生します。

    以下に、要求の応答を異なる ISL ポートで確認できるシナリオを示します。

    • ユーザーが vsan ID loadbalancing src-dst-id コマンドを使用して、ロードバランシング方式を Source ID(SID)-Destination ID(DID)に変更している場合。

    • ユーザーが switchport trunk mode off コマンドを使用して、ISL(E ポート)を非トランキング モードに設定している場合。

    • ポート チャネルの一部である ISL(E ポート)とポート チャネルが no channel mode active コマンドを使用してアクティブ モードに設定されていない場合。

    • この機能は、非トランク ISL またはポート チャネルでは機能しません。この機能を E ポートで機能させるには、E ポートのトランク モードをオンにする必要があります。

    • ISL は、ポート チャネルの一部になるようにバンドルされていません。つまり、ECMP ISL および ECMP ポート チャネルはサポートされません。

    • Cisco MDS 9250i マルチサービス ファブリック スイッチまたは Cisco MDS 9148S 16-G マルチレイヤ ファブリック スイッチ、および CiscoMDS 9700 48-Port 32-Gbps Fibre Channel Switching Module(DS-X9648-1536K9)間にポート チャネルが存在する場合。

  • この機能は、FICON 対応の Cisco MDS 9000 スイッチではサポートされていません。

コマンドの変更

一部のコマンドは、Cisco MDS NX-OS リリース 8.3(1) で変更されました。このマニュアルでは、Cisco MDS NX-OS リリース 8.3(1) で導入または変更されたコマンドを表示しています。Cisco MDS NX-OS リリース 8.2(1) で使用されている同等のコマンドについては、表 1 を参照してください。

Cisco MDS NX-OS リリース 8.3(1) 以降のリリースでは、SAN Analytics 機能を使用することをお勧めします。

表 1 に、Cisco MDS NX-OS リリース 8.3(1) のコマンドに加えられた変更を示します。

表 3. コマンドの変更

Cisco MDS NX-OS リリース 8.2(1)

Cisco MDS NX-OS リリース 8.3(1)

analytics query “query_string” type timer timer_val

analytics query “query_string” name query_name type periodic [interval seconds] [clear] [differential]

clear analytics “query_string”

clear analytics query “query_string”

purge analytics “query_string”

purge analytics query “query_string”

show analytics query {“query_string” | id result}

show analytics query {“query_string” [clear] [differential] | all | name query_name result}

SAN アナリティクスについて

SAN アナリティクス機能は、データ分析のために特定のフレームを使用してフロー メトリックを収集します。対象には次のコンポーネントが含まれます。

  • データ収集:フロー データは NPU から収集され、最終的にスイッチのスーパーバイザに送信されて保存されます。表示されるデータはデータのリアルタイム ビューで、履歴データは表示されません。

  • オンボード クエリ:プル クエリ、プッシュ クエリ、またはオーバーレイ CLI を使用して、データベースに保存されているデータを抽出できます。クエリは、データベースから特定のフロー メトリックを抽出するために使用されます。特定のフレームは、スイッチのパフォーマンスの問題を監視、分析、およびトラブルシューティングするために使用されます。詳細については、「クエリの作成と使用」を参照してください。

    以下は、データベースのさまざまなクエリ方法です。

    • プル クエリとは、クエリの実行時にデータベースに保存されているフロー情報を抽出するために使用されるワンタイム クエリです。出力は JSON 形式です。プル クエリは NX-API に準拠しています。

      オーバーレイ CLI ShowAnalytics コマンドは、フロー メトリックが使いやすい表形式で表示される定義済みのプル クエリを発行する python スクリプトです。これは Python で記述されている CLI ラッパーで、実行に備えてブートフラッシュに保存されています。

      Cisco MDS NX-OS リリース 8.3(1) 以降は、次のオプションがプル クエリでサポートされています。

      • [クリア(Clear)]:すべての最小、最大、およびピーク フローのメトリックをクリアします。

      • [差分(Differential)]:前回のストリーミング間隔と現在のストリーミング間隔の間に更新された ITL または ITN フロー メトリックのみの絶対値を返します。スイッチのスケール値を向上させるために、差分プッシュ クエリを使用することをお勧めします。

    • [プッシュ クエリ(Push query)]:データベースに保存されているフロー メトリックを定期的に抽出し、宛先に送信するためにインストールされている繰り返しクエリ。出力は JSON 形式です。

      Cisco MDS NX-OS リリース 8.3(1) 以降は、次のオプションがプッシュ クエリでサポートされています。

      • [クリア(Clear)]:すべての最小、最大、およびピーク フローのメトリックをクリアします。

      • [差分(Differential)]:前回のストリーミング間隔と現在のストリーミング間隔の間に更新された ITL または ITN フロー メトリックのみの絶対値を返します。スイッチのスケール値を向上させるために、差分プッシュ クエリを使用することをお勧めします。

      プッシュ クエリでは、次のフロー メトリックの抽出モードがサポートされています。

      • 連続モード:データは、すべての分析対応ポートで継続的に収集されます。

      • サンプリング モード:データは、設定されているポート サンプリング間隔ごとに分析対応ポートのサブセットで収集され、その後、データ収集メカニズムが次のポートのサブセットを循環します。たとえば、データは、30 秒のポート サンプリング間隔で、24 の分析対応ポート内の 6 ポートのグループで収集されます。詳細については、ポート サンプリングを参照してください。

フロー メトリックの保存に使用されるデータベースは、次の階層に従って編成されます。

  • 分析タイプ:分析するプロトコル タイプ。 fc-scsi 分析タイプは、Cisco MDS NX-OS リリース 8.2(x) および Cisco MDS NX-OS リリース 8.3(x) でサポートされています。 fc-scsi および fc-nvme 分析タイプは、Cisco MDS NX-OS リリース 8.4(1) からサポートされています。

  • ビュー:ビューは、ポート、VSAN、イニシエータ、ターゲット、LUN、およびネームスペース ID パラメータの有効な組み合わせによって定義された、データベース内のフロー メトリックの選択です。

  • ビュー タイプ:ビューは、フローを構成するコンポーネント(ポート ビュー、initiator_IT ビュー、target_ITL ビューなど)に基づいて定義されます。クエリ構文は、あるビュー タイプでクエリを実行するために使用されます。構文は、1 つのビュー タイプで 1 つのクエリのみサポートします。サポートされているビュー タイプの一覧については、サポートされているビュー タイプの一覧 を参照してください。

  • ビュー インスタンス:特定のビュー タイプのインスタンスを指定します。ビュー インスタンスには独自のフロー メトリックがあります。たとえば、ポート ビュー タイプの場合、fc1/1 が 1 つのインスタンスで、fc1/2 が別のインスタンスのようになります。

  • フロー メトリック:分析に使用されるフロー メトリックを指定します。Cisco MDS NX-OS 8.5(1) 以降、NVMe トラフィック メトリックには、NVMe フレームの[カテゴリ(Category)] フィールドによって分類された IO フレームのみが含まれます。このリリースより前は、IO フレームと管理フレームの両方が含まれていました。サポートされているフロー メトリックのリストについては、付録のフロー メトリックセクションのビュー プロファイルを参照してください。

次の図は、サンプル データベースのさまざまなコンポーネントを示しています。

図 2. サンプル データベース

クエリ構文の設定例については、例:クエリ構文の設定 を参照してください。

次に、フロー データの収集ワークフローを示します。

  1. 機能の有効化:フロー メトリックを分析する必要があるスイッチの SAN アナリティクス機能を有効にします。

  2. インターフェイスの有効化:インターフェイスでのフロー メトリックの収集を有効にします。ホスト インターフェイスの SAN 分析機能を有効にすることをお勧めします(展開モードの図を参照)。

  3. クエリの実行とインストール:データベースからフロー メトリックを取得するために、次のクエリが使用されます。

    • プル クエリ:スイッチの問題を直接トラブルシューティングするために、ほぼリアルタイムのフロー メトリックを提供します。プル クエリからのデータは、クエリに応答したときにデータベースから抽出されます。プル クエリは、CLI または NX-API を使用して実行できます。Cisco DCNM は NX-API を使用して、可視化用のデータを収集できます。

      オーバーレイ CLI:フロー メトリックが使いやすい表形式で表示される定義済みのプル クエリ。スイッチの問題を直接トラブルシューティングするために、ほぼリアルタイムのフロー メトリックを提供します。

      次の図は、プル クエリの機能を示しています。

      図 3. プル クエリ
    • プッシュ クエリ:フロー メトリックを定期的に提供します。時間間隔は秒単位で指定できます。指定された時間間隔を過ぎると、ユーザーに関する特定のフロー メトリックが更新されて、データベースからプッシュされます。複数のクエリがインストールされている場合、各プッシュ クエリがお互いに無関係にフロー メトリックをプッシュします。これは想定されている動作です。


      (注)  

      • プル クエリ、プッシュ クエリ、およびオーバーレイ CLI は、SAN アナリティクス機能が有効になっているインターフェイスでのみ適用されます。

      • プッシュ クエリ タイマーは NPU からフロー メトリックを取得し、指定されたプッシュ クエリ間隔でスーパーバイザ上のデータベースに保存します。


      次の図は、一定のメトリックだけが特定の間隔で更新されるように設定されているプッシュ クエリの機能を示しています。

      図 4. プッシュ クエリ
  4. メトリックのクリアとリセット:次の機能を使用すると、データベース内の収集したフロー メトリックをクリアまたはリセットできます。

    • [パージ(Purge)]:指定されたビュー インスタンス、およびそのビュー インスタンスと関連付けられているすべてのメトリックを削除します。ビュー インスタンスは新しい IO ですぐに再構築され、すべてのビュー メトリックはゼロからカウントを開始します。このオプションを使用して、イニシエーターまたはターゲットがアクティブでないか存在しなくなった場合など、古いメトリックをビューからフラッシュします。

      次の図は、消去メトリック クエリの機能を示しています。

      図 5. 消去メトリック クエリ
    • クリア — タイプ キーのフロー メトリックを除き、指定されたクエリ文字列に一致するすべてのメトリックをゼロにリセットします。データベースをクリアした後で、データベースは指定されたクエリのフロー メトリックの収集を続けます。


      (注)  

      clear analytics query コマンドは、プッシュ クエリで使用されている clear オプションとは異なります。clear analytics query コマンドは、クエリ構文を満たすすべてのメトリックをリセットします。プッシュ クエリで使用される clear オプションは、最小、最大、およびピーク フロー メトリックをリセットします。


      次の図は、クリア メトリック クエリの機能を示しています。

      図 6. クリア メトリック クエリ

VMID Analytics


(注)  

VMID Analytics 機能は現在、実稼働環境以外でのみ使用するためのベータ ステータスです。この機能を有効にする前に、アカウント チームまたは Cisco MDS マーケティング チームに連絡して、ユース ケースを理解してください。このベータ ステータスと制限は、今後のリリースで通常の製品ステータスに変更されます。


SAN Analytics 機能は、デバイス (FCID ごと) レベルでファイバ チャネル トラフィック情報を提供します。ただし、エンド デバイスは複数の仮想エンティティ (仮想マシン [VM]) をホストでき、各 VM はファイバ チャネル ファブリックにさまざまな負荷を与える可能性があります。したがって、各 VM のファイバ チャネル パフォーマンスを監視することが重要になります。VMID 分析機能を使用すると、VM レベルでファイバー チャネルのパフォーマンスの問題を監視、分析、識別、およびトラブルシューティングできます。

特定のデバイス内の個々の VM は、SCSI および NVMe IO 交換に同じ FCID を使用します。NX-OS Virtual Machine Identifier(VMID)サーバー機能により、FCID ごとのデバイス レベルから個々の VM レベルまでのトラフィック ソースを解決できます。この機能の詳細については、『Cisco MDS 9000 Series Fabric Configuration Guide, Release 8.x』の「Managing FLOGI, Name Server, FDMI, and RSCN Databases」の章の「VMID」セクションを参照してください。

VMID サーバー機能を有効にした後、VMID Analytics 機能を有効にして、イニシエータのパフォーマンス メトリックを解決できます。有効にすると、イニシエーター レベルのメトリックを報告するために使用された分析ビューは、VMID レベルのメトリックも報告します。scsi-initiator-id または nvme-initiator-id キーを含むビュー タイプのみが監視されます。これらのビュー タイプでは、追加の vmid キーがサポートされています。VMID 固有の分析を収集するには、クエリ構文でイニシエーター ID とともに「選択されたフィールド」リストの一部として vmid キーを指定する必要があります。「選択されたフィールド」リストで VMID が指定されておらず、イニシエータ ID のみが指定されている場合、集約されたメトリックがイニシエータに対して収集されます。

VMID サーバー機能を無効にすると、接続されたデバイスは VMID 情報をファイバ チャネル フレームに挿入しなくなります。また、VMID Analytics 機能が無効になっている場合、フレームは VMID ではなくソース FCID に対してカウントされます。ただし、Analytics データベースは、以前に収集された VMID ごとのメトリックを引き続き保持します。データベースをリセットするには、メトリックを消去するか、無停止モジュール アップグレードを実行する必要があります。メトリックをパージしない場合、差分オプションを使用した場合と使用しない場合のプルまたはプッシュ クエリの出力は次のようになります。

  • VMID Analtics 機能を無効にした後にプルまたはプッシュ クエリで差分オプションを使用すると、最初のプルまたはプッシュ クエリにのみ、古い VMID ごとのメトリックが含まれます。

  • VMID Analytics 機能を無効にした後にプルまたはプッシュ クエリで差分オプションを使用しない場合、すべてのプルまたはプッシュ クエリは古い VMID ごとのメトリックをフェッチします。

VMID Analytics 機能は、Cisco MDS NX-OS リリース 8.5(1) で導入されました。

ポート サンプリング

Cisco MDS NX-OS リリース 8.3(1) で導入されたポート サンプリング機能を使用すると、監視対象モジュール内のポートのサブセットからデータを収集し、ポートのさまざまnサブセットを循環し、定期的なポート サンプリング間隔でそれらのポートからのデータをストリーミングできます。

この機能は、NPU の負荷が高く、モジュール上の監視対象ポートの数を削減できまない場合に便利です。そのような状況では、指定されたポート サンプリング間隔で監視対象ポートのサブセットをサンプリングすることで NPU の負荷を削減できます。show analytics system-load コマンドを使用して、NPU の負荷を確認します。

Cisco MDS NX-OS リリース 8.3(2) では、NPU の負荷が高い場合、ITL 数がモジュールの制限を超えている場合、ITL 数がシステムの制限を超えている場合、NPU から分析データに関する応答がない場合にアラートを表示するシステム メッセージが導入されています。詳細については、Cisco MDS 9000 ファミリおよび Nexus 7000 シリーズ NX-OS システム メッセージ リファレンス の文書を参照してください。

サンプリングされていない監視対象ポートで発生する I/O およびエラーは表示されず、分析データには含まれません。

この機能で使用されているポート サンプリング間隔は、ストリーミング サンプル間隔とは無関係です。ストリーミング サンプル間隔、ポート サンプリング間隔、およびプッシュ クエリ間隔は、最小推奨値の 30 秒以上に設定することをお勧めします。


(注)  

モジュールでこの機能が有効になっていて、後にそのモジュールの新しいポートで SAN Analytics 機能が有効になった場合、新しいポートのポート サンプリング データは次のポート サンプリング間隔後に初めてストリーミングされます。


ポート サンプリングのシナリオ

48 ポートで構成されているモジュールを、2 つの 24 ポートのサブセットにグループ化するとします。それらのポートのサブセットに設定されているポート サンプリング間隔および設定されているストリーミング サンプル間隔に応じて、フロー メトリックは異なる間隔でキャプチャされます(次の例を参照)。

図 7. ポート サンプリング グループ
  • ポート サンプリング間隔とストリーミング サンプル間隔が同時に開始される場合:

    図 8. 同時刻に始まるポート サンプリング間隔とストリーミング サンプル間隔
  • ポート サンプリング間隔とストリーミング サンプル間隔の開始時刻が異なる場合:

    図 9. 異なる時刻に始まるポート サンプリング間隔とストリーミング サンプル間隔

分析エンジン ポート セットのマッピング

64 Gbps 対応ポート以降、モジュール上の分析データは、ポート ASIC によってポートのセットとして管理されます。各ポート セットからのデータは、専用のメモリ ブロックに保存されます。分析データの損失を回避するには、各ポート セットを介して監視される ITL フローの総数が、関連するブロックの容量を超えないようにする必要があります。

デバイス 監視間隔ごとの最大 ITL フロー

DS-X9748-3072K9

ポート セットあたり 4000 フロー

ポート セットごとの ITL フローの数が関連するブロックの容量を超える場合は、ポート セットの 1 つ以上のポートで分析を無効にするか、トラフィックを別のポート セットの物理ポートに移動することによって削減できます。

表 1 はポートを分析エンジンのポート セットに分割します。

表 4. 分析エンジン ポート セットのマッピング
デバイス 分析エンジン ポート セット 前面パネルポート番号

DS-X9748-3072K9

1

9、11、13、15

2

25、27、29、31

3

10、12、14、16

4

26、28、30、32

5

1、3、5、7

6

33、35、37、39

7

2、4、6、8

8

34、36、38、40

9

17、19、21、23

10

41、43、45、47

11

18、20、22、24

12

42、44、46、48

展開モード

SAN アナリティクス機能をサポートしているスイッチが SAN ファブリックで展開されている場所に応じて、次の展開モードが考えられます。

ホスト エッジ展開モード

SAN アナリティクス機能は、すべての Cisco MDS コア スイッチ、およびホストに接続されているインターフェイスで有効になっています。

図 10. ホスト エッジ展開モード

ストレージ エッジ展開モード

SAN アナリティクス機能は、すべての Cisco MDS コア スイッチ、およびストレージ アレイに接続されているインターフェイスで有効になっています。

図 11. ストレージ エッジ展開モード

ISL 展開モード

SAN アナリティクス機能は、すべての Cisco MDS コア スイッチ、および ISL のいずれかのサイドにあるインターフェイスで有効になっています。

図 12. ISL 展開モード

次の図は、サポート対象モジュールとサポート対象外モジュール(16 Gbps ファイバ チャネル、Cisco MDS 9700 40-Gbps 24-Port FCoE Module(DS-X9824-960K9)、Cisco MDS 24/10-Port SAN Extension Module(DS-X9334-K9)など)が SAN で使用されている場合の SAN アナリティクス機能の各機能を示してします。


(注)  

サポート対象モジュールとサポート対象外モジュールが使用されている場合の SAN アナリティクス機能の機能の番号 1 と 2 は、それぞれイニシエータからターゲットに向かう 2 つの異なるフローを表しています。


図 13. サポート対象モジュールとサポート対象外モジュールが使用されている場合の SAN アナリティクス機能の各機能

(注)  

  • 前述の ISL モードのシナリオでは、要求の応答はポート チャネルの異なるメンバーで確認できます。

  • ISL でサポート対象モジュールとサポート対象外モジュールが使用されている場合、その ISL で分析された分析データは正確ではない可能性があります。そのため、サポート対象モジュールとサポート対象外モジュールが使用されている ISL ではデータを分析しないことをお勧めします。


SAN アナリティクスの設定

インターフェイスからのフロー メトリックの収集を有効にするには、スイッチとそのインターフェイスの両方で SAN アナリティクス機能を有効にします。


(注)  

  • SAN アナリティクス機能を使用するには、install license コマンドを使用して適切なライセンス パッケージをインストールする必要があります。詳細については、Cisco MDS 9000 シリーズ ライセンス ガイド [英語] を参照してください。

  • Cisco DCNM SAN Insights を使用している場合は、Cisco DCNM SAN Insights で SAN アナリティクス機能を設定できます。スイッチでこの機能を設定する必要はありません。詳細については、Cisco DCNM SAN 管理コンフィギュレーション ガイド [英語] の「Configuring SAN Insights」セクションを参照してください。


SAN アナリティクスの有効化


(注)  

  • SAN アナリティクス機能は、デフォルトでは無効になっています。

  • アクティブな ITL 数が記載されている制限を超えると、Syslog メッセージが記録されます。


スイッチの SAN アナリティクス機能を有効にするには、次の手順を実行します。

手順


ステップ 1

グローバル コンフィギュレーション モードを開始します。

switch# configure terminal

ステップ 2

スイッチの SAN アナリティクス機能を有効にします。

switch(config)# feature analytics


SAN アナリティクスの無効化

スイッチの SAN アナリティクス機能を無効にするには、次の手順を実行します。

手順


ステップ 1

グローバル コンフィギュレーション モードを開始します。

switch# configure terminal

ステップ 2

スイッチの SAN アナリティクス機能を無効にします。

switch(config)# no feature analytics


インターフェイスでの SAN Analytics の有効化

インターフェイスの SAN Analytics 機能を有効にするには、次の手順を実行します。

始める前に


(注)  

SAN Analytics 機能は、デフォルトではすべてのインターフェイスで無効になっています。


  • スイッチの SAN Analytics 機能を有効にします。SAN アナリティクスの有効化の項を参照してください。

  • ポート チャネルで、すべてのインターフェイスで SAN Analytics 機能を有効にします。

手順


ステップ 1

グローバル構成モードを開始します。

switch# configure terminal

ステップ 2

ファイバ チャネル インターフェイスまたはインターフェイスの範囲を選択し、インターフェイス構成サブモードを開始します。

switch(config)# interface fc slot number/port number

(注)   
interface fc slot number/port number - port number、fc slot number/port number - port number コマンドを使用して、インターフェイスの範囲を指定することもできます。ダッシュ(-)とカンマ(,)の前後にはスペースが必要です。

ステップ 3

選択されたインターフェイスの SAN SAN Analytics 機能を有効にします。

switch(config-if)# analytics type {fc-all | fc-nvme | fc-scsi}

(注)   

Cisco MDS NX-OS リリース 8.2(1) および Cisco MDS NX-OS リリース 8.3(1) では、fc-scsi 分析タイプのみサポートされています。Cisco MDS NX-OS リリース 8.4(1) 以降、fc-scsi fc-nvme 、および fc-all 分析タイプがサポートされます。


インターフェイスでの SAN アナリティクスの無効化

インターフェイスの SAN アナリティクス機能を無効にするには、次の手順を実行します。

始める前に

ポート チャネルで、すべてのインターフェイスの SAN アナリティクス機能を無効にします。

手順


ステップ 1

グローバル コンフィギュレーション モードを開始します。

switch# configure terminal

ステップ 2

ファイバ チャネル インターフェイスまたはインターフェイスの範囲を選択し、インターフェイス コンフィギュレーション サブモードを開始します。

switch(config)# interface fc slot number/port number

(注)   

interface fc slot number/port number - port number、fc slot number/port number - port number コマンドを使用して、インターフェイスの範囲を指定することもできます。ダッシュ(-)とカンマ(,)の前後にはスペースが必要です。

ステップ 3

選択されたインターフェイスで SAN アナリティクス機能を無効にします。

switch(config-if)# no analytics type {fc-all | fc-nvme | fc-scsi}


VMID Analytics の有効化

スイッチの VMID Analytics 機能を有効にするには、次の手順を実行してください。

始める前に

  1. 接続されている HBA に VMID 機能をサポートするファームウェアがあり、その機能が HBA で有効になっていることを確認します。

  2. スイッチの SAN アナリティクス機能を有効にします。SAN アナリティクスの有効化の項を参照してください。

  3. インターフェイスで SAN Analytics を有効にします。「インターフェイスでの SAN Analytics の有効化」の項を参照してください。

  4. VMID Server 機能を有効にします。『Cisco MDS 9000 Series Fabric Configuration Guide, Release 8.x』の「Managing FLOGI、Name Server、FDMI、および RSCN Databases」の章の「Enabling the VMID Server」の項を参照してください。

手順


ステップ 1

グローバル構成モードを開始します。

switch# configure terminal

ステップ 2

スイッチの VMID Analytics 機能を有効にします。

switch(config)# analytics vm-tag veid


VMID Analytics の無効化

スイッチの VMID Analytics 機能を無効にするには、次の手順を実行してください。

手順


ステップ 1

グローバル構成モードを開始します。

switch# configure terminal

ステップ 2

スイッチの VMID Analytics 機能を無効にします。

switch(config)# no analytics vm-tag veid


ポート サンプリングの有効化


(注)  

  • ポート サンプリングは、Cisco MDS NX-OS リリース 8.3(1) 以降のリリースでのみサポートされています。

  • ポート サンプリングはデフォルトでは無効になっており、継続的な監視はすべての分析対応ポートで有効になっています。ポート サンプリングの詳細については、ポート サンプリングを参照してください。


モジュールのポート サンプリングを有効にするには、次の手順を実行します。

手順


ステップ 1

グローバル コンフィギュレーション モードを開始します。

switch# configure terminal

ステップ 2

モジュールのポート サンプリングを有効にします。

switch# analytics port-sampling module number size number interval seconds


ポート サンプリングの無効化

モジュールのポート サンプリングを無効にするには、次の手順を実行します。

手順


ステップ 1

グローバル コンフィギュレーション モードを開始します。

switch# configure terminal

ステップ 2

モジュールのポート サンプリングを無効にして、設定済みのストリーミング サンプル間隔を指定して、すべての分析対応ポートの監視をデフォルト モードに戻します。

switch# no analytics port-sampling module number


例:SAN Analyticsの設定

次に、スイッチの SAN Analytics 機能を有効にする例を示します。


switch# configure terminal
switch(config)# feature analytics

次に、スイッチの SAN Analytics 機能を無効にする例を示します。


switch# configure terminal
switch(config)# no feature analytics

この例は、NVMe 分析タイプがすでに有効になっている場合に、SCSI 分析タイプのインターフェイスでSAN Analytics 機能を有効にする方法を示しています。

  • この例は、NVMe 分析タイプがすでに有効になっていることを示しています。

    
    switch# show running-config analytics
    
    !Command: show running-config analytics
    !Running configuration last done at: Wed Mar 13 09:01:56 2019
    !Time: Wed Mar 13 09:02:52 2019
    
    version 8.4(1)
    feature analytics
    
    
    interface fc1/1
      analytics type fc-nvme
    
    
  • 次の例は、単一のポートで SCSI 分析タイプを有効にする方法を示しています。

    
    switch# configure terminal
    switch(config)# interface fc 1/1
    switch(config-if)# analytics type fc-scsi
    
    
  • この例は、SCSI 分析タイプが有効になっていることを示しています。

    
    switch# show running-config analytics
    
    !Command: show running-config analytics
    !Running configuration last done at: Wed Mar 13 09:01:56 2019
    !Time: Wed Mar 13 09:02:52 2019
    
    version 8.4(1)
    feature analytics
    
    
    interface fc1/1
      analytics type fc-scsi
      analytics type fc-nvme


スイッチでのメトリクスのクエリ

プル クエリ CLI を実行すると、指定されたメトリックがモジュールの NPU から収集され、スーパーバイザのメトリック データベースに保存されてから、ユーザー セッションに表示されます。

メトリックのクエリ用のスキーマ

スキーマは、データベースに保存されている特定のデータをユーザーに表示するために使用されます。スキーマの詳細については、show analytics schema コマンドを使用してください。メトリックは、さまざまなビュー インスタンスの形式でデータベース内に保持されています。それらのビュー インスタンスは、クエリを使用して取得できます。詳細については、「ビュー」を参照してください。

クエリ構文

プッシュ クエリ、プル クエリ、メトリックのクリア、ビューの消去で使用される クエリ構文 を次に示します。

select all | column1[, column2, column3, …] from analytics_type.view_type [ where filter_list1 [ and filter_list2 …]] [ sort column [asc | desc]] [ limit number]

クエリ構文の要素は次のとおりです。

  • analytics_type :分析のタイプを指定します。Cisco MDS NX-OS リリース 8.2(1) および Cisco MDS NX-OS リリース 8.3(1) では、fc-scsi タイプのみサポートされています。Cisco MDS NX-OS リリース 8.4(1) から、fc-nvme 分析タイプがサポートされます。

  • view_type :メトリック データベースのビュー タイプを指定します。この構文はそのビュー タイプでクエリを実行するために使用されます。構文は、1 つのビュー タイプで 1 つのクエリのみサポートします。サポートされているビュー タイプの一覧とそれぞれの説明については、サポートされているビュー タイプの一覧 を参照してください。

  • column :フロー メトリックを指定します。ビュー インスタンスには複数の列が含まれています。

  • filter_list :ビュー インスタンスの特定のメトリックを抽出するフィルタを指定します。フィルタ条件は、タイプが key 値のフロー メトリック列、またはビュー インスタンス列で使用できます。フィルタリングに AND 演算子を使用することもできます。サポートされているビュー タイプの一覧については、サポートされているビュー タイプの一覧 を参照してください。

  • sort :列内の結果をソートすることを指定します。ソートは limit 操作の実行前に行われます。

  • asc :列の結果を昇順でソートします。デフォルトでは、順序が指定されていない場合、ソートは昇順で行われます。

  • desc :列の結果を降順でソートします。

  • limit :結果で返されるメトリクスの数を制限します。

クエリ構文の構成例については、例:クエリ構文の設定 を参照してください。


(注)  

  • "query_string"limit および where オプションは、key フィールドでのみ使用できます。

  • Cisco MDS NX-OS リリース 8.3(2) より前は、"query_string" の sort オプションは key フィールドでのみ使用でき、メトリックは昇順でのみソートされていました。Cisco MDS NX-OS リリース 8.3(2) からは、"query_string"sort オプションは、すべての metrics および metadata フィールドで使用でき、asc または desc オプションをそれぞれ使用して、昇順または降順でソートできます。デフォルトでは、順序が指定されていない場合ソートは昇順で行われます。

    sort asc または sort desc オプションを指定してプッシュ クエリを設定している場合は、Cisco MDS NX-OS リリース 8.3(2) から Cisco MDS NX-OS リリース 8.3(1) または以前のリリースにダウングレードする前に、それらの sort オプションを削除してください。


クエリ ルール

以下は、クエリの構築に関するルールです。

  • select from where sort 、および limit 条件は、クエリ構文 の説明に従い、同じ順序で使用する必要があります。

  • select 条件の下にある列の一覧は、from 条件の下にある view_type に対応するスキーマに属している必要があります。

  • where 条件は、タイプが key 値のフロー メトリック フィールドでのみ使用できます。タイプが key 値のフロー メトリック フィールドの詳細については、サポートされているビュー タイプの一覧を参照してください。

  • Cisco MDS NX-OS、リリース 8.3(2) より前は、sort 条件は metric フィールドであり、select 条件の下に一覧表示されている列の中に存在している必要がありました。Cisco MDS NX-OS、リリース 8.3(2) からは、sort 条件は metric または metadata フィールドであり、select 条件の下に一覧示されている列の中に存在している必要があります。

ビュー

ビューは、ポート、イニシエータ、ターゲット、LUN、またはこれらの有効な組み合せに関するフロー メトリックを表すものです。各ビュー タイプは特定のフロー メトリックをサポートしています。リソース使用率を最適化するために、オンボード クエリにはフロー メトリックの長い名前が使用され、SAN Telemetry Streaming には短い名前が使用されます。詳細については、フロー メトリック を参照してください。

サポートされているビュー タイプの一覧

次の表に、サポートされているビュー タイプを示します。

表 5. サポートされているビュー タイプ

ビュー タイプ

説明

キー

port

ポート ビューには、スイッチ上のポートのメタデータと IO メトリックが含まれています。

port

logical_port

論理ポート ビューには、スイッチ上のポートに設定されている VSAN のメタデータと IO メトリックが含まれています。

port と vsan

app

アプリケーション ビューには、IO 操作を実行しているさまざまなポートの背後でホストされている、関連するアプリケーションのメタデータと IO メトリックが含まれています。

ポートとアプリ ID

scsi_target

ターゲット ビューには、IO 操作を実行するスイッチ上のさまざまなポートの背後に展開されている SCSI ターゲットのメタデータと IO メトリックが含まれています。

ポート、vsan、および scsi-target-id

nvme_target

ターゲット ビューには、IO 操作を実行するスイッチ上のさまざまなポートの背後に展開されている NVMe ターゲットのメタデータと IO メトリックが含まれています。

ポート、vsan、および nvme-target-id

scsi_initiator

イニシエータ ビューには、IO 操作を開始するスイッチ上のさまざまなポートの背後に展開されているイニシエータのメタデータと IO メトリックが含まれています。

ポート、vsan、scsi-initiator-id、および vmid

nvme_initiator

イニシエータ ビューには、IO 操作を開始するスイッチ上のさまざまなポートの背後に展開されているイニシエータのメタデータと IO メトリックが含まれています。

ポート、vsan、nvme-initiator-id、および vmid

scsi_target_app

ターゲット アプリ ビューには、データがさまざまなターゲットでホストされているアプリケーションのメタデータと IO メトリックが含まれています。

port、vsan、scsi-target-fc-id、および app-id

nvme_target_app

ターゲット アプリ ビューには、データがさまざまなターゲットでホストされているアプリケーションのメタデータと IO メトリックが含まれています。

ポート、vsan、nvme-target-id、および app-id

scsi_initiator_app

イニシエータ アプリ ビューには、イニシエータが IO 操作を開始するアプリケーションのメタデータと IO メトリックが含まれています。

ポート、vsan、scsi-initiator-id、app-id、および vmid

nvme_initiator_app

イニシエータ アプリ ビューには、イニシエータが IO 操作を開始するアプリケーションのメタデータと IO メトリックが含まれています。

ポート、vsan、nvme-initiator-id、app-id、および vmid

scsi_target_it_flow

ターゲット initiator-target(IT)フロー ビューには、さまざまなターゲットと関連付けられている IT フローのメタデータと IO メトリックが含まれています。

ポート、vsan、scsi-target-id、scsi-initiator-id、および vmid

nvme_target_it_flow

ターゲット initiator-target(IT)フロー ビューには、さまざまなターゲットと関連付けられている IT フローのメタデータと IO メトリックが含まれています。

ポート、vsan、nvme-target-id、nvme-initiator-id、および vmid

scsi_initiator_it_flow

イニシエータ IT フロー ビューには、さまざまなイニシエータと関連付けられている IT フローのメタデータと IO メトリックが含まれています。

ポート、vsan、scsi-initiator-id、scsi-target-id、および vmid

nvme_initiator_it_flow

イニシエータ IT フロー ビューには、さまざまなイニシエータと関連付けられている IT フローのメタデータと IO メトリックが含まれています。

ポート、vsan、nvme-initiator-id、nvme-target-id、および vmid

scsi_target_tl_flow

ターゲット target-LUN(TL)フロー ビューには、さまざまな SCSI ターゲットと関連付けられている LUN のメタデータと IO メトリックが含まれています。

ポート、vsan、scsi-target-fc-id、および lun-id

nvme_target_tn_flow

ターゲット target-namespace ID(TN)フロー ビューには、さまざまな NVMeI ターゲットと関連付けられている namespace ID のメタデータと IO メトリックが含まれています。

ポート、vsan、nvme-target-id、および namespace-id

scsi_target_itl_flow

ターゲット initiator-target-LUN(ITL)フロー ビューには、さまざまな SCSI ターゲットと関連付けられている IT フローのメタデータと IO メトリックが含まれています。

ポート、vsan、scsi-target-id、scsi-initiator-id、lun-id、および vmid

nvme_target_itn_flow

ターゲット initiator-target-namespace ID(ITN)フロー ビューには、さまざまな NVMeI ターゲットと関連付けられている ITN フローのメタデータと IO メトリックが含まれています。

ポート、vsan、nvme-target-id、nvme-initiator-id、namespace-id、および vmid

scsi_initiator_itl_flow

イニシエータ ITL フロー ビューには、さまざまな SCSI イニシエータと関連付けられている ITL フローのメタデータと IO メトリックが含まれています。

ポート、vsan、scsi-initiator-id、scsi-target-id、lun-id、および vmid

nvme_initiator_itn_flow

イニシエータ ITN フロー ビューには、さまざまな NVMe イニシエータと関連付けられている ITN フローのメタデータと IO メトリックが含まれています。

ポート、vsan、nvme-initiator-id、nvme-target-id、namespace-id、および vmid

scsi_target_io

ターゲット IO ビューには、さまざまなターゲットが実行するアクティブな IO の IO トランザクションの詳細が含まれています。

ポート、vsan、scsi-target-id、scsi-initiator-id、および vmid

nvme_target_io

ターゲット IO ビューには、さまざまなターゲットが実行するアクティブな IO の IO トランザクションの詳細が含まれています。

ポート、vsan、nvme-target-id、nvme-initiator-id、ox-id、および vmid

scsi_initiator_io

イニシエータ IO ビューには、さまざまなイニシエータが開始するアクティブな IO の IO トランザクションの詳細が記録されています。

ポート、vsan、scsi-initiator-id、scsi-target-id、ox-id および vmid

nvme_initiator_io

イニシエータ IO ビューには、さまざまなイニシエータが開始するアクティブな IO の IO トランザクションの詳細が記録されています。

ポート、vsan、nvme-initiator-id、nvme-target-id、ox-id、および vmid

ビュー タイプの表示


(注)  

このセクションで提供される例は、SCSI 分析タイプ用であり、NVMe 分析タイプにも拡張できます。


シスコでは、さまざまなビュー タイプを説明するためのサンプル トポロジを考えました。以下は、次の図の説明です。

  • イニシエータ 1 とイニシエータ 2 は VSAN 1 に設定されていて、ゾーン 1 にあるターゲット 1、ターゲット 2、LUN 1、および LUN 2 と通信しています。

    • イニシエータ 1 は、ターゲット 1 に対して 125 の読み取り IO を生成し、ターゲット 2 に対して 75 の読み取り IO を生成しています。

    • イニシエータ 2 は、ターゲット 1 とターゲット 2 のそれぞれに対して 50 の読み取り IO を生成しています。

  • イニシエータ 3 は VSAN 2 に設定されていて、ゾーン 2 にあるターゲット 3、LUN 3、および LUN 4 と通信しています。

    イニシエータ 3 は、ターゲット 3 に対して 300 の読み取り IO を生成しています。ターゲット 3 は、LUN 3 と LUN 4 のそれぞれに対して 150 の読み取り IO を生成しています。


(注)  

次の図のカッコ内に記載されている情報はデバイスのファイバ チャネル ID(FCID)です。


サポートされているビュー タイプの一覧とそれぞれの説明については、サポートされているビュー タイプの一覧 を参照してください。

図 14. ビュー タイプの表示のサンプル トポロジ

次の図は、ポート ビュー タイプから見たフロー メトリックを示しています。

図 15. ポート ビュー タイプ
表 6. ポート ビュー タイプ

ポートビュー

フロー メトリック

ポート ビュー、ポート = fc 1/4

total_read_io_count = 600(ポート上に表示されているすべてのイニシエータの読み取り I/O)

次の図は、論理ポート ビュー タイプから見たフロー メトリックを示しています。

図 16. 論理ポート ビュー タイプ
表 7. 論理ポート ビュー タイプ

論理ポート ビュー タイプ

フロー メトリック

論理ポートでポート = fc 1/4、VSAN = 1

total_read_io_count = 300(VSAN 1 内のすべてのイニシエータの読み取り I/O)

次の図は、scsi_initiator ビュー タイプから見たフロー メトリックを示しています。

図 17. scsi_initiator ビュー タイプ
表 8. scsi_initiator ビュー タイプ

scsi_initiator ビュー タイプ

フロー メトリック

scsi_initiator ビューでポート = fc 1/1、VSAN = 1、イニシエータ ID = 1.1.1

ポート = fc 1/5、VSAN = 1、イニシエータ ID = 1.1.1 の scsi_initiator ビュー

total_read_io_count = 200(イニシエータ ID 1.1.1 の読み取り I/O)

scsi_initiator ビューでポート = fc 1/5、VSAN = 1、イニシエータ ID = 1.1.2

total_read_io_count = 100(イニシエータ ID 1.1.2 の読み取り I/O)

scsi_initiator ビューでポート = fc 1/5、VSAN = 2、イニシエータ ID = 1.1.3

total_read_io_count = 300(イニシエータ ID 1.1.3 の読み取り I/O)

次の図は、scsi_target ビュー タイプから見たフロー メトリックを示しています。

図 18. scsi_target ビュー タイプ
表 9. scsi_target ビュー タイプ

scsi_target ビュー

フロー メトリック

scsi_target ビューでポート = fc 1/6、VSAN = 1、ターゲット ID = 2.2.1

scsi_target ビューでポート = fc 1/4、VSAN = 1、ターゲット ID = 2.2.1

total_read_io_count = 175(ターゲット ID 2.2.1 の読み取り I/O)

scsi_target ビューでポート = fc 1/4、VSAN = 1、ターゲット ID = 2.2.2

total_read_io_count = 125(ターゲット ID 2.2.2 の読み取り I/O)

scsi_target ビューでポート = fc 1/4、VSAN = 2、ターゲット ID = 2.2.3

total_read_io_count = 300(ターゲット ID 2.2.3 の読み取り I/O)

次の図は、scsi_initiator_it_flow ビュー タイプから見たフロー メトリックを示しています。

図 19. scsi_initiator_it_flow ビュー タイプ
表 10. scsi_initiator_it_flow ビュー タイプ

scsi_initiator_it_flow ビュー

フロー メトリック

scsi_initiator_it_flow ビューで、ポート = fc 1/1、VSAN = 1、イニシエータ ID = 1.1.1、ターゲット ID = 2.2.1

scsi_initiator_it_flow ビューで、ポート = fc 1/5、VSAN = 1、イニシエータ ID = 1.1.1、ターゲット ID = 2.2.1

total_read_io_count = 125(イニシエータ ID 1.1.1 とターゲット ID 2.2.1 間だけの読み取り I/O)

scsi_initiator_it_flow ビューで、ポート = fc 1/1、VSAN = 1、イニシエータ ID = 1.1.1、ターゲット ID = 2.2.2

scsi_initiator_it_flow ビューで、ポート = fc 1/5、VSAN = 1、イニシエータ ID = 1.1.1、ターゲット ID = 2.2.2

total_read_io_count = 75(イニシエータ ID 1.1.1 とターゲット ID 2.2.2 間だけの読み取り I/O)

scsi_initiator_it_flow ビューで、ポート = fc 1/5、VSAN = 1、イニシエータ ID = 1.1.2、ターゲット ID = 2.2.1

total_read_io_count = 50(イニシエータ ID 1.1.2 とターゲット ID 2.2.1 間だけの読み取り I/O)

scsi_initiator_it_flow ビューで、ポート = fc 1/5、VSAN = 1、イニシエータ ID = 1.1.2、ターゲット ID = 2.2.2

total_read_io_count = 50(イニシエータ ID 1.1.2 とターゲット ID 2.2.2 間だけの読み取り I/O)

scsi_initiator_it_flow ビューで、ポート = fc 1/5、VSAN = 2、イニシエータ ID = 1.1.3、ターゲット ID = 2.2.3

total_read_io_count = 300(イニシエータ ID 1.1.3 とターゲット ID 2.2.3 間だけの読み取り I/O)

次の図は、scsi_target_it_flow ビュー タイプから見たフロー メトリックを示しています。

図 20. scsi_target_it_flow ビュー タイプ
表 11. scsi_target_it_flow ビュー タイプ

scsi_target_it_flow ビュー

フロー メトリック

scsi_target_it_flow ビューで、ポート = fc 1/6、VSAN = 1、イニシエータ ID = 1.1.1、ターゲット ID = 2.2.1

scsi_target_it_flow ビューで、ポート = fc 1/4、VSAN = 1、イニシエータ ID = 1.1.1、ターゲット ID = 2.2.1

total_read_io_count = 125(イニシエータ ID 1.1.1 とターゲット ID 2.2.1 間だけの読み取り I/O)

scsi_target_it_flow ビューで、ポート = fc 1/6、VSAN = 1、イニシエータ ID = 1.1.2、ターゲット ID = 2.2.1

scsi_target_it_flow ビューで、ポート = fc 1/4、VSAN = 1、イニシエータ ID = 1.1.2、ターゲット ID = 2.2.1

total_read_io_count = 50(イニシエータ ID 1.1.2 とターゲット ID 2.2.1 間だけの読み取り I/O)

scsi_target_it_flow ビューで、ポート = fc 1/4、VSAN = 1、イニシエータ ID = 1.1.1、ターゲット ID = 2.2.2

total_read_io_count = 75(イニシエータ ID 1.1.1 とターゲット ID 2.2.2 間だけの読み取り I/O)

scsi_target_it_flow ビューで、ポート = fc 1/4、VSAN = 1、イニシエータ ID = 1.1.2、ターゲット ID = 2.2.2

total_read_io_count = 50(イニシエータ ID 1.1.2 とターゲット ID 2.2.2 間だけの読み取り I/O)

scsi_target_it_flow ビューで、ポート = fc 1/4、VSAN = 2、イニシエータ ID = 1.1.3、ターゲット ID = 2.2.3

total_read_io_count = 300(イニシエータ ID 1.1.3 とターゲット ID 2.2.3 間だけの読み取り I/O)

次の図は、scsi_initiator_itl_flow ビュー タイプから見たフロー メトリックを示しています。

図 21. scsi_initiator_itl_flow ビュー タイプ
表 12. scsi_initiator_itl_flow ビュー タイプ

scsi_initiator_itl_flow ビュー

フロー メトリック

scsi_initiator_itl_flow ビューで、ポート = fc 1/1、VSAN = 1、イニシエータ ID = 1.1.1、ターゲット ID = 2.2.1、LUN ID = 0001

scsi_initiator_itl_flow ビューで、ポート = fc 1/5、VSAN = 1、イニシエータ ID = 1.1.1、ターゲット ID = 2.2.1、LUN ID = 0001

total_read_io_count = 125(イニシエータ ID 1.1.1、ターゲット ID 2.2.1、および LUN ID 0001 間だけの読み取り I/O)

scsi_initiator_itl_flow ビューで、ポート = fc 1/1、VSAN = 1、イニシエータ ID = 1.1.1、ターゲット ID = 2.2.2、LUN ID = 0002

scsi_initiator_itl_flow ビューで、ポート = fc 1/5、VSAN = 1、イニシエータ ID = 1.1.1、ターゲット ID = 2.2.2、LUN ID = 0002

total_read_io_count = 75(イニシエータ ID 1.1.1、ターゲット ID 2.2.2、および LUN ID 0002 間だけの読み取り I/O)

scsi_initiator_itl_flow ビューで、ポート = fc 1/5、VSAN = 1、イニシエータ ID = 1.1.2、ターゲット ID = 2.2.1、LUN ID = 0001

scsi_initiator_itl_flow ビューで、ポート = fc 1/5、VSAN = 1、イニシエータ ID = 1.1.2、ターゲット ID = 2.2.2、LUN ID = 0002

total_read_io_count = 50(イニシエータ ID 1.1.2、ターゲット ID 2.2.1、および LUN ID 0001 とイニシエータ ID 1.1.2、ターゲット ID 2.2.2、および LUN ID 0002 間だけの読み取り I/O)

scsi_initiator_itl_flow ビューで、ポート = fc 1/5、VSAN = 2、イニシエータ ID = 1.1.3、ターゲット ID = 2.2.3、LUN ID = 0003

scsi_initiator_itl_flow ビューで、ポート = fc 1/5、VSAN = 2、イニシエータ ID = 1.1.3、ターゲット ID = 2.2.3、LUN ID = 0004

total_read_io_count = 150(イニシエータ ID 1.1.3、ターゲット ID 2.2.3、および LUN ID 0003 とイニシエータ ID 1.1.3、ターゲット ID 2.2.3、および LUN ID 0004 間だけの読み取り I/O)

次の図は、scsi_target_itl_flow ビュー タイプから見たフロー メトリックを示しています。

図 22. scsi_target_itl_flow ビュー タイプ
表 13. scsi_target_itl_flow ビュー タイプ

scsi_target_itl_flow ビュー

フロー メトリック

scsi_target_itl_flow ビューで、ポート = fc 1/6、VSAN = 1、イニシエータ ID = 1.1.1、ターゲット ID = 2.2.1、LUN ID = 0001

scsi_target_itl_flow ビューで、ポート = fc 1/4、VSAN = 1、イニシエータ ID = 1.1.1、ターゲット ID = 2.2.1、LUN ID = 0001

total_read_io_count = 125(イニシエータ ID 1.1.1、ターゲット ID 2.2.1、および LUN ID 0001 間だけの読み取り I/O)

scsi_target_itl_flow ビューで、ポート = fc 1/6、VSAN = 1、イニシエータ ID = 1.1.2、ターゲット ID = 2.2.1、LUN ID = 0001

scsi_target_itl_flow ビューで、ポート = fc 1/4、VSAN = 1、イニシエータ ID = 1.1.2、ターゲット ID = 2.2.1、LUN ID = 0001

total_read_io_count = 50(イニシエータ ID 1.1.2、ターゲット ID 2.2.1、および LUN ID 0001 間だけの読み取り I/O)

scsi_target_itl_flow ビューで、ポート = fc 1/4、VSAN = 1、イニシエータ ID = 1.1.1、ターゲット ID = 2.2.2、LUN ID = 0002

total_read_io_count = 75(イニシエータ ID 1.1.1、ターゲット ID 2.2.2、および LUN ID 0002 間だけの読み取り I/O)

scsi_target_itl_flow ビューで、ポート = fc 1/4、VSAN = 1、イニシエータ ID = 1.1.2、ターゲット ID = 2.2.2、LUN ID = 0002

total_read_io_count = 50(イニシエータ ID 1.1.2、ターゲット ID 2.2.2、および LUN ID 0002 間だけの読み取り I/O)

scsi_target_itl_flow ビューで、ポート = fc 1/4、VSAN = 2、イニシエータ ID = 1.1.3、ターゲット ID = 2.2.3、LUN ID = 0003

scsi_target_itl_flow ビューで、ポート = fc 1/4、VSAN = 2、イニシエータ ID = 1.1.3、ターゲット ID = 2.2.3、LUN ID = 0004

total_read_io_count = 150(イニシエータ ID 1.1.3、ターゲット ID 2.2.3、および LUN ID 0003 とイニシエータ ID 1.1.3、ターゲット ID 2.2.3、および LUN ID 0004 間だけの読み取り I/O)

次の図は、scsi_target_tl_flow ビュー タイプから見たフロー メトリックを示しています。

図 23. scsi_target_tl_flow ビュー タイプ
表 14. scsi_target_tl_flow ビュー タイプ

scsi_target_tl_flow ビュー

フロー メトリック

scsi_target_tl_flow ビューで、ポート = fc 1/6、VSAN = 1、ターゲット ID = 2.2.1、LUN ID = 0001

scsi_target_tl_flow ビューで、ポート = fc 1/4、VSAN = 1、ターゲット ID = 2.2.1、LUN ID = 0001

total_read_io_count = 175(ターゲット ID 2.2.1 と LUN ID 0001 間だけの読み取り I/O)

scsi_target_tl_flow ビューで、ポート = fc 1/4、VSAN = 1、ターゲット ID = 2.2.2、LUN ID = 0002

total_read_io_count = 125(ターゲット ID 2.2.2 と LUN ID 0002 間だけの読み取り I/O)

scsi_target_tl_flow ビューで、ポート = fc 1/4、VSAN = 2、ターゲット ID = 2.2.3、LUN ID = 0003

scsi_target_tl_flow ビューで、ポート = fc 1/4、VSAN = 2、ターゲット ID = 2.2.3、LUN ID = 0004

total_read_io_count = 150(ターゲット ID 2.2.3 と LUN ID 0003 およびターゲット ID 2.2.3 と LUN ID 0004 間だけの読み取り I/O)

次の図は、total_read_io_count が 0 のイニシエータ ビューを示しています。

図 24. total_read_io_count が 0 のイニシエータ ビュー

次の図は、total_read_io_count が 0 のターゲット ビューを示しています。

図 25. total_read_io_count が 0 のターゲット ビュー

例:クエリ構文の設定

show analytics query 'select all from fc-scsi.scsi_initiator' コマンドを実行すると、次の図に示されているサンプル データベースで確認できるように、すべてのイニシエータのフロー メトリックが出力されます。

図 26. すべてのイニシエータのフロー メトリック

show analytics query 'select total_read_io_count from fc-scsi.scsi_initiator' コマンドを実行すると、次の図に示されているサンプル データベースで確認できるように、ターゲットの total_read_io_count フロー メトリックが出力されます。

図 27. ターゲットの読み取り IO 総数のフロー メトリック

show analytics query 'select total_read_io_count,total_write_io_count from fc-scsi.scsi_target_it_flow’ コマンドを実行すると、次の図に示されているサンプル データベースで確認できるように、ターゲットから見たイニシエータとターゲットの total_read_io_count および total_write_io_count フロー メトリックが出力されます。

図 28. イニシエータとターゲットの読み取り IO 総数と書き込み IO 総数のフロー メトリック

show analytics query 'select all from fc-scsi.port where port=fc1/1 and vsan=2 limit 1’ コマンドを実行すると、次の図に示されているサンプル データベースで確認できるように、レコードの数が 1 に制限されているポート fc1/1、VSAN 2 の一部であるポートのフロー メトリックが出力されます。

図 29. レコードの数が 1 に制限されている VSAN 2 に属しているポート FC 1/1 のフロー メトリック

show analytics query 'select all from fc-scsi.scsi_initiator where port=fc1/1 and vsan=3 sort total_write_io_count’ コマンドを実行すると、次の図のサンプル データベースで確認できるように、ポート fc1/1 および VSAN 3 の一部であるイニシエータの total_write_io_count フロー メトリックが出力されます。出力はソートされています。

図 30. ポート FC1/1 と VSAN 3 に属しているイニシエータの書き込み IO 総数のフロー メトリック(出力はソート済み)

クエリの作成と使用

フロー メトリックは、クエリ構文の形式である query_string を使用して分析されます。

インストールされているプッシュ クエリの表示

インストールされているプッシュ クエリを表示するには、次のコマンドを実行します。

switch# show analytics query { all | name query_name}

プッシュ クエリの結果の表示

プッシュ クエリの結果を表示するには、次のコマンドを実行します。

switch# show analytics query name query_name result

プル クエリの実行

プル クエリを実行するには、次のコマンドを実行します。

switch# show analytics query “query_string” [clear] [differential]


(注)  

"query_string" を使用して、“select all from fc-scsi.port” のように、selecttablelimit などのクエリ セマンティックを指定します。


プッシュ クエリの設定

プッシュ クエリを設定するには、次の手順を実行します。

手順


ステップ 1

グローバル コンフィギュレーション モードを開始します。

switch# configure terminal

ステップ 2

特定の間隔で表示されるフロー メトリックのクエリ文字列とタイマー値を指定します。

switch(config)# analytics query “query_string” name query_name type periodic [interval seconds] [clear] [differential]

"query_string" を使用したプッシュ クエリは、一度に 1 つのみ許可されます。重複するプッシュ クエリ名を設定しようとすると、現在の設定が重複していることを示すメッセージが表示されます。

(注)   

プル クエリ、プッシュ クエリ、およびオーバーレイ CLI は、SAN アナリティクス機能が有効になっているインターフェイスにのみ適用されます。


設定されているプッシュ クエリの削除

設定されているプッシュ クエリを削除するには、次の手順を実行します。

手順


ステップ 1

グローバル コンフィギュレーション モードを開始します。

switch# configure terminal

ステップ 2

設定されているプッシュ クエリを削除します。

switch(config)# no analytics name query_name


メトリックのクリア

クエリ文字列に一致するビュー インスタンスのすべてのフロー メトリックをリセットするには、次のコマンドを実行します。

switch# clear analytics query “query_string”


(注)  

  • "query_string""select all from <view-name>" の形式である必要があります。

  • フロー メトリックは、プッシュ クエリをインストールしなくてもクリアできます。

  • clear analytics query コマンドは、プッシュ クエリで使用されている clear オプションとは異なります。clear analytics query コマンドは、クエリ構文を満たすすべてのメトリックをリセットします。プッシュ クエリで使用される clear オプションは、最小、最大、およびピーク フロー メトリックをリセットします。


ビューの消去

特定のビュー インスタンスとその関連メトリックを削除するには、次のコマンドを実行します。

switch# purge analytics query “query_string”


(注)  

  • "query_string""select all from <view-name>" の形式である必要があります。

  • フロー メトリックは、プッシュ クエリをインストールしなくてもクリアできます。

  • 消去クエリの where 句には、port キー フィールドのみ指定できます。


設定されているプッシュ クエリの結果の表示

show analytics query name query_name result コマンドを使用して表示されているフロー メトリックは、このコマンドの実行時の時間間隔で更新されたメトリックです。たとえば、プッシュ クエリが 30 秒間隔で更新するように設定されている場合、show analytics query name query_name result コマンドは 35 秒後に実行され、プッシュ クエリでは、時間間隔が 30 秒のときに更新されたフロー メトリックが表示されます。

設定されているプッシュ クエリのフロー メトリックを表示するには、次のコマンドを実行します。

switch# show analytics query name query_name result

例:クエリの作成と使用


(注)  

  • 出力の “values” の後にある番号は、対応するレコードの番号を示しています。

  • Cisco MDS NX-OS リリース 8.3(1) では新しいメトリックが追加されています。これは、Cisco MDS NX-OS リリース 8.3(1) 以降のリリースと Cisco MDS NX-OS リリース 8.2(1) の間でクエリの結果が少し異なる可能性があるためです。


次に、SCSI イニシエータ ITL フロー ビュー インスタンスのすべてのフロー メトリックの出力の例を示します。


switch#  show analytics query 'select all from fc-scsi.scsi_initiator_itl_flow'
{ "values": {
        "1": {
                "port": "fc1/1",
                "vsan": "10",
                "app_id": "255",
                "initiator_id": "0xe80041",
                "target_id": "0xd60200",
                "lun": "0000-0000-0000-0000",
                "active_io_read_count": "0",
                "active_io_write_count": "1",
                "total_read_io_count": "0",
                "total_write_io_count": "1162370362",
                "total_seq_read_io_count": "0",
                "total_seq_write_io_count": "1",
                "total_read_io_time": "0",
                "total_write_io_time": "116204704658",
                "total_read_io_initiation_time": "0",
                "total_write_io_initiation_time": "43996934029",
                "total_read_io_bytes": "0",
                "total_write_io_bytes": "595133625344",
                "total_read_io_inter_gap_time": "0",
                "total_write_io_inter_gap_time": "41139462314556",
                "total_time_metric_based_read_io_count": "0",
                "total_time_metric_based_write_io_count": "1162370358",
                "total_time_metric_based_read_io_bytes": "0",
                "total_time_metric_based_write_io_bytes": "595133623296",
                "read_io_rate": "0",
                "peak_read_io_rate": "0",
                "write_io_rate": "7250",
                "peak_write_io_rate": "7304",
                "read_io_bandwidth": "0",
                "peak_read_io_bandwidth": "0",
                "write_io_bandwidth": "3712384",
                "peak_write_io_bandwidth": "3739904",
                "read_io_size_min": "0",
                "read_io_size_max": "0",
                "write_io_size_min": "512",
                "write_io_size_max": "512",
                "read_io_completion_time_min": "0",
                "read_io_completion_time_max": "0",
                "write_io_completion_time_min": "89",
                "write_io_completion_time_max": "416",
                "read_io_initiation_time_min": "0",
                "read_io_initiation_time_max": "0",
                "write_io_initiation_time_min": "34",
                "write_io_initiation_time_max": "116",
                "read_io_inter_gap_time_min": "0",
                "read_io_inter_gap_time_max": "0",
                "write_io_inter_gap_time_min": "31400",
                "write_io_inter_gap_time_max": "118222",
                "peak_active_io_read_count": "0",
                "peak_active_io_write_count": "5",
                "read_io_aborts": "0",
                "write_io_aborts": "0",
                "read_io_failures": "0",
                "write_io_failures": "0",
                "read_io_scsi_check_condition_count": "0",
                "write_io_scsi_check_condition_count": "0",
                "read_io_scsi_busy_count": "0",
                "write_io_scsi_busy_count": "0",
                "read_io_scsi_reservation_conflict_count": "0",
                "write_io_scsi_reservation_conflict_count": "0",
                "read_io_scsi_queue_full_count": "0",
                "write_io_scsi_queue_full_count": "0",
                "sampling_start_time": "1528535447",
                "sampling_end_time": "1528697457"
        },
       .
       .
       .
        "5": {
                "port": "fc1/8",
                "vsan": "10",
                "app_id": "255",
                "initiator_id": "0xe80001",
                "target_id": "0xe800a1",
                "lun": "0000-0000-0000-0000",
                "active_io_read_count": "0",
                "active_io_write_count": "1",
                "total_read_io_count": "0",
                "total_write_io_count": "1138738309",
                "total_seq_read_io_count": "0",
                "total_seq_write_io_count": "1",
                "total_read_io_time": "0",
                "total_write_io_time": "109792480881",
                "total_read_io_initiation_time": "0",
                "total_write_io_initiation_time": "39239145641",
                "total_read_io_bytes": "0",
                "total_write_io_bytes": "583034014208",
                "total_read_io_inter_gap_time": "0",
                "total_write_io_inter_gap_time": "41479779998852",
                "total_time_metric_based_read_io_count": "0",
                "total_time_metric_based_write_io_count": "1138738307",
                "total_time_metric_based_read_io_bytes": "0",
                "total_time_metric_based_write_io_bytes": "583034013184",
                "read_io_rate": "0",
                "peak_read_io_rate": "0",
                "write_io_rate": "7074",
                "peak_write_io_rate": "7903",
                "read_io_bandwidth": "0",
                "peak_read_io_bandwidth": "0",
                "write_io_bandwidth": "3622144",
                "peak_write_io_bandwidth": "4046336",
                "read_io_size_min": "0",
                "read_io_size_max": "0",
                "write_io_size_min": "512",
                "write_io_size_max": "512",
                "read_io_completion_time_min": "0",
                "read_io_completion_time_max": "0",
                "write_io_completion_time_min": "71",
                "write_io_completion_time_max": "3352",
                "read_io_initiation_time_min": "0",
                "read_io_initiation_time_max": "0",
                "write_io_initiation_time_min": "26",
                "write_io_initiation_time_max": "2427",
                "read_io_inter_gap_time_min": "0",
                "read_io_inter_gap_time_max": "0",
                "write_io_inter_gap_time_min": "25988",
                "write_io_inter_gap_time_max": "868452",
                "peak_active_io_read_count": "0",
                "peak_active_io_write_count": "5",
                "read_io_aborts": "0",
                "write_io_aborts": "0",
                "read_io_failures": "0",
                "write_io_failures": "0",
                "read_io_scsi_check_condition_count": "0",
                "write_io_scsi_check_condition_count": "0",
                "read_io_scsi_busy_count": "0",
                "write_io_scsi_busy_count": "0",
                "read_io_scsi_reservation_conflict_count": "0",
                "write_io_scsi_reservation_conflict_count": "0",
                "read_io_scsi_queue_full_count": "0",
                "write_io_scsi_queue_full_count": "0",
                "sampling_start_time": "1528535447",
                "sampling_end_time": "1528697457"
        }
}}

次に、NVMe イニシエータ ITN フロー ビュー インスタンスのすべてのフロー メトリックの出力の例を示します。


switch# show analytics query 'select all from fc-nvme.nvme_initiator_itn_flow'
{ "values": {
        "1": {
                "port": "fc1/9",
                "vsan": "5",
                "app_id": "255",
                "initiator_id": "0xa40160",
                "target_id": "0xa4018c",
                "connection_id": "0000-0000-0000-0000",
                "namespace_id": "1",
                "active_io_read_count": "0",
                "active_io_write_count": "0",
                "total_read_io_count": "414106348",
                "total_write_io_count": "0",
                "total_seq_read_io_count": "0",
                "total_seq_write_io_count": "0",
                "total_read_io_time": "204490863437",
                "total_write_io_time": "0",
                "total_read_io_initiation_time": "132775579977",
                "total_write_io_initiation_time": "0",
                "total_read_io_bytes": "16226866588672",
                "total_write_io_bytes": "0",
                "total_read_io_inter_gap_time": "19198018763772",
                "total_write_io_inter_gap_time": "0",
                "total_time_metric_based_read_io_count": "414106244",
                "total_time_metric_based_write_io_count": "0",
                "total_time_metric_based_read_io_bytes": "16226860198912",
                "total_time_metric_based_write_io_bytes": "0",
                "read_io_rate": "0",
                "peak_read_io_rate": "16826",
                "write_io_rate": "0",
                "peak_write_io_rate": "0",
                "read_io_bandwidth": "0",
                "peak_read_io_bandwidth": "656438400",
                "write_io_bandwidth": "0",
                "peak_write_io_bandwidth": "0",
                "read_io_size_min": "1024",
                "read_io_size_max": "262144",
                "write_io_size_min": "0",
                "write_io_size_max": "0",
                "read_io_completion_time_min": "16",
                "read_io_completion_time_max": "7057",
                "write_io_completion_time_min": "0",
                "write_io_completion_time_max": "0",
                "read_io_initiation_time_min": "16",
                "read_io_initiation_time_max": "5338",
                "write_io_initiation_time_min": "0",
                "write_io_initiation_time_max": "0",
                "read_io_inter_gap_time_min": "32",
                "read_io_inter_gap_time_max": "83725169",
                "write_io_inter_gap_time_min": "0",
                "write_io_inter_gap_time_max": "0",
                "peak_active_io_read_count": "11",
                "peak_active_io_write_count": "0",
                "read_io_aborts": "24",
                "write_io_aborts": "0",
                "read_io_failures": "80",
                "write_io_failures": "0",
                "read_io_timeouts": "0",
                "write_io_timeouts": "0",
                "read_io_nvme_lba_out_of_range_count": "0",
                "write_io_nvme_lba_out_of_range_count": "0",
                "read_io_nvme_ns_not_ready_count": "0",
                "write_io_nvme_ns_not_ready_count": "0",
                "read_io_nvme_reservation_conflict_count": "0",
                "write_io_nvme_reservation_conflict_count": "0",
                "read_io_nvme_capacity_exceeded_count": "0",
                "write_io_nvme_capacity_exceeded_count": "0",
                "sampling_start_time": "1512847422",
                "sampling_end_time": "1513166516"
        },
       .
       .
       .
        "5": {
                "port": "fc1/9",
                "vsan": "5",
                "app_id": "255",
                "initiator_id": "0xa40165",
                "target_id": "0xa40190",
                "connection_id": "0000-0000-0000-0000",
                "namespace_id": "1",
                "active_io_read_count": "0",
                "active_io_write_count": "0",
                "total_read_io_count": "33391955",
                "total_write_io_count": "643169087",
                "total_seq_read_io_count": "0",
                "total_seq_write_io_count": "0",
                "total_read_io_time": "13005795783",
                "total_write_io_time": "131521212441",
                "total_read_io_initiation_time": "5696099596",
                "total_write_io_initiation_time": "71938348902",
                "total_read_io_bytes": "1309083368448",
                "total_write_io_bytes": "329302572544",
                "total_read_io_inter_gap_time": "19175084866843",
                "total_write_io_inter_gap_time": "19182318062480",
                "total_time_metric_based_read_io_count": "33391919",
                "total_time_metric_based_write_io_count": "643168808",
                "total_time_metric_based_read_io_bytes": "1309074355200",
                "total_time_metric_based_write_io_bytes": "329302429696",
                "read_io_rate": "0",
                "peak_read_io_rate": "574",
                "write_io_rate": "0",
                "peak_write_io_rate": "9344",
                "read_io_bandwidth": "0",
                "peak_read_io_bandwidth": "19122176",
                "write_io_bandwidth": "0",
                "peak_write_io_bandwidth": "4784384",
                "read_io_size_min": "1024",
                "read_io_size_max": "262144",
                "write_io_size_min": "512",
                "write_io_size_max": "512",
                "read_io_completion_time_min": "16",
                "read_io_completion_time_max": "5123",
                "write_io_completion_time_min": "27",
                "write_io_completion_time_max": "2254",
                "read_io_initiation_time_min": "16",
                "read_io_initiation_time_max": "3650",
                "write_io_initiation_time_min": "12",
                "write_io_initiation_time_max": "1377",
                "read_io_inter_gap_time_min": "32",
                "read_io_inter_gap_time_max": "3234375975",
                "write_io_inter_gap_time_min": "32",
                "write_io_inter_gap_time_max": "38886219",
                "peak_active_io_read_count": "6",
                "peak_active_io_write_count": "16",
                "read_io_aborts": "6",
                "write_io_aborts": "18",
                "read_io_failures": "30",
                "write_io_failures": "261",
                "read_io_timeouts": "0",
                "write_io_timeouts": "0",
                "read_io_nvme_lba_out_of_range_count": "0",
                "write_io_nvme_lba_out_of_range_count": "0",
                "read_io_nvme_ns_not_ready_count": "0",
                "write_io_nvme_ns_not_ready_count": "0",
                "read_io_nvme_reservation_conflict_count": "0",
                "write_io_nvme_reservation_conflict_count": "0",
                "read_io_nvme_capacity_exceeded_count": "0",
                "write_io_nvme_capacity_exceeded_count": "0",
                "sampling_start_time": "1512847422",
                "sampling_end_time": "1513166516"
        }
}}


次の例は、イニシエータ ITL フロー ビュー インスタンスの特定のイニシエータ ID に対する特定のフロー メトリックの出力を示しています。


switch#   show analytics query 'select port,initiator_id,target_id,lun,total_read_io_count,total_write_io_count,read_io_rate,write_io_rate from fc-scsi.scsi_initiator_itl_flow where initiator_id=0xe80001'
{ "values": {
        "1": {
                "port": "fc1/8",
                "initiator_id": "0xe80001",
                "target_id": "0xe800a1",
                "lun": "0000-0000-0000-0000",
                "total_read_io_count": "0",
                "total_write_io_count": "1139010960",
                "read_io_rate": "0",
                "write_io_rate": "7071",
                "sampling_start_time": "1528535447",
                "sampling_end_time": "1528697495"
        }
}}

次の例は、イニシエータ ITL フロー ビュー インスタンスの特定のイニシエータ ID と LUN に対する特定のフロー メトリックの出力を示しています。


switch#   show analytics query 'select port,initiator_id,target_id,lun,total_read_io_count,total_write_io_count,read_io_rate,write_io_rate from fc-scsi.scsi_initiator_itl_flow where initiator_id=0xe80001 and lun=0000-0000-0000-0000'
{ "values": {
        "1": {
                "port": "fc1/8",
                "initiator_id": "0xe80001",
                "target_id": "0xe800a1",
                "lun": "0000-0000-0000-0000",
                "total_read_io_count": "0",
                "total_write_io_count": "1139453979",
                "read_io_rate": "0",
                "write_io_rate": "7070",
                "sampling_start_time": "1528535447",
                "sampling_end_time": "1528697559"
        }
}}

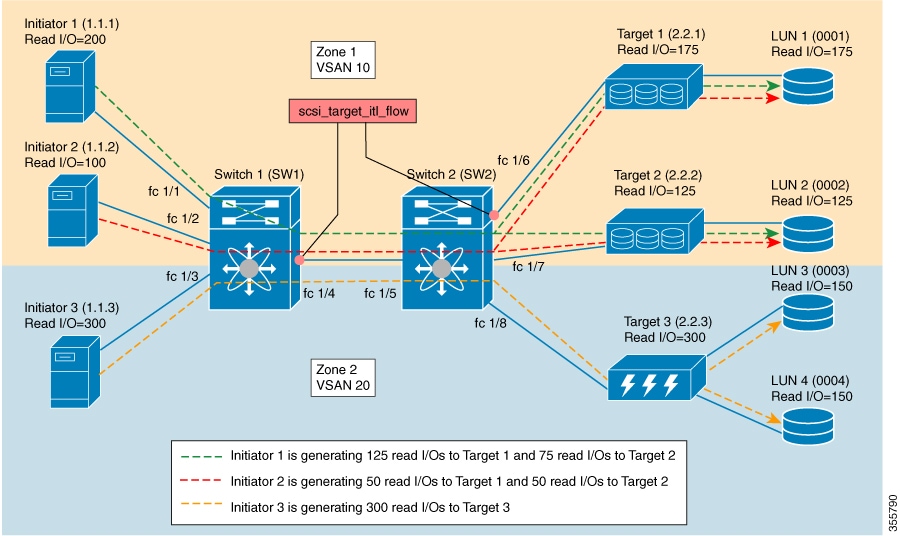
次に、特定の LUN の特定のフロー メトリックの出力とターゲット ITL フロー ビュー インスタンスの write_io_rate メトリックのソートされた出力の例を示します。


switch#   show analytics query 'select port,initiator_id,target_id,lun,total_read_io_count,total_write_io_count,read_io_rate,write_io_rate from fc-scsi.scsi_target_itl_flow where lun=0000-0000-0000-0000 sort write_io_rate'
{ "values": {
        "1": {
                "port": "fc1/6",
                "initiator_id": "0xe80020",
                "target_id": "0xd60040",
                "lun": "0000-0000-0000-0000",
                "total_read_io_count": "0",
                "total_write_io_count": "1103394068",
                "read_io_rate": "0",
                "write_io_rate": "6882",
                "sampling_start_time": "1528535447",
                "sampling_end_time": "1528697630"
        },
        "2": {
                "port": "fc1/6",
                "initiator_id": "0xe80021",
                "target_id": "0xe80056",
                "lun": "0000-0000-0000-0000",
                "total_read_io_count": "0",
                "total_write_io_count": "1119199742",
                "read_io_rate": "0",
                "write_io_rate": "6946",
                "sampling_start_time": "1528535447",
                "sampling_end_time": "1528697630"
        },
        "3": {
                "port": "fc1/8",
                "initiator_id": "0xe80000",
                "target_id": "0xe80042",
                "lun": "0000-0000-0000-0000",
                "total_read_io_count": "0",
                "total_write_io_count": "1119506589",
                "read_io_rate": "0",
                "write_io_rate": "6948",
                "sampling_start_time": "1528535447",
                "sampling_end_time": "1528697630"
        },
        "4": {
                "port": "fc1/8",
                "initiator_id": "0xe80001",
                "target_id": "0xe800a1",
                "lun": "0000-0000-0000-0000",
                "total_read_io_count": "0",
                "total_write_io_count": "1139953183",
                "read_io_rate": "0",
                "write_io_rate": "7068",
                "sampling_start_time": "1528535447",
                "sampling_end_time": "1528697630"
        },
        "5": {
                "port": "fc1/1",
                "initiator_id": "0xe80041",
                "target_id": "0xd60200",
                "lun": "0000-0000-0000-0000",
                "total_read_io_count": "0",
                "total_write_io_count": "1163615698",
                "read_io_rate": "0",
                "write_io_rate": "7247",
                "sampling_start_time": "1528535447",
                "sampling_end_time": "1528697630"
        }
}}

次に、出力が 3 レコードに制限されている、特定の LUN の特定のフロー メトリックの出力とイニシエータ ITL フロー ビュー インスタンスの write_io_rate メトリックのソートされた出力の例を示します。


switch#   show analytics query 'select port,initiator_id,target_id,lun,total_read_io_count,total_write_io_count,read_io_rate,write_io_rate from fc-scsi.scsi_initiator_itl_flow where lun=0000-0000-0000-0000 sort write_io_rate limit 3'
{ "values": {
        "1": {
                "port": "fc1/6",
                "initiator_id": "0xe80020",
                "target_id": "0xd60040",
                "lun": "0000-0000-0000-0000",
                "total_read_io_count": "0",
                "total_write_io_count": "1103901828",
                "read_io_rate": "0",
                "write_io_rate": "6885",
                "sampling_start_time": "1528535447",
                "sampling_end_time": "1528697704"
        },
        "2": {
                "port": "fc1/8",
                "initiator_id": "0xe80000",
                "target_id": "0xe80042",
                "lun": "0000-0000-0000-0000",
                "total_read_io_count": "0",
                "total_write_io_count": "1120018575",
                "read_io_rate": "0",
                "write_io_rate": "6940",
                "sampling_start_time": "1528535447",
                "sampling_end_time": "1528697704"
        },
        "3": {
                "port": "fc1/6",
                "initiator_id": "0xe80021",
                "target_id": "0xe80056",
                "lun": "0000-0000-0000-0000",
                "total_read_io_count": "0",
                "total_write_io_count": "1119711583",
                "read_io_rate": "0",
                "write_io_rate": "6942",
                "sampling_start_time": "1528535447",
                "sampling_end_time": "1528697704"
        }
}}

次に、イニシエータ ITL フロー ビュー インスタンスの特定の LUN とターゲット ID に関する特定のフロー メトリックの出力の例を示します。


switch#   show analytics query 'select port,initiator_id,target_id,lun,total_read_io_count,total_write_io_count,read_io_rate,write_io_rate from fc-scsi.scsi_initiator_itl_flow where lun=0000-0000-0000-0000 and target_id=0xe800a1'
{ "values": {
        "1": {
                "port": "fc1/8",
                "initiator_id": "0xe80001",
                "target_id": "0xe800a1",
                "lun": "0000-0000-0000-0000",
                "total_read_io_count": "0",
                "total_write_io_count": "1139010960",
                "read_io_rate": "0",
                "write_io_rate": "7071"
                "sampling_start_time": "1528535447",
                "sampling_end_time": "1528697495"
        }
}}

次の例は、イニシエータ ITL フロー ビュー インスタンスの VMID 4 およびイニシエータ ID 0x0900e0 の特定のフロー メトリックの出力を示しています。


switch#   show analytics query "select port,vsan,initiator_id,vmid from fc-scsi.scsi_initiator_itl_flow where initiator_id=0x0900e0 and vmid=4"
{ "values": {
        "1": {
                "port": "fc2/9",
                "vsan": "1",
                "initiator_id": "0x0900e0",
                "vmid": "4",
                "sampling_start_time": "1589269530",
        }
}}

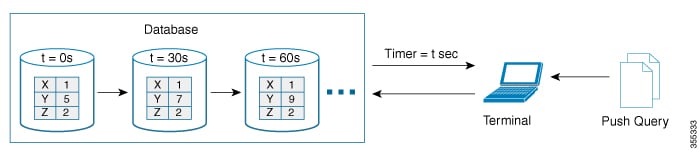
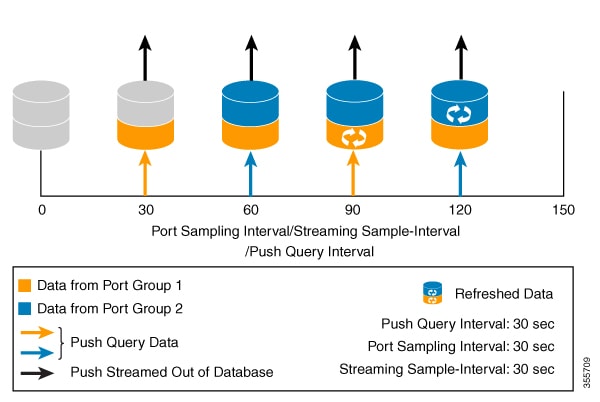
次の例は、フロー メトリックの更新期間がデフォルトの期間の 30 秒に設定されている場合のプッシュ クエリの設定を示します。


switch# configure terminal
switch(config)# analytics query 'select all from fc-scsi.scsi_initiator_itl_flow' name initiator_itl_flow type periodic
switch(config)# show analytics query name initiator_itl_flow result 
{ "values": {
        "1": {
                "port": "fc1/1",
                "vsan": "10",
                "app_id": "255",
                "initiator_id": "0xe80041",
                "target_id": "0xd60200",
                "lun": "0000-0000-0000-0000",
                "active_io_read_count": "0",
                "active_io_write_count": "1",
                "total_read_io_count": "0",
                "total_write_io_count": "1162370362",
                "total_seq_read_io_count": "0",
                "total_seq_write_io_count": "1",
                "total_read_io_time": "0",
                "total_write_io_time": "116204704658",
                "total_read_io_initiation_time": "0",
                "total_write_io_initiation_time": "43996934029",
                "total_read_io_bytes": "0",
                "total_write_io_bytes": "595133625344",
                "total_read_io_inter_gap_time": "0",
                "total_write_io_inter_gap_time": "41139462314556",
                "total_time_metric_based_read_io_count": "0",
                "total_time_metric_based_write_io_count": "1162370358",
                "total_time_metric_based_read_io_bytes": "0",
                "total_time_metric_based_write_io_bytes": "595133623296",
                "read_io_rate": "0",
                "peak_read_io_rate": "0",
                "write_io_rate": "7250",
                "peak_write_io_rate": "7304",
                "read_io_bandwidth": "0",
                "peak_read_io_bandwidth": "0",
                "write_io_bandwidth": "3712384",
                "peak_write_io_bandwidth": "3739904",
                "read_io_size_min": "0",
                "read_io_size_max": "0",
                "write_io_size_min": "512",
                "write_io_size_max": "512",
                "read_io_completion_time_min": "0",
                "read_io_completion_time_max": "0",
                "write_io_completion_time_min": "89",
                "write_io_completion_time_max": "416",
                "read_io_initiation_time_min": "0",
                "read_io_initiation_time_max": "0",
                "write_io_initiation_time_min": "34",
                "write_io_initiation_time_max": "116",
                "read_io_inter_gap_time_min": "0",
                "read_io_inter_gap_time_max": "0",
                "write_io_inter_gap_time_min": "31400",
                "write_io_inter_gap_time_max": "118222",
                "peak_active_io_read_count": "0",
                "peak_active_io_write_count": "5",
                "read_io_aborts": "0",
                "write_io_aborts": "0",
                "read_io_failures": "0",
                "write_io_failures": "0",
                "read_io_scsi_check_condition_count": "0",
                "write_io_scsi_check_condition_count": "0",
                "read_io_scsi_busy_count": "0",
                "write_io_scsi_busy_count": "0",
                "read_io_scsi_reservation_conflict_count": "0",
                "write_io_scsi_reservation_conflict_count": "0",
                "read_io_scsi_queue_full_count": "0",
                "write_io_scsi_queue_full_count": "0",
                "sampling_start_time": "1528535447",
                "sampling_end_time": "1528697457"
        },
        .
        .
        .
        "5": {
                "port": "fc1/8",
                "vsan": "10",
                "app_id": "255",
                "initiator_id": "0xe80001",
                "target_id": "0xe800a1",
                "lun": "0000-0000-0000-0000",
                "active_io_read_count": "0",
                "active_io_write_count": "1",
                "total_read_io_count": "0",
                "total_write_io_count": "1138738309",
                "total_seq_read_io_count": "0",
                "total_seq_write_io_count": "1",
                "total_read_io_time": "0",
                "total_write_io_time": "109792480881",
                "total_read_io_initiation_time": "0",
                "total_write_io_initiation_time": "39239145641",
                "total_read_io_bytes": "0",
                "total_write_io_bytes": "583034014208",
                "total_read_io_inter_gap_time": "0",
                "total_write_io_inter_gap_time": "41479779998852",
                "total_time_metric_based_read_io_count": "0",
                "total_time_metric_based_write_io_count": "1138738307",
                "total_time_metric_based_read_io_bytes": "0",
                "total_time_metric_based_write_io_bytes": "583034013184",
                "read_io_rate": "0",
                "peak_read_io_rate": "0",
                "write_io_rate": "7074",
                "peak_write_io_rate": "7903",
                "read_io_bandwidth": "0",
                "peak_read_io_bandwidth": "0",
                "write_io_bandwidth": "3622144",
                "peak_write_io_bandwidth": "4046336",
                "read_io_size_min": "0",
                "read_io_size_max": "0",
                "write_io_size_min": "512",
                "write_io_size_max": "512",
                "read_io_completion_time_min": "0",
                "read_io_completion_time_max": "0",
                "write_io_completion_time_min": "71",
                "write_io_completion_time_max": "3352",
                "read_io_initiation_time_min": "0",
                "read_io_initiation_time_max": "0",
                "write_io_initiation_time_min": "26",
                "write_io_initiation_time_max": "2427",
                "read_io_inter_gap_time_min": "0",
                "read_io_inter_gap_time_max": "0",
                "write_io_inter_gap_time_min": "25988",
                "write_io_inter_gap_time_max": "868452",
                "peak_active_io_read_count": "0",
                "peak_active_io_write_count": "5",
                "read_io_aborts": "0",
                "write_io_aborts": "0",
                "read_io_failures": "0",
                "write_io_failures": "0",
                "read_io_scsi_check_condition_count": "0",
                "write_io_scsi_check_condition_count": "0",
                "read_io_scsi_busy_count": "0",
                "write_io_scsi_busy_count": "0",
                "read_io_scsi_reservation_conflict_count": "0",
                "write_io_scsi_reservation_conflict_count": "0",
                "read_io_scsi_queue_full_count": "0",
                "write_io_scsi_queue_full_count": "0",
                "sampling_start_time": "1528535447",
                "sampling_end_time": "1528697457"
        }
}}

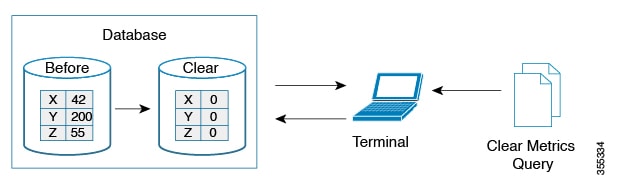
次の例は、最小、最大、およびピーク フロー メトリックをすべてクリアする方法を示します。

  • 次の例は、最小、最大、およびピーク フロー メトリックをすべてクリアする前の出力を示します。

    
    switch# show analytics query "select all from  fc-scsi.scsi_target_itl_flow where port=fc1/17" clear
    { "values": {
            "1": {
                    "port": "fc1/17",
                    "vsan": "1",
                    "app_id": "255",
                    "target_id": "0xef0040",
                    "initiator_id": "0xef0000",
                    "lun": "0000-0000-0000-0000",
                    "active_io_read_count": "0",
                    "active_io_write_count": "1",
                    "total_read_io_count": "0",
                    "total_write_io_count": "84701",
                    "total_seq_read_io_count": "0",
                    "total_seq_write_io_count": "1",
                    "total_read_io_time": "0",
                    "total_write_io_time": "7007132",
                    "total_read_io_initiation_time": "0",
                    "total_write_io_initiation_time": "2421756",
                    "total_read_io_bytes": "0",
                    "total_write_io_bytes": "86733824",
                    "total_read_io_inter_gap_time": "0",
                    "total_write_io_inter_gap_time": "2508109021",
                    "total_time_metric_based_read_io_count": "0",
                    "total_time_metric_based_write_io_count": "84701",
                    "total_time_metric_based_read_io_bytes": "0",
                    "total_time_metric_based_write_io_bytes": "86733824",
                    "read_io_rate": "0",
                    "peak_read_io_rate": "0",
                    "write_io_rate": "8711",
                    "peak_write_io_rate": "8711",
                    "read_io_bandwidth": "0",
                    "peak_read_io_bandwidth": "0",
                    "write_io_bandwidth": "8920576",
                    "peak_write_io_bandwidth": "8920576",
                    "read_io_size_min": "0",
                    "read_io_size_max": "0",
                    "write_io_size_min": "1024",
                    "write_io_size_max": "1024",
                    "read_io_completion_time_min": "0",
                    "read_io_completion_time_max": "0",
                    "write_io_completion_time_min": "74",
                    "write_io_completion_time_max": "844",
                    "read_io_initiation_time_min": "0",
                    "read_io_initiation_time_max": "0",
                    "write_io_initiation_time_min": "24",
                    "write_io_initiation_time_max": "775",
                    "read_io_inter_gap_time_min": "0",
                    "read_io_inter_gap_time_max": "0",
                    "write_io_inter_gap_time_min": "26903",
                    "write_io_inter_gap_time_max": "287888",
                    "peak_active_io_read_count": "0",
                    "peak_active_io_write_count": "3",
                    "read_io_aborts": "0",
                    "write_io_aborts": "0",
                    "read_io_failures": "0",
                    "write_io_failures": "0",
                    "read_io_scsi_check_condition_count": "0",
                    "write_io_scsi_check_condition_count": "0",
                    "read_io_scsi_busy_count": "0",
                    "write_io_scsi_busy_count": "0",
                    "read_io_scsi_reservation_conflict_count": "0",
                    "write_io_scsi_reservation_conflict_count": "0",
                    "read_io_scsi_queue_full_count": "0",
                    "write_io_scsi_queue_full_count": "0",
                    "sampling_start_time": "1530683133",
                    "sampling_end_time": "1530684301"
            },
    }}


    (注)  

    show analytics query "query_string" clear コマンドは、clear-on-push または clear-on-pull コマンドです。そのため、このコマンドの初回実行時にはこのコマンドは適用されません。


  • 次の例は、最小、最大、およびピーク フロー メトリックをすべてクリアした後の出力を示します。クリアされたメトリックは出力で強調表示されています。

    
    switch# show analytics query "select all from  fc-scsi.scsi_target_itl_flow where port=fc1/17" clear
    { "values": {
            "1": {
                    "port": "fc1/17",
                   "vsan": "1",
                    "app_id": "255",
                    "target_id": "0xef0040",
                    "initiator_id": "0xef0000",
                    "lun": "0000-0000-0000-0000",
                    "active_io_read_count": "0",
                    "active_io_write_count": "0",
                    "total_read_io_count": "0",
                    "total_write_io_count": "800615",
                    "total_seq_read_io_count": "0",
                    "total_seq_write_io_count": "1",
                    "total_read_io_time": "0",
                    "total_write_io_time": "66090290",
                    "total_read_io_initiation_time": "0",
                    "total_write_io_initiation_time": "22793874",
                    "total_read_io_bytes": "0",
                    "total_write_io_bytes": "819829760",
                    "total_read_io_inter_gap_time": "0",
                    "total_write_io_inter_gap_time": "23702347887",
                    "total_time_metric_based_read_io_count": "0",
                    "total_time_metric_based_write_io_count": "800615",
                    "total_time_metric_based_read_io_bytes": "0",
                    "total_time_metric_based_write_io_bytes": "819829760",
                    "read_io_rate": "0",
                    "peak_read_io_rate": "0",
                    "write_io_rate": "0",
                    "peak_write_io_rate": "0",
                    "read_io_bandwidth": "0",
                    "peak_read_io_bandwidth": "0",
                    "write_io_bandwidth": "0",
                    "peak_write_io_bandwidth": "0",
                    "read_io_size_min": "0",
                    "read_io_size_max": "0",
                    "write_io_size_min": "0",
                    "write_io_size_max": "0",
                    "read_io_completion_time_min": "0",
                    "read_io_completion_time_max": "0",
                    "write_io_completion_time_min": "0",
                    "write_io_completion_time_max": "0",
                    "read_io_initiation_time_min": "0",
                    "read_io_initiation_time_max": "0",
                    "write_io_initiation_time_min": "0",
                    "write_io_initiation_time_max": "0",
                    "read_io_inter_gap_time_min": "0",
                    "read_io_inter_gap_time_max": "0",
                    "write_io_inter_gap_time_min": "0",
                    "write_io_inter_gap_time_max": "0",
                    "peak_active_io_read_count": "0",
                    "peak_active_io_write_count": "0",
                    "read_io_aborts": "0",
                    "write_io_aborts": "0",
                    "read_io_failures": "0",
                    "write_io_failures": "0",
                    "read_io_scsi_check_condition_count": "0",
                    "write_io_scsi_check_condition_count": "0",
                    "read_io_scsi_busy_count": "0",
                    "write_io_scsi_busy_count": "0",
                    "read_io_scsi_reservation_conflict_count": "0",
                    "write_io_scsi_reservation_conflict_count": "0",
                    "read_io_scsi_queue_full_count": "0",
                    "write_io_scsi_queue_full_count": "0",
                    "sampling_start_time": "1530683133",
                    "sampling_end_time": "1530684428"
            },
    }}


次の例は、ストリーミング サンプル間隔の間に変更された ITL フロー メトリックのみのストリーミングを示します。

  • 次の例は、[差分(Differential)] オプションを使用する前の出力を示します。

    
    switch# show analytics query "select port, target_id, initiator_id,lun,total_write_io_count from fc-scsi.scsi_target_itl_flow where port=fc1/17" differential 
    { "values": {
            "1": {
                    "port": "fc1/17",
                    "target_id": "0xef0040",
                    "initiator_id": "0xef0000",
                    "lun": "0001-0000-0000-0000",
                    "total_write_io_count": "1515601",
                    "sampling_start_time": "1530683133",
                    "sampling_end_time": "1530683484"
            },
            "2": {
                    "port": "fc1/17",
                    "target_id": "0xef0040",
                    "initiator_id": "0xef0020",
                    "lun": "0000-0000-0000-0000",
                    "total_write_io_count": "1515601",
                    "sampling_start_time": "1530683133",
                    "sampling_end_time": "1530683484"
            },
            "3": {
                    "port": "fc1/17",
                    "target_id": "0xef0040",
                    "initiator_id": "0xef0020",
                    "lun": "0001-0000-0000-0000",
                    "total_write_io_count": "1515600",
                    "sampling_start_time": "1530683133",
                    "sampling_end_time": "1530683484"
            },
            "4": {
                    "port": "fc1/17",
                    "target_id": "0xef0040",
                    "initiator_id": "0xef0000",
                    "lun": "0000-0000-0000-0000",
                    "total_write_io_count": "1515600",
                    "sampling_start_time": "1530683133",
                    "sampling_end_time": "1530683484"
            }
    }}
    
    
  • 次の例は、[差分(Differential)] オプションを使用した出力、および変更されたレコードのみの出力を示します。

    
    switch# show analytics query "select port, target_id, initiator_id,lun,total_write_io_count from fc-scsi.scsi_target_itl_flow where port=fc1/17" differential 
    { "values": {
           "1": {
                    "port": "fc1/17",
                    "target_id": "0xef0040",
                    "initiator_id": "0xef0000",
                    "lun": "0001-0000-0000-0000",
                    "total_write_io_count": "1892021",
                    "sampling_start_time": "1530683133",
                    "sampling_end_time": "1530683534"
            },
            "2": {
                    "port": "fc1/17",
                    "target_id": "0xef0040",
                    "initiator_id": "0xef0020",
                    "lun": "0000-0000-0000-0000",
                    "total_write_io_count": "1892021",
                    "sampling_start_time": "1530683133",
                    "sampling_end_time": "1530683534"
            },
            "3": {
                    "port": "fc1/17",
                    "target_id": "0xef0040",
                    "initiator_id": "0xef0000",
                    "lun": "0000-0000-0000-0000",
                    "total_write_io_count": "1892021",
                    "sampling_start_time": "1530683133",
                    "sampling_end_time": "1530683534"
            }
    }}


次の例は、インストールされたクエリ名の削除方法を示します。


switch(config)# no analytics name initiator_itl_flow

次の例は、フロー メトリックのクリア方法を示します。

  1. 次に、フロー メトリックをクリアする前の出力の例を示します。

    
    switch# show analytics query "select port,target_id,total_write_io_count,
    total_write_io_bytes,total_time_metric_based_write_io_count,write_io_rate,
    peak_write_io_rate,write_io_bandwidth,peak_write_io_bandwidth,
    write_io_size_min,write_io_size_max,write_io_completion_time_min,
    write_io_completion_time_max,write_io_initiation_time_min,
    write_io_initiation_time_max,write_io_inter_gap_time_min,write_io_inter_gap_time_max 
    from fc-scsi.scsi_target where 
    target_id=0x650060" 
    { "values": {
            "1": {
                    "port": "fc3/17",
                    "target_id": "0x650060",
                    "total_write_io_count": "67350021",
                    "total_write_io_bytes": "17655403905024",
                    "total_time_metric_based_write_io_count": "67349761",
                    "write_io_rate": "0",
                    "peak_write_io_rate": "6300",
                    "write_io_bandwidth": "0",
                    "peak_write_io_bandwidth": "1651572736",
                    "write_io_size_min": "262144",
                    "write_io_size_max": "262144",
                    "write_io_completion_time_min": "192",
                    "write_io_completion_time_max": "9434",
                    "write_io_initiation_time_min": "21",
                    "write_io_initiation_time_max": "199",
                    "write_io_inter_gap_time_min": "2553",
                    "write_io_inter_gap_time_max": "358500",
                    "sampling_start_time": "1531204359",
                    "sampling_end_time": "1531215327"
            }
    
    
  2. 次に、フロー メトリックをクリアする例を示します。


    (注)  

    メトリックのクリアは、ビュー インスタンスでのみ可能で、個々のフロー メトリックではできません。


    switch# clear analytics query "select all from fc-scsi.scsi_target where target_id=0x650060"
    
  3. 次に、フロー メトリックをクリアした後の出力の例を示します。

    
    switch# show analytics query "select port,target_id,total_write_io_count,
    total_write_io_bytes,total_time_metric_based_write_io_count,write_io_rate,
    peak_write_io_rate,write_io_bandwidth,peak_write_io_bandwidth,
    write_io_size_min,write_io_size_max,write_io_completion_time_min,
    write_io_completion_time_max,write_io_initiation_time_min,
    write_io_initiation_time_max,write_io_inter_gap_time_min,write_io_inter_gap_time_max 
    from fc-scsi.scsi_target where target_id=0x650060" 
    { "values": {
            "1": {
                    "port": "fc3/17",
                    "target_id": "0x650060",
                    "total_write_io_count": "0",
                    "total_write_io_bytes": "0",
                    "total_time_metric_based_write_io_count": "0",
                    "write_io_rate": "0",
                    "peak_write_io_rate": "0",
                    "write_io_bandwidth": "0",
                    "peak_write_io_bandwidth": "0",
                    "write_io_size_min": "0",
                    "write_io_size_max": "0",
                    "write_io_completion_time_min": "0",
                    "write_io_completion_time_max": "0",
                    "write_io_initiation_time_min": "0",
                    "write_io_initiation_time_max": "0",
                    "write_io_inter_gap_time_min": "0",
                    "write_io_inter_gap_time_max": "0",
                    "sampling_start_time": "1531204359",
                    "sampling_end_time": "1531215464"
            }


次に、フロー メトリックを消去した後の出力の例を示します。


(注)  

port キー値は、消去メトリックの where 句でのみ使用できます。


switch# purge analytics query "select all from fc-scsi.scsi_target where port=fc3/17"
switch# show analytics query "select all from fc-scsi.scsi_target where port=fc3/17"
Table is empty for query "select all from fc-scsi.scsi_target where port=fc3/17"

ShowAnalytics オーバーレイ CLI の使用

ShowAnalyticsオーバーレイ CLI は、JSON 形式の分析データを使いやすい表形式に変換するために使用されます。ShowAnalyticsオーバーレイ CLI には「Linux と同等」の構文があり、組み込みの NX-OS Python インタープリタを使用して、プル クエリの JSON 出力を表形式に変換するスクリプトを実行します。現時点では、フロー メトリックの小さなサブセットのみ表示されます。


(注)  

  • ShowAnalyticsオーバーレイ コマンド では、Exchange Completion Time (ECT)for the --initiator-itl and --target-itloptions under the --info オプションの累積データが表示されます。ただし、レートおよび帯域幅メトリックについては瞬間的なデータが表示されます。

  • アクティブな ITL 数が記載されている制限を超えている場合、ShowAnalyticsオーバーレイ コマンドは警告を表示して終了します。ITL 数の制限の詳細については、Cisco MDS NX-OS の設定の制限、リリース 8.x ドキュメントを参照してください。

  • Virtual Instruments 社や Cisco DCNM によって推奨されている clear キーワードを指定してプッシュ クエリを設定する場合、最小と最大のフロー メトリックの値は不正確になります。

  • ShowAnalytics コマンドの --evaluate-npuload オプションは、SCSI 分析タイプのみをサポートします。ただし、SCSI 分析タイプと NVMe 分析タイプの両方をサポートするオプションは除きます。

  • インターフェイスで分析タイプを構成する前に、--evaluate-npuload オプションを実行します。モジュールのインターフェイスの 1 つが分析タイプで構成されている場合でも、この --evaluate-npuload オプションはモジュールでは機能しません。

  • この --outstanding-io オプションは F ポートでのみ機能します。


分析情報を表形式で表示するには、次のコマンドを実行します。

switch# ShowAnalytics –help

詳細については、『Cisco MDS 9000 シリーズ コマンド リファレンス 8.x』を参照してください。

例:ShowAnalytics オーバーレイ CLI の使用

次の例は、オーバーレイ CLI のオプションを示します:


(注)  

オーバーレイ CLI で使用可能なキーワードと変数を表示するオプションと、Cisco MDS NX-OS リリース 8.4(2) 以降から追加されたそのオプション。


switch# ShowAnalytics ?
  ShowAnalytics              Aliased to 'source sys/analytics.py'
  ShowAnalyticsConsistency   Aliased to 'source sys/analytics_pss_consistency_checker.py'
  --errors                   To display errors stats in all IT(L/N) pairs
  --errorsonly               To display IT(L/N) flows with errors
  --evaluate-npuload         To evaluate npuload on system
  --help                     To display help and exit
  --info                     To display information about IT(L/N) flows
  --minmax                   To display min max and peak info about IT(L/N) flows
  --outstanding-io           To display outstanding io for an interface
  --top                      To display top 10 IT(L/N) Flow
  --version                  To display version of utility and exit
  --vsan-thput               To display per vsan throughput for interface

次に、オーバーレイ CLI バージョンの表示例を示します。


switch# ShowAnalytics --version
ShowAnalytics 4.0.0  

次に、NVMe のイニシエータのフロー メトリックの表示方法の例を示します:


switch# ShowAnalytics --info --initiator-itn
2021-02-09 09:01:39.714290

 Interface fc16/12
+-----------------------------------------+--------------+--------------------------+---------------------+---------------------+----------------------+----------------+-----------------+
|VSAN | Initiator |  Target   | Namespace |   Avg IOPS   |      Avg Throughput      |       Avg ECT       |       Avg DAL       |     Avg IO Size      | Avg Host Delay | Avg Array Delay |
+-----------------------------------------+--------------+--------------------------+---------------------+---------------------+----------------------+----------------+-----------------+
|                                         | Read | Write |     Read   |   Write     |   Read   |   Write  |   Read   |   Write  |   Read   |   Write   |     Write      |      Write      |
|                                         |              |                          |                     |                     |                      |                |                 |
|3300 | 0xc80002  | 0xed0002  |  1        | 2531 | 2478  | 158.2 MB/s | 154.9 MB/s  | 781.0 us |   2.0 ms | 636.0 us | 633.0 us |  64.0 KB |  64.0 KB  |    690.0 us    |     562.0 us    |
|3300 | 0xc80007  | 0xed0007  |  1        | 2508 | 2497  | 156.8 MB/s | 156.1 MB/s  | 764.0 us |   2.0 ms | 622.0 us | 630.0 us |  64.0 KB |  64.0 KB  |    683.0 us    |     572.0 us    |
|3300 | 0xc80005  | 0xed0005  |  1        | 2421 | 2548  | 151.3 MB/s | 159.3 MB/s  | 785.0 us |   2.0 ms | 640.0 us | 625.0 us |  64.0 KB |  64.0 KB  |    686.0 us    |     561.0 us    |
|3300 | 0xc80001  | 0xed0001  |  1        | 2060 | 2149  | 128.8 MB/s | 134.3 MB/s  | 764.0 us |   1.9 ms | 621.0 us | 596.0 us |  64.0 KB |  64.0 KB  |    649.0 us    |     537.0 us    |
|3300 | 0xc80000  | 0xed0000  |  1        | 333  | 364   |  20.8 MB/s |  22.8 MB/s  |  14.8 ms |  16.1 ms |  14.6 ms |  15.3 ms |  64.0 KB |  64.0 KB  |    190.0 us    |     521.0 us    |
|3300 | 0xc80008  | 0xed0008  |  1        | 2483 | 2503  | 155.2 MB/s | 156.4 MB/s  | 771.0 us |   2.0 ms | 626.0 us | 639.0 us |  64.0 KB |  64.0 KB  |    685.0 us    |     571.0 us    |
|3300 | 0xc80009  | 0xed0009  |  1        | 2545 | 2474  | 159.1 MB/s | 154.6 MB/s  | 786.0 us |   2.0 ms | 641.0 us | 627.0 us |  64.0 KB |  64.0 KB  |    683.0 us    |     570.0 us    |
|3300 | 0xc80004  | 0xed0004  |  1        | 2506 | 2498  | 156.6 MB/s | 156.1 MB/s  | 769.0 us |   2.0 ms | 625.0 us | 642.0 us |  64.0 KB |  64.0 KB  |    680.0 us    |     575.0 us    |
|3300 | 0xc80006  | 0xed0006  |  1        | 2456 | 2512  | 153.5 MB/s | 157.0 MB/s  | 793.0 us |   2.0 ms | 650.0 us | 624.0 us |  64.0 KB |  64.0 KB  |    696.0 us    |     558.0 us    |
|3300 | 0xc80000  | 0xed0001  |  1        | 1926 | 1848  | 120.4 MB/s | 115.5 MB/s  | 734.0 us |   1.8 ms | 593.0 us | 572.0 us |  64.0 KB |  64.0 KB  |    533.0 us    |     512.0 us    |
|3300 | 0xc80003  | 0xed0003  |  1        | 2553 | 2472  | 159.6 MB/s | 154.5 MB/s  | 786.0 us |   2.0 ms | 641.0 us | 622.0 us |  64.0 KB |  64.0 KB  |    691.0 us    |     560.0 us    |
+-----------------------------------------+--------------+--------------------------+---------------------+---------------------+----------------------+----------------+-----------------+
Total number of ITNs: 11

次に、SCSI のイニシエータのフロー メトリックの表示方法の例を示します:


switch# ShowAnalytics --info --initiator-itl
2021-02-09 09:01:39.714290

Interface fc2/22
+----------------------------------------------------------+--------------+--------------------------+--------------------+--------------------+----------------------+----------------+-----------------+
|VSAN | Initiator | VMID |  Target   |         LUN         |   Avg IOPS   |      Avg Throughput      |      Avg ECT       |      Avg DAL       |     Avg IO Size      | Avg Host Delay | Avg Array Delay |
+----------------------------------------------------------+--------------+--------------------------+--------------------+--------------------+----------------------+----------------+-----------------+
|                                                          | Read | Write |     Read   |   Write     |  Read   |   Write  |  Read   |   Write  |   Read   |   Write   |     Write      |      Write      |
|                                                          |              |                          |                    |                    |                      |                |                 |
|2200 | 0xe80ee0  |   - | 0xc809a0  | 0001-0000-0000-0000  |    0 | 0     |      0 B/s |    0 B/s    |   0 ns  |    0 ns  |   0 ns  |    0 ns  |      0 B |    0 B    |      0 ns      |       0 ns      |
|2200 | 0xe80ee0  |   - | 0xe80622  | 0007-0000-0000-0000  |    0 | 0     |      0 B/s |    0 B/s    |   0 ns  |    0 ns  |   0 ns  |    0 ns  |      0 B |    0 B    |      0 ns      |       0 ns      |
|2200 | 0xe80ee0  |   - | 0xc809a0  | 0002-0000-0000-0000  |    0 | 0     |      0 B/s |    0 B/s    |   0 ns  |    0 ns  |   0 ns  |    0 ns  |      0 B |    0 B    |      0 ns      |       0 ns      |
|2200 | 0xe80ee0  |   - | 0xc809a0  | 0003-0000-0000-0000  |    0 | 0     |      0 B/s |    0 B/s    |   0 ns  |    0 ns  |   0 ns  |    0 ns  |      0 B |    0 B    |      0 ns      |       0 ns      |
|2200 | 0xe80ee0  |   - | 0xe80622  | 0002-0000-0000-0000  |    0 | 0     |      0 B/s |    0 B/s    |   0 ns  |    0 ns  |   0 ns  |    0 ns  |      0 B |    0 B    |      0 ns      |       0 ns      |
|2200 | 0xe80ee0  |  18 | 0xc809a0  | 0003-0000-0000-0000  |    0 | 5     |      0 B/s |  21.0 KB/s  |   0 ns  | 702.0 us |   0 ns  | 251.0 us |      0 B |  4.2 KB   |     7.0 us     |     441.0 us    |
|2200 | 0xe80ee0  |   - | 0xe80623  | 0004-0000-0000-0000  |    0 | 0     |      0 B/s |    0 B/s    |   0 ns  |    0 ns  |   0 ns  |    0 ns  |      0 B |    0 B    |      0 ns      |       0 ns      |
|2200 | 0xe80ee0  |   - | 0xe80622  | 0000-0000-0000-0000  |    0 | 0     |      0 B/s |    0 B/s    |   0 ns  |    0 ns  |   0 ns  |    0 ns  |      0 B |    0 B    |      0 ns      |       0 ns      |
+----------------------------------------------------------+--------------+--------------------------+--------------------+--------------------+----------------------+----------------+-----------------+
Total number of ITLs: 8

次に、NVMe のターゲットのフロー メトリックの表示方法の例を示します:


switch# ShowAnalytics --info --target-itn
2021-02-09 12:14:59.285397

Interface fc3/15
+-----------------------------------------+--------------+--------------------------+---------------------+--------------------+----------------------+----------------+-----------------+
|VSAN | Initiator |  Target   | Namespace |   Avg IOPS   |      Avg Throughput      |       Avg ECT       |      Avg DAL       |     Avg IO Size      | Avg Host Delay | Avg Array Delay |
+-----------------------------------------+--------------+--------------------------+---------------------+--------------------+----------------------+----------------+-----------------+
|                                         | Read | Write |     Read   |   Write     |   Read   |   Write  |  Read   |   Write  |   Read   |   Write   |     Write      |      Write      |
|                                         |              |                          |                     |                    |                      |                |                 |
|3300 | 0xc80005  | 0xed0005  |  1        | 2545 | 2457  | 159.1 MB/s | 153.6 MB/s  | 112.0 us |   1.5 ms | 44.0 us |  40.0 us |  64.0 KB |  64.0 KB  |     1.3 ms     |      5.0 us     |
|3300 | 0xc80000  | 0xed0001  |  1        | 2036 | 2026  | 127.3 MB/s | 126.6 MB/s  | 110.0 us |   1.3 ms | 44.0 us |  39.0 us |  64.0 KB |  64.0 KB  |     1.1 ms     |      5.0 us     |
|3300 | 0xc80004  | 0xed0004  |  1        | 2464 | 2492  | 154.0 MB/s | 155.8 MB/s  | 113.0 us |   1.5 ms | 45.0 us |  40.0 us |  64.0 KB |  64.0 KB  |     1.3 ms     |      5.0 us     |
|3300 | 0xc80001  | 0xed0001  |  1        | 2036 | 2020  | 127.2 MB/s | 126.2 MB/s  | 112.0 us |   1.3 ms | 44.0 us |  40.0 us |  64.0 KB |  64.0 KB  |     1.1 ms     |      5.0 us     |
|3300 | 0xc80003  | 0xed0003  |  1        | 2460 | 2491  | 153.8 MB/s | 155.7 MB/s  | 114.0 us |   1.5 ms | 45.0 us |  39.0 us |  64.0 KB |  64.0 KB  |     1.3 ms     |      5.0 us     |
|3300 | 0xc80000  | 0xed0000  |  1        | 335  | 360   |  20.9 MB/s |  22.5 MB/s  |  14.1 ms |  15.6 ms | 14.1 ms |  14.7 ms |  64.0 KB |  64.0 KB  |    784.0 us    |      5.0 us     |
|3300 | 0xc80007  | 0xed0007  |  1        | 2476 | 2488  | 154.8 MB/s | 155.5 MB/s  | 114.0 us |   1.5 ms | 46.0 us |  39.0 us |  64.0 KB |  64.0 KB  |     1.3 ms     |      5.0 us     |
|3300 | 0xc80008  | 0xed0008  |  1        | 2484 | 2489  | 155.3 MB/s | 155.6 MB/s  | 114.0 us |   1.5 ms | 46.0 us |  40.0 us |  64.0 KB |  64.0 KB  |     1.3 ms     |      5.0 us     |
|3300 | 0xc80002  | 0xed0002  |  1        | 2472 | 2490  | 154.5 MB/s | 155.6 MB/s  | 112.0 us |   1.5 ms | 45.0 us |  40.0 us |  64.0 KB |  64.0 KB  |     1.3 ms     |      5.0 us     |
|3300 | 0xc80006  | 0xed0006  |  1        | 2449 | 2507  | 153.1 MB/s | 156.7 MB/s  | 116.0 us |   1.5 ms | 46.0 us |  39.0 us |  64.0 KB |  64.0 KB  |     1.3 ms     |      5.0 us     |
|3300 | 0xc80009  | 0xed0009  |  1        | 2471 | 2485  | 154.4 MB/s | 155.3 MB/s  | 114.0 us |   1.5 ms | 45.0 us |  40.0 us |  64.0 KB |  64.0 KB  |     1.3 ms     |      5.0 us     |
+-----------------------------------------+--------------+--------------------------+---------------------+--------------------+----------------------+----------------+-----------------+
Total number of ITNs: 11

次に、SCSI のターゲットのフロー メトリックの表示方法の例を示します:


switch# ShowAnalytics --info --target-itl
2021-02-09 12:14:59.285397

Interface fc5/21
+----------------------------------------------------------+--------------+--------------------------+--------------------+--------------------+----------------------+----------------+-----------------+
|VSAN | Initiator | VMID |  Target   |         LUN         |   Avg IOPS   |      Avg Throughput      |      Avg ECT       |      Avg DAL       |     Avg IO Size      | Avg Host Delay | Avg Array Delay |
+----------------------------------------------------------+--------------+--------------------------+--------------------+--------------------+----------------------+----------------+-----------------+
|                                                          | Read | Write |     Read   |   Write     |  Read   |   Write  |  Read   |   Write  |   Read   |   Write   |     Write      |      Write      |
|                                                          |              |                          |                    |                    |                      |                |                 |
|2200 | 0xe902e0  |   - | 0xe805a0  | 0002-0000-0000-0000  |  0   | 9236  |      0 B/s |  4.5 MB/s   |   0 ns  |  75.0 us |   0 ns  |  25.0 us |      0 B |  512.0 B  |      0 ns      |       0 ns      |
|2200 | 0xe902e0  |   - | 0xe805a0  | 0003-0000-0000-0000  |  0   | 9235  |      0 B/s |  4.5 MB/s   |   0 ns  |  75.0 us |   0 ns  |  25.0 us |      0 B |  511.0 B  |      0 ns      |       0 ns      |
|2200 | 0xe902e0  |   - | 0xe805a0  | 0001-0000-0000-0000  |  0   | 9235  |      0 B/s |  4.5 MB/s   |   0 ns  |  75.0 us |   0 ns  |  25.0 us |      0 B |  512.0 B  |      0 ns      |       0 ns      |
+----------------------------------------------------------+--------------+--------------------------+--------------------+--------------------+----------------------+----------------+-----------------+
Total number of ITLs: 3

次の例は、すべてのターゲット ITN を表示し、出力を NVMe の 5 つのランダム レコードに制限する方法を示しています。


switch# ShowAnalytics --info --target-itn --interface fc8/15 --limit 5
2019-04-09 11:11:24.652190
 
  Interface fc3/15
+-----------------------------------------+--------------+--------------------------+---------------------+--------------------+----------------------+----------------+-----------------+
|VSAN | Initiator |  Target   | Namespace |   Avg IOPS   |      Avg Throughput      |       Avg ECT       |      Avg DAL       |     Avg IO Size      | Avg Host Delay | Avg Array Delay |
+-----------------------------------------+--------------+--------------------------+---------------------+--------------------+----------------------+----------------+-----------------+
|                                         | Read | Write |     Read   |   Write     |   Read   |   Write  |  Read   |   Write  |   Read   |   Write   |     Write      |      Write      |
|                                         |              |                          |                     |                    |                      |                |                 |
|3300 | 0xc80005  | 0xed0005  |  1        | 2396 | 2473  | 149.8 MB/s | 154.6 MB/s  | 111.0 us |   1.5 ms | 45.0 us |  40.0 us |  64.0 KB |  64.0 KB  |     1.3 ms     |      5.0 us     |
|3300 | 0xc80000  | 0xed0001  |  1        | 2180 | 2250  | 136.3 MB/s | 140.7 MB/s  | 110.0 us |   1.2 ms | 43.0 us |  39.0 us |  64.0 KB |  64.0 KB  |     1.1 ms     |      5.0 us     |
|3300 | 0xc80004  | 0xed0004  |  1        | 2424 | 2463  | 151.5 MB/s | 154.0 MB/s  | 114.0 us |   1.5 ms | 46.0 us |  39.0 us |  64.0 KB |  64.0 KB  |     1.3 ms     |      5.0 us     |
|3300 | 0xc80001  | 0xed0001  |  1        | 2129 | 2202  | 133.1 MB/s | 137.6 MB/s  | 110.0 us |   1.2 ms | 43.0 us |  37.0 us |  64.0 KB |  64.0 KB  |    992.0 us    |      5.0 us     |
|3300 | 0xc80003  | 0xed0003  |  1        | 2457 | 2462  | 153.6 MB/s | 153.9 MB/s  | 114.0 us |   1.5 ms | 46.0 us |  38.0 us |  64.0 KB |  64.0 KB  |     1.3 ms     |      5.0 us     |
+-----------------------------------------+--------------+--------------------------+---------------------+--------------------+----------------------+----------------+-----------------+
Total number of ITNs: 5

次の例は、すべてのターゲット ITL を表示し、SCSI の出力を 10 のランダム レコードに制限する方法を示しています。


switch# ShowAnalytics --info --target-itl --interface fc8/15 --limit 10
2019-04-09 11:11:24.652190
 
 Interface fc5/21
+----------------------------------------------------------+--------------+--------------------------+--------------------+--------------------+----------------------+----------------+-----------------+
|VSAN | Initiator | VMID |  Target   |         LUN         |   Avg IOPS   |      Avg Throughput      |      Avg ECT       |      Avg DAL       |     Avg IO Size      | Avg Host Delay | Avg Array Delay |
+----------------------------------------------------------+--------------+--------------------------+--------------------+--------------------+----------------------+----------------+-----------------+
|                                                          | Read | Write |     Read   |   Write     |  Read   |   Write  |  Read   |   Write  |   Read   |   Write   |     Write      |      Write      |
|                                                          |              |                          |                    |                    |                      |                |                 |
|2200 | 0xe902e0  |   - | 0xe805a0  | 0002-0000-0000-0000  |  0   | 9235  |      0 B/s |  4.5 MB/s   |   0 ns  |  75.0 us |   0 ns  |  25.0 us |      0 B |  512.0 B  |      0 ns      |       0 ns      |
|2200 | 0xe902e0  |   - | 0xe805a0  | 0003-0000-0000-0000  |  0   | 9235  |      0 B/s |  4.5 MB/s   |   0 ns  |  75.0 us |   0 ns  |  25.0 us |      0 B |  512.0 B  |      0 ns      |       0 ns      |
|2200 | 0xe902e0  |   - | 0xe805a0  | 0001-0000-0000-0000  |  0   | 9235  |      0 B/s |  4.5 MB/s   |   0 ns  |  75.0 us |   0 ns  |  25.0 us |      0 B |  512.0 B  |      0 ns      |       0 ns      |
+----------------------------------------------------------+--------------+--------------------------+--------------------+--------------------+----------------------+----------------+-----------------+
Total number of ITLs: 3

次に、NVMe のイニシエータ ITN の VSAN 3300 に関するフロー メトリックの表示方法の例を示します:


switch# ShowAnalytics --info --initiator-itn --vsan 3300
2019-04-08 11:26:23.074904
 
Interface fc16/12
+-----------------------------------------+--------------+--------------------------+---------------------+---------------------+----------------------+----------------+-----------------+
|VSAN | Initiator |  Target   | Namespace |   Avg IOPS   |      Avg Throughput      |       Avg ECT       |       Avg DAL       |     Avg IO Size      | Avg Host Delay | Avg Array Delay |
+-----------------------------------------+--------------+--------------------------+---------------------+---------------------+----------------------+----------------+-----------------+
|                                         | Read | Write |     Read   |   Write     |   Read   |   Write  |   Read   |   Write  |   Read   |   Write   |     Write      |      Write      |
|                                         |              |                          |                     |                     |                      |                |                 |
|3300 | 0xc80002  | 0xed0002  |  1        | 2466 | 2458  | 154.2 MB/s | 153.6 MB/s  | 782.0 us |   2.1 ms | 635.0 us | 620.0 us |  64.0 KB |  64.0 KB  |    714.0 us    |     567.0 us    |
|3300 | 0xc80007  | 0xed0007  |  1        | 2466 | 2470  | 154.1 MB/s | 154.4 MB/s  | 786.0 us |   2.0 ms | 641.0 us | 620.0 us |  64.0 KB |  64.0 KB  |    712.0 us    |     561.0 us    |
|3300 | 0xc80005  | 0xed0005  |  1        | 2432 | 2484  | 152.0 MB/s | 155.3 MB/s  | 775.0 us |   2.1 ms | 629.0 us | 623.0 us |  64.0 KB |  64.0 KB  |    714.0 us    |     564.0 us    |
|3300 | 0xc80001  | 0xed0001  |  1        | 2066 | 2031  | 129.2 MB/s | 126.9 MB/s  | 723.0 us |   1.7 ms | 580.0 us | 569.0 us |  64.0 KB |  64.0 KB  |    470.0 us    |     507.0 us    |
|3300 | 0xc80000  | 0xed0000  |  1        | 339  | 347   |  21.2 MB/s |  21.7 MB/s  |  15.3 ms |  16.1 ms |  15.2 ms |  15.2 ms |  64.0 KB |  64.0 KB  |    190.0 us    |     518.0 us    |
|3300 | 0xc80008  | 0xed0008  |  1        | 2436 | 2480  | 152.2 MB/s | 155.0 MB/s  | 777.0 us |   2.0 ms | 632.0 us | 623.0 us |  64.0 KB |  64.0 KB  |    708.0 us    |     563.0 us    |
|3300 | 0xc80009  | 0xed0009  |  1        | 2475 | 2459  | 154.7 MB/s | 153.7 MB/s  | 772.0 us |   2.1 ms | 625.0 us | 630.0 us |  64.0 KB |  64.0 KB  |    700.0 us    |     569.0 us    |
|3300 | 0xc80004  | 0xed0004  |  1        | 2508 | 2448  | 156.8 MB/s | 153.0 MB/s  | 775.0 us |   2.0 ms | 630.0 us | 626.0 us |  64.0 KB |  64.0 KB  |    704.0 us    |     568.0 us    |
|3300 | 0xc80006  | 0xed0006  |  1        | 2427 | 2485  | 151.7 MB/s | 155.3 MB/s  | 778.0 us |   2.0 ms | 634.0 us | 623.0 us |  64.0 KB |  64.0 KB  |    713.0 us    |     561.0 us    |
|3300 | 0xc80000  | 0xed0001  |  1        | 2246 | 2218  | 140.4 MB/s | 138.7 MB/s  | 744.0 us |   1.8 ms | 600.0 us | 591.0 us |  64.0 KB |  64.0 KB  |    561.0 us    |     530.0 us    |
|3300 | 0xc80003  | 0xed0003  |  1        | 2439 | 2478  | 152.4 MB/s | 154.9 MB/s  | 776.0 us |   2.1 ms | 630.0 us | 628.0 us |  64.0 KB |  64.0 KB  |    711.0 us    |     564.0 us    |
+-----------------------------------------+--------------+--------------------------+---------------------+---------------------+----------------------+----------------+-----------------+
Total number of ITNs: 11

次に、SCSI のイニシエータ ITL の VSAN 2200 に関するフロー メトリックの表示方法の例を示します:


switch# ShowAnalytics --info --initiator-itl --vsan 2200
2019-04-08 11:26:23.074904
 
Interface fc2/22
+----------------------------------------------------------+--------------+--------------------------+--------------------+--------------------+----------------------+----------------+-----------------+
|VSAN | Initiator | VMID |  Target   |         LUN         |   Avg IOPS   |      Avg Throughput      |      Avg ECT       |      Avg DAL       |     Avg IO Size      | Avg Host Delay | Avg Array Delay |
+----------------------------------------------------------+--------------+--------------------------+--------------------+--------------------+----------------------+----------------+-----------------+
|                                                          | Read | Write |     Read   |   Write     |  Read   |   Write  |  Read   |   Write  |   Read   |   Write   |     Write      |      Write      |
|                                                          |              |                          |                    |                    |                      |                |                 |
|2200 | 0xe80ee0  |   - | 0xe80622  | 0007-0000-0000-0000  |    0 | 0     |      0 B/s |    0 B/s    |   0 ns  |    0 ns  |   0 ns  |    0 ns  |      0 B |    0 B    |      0 ns      |       0 ns      |
|2200 | 0xe80ee0  |   - | 0xc809a0  | 0003-0000-0000-0000  |    0 | 0     |      0 B/s |    0 B/s    |   0 ns  |    0 ns  |   0 ns  |    0 ns  |      0 B |    0 B    |      0 ns      |       0 ns      |
|2200 | 0xe80ee0  |   - | 0xe80622  | 0002-0000-0000-0000  |    0 | 0     |      0 B/s |    0 B/s    |   0 ns  |    0 ns  |   0 ns  |    0 ns  |      0 B |    0 B    |      0 ns      |       0 ns      |
|2200 | 0xe80ee0  |  18 | 0xc809a0  | 0003-0000-0000-0000  |    0 | 0     |      0 B/s |  2.0 KB/s   |   0 ns  | 843.0 us |   0 ns  | 179.0 us |      0 B |  4.0 KB   |     7.0 us     |     656.0 us    |
|2200 | 0xe80ee0  |   - | 0xe80622  | 0000-0000-0000-0000  |    0 | 0     |      0 B/s |    0 B/s    |   0 ns  |    0 ns  |   0 ns  |    0 ns  |      0 B |    0 B    |      0 ns      |       0 ns      |
+----------------------------------------------------------+--------------+--------------------------+--------------------+--------------------+----------------------+----------------+-----------------+
Total number of ITLs: 5

次に、NVMe のターゲット ITN のインターフェイス fc3/15 に関するフロー メトリックの表示方法の例を示します:


switch# ShowAnalytics --info --target-itn --interface fc3/15
2019-04-09 11:11:17.974991
 
 Interface fc3/15
+-----------------------------------------+--------------+--------------------------+---------------------+--------------------+----------------------+----------------+-----------------+
|VSAN | Initiator |  Target   | Namespace |   Avg IOPS   |      Avg Throughput      |       Avg ECT       |      Avg DAL       |     Avg IO Size      | Avg Host Delay | Avg Array Delay |
+-----------------------------------------+--------------+--------------------------+---------------------+--------------------+----------------------+----------------+-----------------+
|                                         | Read | Write |     Read   |   Write     |   Read   |   Write  |  Read   |   Write  |   Read   |   Write   |     Write      |      Write      |
|                                         |              |                          |                     |                    |                      |                |                 |
|3300 | 0xc80005  | 0xed0005  |  1        | 2475 | 2531  | 154.7 MB/s | 158.2 MB/s  | 112.0 us |   1.5 ms | 45.0 us |  40.0 us |  64.0 KB |  64.0 KB  |     1.3 ms     |      5.0 us     |
|3300 | 0xc80000  | 0xed0001  |  1        | 2137 | 2158  | 133.6 MB/s | 134.9 MB/s  | 112.0 us |   1.4 ms | 46.0 us |  39.0 us |  64.0 KB |  64.0 KB  |     1.2 ms     |      5.0 us     |
|3300 | 0xc80004  | 0xed0004  |  1        | 2465 | 2530  | 154.1 MB/s | 158.2 MB/s  | 115.0 us |   1.5 ms | 46.0 us |  39.0 us |  64.0 KB |  64.0 KB  |     1.3 ms     |      5.0 us     |
|3300 | 0xc80001  | 0xed0001  |  1        | 1785 | 1796  | 111.6 MB/s | 112.2 MB/s  | 112.0 us |   1.3 ms | 45.0 us |  38.0 us |  64.0 KB |  64.0 KB  |     1.1 ms     |      5.0 us     |
|3300 | 0xc80003  | 0xed0003  |  1        | 2512 | 2506  | 157.0 MB/s | 156.6 MB/s  | 113.0 us |   1.5 ms | 45.0 us |  40.0 us |  64.0 KB |  64.0 KB  |     1.3 ms     |      5.0 us     |
|3300 | 0xc80000  | 0xed0000  |  1        | 355  | 329   |  22.2 MB/s |  20.6 MB/s  |  14.8 ms |  15.5 ms | 14.8 ms |  14.6 ms |  64.0 KB |  64.0 KB  |    753.0 us    |      5.0 us     |
|3300 | 0xc80007  | 0xed0007  |  1        | 2465 | 2532  | 154.1 MB/s | 158.2 MB/s  | 115.0 us |   1.5 ms | 47.0 us |  40.0 us |  64.0 KB |  64.0 KB  |     1.3 ms     |      5.0 us     |
|3300 | 0xc80008  | 0xed0008  |  1        | 2488 | 2520  | 155.5 MB/s | 157.5 MB/s  | 115.0 us |   1.5 ms | 47.0 us |  40.0 us |  64.0 KB |  64.0 KB  |     1.3 ms     |      5.0 us     |
|3300 | 0xc80002  | 0xed0002  |  1        | 2548 | 2497  | 159.3 MB/s | 156.1 MB/s  | 113.0 us |   1.5 ms | 46.0 us |  40.0 us |  64.0 KB |  64.0 KB  |     1.3 ms     |      5.0 us     |
|3300 | 0xc80006  | 0xed0006  |  1        | 2476 | 2523  | 154.8 MB/s | 157.7 MB/s  | 113.0 us |   1.5 ms | 46.0 us |  40.0 us |  64.0 KB |  64.0 KB  |     1.3 ms     |      5.0 us     |
|3300 | 0xc80009  | 0xed0009  |  1        | 2487 | 2525  | 155.4 MB/s | 157.8 MB/s  | 114.0 us |   1.5 ms | 46.0 us |  40.0 us |  64.0 KB |  64.0 KB  |     1.3 ms     |      5.0 us     |
+-----------------------------------------+--------------+--------------------------+---------------------+--------------------+----------------------+----------------+-----------------+
Total number of ITNs: 11

次に、SCSI のターゲット ITL のインターフェイス fc3/15 に関するフロー メトリックの表示方法の例を示します:


switch# ShowAnalytics --info --target-itl --interface fc5/21
2019-04-09 11:11:17.974991

  Interface fc5/21
+----------------------------------------------------------+--------------+--------------------------+--------------------+--------------------+----------------------+----------------+-----------------+
|VSAN | Initiator | VMID |  Target   |         LUN         |   Avg IOPS   |      Avg Throughput      |      Avg ECT       |      Avg DAL       |     Avg IO Size      | Avg Host Delay | Avg Array Delay |
+----------------------------------------------------------+--------------+--------------------------+--------------------+--------------------+----------------------+----------------+-----------------+
|                                                          | Read | Write |     Read   |   Write     |  Read   |   Write  |  Read   |   Write  |   Read   |   Write   |     Write      |      Write      |
|                                                          |              |                          |                    |                    |                      |                |                 |
|2200 | 0xe902e0  |   - | 0xe805a0  | 0002-0000-0000-0000  |  0   | 9231  |      0 B/s |  4.5 MB/s   |   0 ns  |  75.0 us |   0 ns  |  25.0 us |      0 B |  512.0 B  |      0 ns      |       0 ns      |
|2200 | 0xe902e0  |   - | 0xe805a0  | 0003-0000-0000-0000  |  0   | 9231  |      0 B/s |  4.5 MB/s   |   0 ns  |  75.0 us |   0 ns  |  25.0 us |      0 B |  512.0 B  |      0 ns      |       0 ns      |
|2200 | 0xe902e0  |   - | 0xe805a0  | 0001-0000-0000-0000  |  0   | 9230  |      0 B/s |  4.5 MB/s   |   0 ns  |  75.0 us |   0 ns  |  25.0 us |      0 B |  512.0 B  |      0 ns      |       0 ns      |
+----------------------------------------------------------+--------------+--------------------------+--------------------+--------------------+----------------------+----------------+-----------------+
Total number of ITLs: 3

次に、NVMe のターゲット ITN のインターフェイス fc3/15 に関するフロー メトリックとデバイス エイリアス情報と NVMe の出力を 10 のランダム レコードに制限するの表示方法の例を示します:


switch# ShowAnalytics --info --target-itn --alias  --interface fc3/15  --limit 10
2019-04-09 12:04:07.032501

 Interface fc3/15
+---------------------------------------------------------------+--------------+--------------------------+---------------------+--------------------+----------------------+----------------+-----------------+
|VSAN |      Initiator       |        Target        | Namespace |   Avg IOPS   |      Avg Throughput      |       Avg ECT       |      Avg DAL       |     Avg IO Size      | Avg Host Delay | Avg Array Delay |
+---------------------------------------------------------------+--------------+--------------------------+---------------------+--------------------+----------------------+----------------+-----------------+
|                                                               | Read | Write |     Read   |   Write     |   Read   |   Write  |  Read   |   Write  |   Read   |   Write   |     Write      |      Write      |
|                                                               |              |                          |                     |                    |                      |                |                 |
|3300 |       0xc80005       |       0xed0005       |  1        | 2488 | 2514  | 155.5 MB/s | 157.1 MB/s  | 113.0 us |   1.5 ms | 46.0 us |  39.0 us |  64.0 KB |  64.0 KB  |     1.3 ms     |      5.0 us     |
|3300 |       0xc80000       |       0xed0001       |  1        | 2122 | 2154  | 132.6 MB/s | 134.7 MB/s  | 111.0 us |   1.4 ms | 45.0 us |  40.0 us |  64.0 KB |  64.0 KB  |     1.2 ms     |      5.0 us     |
|3300 |       0xc80004       |       0xed0004       |  1        | 2492 | 2509  | 155.8 MB/s | 156.8 MB/s  | 113.0 us |   1.5 ms | 46.0 us |  40.0 us |  64.0 KB |  64.0 KB  |     1.3 ms     |      5.0 us     |
|3300 |       0xc80001       |       0xed0001       |  1        | 1847 | 1752  | 115.4 MB/s | 109.5 MB/s  | 112.0 us |   1.3 ms | 45.0 us |  39.0 us |  64.0 KB |  64.0 KB  |     1.1 ms     |      5.0 us     |
|3300 |       0xc80003       |       0xed0003       |  1        | 2523 | 2495  | 157.7 MB/s | 155.9 MB/s  | 114.0 us |   1.5 ms | 46.0 us |  41.0 us |  64.0 KB |  64.0 KB  |     1.3 ms     |      5.0 us     |
|3300 |       0xc80000       |       0xed0000       |  1        | 340  | 355   |  21.3 MB/s |  22.2 MB/s  |  14.3 ms |  15.3 ms | 14.2 ms |  14.4 ms |  64.0 KB |  64.0 KB  |    801.0 us    |      5.0 us     |
|3300 |       0xc80007       |       0xed0007       |  1        | 2495 | 2510  | 156.0 MB/s | 156.9 MB/s  | 114.0 us |   1.5 ms | 47.0 us |  40.0 us |  64.0 KB |  64.0 KB  |     1.3 ms     |      5.0 us     |
|3300 |       0xc80008       |       0xed0008       |  1        | 2515 | 2496  | 157.2 MB/s | 156.0 MB/s  | 114.0 us |   1.5 ms | 47.0 us |  40.0 us |  64.0 KB |  64.0 KB  |     1.3 ms     |      5.0 us     |
|3300 |       0xc80002       |       0xed0002       |  1        | 2537 | 2484  | 158.6 MB/s | 155.3 MB/s  | 114.0 us |   1.5 ms | 46.0 us |  41.0 us |  64.0 KB |  64.0 KB  |     1.3 ms     |      5.0 us     |
|3300 |       0xc80006       |       0xed0006       |  1        | 2502 | 2510  | 156.4 MB/s | 156.9 MB/s  | 113.0 us |   1.5 ms | 46.0 us |  41.0 us |  64.0 KB |  64.0 KB  |     1.3 ms     |      5.0 us     |
+---------------------------------------------------------------+--------------+--------------------------+---------------------+--------------------+----------------------+----------------+-----------------+
Total number of ITNs: 10

次に、SCSI のターゲット ITL のインターフェイス fc5/21 に関するフロー メトリックとデバイス エイリアス情報と SCSI の出力を 10 のランダム レコードに制限するの表示方法の例を示します:


switch# ShowAnalytics --info --target-itl --alias  --interface fc5/21  --limit 10
2019-04-09 12:04:07.032501

 Interface fc5/21
+--------------------------------------------------------------------------------+--------------+--------------------------+--------------------+--------------------+----------------------+----------------+-----------------+
|VSAN |      Initiator       | VMID |        Target        |         LUN         |   Avg IOPS   |      Avg Throughput      |      Avg ECT       |      Avg DAL       |     Avg IO Size      | Avg Host Delay | Avg Array Delay |
+--------------------------------------------------------------------------------+--------------+--------------------------+--------------------+--------------------+----------------------+----------------+-----------------+
|                                                                                | Read | Write |     Read   |   Write     |  Read   |   Write  |  Read   |   Write  |   Read   |   Write   |     Write      |      Write      |
|                                                                                |              |                          |                    |                    |                      |                |                 |
|2200 |       0xe902e0       |   - | Tgt_9706_206_fc5_21_ | 0002-0000-0000-0000  |  0   | 5796  |      0 B/s |  2.8 MB/s   |   0 ns  |  84.0 us |   0 ns  |  29.0 us |      0 B |  512.0 B  |      0 ns      |       0 ns      |
|2200 |       0xe902e0       |   - | Tgt_9706_206_fc5_21_ | 0003-0000-0000-0000  |  0   | 5797  |      0 B/s |  2.8 MB/s   |   0 ns  |  84.0 us |   0 ns  |  29.0 us |      0 B |  512.0 B  |      0 ns      |       0 ns      |
|2200 |       0xe902e0       |   - | Tgt_9706_206_fc5_21_ | 0001-0000-0000-0000  |  0   | 5797  |      0 B/s |  2.8 MB/s   |   0 ns  |  84.0 us |   0 ns  |  29.0 us |      0 B |  512.0 B  |      0 ns      |       0 ns      |
|2200 |       0xe90440       |   - | Tgt_9706_206_fc5_21_ | 0001-0000-0000-0000  |  0   | 5797  |      0 B/s |  2.8 MB/s   |   0 ns  | 122.0 us |   0 ns  |  44.0 us |      0 B |  512.0 B  |      0 ns      |       0 ns      |
|2200 |       0xe90440       |   - | Tgt_9706_206_fc5_21_ | 0002-0000-0000-0000  |  0   | 5796  |      0 B/s |  2.8 MB/s   |   0 ns  | 124.0 us |   0 ns  |  44.0 us |      0 B |  512.0 B  |      0 ns      |       0 ns      |
|2200 |       0xe906c0       |   - | Tgt_9706_206_fc5_21_ | 0001-0000-0000-0000  |  0   | 5797  |      0 B/s |  2.8 MB/s   |   0 ns  | 130.0 us |   0 ns  |  47.0 us |      0 B |  512.0 B  |      0 ns      |       0 ns      |
|2200 |       0xe906c0       |   - | Tgt_9706_206_fc5_21_ | 0002-0000-0000-0000  |  0   | 5796  |      0 B/s |  2.8 MB/s   |   0 ns  | 131.0 us |   0 ns  |  48.0 us |      0 B |  512.0 B  |      0 ns      |       0 ns      |
+--------------------------------------------------------------------------------+--------------+--------------------------+--------------------+--------------------+----------------------+----------------+-----------------+
Total number of ITLs: 7

次に、NVMe のターゲット ITN のターゲット識別子 0xed0001 に関するフロー メトリックの表示方法の例を示します:


switch# ShowAnalytics --info --target-itn --target 0xed0001
2019-04-09 11:16:26.246741
 
 Interface fc3/15
+-----------------------------------------+--------------+--------------------------+---------------------+--------------------+----------------------+----------------+-----------------+
|VSAN | Initiator |  Target   | Namespace |   Avg IOPS   |      Avg Throughput      |       Avg ECT       |      Avg DAL       |     Avg IO Size      | Avg Host Delay | Avg Array Delay |
+-----------------------------------------+--------------+--------------------------+---------------------+--------------------+----------------------+----------------+-----------------+
|                                         | Read | Write |     Read   |   Write     |   Read   |   Write  |  Read   |   Write  |   Read   |   Write   |     Write      |      Write      |
|                                         |              |                          |                     |                    |                      |                |                 |
|3300 | 0xc80000  | 0xed0001  |  1        | 2100 | 2173  | 131.2 MB/s | 135.8 MB/s  | 110.0 us |   1.4 ms | 44.0 us |  38.0 us |  64.0 KB |  64.0 KB  |     1.2 ms     |      5.0 us     |
|3300 | 0xc80001  | 0xed0001  |  1        | 1964 | 1943  | 122.8 MB/s | 121.4 MB/s  | 109.0 us |   1.2 ms | 43.0 us |  38.0 us |  64.0 KB |  64.0 KB  |     1.0 ms     |      5.0 us     |
+-----------------------------------------+--------------+--------------------------+---------------------+--------------------+----------------------+----------------+-----------------+
Total number of ITNs: 2

次に、SCSI のターゲット ITL のターゲット識別子 0xe80b40 に関するフロー メトリックの表示方法の例を示します:


switch# ShowAnalytics --info --target-itl --target 0xe80b40
2019-04-09 11:16:26.246741
 
 Interface fc5/21
+----------------------------------------------------------+--------------+--------------------------+--------------------+--------------------+----------------------+----------------+-----------------+
|VSAN | Initiator | VMID |  Target   |         LUN         |   Avg IOPS   |      Avg Throughput      |      Avg ECT       |      Avg DAL       |     Avg IO Size      | Avg Host Delay | Avg Array Delay |
+----------------------------------------------------------+--------------+--------------------------+--------------------+--------------------+----------------------+----------------+-----------------+
|                                                          | Read | Write |     Read   |   Write     |  Read   |   Write  |  Read   |   Write  |   Read   |   Write   |     Write      |      Write      |
|                                                          |              |                          |                    |                    |                      |                |                 |
|2200 | 0xe90440  |   - | 0xe80b40  | 0001-0000-0000-0000  |  0   | 5809  |      0 B/s |  2.8 MB/s   |   0 ns  | 128.0 us |   0 ns  |  48.0 us |      0 B |  512.0 B  |      0 ns      |       0 ns      |
|2200 | 0xe90440  |   - | 0xe80b40  | 0002-0000-0000-0000  |  0   | 5809  |      0 B/s |  2.8 MB/s   |   0 ns  | 132.0 us |   0 ns  |  48.0 us |      0 B |  511.0 B  |      0 ns      |       0 ns      |
+----------------------------------------------------------+--------------+--------------------------+--------------------+--------------------+----------------------+----------------+-----------------+
Total number of ITLs: 2

次に、ターゲット NVMe の ITN のイニシエータ識別子 0xc80004、ターゲット識別子 0xed0004 と名前空間 1 のフロー メトリックの表示方法の例を示します:


switch# ShowAnalytics --info --target-itn --initiator 0xc80004 --target 0xed0004 --namespace 1
2019-04-09 11:17:24.643292
 
B: Bytes, s: Seconds, Avg: Average, Acc: Accumulative,
ns: Nano Seconds, ms: Milli Seconds, us: Micro Seconds,
GB: Giga Bytes, MB: Mega Bytes, KB: Killo Bytes,
ECT: Exchange Completion Time, DAL: Data Access Latency


Interface : fc3/15
+-------------------------------+----------+----------+------------+
| Metric                        |    Min   |    Max   |      Avg   |
+-------------------------------+----------+----------+------------+
| Read  IOPS         (4sec Avg) |       NA |       NA |       2391 |
| Write IOPS         (4sec Avg) |       NA |       NA |       2517 |
| Read  Throughput   (4sec Avg) |       NA |       NA | 149.5 MB/s |
| Write Throughput   (4sec Avg) |       NA |       NA | 157.3 MB/s |
| Read  Size         (Acc Avg)  |  65536 B |  65536 B |    65536 B |
| Write Size         (Acc Avg)  |  65536 B |  65536 B |    65536 B |
| Read  DAL          (Acc Avg)  |  12.0 us |   1.6 ms |    46.0 us |
| Write DAL          (Acc Avg)  |  10.0 us | 407.0 us |    40.1 us |
| Read  ECT          (Acc Avg)  |  39.0 us |   1.9 ms |   113.8 us |
| Write ECT          (Acc Avg)  | 123.0 us |   3.6 ms |     1.5 ms |
| Write Host Delay   (Acc Avg)  |  51.0 us |   3.5 ms |     1.3 ms |
| Write Array Delay  (Acc Avg)  |       NA |  31.0 us |     5.6 us |
| Write IO Seq count (Acc Avg)  |        0 |        0 |          1 |
+-------------------------------+----------+----------+------------+

次に、ターゲット ITL のイニシエータ識別子 0xe90440、ターゲット識別子 0xe80b40 と LUN 識別子 0001-0000-0000-0000 のフロー メトリックの表示方法の例を示します:


switch# ShowAnalytics --info --target-itl --initiator 0xe90440 --target 0xe80b40 --lun 0001-0000-0000-0000
2019-04-09 11:17:24.643292
 
B: Bytes, s: Seconds, Avg: Average, Acc: Accumulative,
ns: Nano Seconds, ms: Milli Seconds, us: Micro Seconds,
GB: Giga Bytes, MB: Mega Bytes, KB: Killo Bytes,
ECT: Exchange Completion Time, DAL: Data Access Latency


Interface : fc5/21
+-------------------------------+---------+--------+----------+
| Metric                        |   Min   |  Max   |    Avg   |
+-------------------------------+---------+--------+----------+
| Read  IOPS         (4sec Avg) |      NA |     NA |        0 |
| Write IOPS         (4sec Avg) |      NA |     NA |     4112 |
| Read  Throughput   (4sec Avg) |      NA |     NA |        0 |
| Write Throughput   (4sec Avg) |      NA |     NA | 2.0 MB/s |
| Read  Size         (Acc Avg)  |       0 |      0 |        0 |
| Write Size         (Acc Avg)  |   512 B |  512 B |    512 B |
| Read  DAL          (Acc Avg)  |   0 ns  |  0 ns  |    0 ns  |
| Write DAL          (Acc Avg)  | 22.0 us | 2.4 ms |  46.1 us |
| Read  ECT          (Acc Avg)  |   0 ns  |  0 ns  |    0 ns  |
| Write ECT          (Acc Avg)  | 68.0 us | 2.5 ms | 126.6 us |
| Write Host Delay   (Acc Avg)  |   0 ns  |  0 ns  |    0 ns  |
| Write Array Delay  (Acc Avg)  |      NA |  0 ns  |    0 ns  |
| Write IO Seq count (Acc Avg)  |       0 |      0 |        0 |
+-------------------------------+---------+--------+----------+

次に、ターゲット NVMe の ITN のイニシエータ識別子 0xc80005 と名前空間 1 のフロー メトリックの表示方法の例を示します:


switch# ShowAnalytics --info --target-itn --initiator 0xc80005  --namespace 1
2019-04-09 11:18:40.132828
 
 Interface fc3/15
+-----------------------------------------+--------------+--------------------------+---------------------+--------------------+----------------------+----------------+-----------------+
|VSAN | Initiator |  Target   | Namespace |   Avg IOPS   |      Avg Throughput      |       Avg ECT       |      Avg DAL       |     Avg IO Size      | Avg Host Delay | Avg Array Delay |
+-----------------------------------------+--------------+--------------------------+---------------------+--------------------+----------------------+----------------+-----------------+
|                                         | Read | Write |     Read   |   Write     |   Read   |   Write  |  Read   |   Write  |   Read   |   Write   |     Write      |      Write      |
|                                         |              |                          |                     |                    |                      |                |                 |
|3300 | 0xc80005  | 0xed0005  |  1        | 2451 | 2478  | 153.2 MB/s | 154.9 MB/s  | 114.0 us |   1.5 ms | 45.0 us |  40.0 us |  64.0 KB |  64.0 KB  |     1.3 ms     |      5.0 us     |
+-----------------------------------------+--------------+--------------------------+---------------------+--------------------+----------------------+----------------+-----------------+
Total number of ITNs: 1

次に、SCSI の ターゲット ITL のイニシエータ識別子 0xe90440 と LUN 識別子 0001-0000-0000-0000 のフロー メトリックの表示方法の例を示します:


switch# ShowAnalytics --info --target-itl --initiator 0xe90440  --lun 0001-0000-0000-0000
2019-04-09 11:18:40.132828
 
 Interface fc5/21
+----------------------------------------------------------+--------------+--------------------------+--------------------+--------------------+----------------------+----------------+-----------------+
|VSAN | Initiator | VMID |  Target   |         LUN         |   Avg IOPS   |      Avg Throughput      |      Avg ECT       |      Avg DAL       |     Avg IO Size      | Avg Host Delay | Avg Array Delay |
+----------------------------------------------------------+--------------+--------------------------+--------------------+--------------------+----------------------+----------------+-----------------+
|                                                          | Read | Write |     Read   |   Write     |  Read   |   Write  |  Read   |   Write  |   Read   |   Write   |     Write      |      Write      |
|                                                          |              |                          |                    |                    |                      |                |                 |
|2200 | 0xe90440  |   - | 0xe80b40  | 0001-0000-0000-0000  |  0   | 5816  |      0 B/s |  2.8 MB/s   |   0 ns  | 131.0 us |   0 ns  |  48.0 us |      0 B |  512.0 B  |      0 ns      |       0 ns      |
+----------------------------------------------------------+--------------+--------------------------+--------------------+--------------------+----------------------+----------------+-----------------+
Total number of ITLs: 1

フロー メトリックの詳細については、フロー メトリックを参照してください。

次の例は、NVMe の 1 秒あたりの I/O 操作数(IOPS)の上位 ITN を表示する方法を表示します:


switch# ShowAnalytics  --top  --nvme 

2019-06-13 10:56:49.099069

+--------+-------------------------------------------+-------------------+
|  PORT  | VSAN | Initiator |  Target   | Namespace  |      Avg IOPS     |
+--------+-------------------------------------------+-------------------+
|        |                                           |   Read  |  Write  |
| fc3/15 | 3300 | 0xc80004  | 0xed0004  |   1        |   2547  |  2474   |
| fc3/15 | 3300 | 0xc80002  | 0xed0002  |   1        |   2521  |  2486   |
| fc3/15 | 3300 | 0xc80008  | 0xed0008  |   1        |   2506  |  2499   |
| fc3/15 | 3300 | 0xc80009  | 0xed0009  |   1        |   2516  |  2483   |
| fc3/15 | 3300 | 0xc80006  | 0xed0006  |   1        |   2516  |  2482   |
| fc3/15 | 3300 | 0xc80007  | 0xed0007  |   1        |   2508  |  2484   |
| fc3/15 | 3300 | 0xc80005  | 0xed0005  |   1        |   2481  |  2505   |
| fc3/15 | 3300 | 0xc80003  | 0xed0003  |   1        |   2469  |  2517   |
| fc3/15 | 3300 | 0xc80000  | 0xed0001  |   1        |   2057  |  2021   |
| fc3/15 | 3300 | 0xc80001  | 0xed0001  |   1        |   1893  |  1953   |
+--------+-------------------------------------------+-------------------+

次の例は、1 秒あたりの I/O 操作数(IOPS)の上位 ITL を表示する方法を表示します:


switch# ShowAnalytics  --top 

2019-06-13 10:56:49.099069

+--------+-----------------------------------------+-------------------+
|  PORT  |        VSAN|Initiator|Target|LUN        |      Avg IOPS     |
+--------+-----------------------------------------+-------------------+
|        |                                         |   Read  |  Write  |
| fc8/10 | 5|0xed04b2|0xef0680|0001-0000-0000-0000 |   118   |   0     |
| fc8/10 | 5|0xed04b2|0xef0680|0003-0000-0000-0000 |   118   |   0     |
| fc8/10 | 5|0xed04b2|0xef0680|0002-0000-0000-0000 |   118   |   0     |
| fc8/10 | 5|0xed04b2|0xef0680|0005-0000-0000-0000 |   118   |   0     |
| fc8/10 | 5|0xed04b2|0xef0680|0006-0000-0000-0000 |   118   |   0     |
| fc8/10 | 5|0xed04b2|0xef0680|0007-0000-0000-0000 |   118   |   0     |
| fc8/10 | 5|0xed04b2|0xef0680|0008-0000-0000-0000 |   118   |   0     |
| fc8/10 | 5|0xed04b2|0xef0680|0009-0000-0000-0000 |   118   |   0     |
| fc8/10 | 5|0xed04b2|0xef0680|000a-0000-0000-0000 |   118   |   0     |
| fc8/10 | 5|0xed04b2|0xef0680|000b-0000-0000-0000 |   118   |   0     |
+--------+-----------------------------------------+-------------------+

次の例は、I/O サイズの上位 ITL を表示する方法を示しています:


switch# ShowAnalytics --top --key IOSIZE
Data collected at : Tue, 07 Jun 2022 12:16:09 +0530

+--------+-----------------------------------------------------+----------------------+
|  PORT  | VSAN | Initiator |  Target   |         LUN          |     Avg IO Size      |
+--------+-----------------------------------------------------+----------------------+
|        |                                                     |    Read  |  Write    |
| fc2/2  | 2200 | 0xc80760  | 0xee0000  | 0003-0000-0000-0000  |      0 B |  5.8 KB   |
| fc2/19 | 2200 | 0xee024b  | 0xe80441  | 000c-0000-0000-0000  |      0 B |  4.0 KB   |
| fc2/19 | 2200 | 0xee0252  | 0xe80926  | 0018-0000-0000-0000  |      0 B |  4.0 KB   |
| fc2/19 | 2200 | 0xee024c  | 0xe80920  | 002f-0000-0000-0000  |      0 B |  4.0 KB   |
| fc2/20 | 2200 | 0xee0253  | 0xe80927  | 0051-0000-0000-0000  |      0 B |  4.0 KB   |0
| fc2/20 | 2200 | 0xee0253  | 0xe80927  | 000f-0000-0000-0000  |      0 B |  4.0 KB   |
| fc2/19 | 2200 | 0xee024c  | 0xe80920  | 0006-0000-0000-0000  |      0 B |  4.0 KB   |
| fc2/20 | 2200 | 0xee024c  | 0xe80920  | 0049-0000-0000-0000  |      0 B |  4.0 KB   |
| fc2/19 | 2200 | 0xee0250  | 0xe80924  | 0029-0000-0000-0000  |      0 B |  4.0 KB   |
| fc2/19 | 2200 | 0xee0251  | 0xe80925  | 0034-0000-0000-0000  |      0 B |  4.0 KB   |
+--------+-----------------------------------------------------+----------------------+

次に、 ITL のイニシエータ フローの表示方法の例を示します:


switch# ShowAnalytics --top --initiator-flow

Data collected at : Tue, 07 Jun 2022 12:20:28 +0530

+---------+-------------------+-------------------+
|   PORT  | VSAN | Initiator  |      Avg IOPS     |
+---------+-------------------+-------------------+
|         |                   |   Read  |  Write  |
|  fc1/29 | 2200 | 0xc803e0   |    0    | 29037   |
|  fc1/29 | 2200 | 0xc803e1   |    0    | 19919   |
|  fc2/2  | 2200 | 0xc80760   |    0    |   31    |
| fc12/17 | 2200 | 0xc80600   |    0    |   0     |
|  fc2/20 | 2200 | 0xee01cc   |    0    |   0     |
|  fc2/20 | 2200 | 0xee006e   |    0    |   0     |
|  fc2/19 | 2200 | 0xee0272   |    0    |   0     |
|  fc2/20 | 2200 | 0xee02b2   |    0    |   0     |
|  fc2/20 | 2200 | 0xee02d1   |    0    |   0     |
|  fc2/19 | 2200 | 0xee02b3   |    0    |   0     |
+---------+-------------------+-------------------+

次に、 ITL のターゲット フローの表示方法の例を示します:


switch# ShowAnalytics --top --target-flow

Data collected at : Tue, 07 Jun 2022 12:20:42 +0530

+--------+-------------------+-------------------+
|  PORT  | VSAN |  Target    |      Avg IOPS     |
+--------+-------------------+-------------------+
|        |                   |   Read  |  Write  |
| fc1/22 | 2200 | 0xc80329   |    0    | 20269   |
| fc1/23 | 2200 | 0xc80349   |    0    | 20262   |
| fc1/24 | 2200 | 0xc80369   |    0    | 20196   |
| fc1/34 | 2200 | 0xc804a9   |    0    | 20177   |
| fc1/36 | 2200 | 0xc804c9   |    0    | 20165   |
| fc1/35 | 2200 | 0xc80589   |    0    | 20095   |
| fc1/33 | 2200 | 0xc80469   |    0    | 20042   |
| fc1/1  | 2200 | 0xc80029   |    0    | 18684   |
| fc1/2  | 2200 | 0xc80069   |    0    | 18663   |
| fc1/15 | 2200 | 0xc80249   |    0    | 18654   |
+--------+-------------------+-------------------+

次に、 ITL のフローの表示方法の例を示します:


switch# ShowAnalytics --top --it-flow
Data collected at : Tue, 07 Jun 2022 12:21:58 +0530

+--------+-------------------------------+-------------------+
|  PORT  | VSAN | Initiator |  Target    |      Avg IOPS     |
+--------+-------------------------------+-------------------+
|        |                               |   Read  |  Write  |
| fc1/29 | 2200 | 0xc803e0  |  0xc80700  |    0    | 28321   |
| fc1/22 | 2200 | 0xc809e9  |  0xc80329  |    0    | 20274   |
| fc1/24 | 2200 | 0xc80a29  |  0xc80369  |    0    | 20244   |
| fc1/23 | 2200 | 0xc80a09  |  0xc80349  |    0    | 20244   |
| fc1/34 | 2200 | 0xc80b49  |  0xc804a9  |    0    | 20181   |
| fc1/36 | 2200 | 0xc80b89  |  0xc804c9  |    0    | 20173   |
| fc1/35 | 2200 | 0xc80b69  |  0xc80589  |    0    | 20054   |
| fc1/33 | 2200 | 0xc80b29  |  0xc80469  |    0    | 20019   |
| fc1/29 | 2200 | 0xc803e1  |  0xc80701  |    0    | 19425   |
| fc1/1  | 2200 | 0xc80ac9  |  0xc80029  |    0    | 18659   |
+--------+-------------------------------+-------------------+

次に、 ITL のイニシエータ、ターゲットと LUN フローの表示方法の例を示します:


switch# ShowAnalytics --top --noclear
Data collected at : Tue, 07 Jun 2022 12:27:38 +0530

+--------+-----------------------------------------------------+-------------------+
|  PORT  | VSAN | Initiator |  Target   |         LUN          |      Avg IOPS     |
+--------+-----------------------------------------------------+-------------------+
|        |                                                     |   Read  |  Write  |
| fc1/29 | 2200 | 0xc803e0  | 0xc80700  | 0064-0000-0000-0000  |    0    |  567    |
| fc1/29 | 2200 | 0xc803e1  | 0xc80701  | 003b-0000-0000-0000  |    0    |  283    |
| fc1/29 | 2200 | 0xc803e0  | 0xc80700  | 004e-0000-0000-0000  |    0    |  283    |
| fc1/29 | 2200 | 0xc803e0  | 0xc80700  | 0043-0000-0000-0000  |    0    |  283    |
| fc1/29 | 2200 | 0xc803e1  | 0xc80701  | 0038-0000-0000-0000  |    0    |  283    |
| fc1/29 | 2200 | 0xc803e1  | 0xc80701  | 0040-0000-0000-0000  |    0    |  283    |
| fc1/29 | 2200 | 0xc803e0  | 0xc80700  | 0061-0000-0000-0000  |    0    |  283    |
| fc1/29 | 2200 | 0xc803e0  | 0xc80700  | 0014-0000-0000-0000  |    0    |  283    |
| fc1/29 | 2200 | 0xc803e1  | 0xc80701  | 001e-0000-0000-0000  |    0    |  283    |
| fc1/29 | 2200 | 0xc803e0  | 0xc80700  | 001d-0000-0000-0000  |    0    |  283    |
+--------+-----------------------------------------------------+-------------------+


Data collected at : Tue, 07 Jun 2022 12:27:45 +0530

+--------+-----------------------------------------------------+-------------------+
|  PORT  | VSAN | Initiator |  Target   |         LUN          |      Avg IOPS     |
+--------+-----------------------------------------------------+-------------------+
|        |                                                     |   Read  |  Write  |
| fc1/29 | 2200 | 0xc803e0  | 0xc80700  | 0064-0000-0000-0000  |    0    |  554    |
| fc1/29 | 2200 | 0xc803e1  | 0xc80701  | 003b-0000-0000-0000  |    0    |  277    |
| fc1/29 | 2200 | 0xc803e0  | 0xc80700  | 004e-0000-0000-0000  |    0    |  277    |
| fc1/29 | 2200 | 0xc803e0  | 0xc80700  | 0043-0000-0000-0000  |    0    |  277    |
| fc1/29 | 2200 | 0xc803e1  | 0xc80701  | 0038-0000-0000-0000  |    0    |  277    |
| fc1/29 | 2200 | 0xc803e1  | 0xc80701  | 0040-0000-0000-0000  |    0    |  277    |
| fc1/29 | 2200 | 0xc803e0  | 0xc80700  | 0061-0000-0000-0000  |    0    |  277    |
| fc1/29 | 2200 | 0xc803e0  | 0xc80700  | 0014-0000-0000-0000  |    0    |  277    |
| fc1/29 | 2200 | 0xc803e1  | 0xc80701  | 001e-0000-0000-0000  |    0    |  277    |
| fc1/29 | 2200 | 0xc803e0  | 0xc80700  | 001d-0000-0000-0000  |    0    |  277    |
+--------+-----------------------------------------------------+-------------------+

次の例は、NMVe のスループットの上位 ITN を段階的に表示する方法を示しています:


switch# ShowAnalytics  --top --key thput  --progress --nvme

2019-06-13 10:58:16.015546

+--------+-------------------------------------------+-------------------------+
|  PORT  | VSAN | Initiator |  Target   | Namespace  |      Avg Throughput     |
+--------+-------------------------------------------+-------------------------+
|        |                                           |     Read   |   Write    |
| fc3/15 | 3300 | 0xc80003  | 0xed0003  |   1        | 159.1 MB/s | 154.6 MB/s |
| fc3/15 | 3300 | 0xc80002  | 0xed0002  |   1        | 157.4 MB/s | 155.0 MB/s |
| fc3/15 | 3300 | 0xc80006  | 0xed0006  |   1        | 157.7 MB/s | 154.3 MB/s |
| fc3/15 | 3300 | 0xc80004  | 0xed0004  |   1        | 157.1 MB/s | 154.8 MB/s |
| fc3/15 | 3300 | 0xc80007  | 0xed0007  |   1        | 155.5 MB/s | 155.4 MB/s |
| fc3/15 | 3300 | 0xc80009  | 0xed0009  |   1        | 153.8 MB/s | 156.6 MB/s |
| fc3/15 | 3300 | 0xc80008  | 0xed0008  |   1        | 152.2 MB/s | 157.1 MB/s |
| fc3/15 | 3300 | 0xc80005  | 0xed0005  |   1        | 150.9 MB/s | 158.1 MB/s |
| fc3/15 | 3300 | 0xc80000  | 0xed0001  |   1        | 133.7 MB/s | 133.3 MB/s |
| fc3/15 | 3300 | 0xc80001  | 0xed0001  |   1        | 118.4 MB/s | 120.2 MB/s |
+--------+-------------------------------------------+-------------------------+

次の例は、スループットの上位 ITL を段階的に表示する方法を示しています:


switch# ShowAnalytics  --top --key thput  --progress

2019-06-13 10:58:16.015546

+--------+-----------------------------------------+-------------------------+
|  PORT  |        VSAN|Initiator|Target|LUN        |      Avg THROUGHPUT     |
+--------+-----------------------------------------+-------------------------+
|        |                                         |     Read   |   Write    |
| fc8/10 | 5|0xed04b2|0xef0680|000f-0000-0000-0000 | 133.8 KB/s |     0      |
| fc8/10 | 5|0xed04b3|0xef0681|000a-0000-0000-0000 | 133.8 KB/s |     0      |
| fc8/10 | 5|0xed04b3|0xef0681|0014-0000-0000-0000 | 133.8 KB/s |     0      |
| fc8/10 | 5|0xed04b4|0xef0682|000f-0000-0000-0000 | 133.8 KB/s |     0      |
| fc8/10 | 5|0xed04b5|0xef0683|000a-0000-0000-0000 | 133.8 KB/s |     0      |
| fc8/10 | 5|0xed04b5|0xef0683|000f-0000-0000-0000 | 133.8 KB/s |     0      |
| fc8/10 | 5|0xed04b5|0xef0683|0013-0000-0000-0000 | 133.8 KB/s |     0      |
| fc8/10 | 5|0xed04b6|0xef0684|0013-0000-0000-0000 | 133.8 KB/s |     0      |
| fc8/10 | 5|0xed04b2|0xef0680|0004-0000-0000-0000 | 133.5 KB/s |     0      |
| fc8/10 | 5|0xed04b3|0xef0681|0009-0000-0000-0000 | 133.5 KB/s |     0      |
+--------+-----------------------------------------+-------------------------+

この例は、NVMe の 1 秒あたりの I/O 操作(IOPS)が最も高い ITN を表示する方法を示しています。オプション --alias により、イニシエータおよびターゲット デバイスのエイリアス情報が表示されます。


switch# ShowAnalytics --top --alias --nvme

2021-02-09 09:15:25.445815

+--------+-----------------------------------------------------------------+-------------------+
|  PORT  | VSAN |      Initiator       |        Target        | Namespace  |      Avg IOPS     |
+--------+-----------------------------------------------------------------+-------------------+
|        |                                                                 |   Read  |  Write  |
| fc3/15 | 3300 | sanblaze-147-port7-p | sanblaze-147-port6-p |   1        |   2518  |  2459   |
| fc3/15 | 3300 | sanblaze-147-port7-p | sanblaze-147-port6-p |   1        |   2499  |  2470   |
| fc3/15 | 3300 | sanblaze-147-port7-p | sanblaze-147-port6-p |   1        |   2491  |  2472   |
| fc3/15 | 3300 | sanblaze-147-port7-p | sanblaze-147-port6-p |   1        |   2491  |  2471   |
| fc3/15 | 3300 | sanblaze-147-port7-p | sanblaze-147-port6-p |   1        |   2457  |  2487   |
| fc3/15 | 3300 | sanblaze-147-port7-p | sanblaze-147-port6-p |   1        |   2445  |  2496   |
| fc3/15 | 3300 | sanblaze-147-port7-p | sanblaze-147-port6-p |   1        |   2440  |  2495   |
| fc3/15 | 3300 | sanblaze-147-port7-p | sanblaze-147-port6-p |   1        |   2434  |  2499   |
| fc3/15 | 3300 | sanblaze-147-port7-p | sanblaze-147-port6-p |   1        |   2197  |  2199   |
| fc3/15 | 3300 | sanblaze-147-port7-p | sanblaze-147-port6-p |   1        |   1987  |  1982   |
+--------+-----------------------------------------------------------------+-------------------+

この例は、SCSI の 1 秒あたりの I/O 操作(IOPS)が最も高い ITL を表示する方法を示しています。オプション --alias により、イニシエータおよびターゲット デバイスのエイリアス情報が表示されます。


switch# ShowAnalytics --top --alias

2021-02-09 09:15:25.445815

+--------+----------------------------------------------------------------------------------+-------------------+
|  PORT  | VSAN |      Initiator       | VMID |        Target        |         LUN          |      Avg IOPS     |
+--------+----------------------------------------------------------------------------------+-------------------+
|        |                                                                                  |   Read  |  Write  |
| fc5/22 | 2200 |       0xe90460       |   - |       0xe80b60       | 0002-0000-0000-0000   |    0    |  9124   |
| fc5/22 | 2200 |       0xe90460       |   - |       0xe80b60       | 0003-0000-0000-0000   |    0    |  9124   |
| fc5/22 | 2200 |       0xe90460       |   - |       0xe80b60       | 0001-0000-0000-0000   |    0    |  9123   |
| fc5/21 | 2200 |       0xe902e0       |   - | Tgt_9706_206_fc5_21_ | 0003-0000-0000-0000   |    0    |  5718   |
| fc5/21 | 2200 |       0xe902e0       |   - | Tgt_9706_206_fc5_21_ | 0001-0000-0000-0000   |    0    |  5718   |
| fc5/21 | 2200 |       0xe906c0       |   - | Tgt_9706_206_fc5_21_ | 0002-0000-0000-0000   |    0    |  5718   |
| fc5/21 | 2200 |       0xe902e0       |   - | Tgt_9706_206_fc5_21_ | 0002-0000-0000-0000   |    0    |  5717   |
| fc5/21 | 2200 |       0xe90440       |   - | Tgt_9706_206_fc5_21_ | 0001-0000-0000-0000   |    0    |  5717   |
| fc5/21 | 2200 |       0xe90440       |   - | Tgt_9706_206_fc5_21_ | 0002-0000-0000-0000   |    0    |  5717   |
| fc5/21 | 2200 |       0xe906c0       |   - | Tgt_9706_206_fc5_21_ | 0001-0000-0000-0000   |    0    |  5717   |
+--------+----------------------------------------------------------------------------------+-------------------+

この例は、1 秒あたりの I/O 操作(IOPS)が最も高い ITL を表示する方法を示しています。オプション --alias により、イニシエータおよびターゲット デバイスのエイリアス情報が表示されます。


switch# ShowAnalytics --top --alias

2021-02-09 09:15:25.445815

+-------+----------------------------------------------------------------------------------+-------------------+
|  PORT | VSAN |      Initiator       | VMID |        Target        |         LUN          |      Avg IOPS     |
+-------+----------------------------------------------------------------------------------+-------------------+
|       |                                                                                  |   Read  |  Write  |
| fc1/2 |   20 | tie-2000012341newdev |  89 | tie-2000012341newdev | 0000-0000-0000-0000   |    0    |  1769   |
| fc1/1 |   20 | tie-2000012341newdev |  89 | tie-2000012341newdev | 0000-0000-0000-0000   |    0    |  1769   |
+-------+----------------------------------------------------------------------------------+-------------------+

次の例は、すべてのターゲット ITN のエラーを表示し、NVMe の出力を 10 のランダム レコードに制限する方法を示しています:


switch# ShowAnalytics --errors --target-itn --limit 10
2019-05-23 11:28:34.926267

 Interface fc3/15
+-------------------------------------------+---------------------+-----------------+
| VSAN | Initiator |  Target   | Namespace  | Total NVMe Failures | Total FC Aborts |
+-------------------------------------------+---------------------+-----------------+
|                                           |     Read | Write    |   Read | Write  |
|                                           |                     |                 |
| 3300 | 0xc80005  | 0xed0005  |   1        |        0 | 0        |    0   |  0     |
| 3300 | 0xc80000  | 0xed0001  |   1        |        0 | 0        |    0   |  0     |
| 3300 | 0xc80004  | 0xed0004  |   1        |        0 | 0        |    0   |  0     |
| 3300 | 0xc80001  | 0xed0001  |   1        |        0 | 0        |    0   |  0     |
| 3300 | 0xc80003  | 0xed0003  |   1        |        0 | 0        |    0   |  0     |
| 3300 | 0xc80000  | 0xed0000  |   1        |        0 | 0        |   1260 | 1210   |
| 3300 | 0xc80007  | 0xed0007  |   1        |        0 | 0        |    0   |  0     |
| 3300 | 0xc80008  | 0xed0008  |   1        |        0 | 0        |    0   |  0     |
| 3300 | 0xc80002  | 0xed0002  |   1        |        0 | 0        |    0   |  0     |
| 3300 | 0xc80006  | 0xed0006  |   1        |        0 | 0        |    0   |  0     |
+-------------------------------------------+---------------------+-----------------+

次の例は、すべてのターゲット ITL のエラーを表示し、出力を 10 のランダム レコードに制限する方法を示しています:


switch# ShowAnalytics --errors --target-itl --limit 10
2019-05-23 11:28:34.926267

 Interface fc8/7
+-----------------------------------------+---------------------+-----------------+
|        VSAN|Initiator|Target|LUN        | Total SCSI Failures | Total FC Aborts |
+-----------------------------------------+---------------------+-----------------+
|                                         |     Read | Write    |   Read | Write  |
|                                         |                     |                 |
| 5|0xed0332|0xef0592|000f-0000-0000-0000 |        0 | 0        |      0 | 0      |
| 5|0xed0342|0xef05a2|000a-0000-0000-0000 |        0 | 0        |      0 | 0      |
| 5|0xed0332|0xef0592|0008-0000-0000-0000 |        0 | 0        |      0 | 0      |
| 5|0xed0340|0xef05a0|0010-0000-0000-0000 |        0 | 0        |      0 | 0      |
| 5|0xed0322|0xef0582|0008-0000-0000-0000 |        0 | 0        |      0 | 0      |
| 5|0xed032c|0xef058c|0014-0000-0000-0000 |        0 | 0        |      0 | 0      |
| 5|0xed033a|0xef059a|000d-0000-0000-0000 |        0 | 0        |      0 | 0      |
| 5|0xed034a|0xef05aa|0005-0000-0000-0000 |        0 | 0        |      0 | 0      |
| 5|0xed033a|0xef059a|0007-0000-0000-0000 |        0 | 0        |      0 | 0      |
| 5|0xed034a|0xef05aa|0013-0000-0000-0000 |        0 | 0        |      0 | 0      |
+-----------------------------------------+---------------------+-----------------+

次の例では、NVMe 障害がゼロ以外のすべての ITN を表示し、カウントを元に戻す方法を示します:


switch# ShowAnalytics --errorsonly --initiator-itn 
2019-04-09 11:27:42.496294
 
 Interface fc16/12
+-------------------------------------------+---------------------+-----------------+
| VSAN | Initiator |  Target   | Namespace  | Total NVMe Failures | Total FC Aborts |
+-------------------------------------------+---------------------+-----------------+
|                                           |     Read | Write    |   Read | Write  |
|                                           |                     |                 |
| 3300 | 0xc80000  | 0xed0000  |   1        |        0 | 0        |   1635 | 1631   |
+-------------------------------------------+---------------------+-----------------+

次の例は、SCSI 障害がゼロ以外のすべての ITL を表示し、カウントを戻す方法を示しています:


switch# ShowAnalytics --errorsonly --initiator-itl 
2019-04-09 11:27:42.496294
 
 Interface fc8/27
+-------------------------------------------+---------------------+-----------------+
|         VSAN|Initiator|Target|LUN         | Total SCSI Failures | Total FC Aborts |
+-------------------------------------------+---------------------+-----------------+
|                                           |     Read | Write    |   Read | Write  |
|                                           |                     |                 |
| 311|0x900000|0xc90000|0000-0000-0000-0000 |       0  | 42       |      0 | 0      |
+-------------------------------------------+---------------------+-----------------+

この例は、SCSI 障害がゼロ以外の 10 のランダム ITL を表示し、カウントを戻す方法を示しています。デバイス エイリアス(存在する場合)は、イニシエータとターゲットの両方に含まれます。


switch# ShowAnalytics --errorsonly --initiator-itl --alias --limit 10
2019-04-09 12:06:19.847350

Interface fc1/26
+-------------------------------------------+-------------------+---------------+----------------------+-------------------+
|         VSAN|Initiator|Target|LUN         |Total SCSI Failures|Total FC Aborts|Initiator Device alias|Target Device alias|
+-------------------------------------------+-------------------+---------------+----------------------+-------------------+
|                                           |     Read | Write  |   Read | Write|                      |                   |
|                                           |                   |               |                      |                   |
| 108|0xee0467|0x70039b|0001-0000-0000-0000 |       0  | 1      |      0 | 0    |                      | SB_112_port_T_18_7|
| 108|0xee0401|0xbc092b|0002-0000-0000-0000 |       10 | 16     |      0 | 0    |                      | SB_112_port_T_0_1 |
| 108|0xee0441|0xbc092b|0003-0000-0000-0000 |       3  | 13     |      0 | 0    |   SB_112_port_I_7_1  | SB_112_port_T_0_1 |
| 108|0xee0401|0xbc0996|0001-0000-0000-0000 |       3  | 0      |      0 | 0    |                      |                   |
| 108|0xee0441|0xbc0996|0002-0000-0000-0000 |       0  | 3      |      0 | 0    |   SB_112_port_I_7_1  |                   |
| 108|0xee0481|0xbc0996|0004-0000-0000-0000 |       0  | 4      |      0 | 0    |                      |                   |
| 108|0xee0403|0xbc092d|0000-0000-0000-0000 |       12 | 8      |      0 | 0    |                      | SB_112_port_T_0_3 |
| 108|0xee0443|0xbc092d|0001-0000-0000-0000 |       3  | 12     |      0 | 0    |   SB_112_port_I_7_3  | SB_112_port_T_0_3 |
| 108|0xee0443|0xbc0998|0000-0000-0000-0000 |       1  | 0      |      0 | 0    |   SB_112_port_I_7_3  |                   |
+-------------------------------------------+-------------------+---------------+----------------------+-------------------+

次の例は、NVMe のターゲット ITN のターゲット識別子 0xed0000 の最小、最大、およびピーク フロー メトリックを表示する方法を示しています:


switch# ShowAnalytics --minmax --target-itn --target 0xed0000
2019-04-09 11:22:08.652598
  Interface fc3/15
+-----------------------------------------+---------------------+--------------------------+--------------------+--------------------+--------------------+--------------------+--------------------+
|VSAN | Initiator |  Target   | Namespace |      Peak IOPS*     |     Peak Throughput*     |     Read ECT*      |     Write ECT*     |    Host Delay*     |    Array Delay*    | Write IO sequence* |
+-----------------------------------------+---------------------+--------------------------+--------------------+--------------------+--------------------+--------------------+--------------------+
|                                         |   Read   |  Write   |     Read   |   Write     |   Min   |    Max   |  Min    |    Max   |  Min    |    Max   |  Min    |    Max   |  Min    |    Max   |
|                                         |                     |                          |                    |                    |                    |                    |                    |
|3300 | 0xc80000  | 0xed0000  |  1        |   383    |   379    |  24.0 MB/s |  23.7 MB/s  |  2.6 ms |  26.7 ms |  3.5 ms |  28.7 ms | 12.0 us |   3.1 ms |   NA    |   1.4 ms |    0    |    0     |
+-----------------------------------------+---------------------+--------------------------+--------------------+--------------------+--------------------+--------------------+--------------------+
Total number of ITNs: 1
*These values are calculated since the metrics were last cleared.

次の例は、SCSI のターゲット ITL のターゲット識別子 0xe80b40 の最小、最大、およびピーク フロー メトリックを表示する方法を示しています:


switch# ShowAnalytics --minmax --target-itl --target 0xe80b40
2019-04-09 11:22:08.652598
 
 Interface fc5/21
+----------------------------------------------------------+-------------+--------------------------+--------------------+--------------------+--------------------+--------------------+--------------------+
|VSAN | Initiator | VMID |  Target   |         LUN         |  Peak IOPS* |     Peak Throughput*     |     Read ECT*      |     Write ECT*     |    Host Delay*     |    Array Delay*    | Write IO sequence* |
+----------------------------------------------------------+-------------+--------------------------+--------------------+--------------------+--------------------+--------------------+--------------------+
|                                                          |Read | Write |     Read   |   Write     |   Min   |    Max   |  Min    |    Max   |  Min    |    Max   |  Min    |    Max   |  Min    |    Max   |
|                                                          |             |                          |                    |                    |                    |                    |                    |
|2200 | 0xe90440  |   - | 0xe80b40  | 0001-0000-0000-0000  |  0   | 8361 |      0 B/s |  4.1 MB/s   |   0 ns  |    0 ns  | 68.0 us |   2.6 ms |   0 ns  |    0 ns  |   NA    |    0 ns  |    0    |    0     |
|2200 | 0xe90440  |   - | 0xe80b40  | 0002-0000-0000-0000  |  0   | 7814 |      0 B/s |  3.8 MB/s   |   0 ns  |    0 ns  | 69.0 us |   2.6 ms |   0 ns  |    0 ns  |   NA    |    0 ns  |    0    |    0     |
+----------------------------------------------------------+-------------+--------------------------+--------------------+--------------------+--------------------+--------------------+--------------------+
Total number of ITLs: 2
*These values are calculated since the metrics were last cleared.

次の例は、ターゲット ITN のインターフェイス fc3/15 のデバイス エイリアス情報、最小、最大、およびピーク フロー メトリックを表示し、NVMe の出力を 10 のランダム レコードに制限する方法を示しています:


switch# ShowAnalytics --minmax --target-itn --alias  --interface fc3/15 --limit 10
2019-04-09 12:01:40.609197

 Interface fc3/15
+---------------------------------------------------------------+-----------------------+--------------------------+--------------------+---------------------+--------------------+--------------------+--------------------+
|VSAN |      Initiator       |        Target        | Namespace |       Peak IOPS*      |     Peak Throughput*     |     Read ECT*      |      Write ECT*     |    Host Delay*     |    Array Delay*    | Write IO sequence* |
+---------------------------------------------------------------+-----------------------+--------------------------+--------------------+---------------------+--------------------+--------------------+--------------------+
|                                                               |   Read    |   Write   |     Read   |   Write     |   Min   |    Max   |   Min    |    Max   |  Min    |    Max   |  Min    |    Max   |  Min    |    Max   |
|                                                               |                       |                          |                    |                     |                    |                    |                    |
|3300 | sanblaze-147-port7-p | sanblaze-147-port6-p |  1        |   2674    |   2595    | 167.1 MB/s | 162.2 MB/s  | 38.0 us |   2.3 ms |  69.0 us |   3.9 ms | 12.0 us |   3.7 ms |   NA    |  36.0 us |    0    |    0     |
|3300 | sanblaze-147-port7-p | sanblaze-147-port6-p |  1        |   10199   |   10163   | 637.4 MB/s | 635.2 MB/s  |  9.0 us |   2.4 ms |  65.0 us |   3.9 ms | 12.0 us |   3.7 ms |   NA    |  32.0 us |    0    |    0     |
|3300 | sanblaze-147-port7-p | sanblaze-147-port6-p |  1        |   2618    |   2587    | 163.6 MB/s | 161.7 MB/s  | 39.0 us |   2.4 ms |  69.0 us |   3.8 ms | 12.0 us |   3.6 ms |   NA    |  34.0 us |    0    |    0     |
|3300 | sanblaze-147-port7-p | sanblaze-147-port6-p |  1        |   2288    |   2287    | 143.0 MB/s | 143.0 MB/s  | 37.0 us |   2.4 ms |  69.0 us |   4.0 ms | 12.0 us |   3.7 ms |   NA    |  35.0 us |    0    |    0     |
|3300 | sanblaze-147-port7-p | sanblaze-147-port6-p |  1        |   2624    |   2583    | 164.0 MB/s | 161.4 MB/s  | 38.0 us |   2.5 ms | 108.0 us |   3.6 ms | 12.0 us |   3.4 ms |   NA    |  33.0 us |    0    |    0     |
|3300 | sanblaze-147-port7-p | sanblaze-147-port6-p |  1        |    383    |    379    |  24.0 MB/s |  23.7 MB/s  |  2.6 ms |  27.0 ms |   3.5 ms |  28.7 ms | 12.0 us |   3.1 ms |   NA    |   1.4 ms |    0    |    0     |
|3300 | sanblaze-147-port7-p | sanblaze-147-port6-p |  1        |   2624    |   2587    | 164.0 MB/s | 161.7 MB/s  | 38.0 us |   2.4 ms |  69.0 us |   3.7 ms | 12.0 us |   3.5 ms |   NA    |  39.0 us |    0    |    0     |
|3300 | sanblaze-147-port7-p | sanblaze-147-port6-p |  1        |   2621    |   2597    | 163.8 MB/s | 162.3 MB/s  | 38.0 us |   2.4 ms |  77.0 us |   3.9 ms | 12.0 us |   3.5 ms |   NA    |  31.0 us |    0    |    0     |
|3300 | sanblaze-147-port7-p | sanblaze-147-port6-p |  1        |   2646    |   2590    | 165.4 MB/s | 161.9 MB/s  | 38.0 us |   2.6 ms |  69.0 us |   3.8 ms | 12.0 us |   3.6 ms |   NA    |  33.0 us |    0    |    0     |
|3300 | sanblaze-147-port7-p | sanblaze-147-port6-p |  1        |   2651    |   2594    | 165.7 MB/s | 162.2 MB/s  | 39.0 us |   2.6 ms |  69.0 us |   3.6 ms | 12.0 us |   3.5 ms |   NA    |  32.0 us |    0    |    0     |
+---------------------------------------------------------------+-----------------------+--------------------------+--------------------+---------------------+--------------------+--------------------+--------------------+
Total number of ITNs: 10
*These values are calculated since the metrics were last cleared.

次に、ターゲット ITL のインターフェイス fc5/21 のデバイス エイリアス情報、最小、最大、およびピーク フロー メトリックを表示し、SCSI の出力を 10 のランダム レコードに制限する例を示します:


switch# ShowAnalytics --minmax --target-itl --alias  --interface fc5/21 --limit 10
2019-04-09 12:01:40.609197

 Interface fc5/21
+--------------------------------------------------------------------------------+-------------+--------------------------+--------------------+--------------------+--------------------+--------------------+--------------------+
|VSAN |      Initiator       | VMID |        Target        |         LUN         |  Peak IOPS* |     Peak Throughput*     |     Read ECT*      |     Write ECT*     |    Host Delay*     |    Array Delay*    | Write IO sequence* |
+--------------------------------------------------------------------------------+-------------+--------------------------+--------------------+--------------------+--------------------+--------------------+--------------------+
|                                                                                |Read | Write |     Read   |   Write     |   Min   |    Max   |  Min    |    Max   |  Min    |    Max   |  Min    |    Max   |  Min    |    Max   |
|                                                                                |             |                          |                    |                    |                    |                    |                    |
|2200 |       0xe902e0       |   - | Tgt_9706_206_fc5_21_ | 0002-0000-0000-0000  |  0   | 9242 |      0 B/s |  4.5 MB/s   |   0 ns  |    0 ns  | 66.0 us |   2.6 ms |   0 ns  |    0 ns  |   NA    |    0 ns  |    0    |    0     |
|2200 |       0xe902e0       |   - | Tgt_9706_206_fc5_21_ | 0003-0000-0000-0000  |  0   | 9243 |      0 B/s |  4.5 MB/s   |   0 ns  |    0 ns  | 66.0 us |   2.6 ms |   0 ns  |    0 ns  |   NA    |    0 ns  |    0    |    0     |
|2200 |       0xe902e0       |   - | Tgt_9706_206_fc5_21_ | 0001-0000-0000-0000  |  0   | 9242 |      0 B/s |  4.5 MB/s   |   0 ns  |    0 ns  | 66.0 us |   2.6 ms |   0 ns  |    0 ns  |   NA    |    0 ns  |    0    |    0     |
|2200 |       0xe90440       |   - | Tgt_9706_206_fc5_21_ | 0001-0000-0000-0000  |  0   | 8361 |      0 B/s |  4.1 MB/s   |   0 ns  |    0 ns  | 68.0 us |   2.6 ms |   0 ns  |    0 ns  |   NA    |    0 ns  |    0    |    0     |
|2200 |       0xe90440       |   - | Tgt_9706_206_fc5_21_ | 0002-0000-0000-0000  |  0   | 7814 |      0 B/s |  3.8 MB/s   |   0 ns  |    0 ns  | 69.0 us |   2.6 ms |   0 ns  |    0 ns  |   NA    |    0 ns  |    0    |    0     |
|2200 |       0xe906c0       |   - | Tgt_9706_206_fc5_21_ | 0001-0000-0000-0000  |  0   | 7779 |      0 B/s |  3.8 MB/s   |   0 ns  |    0 ns  | 69.0 us |   2.7 ms |   0 ns  |    0 ns  |   NA    |    0 ns  |    0    |    0     |
|2200 |       0xe906c0       |   - | Tgt_9706_206_fc5_21_ | 0002-0000-0000-0000  |  0   | 7779 |      0 B/s |  3.8 MB/s   |   0 ns  |    0 ns  | 69.0 us |   2.6 ms |   0 ns  |    0 ns  |   NA    |    0 ns  |    0    |    0     |
+--------------------------------------------------------------------------------+-------------+--------------------------+--------------------+--------------------+--------------------+--------------------+--------------------+
Total number of ITLs: 7
*These values are calculated since the metrics were last cleared.

次の例は、インターフェイスの範囲の NPU 負荷を表示する方法を示しています:


switch# ShowAnalytics --evaluate-npuload --interface fc8/7-8
2019-05-09 10:56:54.021234
There are 2 interfaces to be evaluated. Expected time is 2 minutes 0 seconds
Do you want to continue [Yes|No]? [n]y
+-----------+--------+--------+---------+------+------+-------+------------+----------+
| Interface |        ITL/N Count        |      NPU Load %     |  Analyis   | Analysis |
|           |  SCSI  |  NVMe  |  Total  | SCSI | NVMe | Total | Start Time | End Time |
+-----------+--------+--------+---------+------+------+-------+------------+----------+
|   fc8/7   |  1000  |   0    |   1000  | 8.1  | 0.0  |  8.1  |  10:57:20  | 10:57:52 |
|   fc8/8   |  1000  |   0    |   1000  | 8.1  | 0.0  |  8.1  |  10:58:20  | 10:58:51 |
|           |        |        |         |      |      |       |            |          |
|   *Total  |  2000  |   0    |   2000  | 16.2 | 0.0  |  16.2 |            |          |
+-----------+--------+--------+---------+------+------+-------+------------+----------+
* This total is an indicative reference based on evaluated ports


(注)  

NPU 負荷の評価には時間がかかります。評価プロセス中にスイッチへの接続が失われた場合、プロセスは完了するまでバックグラウンドで実行され続け、出力はファイルに保存されます。プロセスが完了すると、syslog メッセージが生成され、ファイル名と出力が保存されるファイルの場所が示されます。


次に、ブートフラッシュの output.txt という名前のファイルに出力を複製する例を示します:


(注)  

--outfile オプションをすべての ShowAnalytics コマンド オプションとともに使用して、コマンド出力をファイルに複製できます。


switch# ShowAnalytics --evaluate-npuload --outfile output.txt
2020-11-24 13:42:19.510351
There are 4 interfaces to be evaluated. Expected time is 4 minutes 0 seconds
Do you want to continue [Yes|No]? [n]y
Module 1
+-----------+-----------+--------+--------+---------+------+------+-------+------------+----------+
| Interface |    Type   |        ITL/N Count        |      NPU Load %     |  Analyis   | Analysis |
|           |           |  SCSI  |  NVMe  |  Total  | SCSI | NVMe | Total | Start Time | End Time |
+-----------+-----------+--------+--------+---------+------+------+-------+------------+----------+
|   fc1/1   |   Target  |   1    |   0    |    1    | 0.6  | 0.0  |  0.6  |  13:42:40  | 13:43:11 |
|   fc1/2   | Initiator |   1    |   0    |    1    | 0.6  | 0.0  |  0.6  |  13:43:40  | 13:44:11 |
|           |           |        |        |         |      |      |       |            |          |
|   *Total  |           |   2    |   0    |    2    | 1.2  | 0.0  |  1.2  |            |          |
+-----------+-----------+--------+--------+---------+------+------+-------+------------+----------+
Recommended port sampling size: 48

* This total is an indicative reference based on evaluated ports

Errors:
------

Traffic is not running on port fc1/47
Traffic is not running on port fc1/48

次の例は、出力を bootflash: の output.txt という名前のファイルに追加する方法を示しています。このファイルには、すでにいくつかの出力が含まれています:


switch# ShowAnalytics --evaluate-npuload --appendfile  output.txt
2020-11-24 13:45:07.535440
There are 4 interfaces to be evaluated. Expected time is 4 minutes 0 seconds
Do you want to continue [Yes|No]? [n]y
Module 1
+-----------+-----------+--------+--------+---------+------+------+-------+------------+----------+
| Interface |    Type   |        ITL/N Count        |      NPU Load %     |  Analyis   | Analysis |
|           |           |  SCSI  |  NVMe  |  Total  | SCSI | NVMe | Total | Start Time | End Time |
+-----------+-----------+--------+--------+---------+------+------+-------+------------+----------+
|   fc1/1   |   Target  |   1    |   0    |    1    | 0.6  | 0.0  |  0.6  |  13:45:40  | 13:46:11 |
|   fc1/2   | Initiator |   1    |   0    |    1    | 0.6  | 0.0  |  0.6  |  13:46:40  | 13:47:11 |
|           |           |        |        |         |      |      |       |            |          |
|   *Total  |           |   2    |   0    |    2    | 1.2  | 0.0  |  1.2  |            |          |
+-----------+-----------+--------+--------+---------+------+------+-------+------------+----------+
Recommended port sampling size: 48

* This total is an indicative reference based on evaluated ports

Errors:
------

Traffic is not running on port fc1/47
Traffic is not running on port fc1/48

次に、NVMe の VSAN スループット情報を表示する例を示します:


switch# ShowAnalytics --vsan-thput --nvme
2019-05-09 14:02:07.940600
 
 Interface fc16/12
+------+--------+--------+--------+
| VSAN |   Throughput (4s avg)    |
|      | Read   | Write  | Total  |
|      | (MBps) | (MBps) | (MBps) |
+------+--------+--------+--------+
| 3300 | 1605.8 | 1626.8 | 3232.6 |
+------+--------+--------+--------+
Note: This data is only for NVMe

次に、SCSI の VSAN スループット情報を表示する例を示します:


switch# ShowAnalytics --vsan-thput
2019-05-09 14:02:07.940600
 
Interface fc8/17
+------+--------+--------+--------+
| VSAN |   Throughput (4s avg)    |
|      | Read   | Write  | Total  |
|      | (MBps) | (MBps) | (MBps) |
+------+--------+--------+--------+
| 5    | 0.0    | 0.0    | 0.0    |
+------+--------+--------+--------+
 
Interface fc8/18
+------+--------+--------+--------+
| VSAN |   Throughput (4s avg)    |
|      | Read   | Write  | Total  |
|      | (MBps) | (MBps) | (MBps) |
+------+--------+--------+--------+
| 5    | 0.0    | 0.0    | 0.0    |
+------+--------+--------+--------+
 
Interface fc8/19
+------+--------+--------+--------+
| VSAN |   Throughput (4s avg)    |
|      | Read   | Write  | Total  |
|      | (MBps) | (MBps) | (MBps) |
+------+--------+--------+--------+
| 5    | 0.0    | 0.0    | 0.0    |
+------+--------+--------+--------+
 
Interface fc8/20
+------+--------+--------+--------+
| VSAN |   Throughput (4s avg)    |
|      | Read   | Write  | Total  |
|      | (MBps) | (MBps) | (MBps) |
+------+--------+--------+--------+
| 5    | 0.0    | 0.0    | 0.0    |
+------+--------+--------+--------+
 
Interface fc8/21
+------+--------+--------+--------+
| VSAN |   Throughput (4s avg)    |
|      | Read   | Write  | Total  |
|      | (MBps) | (MBps) | (MBps) |
+------+--------+--------+--------+
| 3500 | 301.9  | 302.8  | 604.7  |
+------+--------+--------+--------+
 
Interface fc8/22
+------+--------+--------+--------+
| VSAN |   Throughput (4s avg)    |
|      | Read   | Write  | Total  |
|      | (MBps) | (MBps) | (MBps) |
+------+--------+--------+--------+
| 3500 | 302.7  | 304.8  | 607.5  |
+------+--------+--------+--------+
Note: This data is only for SCSI

次に、ポート チャンネルの VSAN スループット情報を表示する例を示します:


switch# ShowAnalytics --vsan-thput --interface port-channel108
2019-05-09 15:01:32.538121

Interface port-channel108
+------+--------+--------+--------+
| VSAN |   Throughput (4s avg)    |
|      | Read   | Write  | Total  |
|      | (MBps) | (MBps) | (MBps) |
+------+--------+--------+--------+
| 1    | 0.0    | 0.0    | 0.0    |
| 5    | 145.9  | 0.0    | 145.9  |
| 3500 | 561.9  | 558.6  | 1120.5 |
+------+--------+--------+--------+
Note: This data is only for SCSI

次の例は、NVMe のインターフェイスの ITN ごとの未処理の IO を表示する方法を示しています:


switch# ShowAnalytics --outstanding-io --interface fc16/12 --nvme
2019-05-20 11:59:48.306396                                      
 Interface : fc16/12  VSAN : 3300  FCNS_type : Initiator            

+------------------------------------+----------------+
| Initiator |  Target   | Namespace  | Outstanding IO |
+------------------------------------+----------------+
|                                    |  Read | Write  |
|                                    |                |
| 0xc80002  | 0xed0002  |   1        |    3  |  6     |
| 0xc80007  | 0xed0007  |   1        |    5  |  5     |
| 0xc80005  | 0xed0005  |   1        |    1  | 10     |
| 0xc80001  | 0xed0001  |   1        |    2  |  7     |
| 0xc80000  | 0xed0000  |   1        |    6  |  5     |
| 0xc80008  | 0xed0008  |   1        |    1  |  7     |
| 0xc80009  | 0xed0009  |   1        |    3  |  4     |
| 0xc80004  | 0xed0004  |   1        |    3  |  6     |
| 0xc80006  | 0xed0006  |   1        |    2  |  5     |
| 0xc80000  | 0xed0001  |   1        |    3  |  4     |
| 0xc80003  | 0xed0003  |   1        |    4  |  4     |
+------------------------------------+----------------+
Instantaneous Qdepth : 96

次の例は、SCSI のインターフェイスの ITL ごとの未処理の IO を表示する方法を示しています:


switch# ShowAnalytics --outstanding-io --interface fc8/7 
2019-05-20 11:59:48.306396                                      

Interface : fc8/7  VSAN : 5  FCNS_type : Target

+---------------------------------------+----------------+
|          Initiator|Target|LUN         | Outstanding IO |
+---------------------------------------+----------------+
|                                       |  Read | Write  |
|                                       |                |
| 0xed0320|0xef0580|0001-0000-0000-0000 |    2  |  0     |
| 0xed0320|0xef0580|0002-0000-0000-0000 |    1  |  0     |
| 0xed0320|0xef0580|0003-0000-0000-0000 |    1  |  0     |
| 0xed0320|0xef0580|0004-0000-0000-0000 |    1  |  0     |
| 0xed0320|0xef0580|0005-0000-0000-0000 |    1  |  0     |
| 0xed0320|0xef0580|0006-0000-0000-0000 |    1  |  0     |
| 0xed0320|0xef0580|0007-0000-0000-0000 |    1  |  0     |
| 0xed0320|0xef0580|0008-0000-0000-0000 |    1  |  0     |
| 0xed0320|0xef0580|0009-0000-0000-0000 |    1  |  0     |
| 0xed0320|0xef0580|000a-0000-0000-0000 |    1  |  0     |
+---------------------------------------+----------------+
Instantaneous Qdepth : 11 

(注)  

出力の Instantaneous Qdepth 値は、指定されたインターフェイスで現在現用系な IO の数を表します。


次の例は、インターフェイスの ITN ごとの未処理の IO を表示し、出力を 10 レコードに制限し、NVMe のデータを定期的に更新する方法を示しています:


switch# ShowAnalytics --outstanding-io --interface fc8/7  --limit 10 --refresh --nvme
2019-05-20 12:00:21.028228                                                             
 Interface : fc16/12  VSAN : 3300  FCNS_type : Initiator            

+------------------------------------+----------------+
| Initiator |  Target   | Namespace  | Outstanding IO |
+------------------------------------+----------------+
|                                    |  Read | Write  |
|                                    |                |
| 0xc80002  | 0xed0002  |   1        |    2  |  7     |
| 0xc80007  | 0xed0007  |   1        |    3  |  5     |
| 0xc80005  | 0xed0005  |   1        |    1  |  8     |
| 0xc80001  | 0xed0001  |   1        |    1  |  0     |
| 0xc80000  | 0xed0000  |   1        |    5  |  6     |
+------------------------------------+----------------+

次の例は、インターフェイスの ITL ごとの未処理の IO を表示し、出力を 10 レコードに制限し、SCSI のデータを定期的に更新する方法を示しています:


switch# ShowAnalytics --outstanding-io --interface fc8/7  --limit 10 --refresh
2019-05-20 12:00:21.028228                                                             

Interface : fc8/7  VSAN : 5  FCNS_type : Target

+---------------------------------------+----------------+
|          Initiator|Target|LUN         | Outstanding IO |
+---------------------------------------+----------------+
|                                       |  Read | Write  |
|                                       |                |
| 0xed0320|0xef0580|0001-0000-0000-0000 |    0  |  0     |
| 0xed0320|0xef0580|0002-0000-0000-0000 |    1  |  0     |
| 0xed0320|0xef0580|0003-0000-0000-0000 |    1  |  0     |
| 0xed0320|0xef0580|0004-0000-0000-0000 |    1  |  0     |
| 0xed0320|0xef0580|0005-0000-0000-0000 |    0  |  0     |
| 0xed0320|0xef0580|0006-0000-0000-0000 |    0  |  0     |
| 0xed0320|0xef0580|0007-0000-0000-0000 |    1  |  0     |
| 0xed0320|0xef0580|0008-0000-0000-0000 |    0  |  0     |
| 0xed0320|0xef0580|0009-0000-0000-0000 |    1  |  0     |
| 0xed0320|0xef0580|000a-0000-0000-0000 |    1  |  0     |
+---------------------------------------+----------------+
Estimated Qdepth : 6

この例では、ターゲット ITL のイニシエータ識別子 0xee008e、ターゲット識別子0xe80b22、および LUN識別子 0060-0000-0000-0000 のヒストグラムを表示する方法を示します


switch# ShowAnalytics --histogram --initiator-itl --initiator 0xee008e --target 0xe80b22 --lun 0060-0000-0000-0000                                                          

Starting histogram monitor session
Session ID: 15789
+----------------+------------+
|                | 25-05-2022 |
| Metric         |  15:29:30  |
+----------------+------------+
| IOPS Read      |     0      |
| IOPS Write     |     11     |
| ECT Read       |   0 ns     |
| ECT Write      |  28.1 ms   |
| DAL Read       |   0 ns     |
| DAL Write      |  13.7 ms   |
| FAILURES Read  |     0      |
| FAILURES Write |     0      |
| ABORTS Read    |     0      |
| ABORTS Write   |     0      |
+----------------+------------+
Histogram data will get updated every 5 mins

この例では、ターゲット ITL のイニシエータ識別子 0xee008e およびターゲット識別子0xe80b22 のヒストグラムを表示する方法を示します。


switch# ShowAnalytics --histogram --initiator-it --initiator 0xee008e --target 0xe80b22

Starting histogram monitor session
Session ID: 16205
+----------------+------------+
|                | 25-05-2022 |
| Metric         |  15:30:13  |
+----------------+------------+
| IOPS Read      |     0      |
| IOPS Write     |    106     |
| ECT Read       |   0 ns     |
| ECT Write      |  28.1 ms   |
| DAL Read       |   0 ns     |
| DAL Write      |  13.7 ms   |
| FAILURES Read  |     0      |
| FAILURES Write |     0      |
| ABORTS Read    |     0      |
| ABORTS Write   |     0      |
+----------------+------------+
Histogram data will get updated every 5 mins

この例は、すべてのセッションのヒストグラムを表示する方法を示しています。


switch# ShowAnalytics --histogram --show-sessions

+------------+----------------------------------------------------------------------------------------------------------------------------+
| Session ID | Arguments                                                                                                                  |
+------------+----------------------------------------------------------------------------------------------------------------------------+
|      15789 | --initiator-itl --initiator 0xee008e --target 0xe80b22 --lun 0060-0000-0000-0000 --interval 5 --metric IOPS,ECT,DAL,ERRORS |
|      16205 | --initiator-it --initiator 0xee008e --target 0xe80b22 --interval 5 --metric IOPS,ECT,DAL,ERRORS                            |
|      20924 | --target-itl --initiator 0xc80ba3 --target 0xc804e3 --lun 0002-0000-0000-0000 --interval 5 --metric IOPS,ECT,DAL,ERRORS    |
+------------+----------------------------------------------------------------------------------------------------------------------------+

Analytic-scale184# ShowAnalytics --histogram --sessionId 16205
+----------------+------------+------------+------------+
|                | 25-05-2022 | 25-05-2022 | 25-05-2022 |
| Metric         |  15:40:15  |  15:35:14  |  15:30:13  |
+----------------+------------+------------+------------+
| IOPS Read      |     0      |     0      |     0      |
| IOPS Write     |     95     |    142     |    106     |
| ECT Read       |   0 ns     |   0 ns     |   0 ns     |
| ECT Write      |  28.2 ms   |  27.7 ms   |  28.1 ms   |
| DAL Read       |   0 ns     |   0 ns     |   0 ns     |
| DAL Write      |  13.7 ms   |  13.6 ms   |  13.7 ms   |
| FAILURES Read  |     0      |     0      |     0      |
| FAILURES Write |     0      |     0      |     0      |
| ABORTS Read    |     0      |     0      |     0      |
| ABORTS Write   |     0      |     0      |     0      |
+----------------+------------+------------+------------+

この例は、停止した特定のセッション 15789 のヒストグラムを表示する方法を示しています。


switch# ShowAnalytics --histogram --stop-session --sessionId 15789

Stopping session id: 15789

Analytic-scale184# ShowAnalytics --histogram --initiator-itn --initiator 0xc80960 --target 0xe80641 --namespace 3
Starting histogram monitor session
Session ID: 27792
+----------------+------------+
|                | 25-05-2022 |
| Metric         |  15:47:11  |
+----------------+------------+
| IOPS Read      |     0      |
| IOPS Write     |     0      |
| ECT Read       |  433.0 us  |
| ECT Write      |   1.0 ms   |
| DAL Read       |  421.0 us  |
| DAL Write      |  339.0 us  |
| FAILURES Read  |     0      |
| FAILURES Write |     0      |
| ABORTS Read    |     0      |
| ABORTS Write   |     0      |
+----------------+------------+
Histogram data will get updated every 5 mins

この例は、5 分ごとにイニシエータ識別子 0xee008e とターゲット識別子 0xe80b22 の IOPS、ECT、DAL、エラーなどのメトリックの詳細を含むヒストグラムを表示する方法を示しています。


switch# ShowAnalytics --histogram --initiator-it --initiator 0xee008e --target 0xe80b22 --interval 5 --metric IOPS,ECT,DAL,ERRORS

Data collected at : Wed, 25 May 2022 16:20:12 +0530

+----------------+------------+------------+------------+------------+------------+------------+------------+------------+------------+------------+
|                | 25-05-2022 | 25-05-2022 | 25-05-2022 | 25-05-2022 | 25-05-2022 | 25-05-2022 | 25-05-2022 | 25-05-2022 | 25-05-2022 | 25-05-2022 |
| Metric         |  16:15:22  |  16:10:21  |  16:05:19  |  16:00:18  |  15:55:18  |  15:50:17  |  15:45:16  |  15:40:15  |  15:35:14  |  15:30:13  |
+----------------+------------+------------+------------+------------+------------+------------+------------+------------+------------+------------+
| IOPS Read      |     0      |     0      |     0      |     0      |     0      |     0      |     0      |     0      |     0      |     0      |
| IOPS Write     |    138     |    104     |     50     |    135     |     68     |     74     |     89     |     95     |    142     |    106     |
| ECT Read       |   0 ns     |   0 ns     |   0 ns     |   0 ns     |   0 ns     |   0 ns     |   0 ns     |   0 ns     |   0 ns     |   0 ns     |
| ECT Write      |  28.2 ms   |  27.8 ms   |  28.3 ms   |  28.0 ms   |  28.0 ms   |  28.0 ms   |  27.9 ms   |  28.2 ms   |  27.7 ms   |  28.1 ms   |
| DAL Read       |   0 ns     |   0 ns     |   0 ns     |   0 ns     |   0 ns     |   0 ns     |   0 ns     |   0 ns     |   0 ns     |   0 ns     |
| DAL Write      |  13.7 ms   |  13.6 ms   |  13.8 ms   |  13.7 ms   |  13.7 ms   |  13.7 ms   |  13.7 ms   |  13.7 ms   |  13.6 ms   |  13.7 ms   |
| FAILURES Read  |     0      |     0      |     0      |     0      |     0      |     0      |     0      |     0      |     0      |     0      |
| FAILURES Write |     0      |     0      |     0      |     0      |     0      |     0      |     0      |     0      |     0      |     0      |
| ABORTS Read    |     0      |     0      |     0      |     0      |     0      |     0      |     0      |     0      |     0      |     0      |
| ABORTS Write   |     0      |     0      |     0      |     0      |     0      |     0      |     0      |     0      |     0      |     0      |
+----------------+------------+------------+------------+------------+------------+------------+------------+------------+------------+------------+

この例は、イニシエータ識別子 0xee008e およびターゲット識別子 0xe80b22 のヒストグラムを、リフレッシュ時間 120 分で表示する方法を示しています。


switch# ShowAnalytics --histogram --initiator-it --initiator 0xee008e --target 0xe80b22 --interval 120

Starting histogram monitor session
Session ID: 21352
+----------------+------------+
|                | 25-05-2022 |
| Metric         |  16:21:29  |
+----------------+------------+
| IOPS Read      |     0      |
| IOPS Write     |     84     |
| ECT Read       |   0 ns     |
| ECT Write      |  28.1 ms   |
| DAL Read       |   0 ns     |
| DAL Write      |  13.7 ms   |
| FAILURES Read  |     0      |
| FAILURES Write |     0      |
| ABORTS Read    |     0      |
| ABORTS Write   |     0      |
+----------------+------------+
Histogram data will get updated every 120 mins

この例は、イニシエータ識別子 0xee008e およびターゲット識別子 0xe80b22 の ECT や DAL などのメトリックの詳細を含むヒストグラムを 5 分ごとに表示する方法を示しています。


switch# ShowAnalytics --histogram --initiator-it --initiator 0xee008e --target 0xe80b22 --metric ECT,DAL

Starting histogram monitor session
Session ID: 22073
+-----------+------------+
|           | 25-05-2022 |
| Metric    |  16:22:35  |
+-----------+------------+
| ECT Read  |   0 ns     |
| ECT Write |  28.1 ms   |
| DAL Read  |   0 ns     |
| DAL Write |  13.7 ms   |
+-----------+------------+
Histogram data will get updated every 5 mins

この例は、イニシエータ識別子 0xee008e のヒストグラムを 5 分ごとに表示する方法を示しています。


switch# ShowAnalytics --histogram --initiator 0xee008e

Starting histogram monitor session
Session ID: 23254
+----------------+------------+
|                | 25-05-2022 |
| Metric         |  16:24:10  |
+----------------+------------+
| IOPS Read      |     0      |
| IOPS Write     |    124     |
| ECT Read       |   0 ns     |
| ECT Write      |  28.2 ms   |
| DAL Read       |   0 ns     |
| DAL Write      |  13.8 ms   |
| FAILURES Read  |     0      |
| FAILURES Write |     0      |
| ABORTS Read    |     0      |
| ABORTS Write   |     0      |
+----------------+------------+
Histogram data will get updated every 5 mins

この例は、ターゲット 0xc804e3 のヒストグラムを 5 分ごとに表示する方法を示しています。


switch# ShowAnalytics --histogram --target 0xc804e3

Starting histogram monitor session
Session ID: 24003
+----------------+------------+
|                | 25-05-2022 |
| Metric         |  16:25:07  |
+----------------+------------+
| IOPS Read      |     0      |
| IOPS Write     |    3939    |
| ECT Read       |   0 ns     |
| ECT Write      |  23.3 ms   |
| DAL Read       |   0 ns     |
| DAL Write      |  10.7 ms   |
| FAILURES Read  |     0      |
| FAILURES Write |   30429    |
| ABORTS Read    |     0      |
| ABORTS Write   |     0      |
+----------------+------------+
Histogram data will get updated every 5 mins

フローごとの輻輳ドロップの表示

SAN アナリティクス機能では、フローごとのパケット タイムアウト ドロップ数が表示されます。ポートのタイムスタンプとともにドロップされたパケットの数が表示されます。

フローごとのパケット ドロップ数を表示するには、次のコマンドを実行します。

switch# show analytics flow congestion-drops

例:フローごとの輻輳ドロップの表示

この例は、輻輳が原因でフレームがドロップされるフローを示しています。送信元と宛先の FCID、IT ペアの差分フレーム ドロップ数、ドロップのタイムスタンプが表示されます。


switch# show analytics flow congestion-drops

|=====================================================================================|
| Source       |Destination            | Congestion    |     Timestamp                |
| INTF  | VSAN |  FCID     |  FCID     | Drops(delta)  |                              |
|=====================================================================================|
| fc2/13| 0002 | 0x9900E1  | 0x640000  |  00000105     | 1. 09/13/17 11:09:48.762     |
| fc2/13| 0002 | 0x9900E1  | 0x640000  |  00000002     | 2. 09/13/17 09:05:39.527     |
| fc2/13| 0002 | 0x990000  | 0x640020  |  00000002     | 3. 09/13/17 09:05:39.527     |
|=====================================================================================|
| fc2/31| 0002 | 0x640000  | 0x9900E1  |  00000084     | 1. 09/12/17 08:17:11.905     |
| fc2/31| 0002 | 0x640000  | 0x9900E1  |  00000076     | 2. 09/12/17 05:50:37.721     |
| fc2/31| 0002 | 0x640000  | 0x9900E1  |  00000067     | 3. 09/12/17 03:24:03.319     |
| fc2/31| 0002 | 0x640000  | 0x9900E1  |  00000088     | 4. 09/12/17 00:57:28.019     |
| fc2/31| 0002 | 0x640000  | 0x9900E1  |  00000088     | 5. 09/11/17 22:30:53.723     |
| fc2/31| 0002 | 0x640000  | 0x9900E1  |  00000086     | 6. 09/11/17 20:04:18.001     |
| fc2/31| 0002 | 0x640000  | 0x9900E1  |  00000026     | 7. 09/11/17 17:37:24.273     |
| fc2/31| 0002 | 0x640000  | 0x9900E1  |  00000076     | 8. 09/11/17 15:10:50.240     |
| fc2/31| 0002 | 0x640000  | 0x9900E1  |  00000074     | 9. 09/11/17 12:44:15.866     |
| fc2/31| 0002 | 0x640000  | 0x9900E1  |  00000087     |10. 09/11/17 10:17:41.402     |
| fc2/31| 0002 | 0x640000  | 0x9900E1  |  00000086     |11. 09/11/17 07:51:10.412     |
| fc2/31| 0002 | 0x640000  | 0x9900E1  |  00000084     |12. 09/11/17 05:24:35.981     |
| fc2/31| 0002 | 0x640000  | 0x9900E1  |  00000083     |13. 09/11/17 02:58:01.067     |
| fc2/31| 0002 | 0x640000  | 0x9900E1  |  00000086     |14. 09/11/17 00:31:26.709     |
| fc2/31| 0002 | 0x640000  | 0x9900E1  |  00000079     |15. 09/10/17 22:04:51.399     |
| fc2/31| 0002 | 0x640000  | 0x9900E1  |  00000084     |16. 09/10/17 19:38:17.217     |
| fc2/31| 0002 | 0x640000  | 0x9900E1  |  00000082     |17. 09/10/17 17:11:42.594     |
| fc2/31| 0002 | 0x640000  | 0x9900E1  |  00000086     |18. 09/10/17 14:44:52.786     |
| fc2/31| 0002 | 0x640000  | 0x9900E1  |  00000089     |19. 09/10/17 12:18:18.394     |
| fc2/31| 0002 | 0x640000  | 0x9900E1  |  00000087     |20. 09/10/17 09:51:44.067     |
|=====================================================================================|

SAN アナリティクスの確認

次に、SAN アナリティクス機能が有効になっているインターフェイスのリストの例を示します。


switch# show running-config analytics 

!Command: show running-config analytics
!Running configuration last done at: Mon Apr  1 05:27:54 2019
!Time: Mon Apr  1 05:28:42 2019

version 8.4(0)SK(1)
feature analytics
analytics port-sampling module 4 size 12 interval 30

analytics query "select all from fc-scsi.scsi_target_itl_flow" name VI_scsi type periodic interval 30  differential clear
analytics query "select all from fc-nvme.nvme_target_itn_flow" name nvme-184 type periodic interval 30  differential clear

interface fc4/25
  analytics type fc-scsi

interface fc4/26
  analytics type fc-nvme

interface fc12/44
  analytics type fc-scsi
  analytics type fc-nvme


次に、スイッチにインストールされている設定済みのプッシュ クエリのリストの例を示します。


switch# show analytics query all
Total queries:2
============================
Query Name      :VI_scsi
Query String    :select all from fc-scsi.scsi_target_itl_flow
Query Type      :periodic, interval 30
Query Options   :differential clear

Query Name      :nvme-184
Query String    :select all from fc-nvme.nvme_target_itn_flow
Query Type      :periodic, interval 30
Query Options   :differential clear


次に、モジュールごとの NPU の負荷、ITL、および ITN カウントを表示する例を示します。


switch# show analytics system-load 
 n/a - not applicable
 ----------------------------------- Analytics System Load Info -------------------------------
 | Module | NPU Load (in %) | ITLs   ITNs   Both  |        Hosts        |       Targets       |
 |        | SCSI NVMe Total | SCSI   NVMe   Total | SCSI   NVMe   Total | SCSI   NVMe   Total |
 ----------------------------------------------------------------------------------------------
 |   1    | 0    0    0     | 0      0      0     | 0      0      0     | 0      0      0     |
 |   4    | 64   0    64    | 20743  0      20743 | 0      0      0     | 346    0      346   |
 |   5    | 0    0    0     | 0      0      0     | 0      0      0     | 0      0      0     |
 |   8    | 0    0    0     | 0      0      0     | 0      0      0     | 0      0      0     |
 |   12   | 0    12   12    | 0      300    300   | 0      0      0     | 0      40     40    |
 |   13   | 0    0    0     | 0      0      0     | 0      0      0     | 0      0      0     |
 |   18   | 0    13   13    | 1      1      2     | 1      1      2     | 0      0      0     |
 | Total  | n/a  n/a  n/a   | 20744  301    21045 | 1      1      2     | 346    40     386   |

As of Mon Apr  1 05:31:10 2019

(注)  

show analytics system-load コマンドは、アクティブおよび非アクティブの ITL カウントを含む、すべての ITL カウントに基づいたシステム負荷情報を提供します。したがって、purge analytics query 「query_string」 コマンドを使用して非アクティブな ITL カウントを削除してから、このコマンドを実行してアクティブな ITL カウントを取得することをお勧めします。


この例では、すべてのアクティブ モジュールの NPU 負荷、ITL、および ITN を表示します。


switch# ShowAnalytics --systemload-active 

This will run differential query on scsi_initiator_itl_flow, scsi_target_itl_flow,
nvme_initiator_itn_flow, nvme_target_itn_flow, scsi_initiator, scsi_target,
nvme_initiator and nvme_target  or use the result of installed query if present
 Do you want to continue [Yes|No]? [n]y

Data collected at : Wed, 25 May 2022 16:29:24 +0530

Using result of installed queries: dcnmtgtITN,dcnmtgtITL

+--------+--------+--------+---------+------+------+-------+-------+-------+--------+
| Module |        ITL/N Count        |      Initiators     |        Targets         |
|        |  SCSI  |  NVMe  |  Total  | SCSI | NVMe | Total |  SCSI |  NVMe |  Total |
+--------+--------+--------+---------+------+------+-------+-------+-------+--------+
|   1    |  5571  |    0   |   5571  |   2  |   0  |    2  |   55  |    0  |   55   |
|   2    |  14904 |    1   |   14905 |  191 |   1  |   192 |   191 |    0  |   191  |
|   3    |  7588  |    0   |   7588  |  128 |   0  |   128 |   128 |    0  |   128  |
|   5    |    0   |    0   |     0   |  56  |   0  |   56  |    0  |    0  |    0   |
|   12   |    0   |    0   |     0   |   0  |   0  |    0  |    0  |    1  |    1   |
| Total  |  28063 |    1   |   28064 |  377 |   1  |   378 |   374 |    1  |   375  |
+--------+--------+--------+---------+------+------+-------+-------+-------+--------+

この例では、特定のアクティブ モジュールの NPU 負荷、ITL、および ITN の詳細を表示します。


switch# ShowAnalytics --systemload-active --module 1 --detail 

This will run differential query on scsi_initiator_itl_flow, scsi_target_itl_flow,
nvme_initiator_itn_flow, nvme_target_itn_flow, scsi_initiator, scsi_target,
nvme_initiator and nvme_target  or use the result of installed query if present
 Do you want to continue [Yes|No]? [n]y

Data collected at : Wed, 25 May 2022 16:35:35 +0530

Using result of installed queries: dcnmtgtITN,dcnmtgtITL

+--------+--------+--------+---------+------+------+-------+-------+-------+--------+
| Module |        ITL/N Count        |      Initiators     |        Targets         |
|        |  SCSI  |  NVMe  |  Total  | SCSI | NVMe | Total |  SCSI |  NVMe |  Total |
+--------+--------+--------+---------+------+------+-------+-------+-------+--------+
|   1    |  5571  |    0   |   5571  |   2  |   0  |    2  |   55  |    0  |   55   |
| Total  |  5571  |    0   |   5571  |   2  |   0  |    2  |   55  |    0  |   55   |
+--------+--------+--------+---------+------+------+-------+-------+-------+--------+

Detailed output for DS-X9748-3072K9 modules
Module : 1
+-----------------------------+--------+--------+---------+------+------+-------+-------+-------+--------+
|            Ports            |        ITL/N Count        |      Initiators     |        Targets         |
|                             |  SCSI  |  NVMe  |  Total  | SCSI | NVMe | Total |  SCSI |  NVMe |  Total |
+-----------------------------+--------+--------+---------+------+------+-------+-------+-------+--------+
|   fc1/1,fc1/3,fc1/5,fc1/7   |  186   |   0    |   186   |  0   |  0   |   0   |   2   |   0   |   2    |
|   fc1/2,fc1/4,fc1/6,fc1/8   |  186   |   0    |   186   |  0   |  0   |   0   |   2   |   0   |   2    |
|  fc1/9,fc1/11,fc1/13,fc1/15 |  185   |   0    |   185   |  0   |  0   |   0   |   2   |   0   |   2    |
| fc1/10,fc1/12,fc1/14,fc1/16 |   93   |   0    |    93   |  0   |  0   |   0   |   1   |   0   |   1    |
| fc1/17,fc1/19,fc1/21,fc1/23 |  186   |   0    |   186   |  0   |  0   |   0   |   2   |   0   |   2    |
| fc1/18,fc1/20,fc1/22,fc1/24 |  186   |   0    |   186   |  0   |  0   |   0   |   2   |   0   |   2    |
| fc1/25,fc1/27,fc1/29,fc1/31 |  171   |   0    |   171   |  2   |  0   |   2   |   0   |   0   |   0    |
| fc1/33,fc1/35,fc1/37,fc1/39 |  2188  |   0    |   2188  |  0   |  0   |   0   |   22  |   0   |   22   |
| fc1/34,fc1/36,fc1/38,fc1/40 |  2190  |   0    |   2190  |  0   |  0   |   0   |   22  |   0   |   22   |
|            Total            |  5571  |   0    |   5571  |  2   |  0   |   2   |   55  |   0   |   55   |
+-----------------------------+--------+--------+---------+------+------+-------+-------+-------+--------+

次に、ポート サンプリング ステータスと瞬間的な NPU の負荷を確認する例を示します。


switch# show analytics port-sampling module 1
Sampling Window Size: 12
Rotation Interval: 30
NPU LOAD : 64%      [SCSI 64%, NVMe 0%]  
========================================================================
  Port               Monitored Start Time           Monitored End Time
========================================================================
  fc4/25             04/01/19 - 05:25:29            04/01/19 - 05:25:59    
  fc4/26             04/01/19 - 05:25:29            04/01/19 - 05:25:59    
  fc4/27             04/01/19 - 05:25:29            04/01/19 - 05:25:59    
  fc4/28             04/01/19 - 05:25:29            04/01/19 - 05:25:59    
  fc4/29             04/01/19 - 05:25:29            04/01/19 - 05:25:59    
  fc4/30             04/01/19 - 05:25:29            04/01/19 - 05:25:59    
  fc4/31             04/01/19 - 05:25:29            04/01/19 - 05:25:59    
  fc4/32             04/01/19 - 05:25:29            04/01/19 - 05:25:59    
  fc4/33             04/01/19 - 05:25:29            04/01/19 - 05:25:59    
  fc4/34             04/01/19 - 05:25:29            04/01/19 - 05:25:59    
  fc4/35             04/01/19 - 05:25:29            04/01/19 - 05:25:59    
  fc4/36             04/01/19 - 05:25:29            04/01/19 - 05:25:59    
  fc4/37*            04/01/19 - 05:25:59            -                      
  fc4/38*            04/01/19 - 05:25:59            -                      
  fc4/39*            04/01/19 - 05:25:59            -                      
  fc4/40*            04/01/19 - 05:25:59            -                      
  fc4/41*            04/01/19 - 05:25:59            -                      
  fc4/42*            04/01/19 - 05:25:59            -                      
  fc4/43*            04/01/19 - 05:25:59            -                      
  fc4/44*            04/01/19 - 05:25:59            -                      
  fc4/45*            04/01/19 - 05:25:59            -                      
  fc4/46*            04/01/19 - 05:25:59            -                      
  fc4/47*            04/01/19 - 05:25:59            -                      
  fc4/48*            04/01/19 - 05:25:59            -                      
========================================================================
! - Denotes port is link down but analytics enabled.
* - Denotes port in active analytics port sampling window.


ポートの横にあるアスタリスク記号(*)は、そのポートが現在サンプリングされていることを示しています。

次に、すでに設定されているプッシュ クエリの出力の例を示します。


switch# show analytics query name iniitl result 
{ "values": {
        "1": {
                "port": "fc1/6",
                "vsan": "10",
                "app_id": "255",
                "initiator_id": "0xe800a0",
                "target_id": "0xd601e0",
                "lun": "0000-0000-0000-0000",
                "active_io_read_count": "0",
                "active_io_write_count": "7",
                "total_read_io_count": "0",
                "total_write_io_count": "1008608573",
                "total_seq_read_io_count": "0",
                "total_seq_write_io_count": "1",
                "total_read_io_time": "0",
                "total_write_io_time": "370765952314",
                "total_read_io_initiation_time": "0",
                "total_write_io_initiation_time": "52084968152",
                "total_read_io_bytes": "0",
                "total_write_io_bytes": "2065630357504",
                "total_read_io_inter_gap_time": "0",
                "total_write_io_inter_gap_time": "16171468343166",
                "total_time_metric_based_read_io_count": "0",
                "total_time_metric_based_write_io_count": "1008608566",
                "total_time_metric_based_read_io_bytes": "0",
                "total_time_metric_based_write_io_bytes": "2065630343168",
                "read_io_rate": "0",
                "peak_read_io_rate": "0",
                "write_io_rate": "16070",
                "peak_write_io_rate": "32468",
                "read_io_bandwidth": "0",
                "peak_read_io_bandwidth": "0",
                "write_io_bandwidth": "32912384",
                "peak_write_io_bandwidth": "66494976",
                "read_io_size_min": "0",
                "read_io_size_max": "0",
                "write_io_size_min": "2048",
                "write_io_size_max": "2048",
                "read_io_completion_time_min": "0",
                "read_io_completion_time_max": "0",
                "write_io_completion_time_min": "111",
                "write_io_completion_time_max": "9166",
                "read_io_initiation_time_min": "0",
                "read_io_initiation_time_max": "0",
                "write_io_initiation_time_min": "36",
                "write_io_initiation_time_max": "3265",
                "read_io_inter_gap_time_min": "0",
                "read_io_inter_gap_time_max": "0",
                "write_io_inter_gap_time_min": "100",
                "write_io_inter_gap_time_max": "1094718",
                "peak_active_io_read_count": "0",
                "peak_active_io_write_count": "23",
                "read_io_aborts": "0",
                "write_io_aborts": "0",
                "read_io_failures": "0",
                "write_io_failures": "0",
                "read_io_scsi_check_condition_count": "0",
                "write_io_scsi_check_condition_count": "0",
                "read_io_scsi_busy_count": "0",
                "write_io_scsi_busy_count": "0",
                "read_io_scsi_reservation_conflict_count": "0",
                "write_io_scsi_reservation_conflict_count": "0",
                "read_io_scsi_queue_full_count": "0",
                "write_io_scsi_queue_full_count": "0",
                "sampling_start_time": "1529993232",
                "sampling_end_time": "1529993260"
        },
        "2": {
                "port": "fc1/6",
                "vsan": "10",
                "app_id": "255",
                "initiator_id": "0xe800a1",
                "target_id": "0xd601e1",
                "lun": "0000-0000-0000-0000",
                "active_io_read_count": "0",
                "active_io_write_count": "8",
                "total_read_io_count": "0",
                "total_write_io_count": "1004271260",
                "total_seq_read_io_count": "0",
                "total_seq_write_io_count": "1",
                "total_read_io_time": "0",
                "total_write_io_time": "370004164726",
                "total_read_io_initiation_time": "0",
                "total_write_io_initiation_time": "51858511487",
                "total_read_io_bytes": "0",
                "total_write_io_bytes": "2056747540480",
                "total_read_io_inter_gap_time": "0",
                "total_write_io_inter_gap_time": "16136686881766",
                "total_time_metric_based_read_io_count": "0",
                "total_time_metric_based_write_io_count": "1004271252",
                "total_time_metric_based_read_io_bytes": "0",
                "total_time_metric_based_write_io_bytes": "2056747524096",
                "read_io_rate": "0",
                "peak_read_io_rate": "0",
                "write_io_rate": "16065",
                "peak_write_io_rate": "16194",
                "read_io_bandwidth": "0",
                "peak_read_io_bandwidth": "0",
                "write_io_bandwidth": "32901632",
                "peak_write_io_bandwidth": "33165824",
                "read_io_size_min": "0",
                "read_io_size_max": "0",
                "write_io_size_min": "2048",
                "write_io_size_max": "2048",
                "read_io_completion_time_min": "0",
                "read_io_completion_time_max": "0",
                "write_io_completion_time_min": "114",
                "write_io_completion_time_max": "9019",
                "read_io_initiation_time_min": "0",
                "read_io_initiation_time_max": "0",
                "write_io_initiation_time_min": "37",
                "write_io_initiation_time_max": "3158",
                "read_io_inter_gap_time_min": "0",
                "read_io_inter_gap_time_max": "0",
                "write_io_inter_gap_time_min": "101",
                "write_io_inter_gap_time_max": "869035",
                "peak_active_io_read_count": "0",
                "peak_active_io_write_count": "19",
                "read_io_aborts": "0",
                "write_io_aborts": "0",
                "read_io_failures": "0",
                "write_io_failures": "0",
                "read_io_scsi_check_condition_count": "0",
                "write_io_scsi_check_condition_count": "0",
                "read_io_scsi_busy_count": "0",
                "write_io_scsi_busy_count": "0",
                "read_io_scsi_reservation_conflict_count": "0",
                "write_io_scsi_reservation_conflict_count": "0",
                "read_io_scsi_queue_full_count": "0",
                "write_io_scsi_queue_full_count": "0",
                "sampling_start_time": "1529993232",
                "sampling_end_time": "1529993260"
        }
}}


(注)  

これらのクエリの出力は JSON 形式です。


この例は、fc-scsi 分析タイプでサポートされているビュー インスタンスのリストを示しています。


switch# show analytics schema fc-scsi views

fc-scsi db schema tables:
        port
        logical_port
        app
        scsi_target
        scsi_initiator
        scsi_target_app
        scsi_initiator_app
        scsi_target_tl_flow
        scsi_target_it_flow
        scsi_initiator_it_flow
        scsi_target_itl_flow
        scsi_initiator_itl_flow
        scsi_target_io
        scsi_initiator_io


この例は、fc-nvme 分析タイプでサポートされているビュー インスタンスのリストを示しています。


switch# show analytics schema fc-nvme views

fc-nvme db schema tables:
        port
        logical_port
        app
        nvme_target
        nvme_initiator
        nvme_target_app
        nvme_initiator_app
        nvme_target_tn_flow
        nvme_target_it_flow
        nvme_initiator_it_flow
        nvme_target_itn_flow
        nvme_initiator_itn_flow
        nvme_target_io
        nvme_initiator_io


この例は、fc-scsi.port ビュー インスタンスでサポートされているフロー メトリックのリストを示しています。


(注)  

出力の exceed_count カウンタは、将来の Cisco MDS NX-OS リリースでサポートされる予定です。


switch# show analytics schema fc-scsi view-instance port

fc-scsi.port table schema columns:
        *port
         scsi_target_count
         scsi_initiator_count
         io_app_count
         logical_port_count
         scsi_target_app_count
         scsi_initiator_app_count
         active_io_read_count
         active_io_write_count
         scsi_target_it_flow_count
         scsi_initiator_it_flow_count
         scsi_target_itl_flow_count
         scsi_initiator_itl_flow_count
         scsi_target_tl_flow_count
         total_abts_count
         total_read_io_count
         total_write_io_count
         total_seq_read_io_count
         total_seq_write_io_count
         total_read_io_time
         total_write_io_time
         total_read_io_initiation_time
         total_write_io_initiation_time
         total_read_io_bytes
         total_write_io_bytes
         total_read_io_inter_gap_time
         total_write_io_inter_gap_time
         total_time_metric_based_read_io_count
         total_time_metric_based_write_io_count
         total_time_metric_based_read_io_bytes
         total_time_metric_based_write_io_bytes
         read_io_rate
         peak_read_io_rate
         write_io_rate
         peak_write_io_rate
         read_io_bandwidth
         peak_read_io_bandwidth
         write_io_bandwidth
         peak_write_io_bandwidth
         read_io_size_min
         read_io_size_max
         write_io_size_min
         write_io_size_max
         read_io_completion_time_min
         read_io_completion_time_max
         write_io_completion_time_min
         write_io_completion_time_max
         read_io_initiation_time_min
         read_io_initiation_time_max
         write_io_initiation_time_min
         write_io_initiation_time_max
         read_io_inter_gap_time_min
         read_io_inter_gap_time_max
         write_io_inter_gap_time_min
         write_io_inter_gap_time_max
         peak_active_io_read_count
         peak_active_io_write_count
         read_io_aborts
         write_io_aborts
         read_io_failures
         write_io_failures
         read_io_timeouts
         write_io_timeouts
         read_io_scsi_check_condition_count
         write_io_scsi_check_condition_count
         read_io_scsi_busy_count
         write_io_scsi_busy_count
         read_io_scsi_reservation_conflict_count
         write_io_scsi_reservation_conflict_count
         read_io_scsi_queue_full_count
         write_io_scsi_queue_full_count
         read_io_rate_exceed_count
         write_io_rate_exceed_count
         read_io_bandwidth_exceed_count
         write_io_bandwidth_exceed_count
         read_io_size_min_exceed_count
         read_io_size_max_exceed_count
         write_io_size_min_exceed_count
         write_io_size_max_exceed_count
         read_io_initiation_time_min_exceed_count
         read_io_initiation_time_max_exceed_count
         write_io_initiation_time_min_exceed_count
         write_io_initiation_time_max_exceed_count
         read_io_completion_time_min_exceed_count
         read_io_completion_time_max_exceed_count
         write_io_completion_time_min_exceed_count
         write_io_completion_time_max_exceed_count
         read_io_inter_gap_time_min_exceed_count
         read_io_inter_gap_time_max_exceed_count
         write_io_inter_gap_time_min_exceed_count
         write_io_inter_gap_time_max_exceed_count
         read_io_abort_exceed_count
         write_io_abort_exceed_count
         read_io_failure_exceed_count
         write_io_failure_exceed_count
         sampling_start_time
         sampling_end_time

        (* - indicates the metric is a 'key' for the table)


この例は、fc-nvme.port ビュー インスタンスでサポートされているフロー メトリックのリストを示しています。


(注)  

出力の exceed_count カウンタは、将来の Cisco MDS NX-OS リリースでサポートされる予定です。


switch# show analytics schema fc-nvme view-instance port

fc-nvme.port table schema columns:
        *port
         nvme_target_count
         nvme_initiator_count
         io_app_count
         logical_port_count
         nvme_target_app_count
         nvme_initiator_app_count
         active_io_read_count
         active_io_write_count
         nvme_target_it_flow_count
         nvme_initiator_it_flow_count
         nvme_target_itn_flow_count
         nvme_initiator_itn_flow_count
         nvme_target_tn_flow_count
         total_abts_count
         total_read_io_count
         total_write_io_count
         total_seq_read_io_count
         total_seq_write_io_count
         total_read_io_time
         total_write_io_time
         total_read_io_initiation_time
         total_write_io_initiation_time
         total_read_io_bytes
         total_write_io_bytes
         total_read_io_inter_gap_time
         total_write_io_inter_gap_time
         total_time_metric_based_read_io_count
         total_time_metric_based_write_io_count
         total_time_metric_based_read_io_bytes
         total_time_metric_based_write_io_bytes
         read_io_rate
         peak_read_io_rate
         write_io_rate
         peak_write_io_rate
         read_io_bandwidth
         peak_read_io_bandwidth
         write_io_bandwidth
         peak_write_io_bandwidth
         read_io_size_min
         read_io_size_max
         write_io_size_min
         write_io_size_max
         read_io_completion_time_min
         read_io_completion_time_max
         write_io_completion_time_min
         write_io_completion_time_max
         read_io_initiation_time_min
         read_io_initiation_time_max
         write_io_initiation_time_min
         write_io_initiation_time_max
         read_io_inter_gap_time_min
         read_io_inter_gap_time_max
         write_io_inter_gap_time_min
         write_io_inter_gap_time_max
         peak_active_io_read_count
         peak_active_io_write_count
         read_io_aborts
         write_io_aborts
         read_io_failures
         write_io_failures
         read_io_timeouts
         write_io_timeouts
         read_io_nvme_lba_out_of_range_count
         write_io_nvme_lba_out_of_range_count
         read_io_nvme_ns_not_ready_count
         write_io_nvme_ns_not_ready_count
         read_io_nvme_reservation_conflict_count
         write_io_nvme_reservation_conflict_count
         read_io_nvme_capacity_exceeded_count
         write_io_nvme_capacity_exceeded_count
         read_io_rate_exceed_count
         write_io_rate_exceed_count
         read_io_bandwidth_exceed_count
         write_io_bandwidth_exceed_count
         read_io_size_min_exceed_count
         read_io_size_max_exceed_count
         write_io_size_min_exceed_count
         write_io_size_max_exceed_count
         read_io_initiation_time_min_exceed_count
         read_io_initiation_time_max_exceed_count
         write_io_initiation_time_min_exceed_count
         write_io_initiation_time_max_exceed_count
         read_io_completion_time_min_exceed_count
         read_io_completion_time_max_exceed_count
         write_io_completion_time_min_exceed_count
         write_io_completion_time_max_exceed_count
         read_io_inter_gap_time_min_exceed_count
         read_io_inter_gap_time_max_exceed_count
         write_io_inter_gap_time_min_exceed_count
         write_io_inter_gap_time_max_exceed_count
         read_io_abort_exceed_count
         write_io_abort_exceed_count
         read_io_failure_exceed_count
         write_io_failure_exceed_count
         sampling_start_time
         sampling_end_time

        (* - indicates the metric is a 'key' for the table)


SAN Analytics のトラブルシューティング

ASIC の問題により、交換への応答が別のリンクで受信された場合、ITO テーブルがフラッシュされない可能性があります(ポート チャネル フラップまたはそのようなまれなケースのため)。このイベント自体は分析に影響しません。ただし、これが多数の ITL で発生し、ファブリックに多くのチャーンがある場合(ITO テーブル ヒットを持つ ITL が静かになり、新しい ITL セットがファブリックでアクティブになっているなど)、スケールは影響を受ける可能性があります。スケール制限を超えると、AMC でエラーが発生する可能性があります。64G モジュールおよびスイッチでは、AlertMgrCollector(AMC)を介して分析が収集されます。

AMC リセット機能は、ASIC 分析のみをリセットすることにより、分析の中断のない回復を提供します。analytics reset module <module-number> コマンドを使用して、ラインカードの AMC をリセットできます。スケールの制限の詳細については、Cisco MDS NX-OS の構成の制限、リリース 9.x を参照してください。

このコマンドは、AMC モジュールのみをリセットし、テーブル内のすべてのエントリをフラッシュし、AMC を ITO_HIT_ON_CMD から回復します。

例:

switch # analytics reset module 6
switch # 2022 Jun 15 12:24:48 sw184-9706 %ANALYTICS_LC_MGR-SLOT6-5-ANALYTICS_LC_MGR_RESET_SUCCESS:
Analytics reset successful on module 6

リセットが成功すると、次の syslog が表示されます。

switch# 2022 Mar 13 22:35:54 switch
        %ANALYTICS_LC_MGR-SLOT6-5-ANALYTICS_LC_MGR_RESET_SUCCESS: Reset of Analytics engine
        succeeded. 

リセットに失敗すると、次の syslog が表示されます。

switch# 2022 Mar 13 22:35:54 switch
        %ANALYTICS_LC_MGR-SLOT6-3-ANALYTICS_LC_MGR_RESET_FAILURE: Reset of Analytics engine
        failed

失敗した syslog が表示された場合は、テクニカル サポートを収集し、回復のためにモジュールをリロードします。