Adding Campus Maps, Outdoor Areas, and Buildings with Cisco Prime Infrastructure
For mesh networks, maps and items on those maps (buildings and mesh access points) are added to Cisco Prime Infrastructure in the following order:
Procedure
| Step 1 |
Add a campus map. |
| Step 2 |
Add an outdoor area map. |
| Step 3 |
Add buildings. |
| Step 4 |
Add mesh access points. Detailed steps for adding these maps and components are noted below. |
Adding Campus Maps
To add a single campus map to the Cisco Prime Infrastructure database, follow these steps:
Procedure
| Step 1 |
Save the map in .PNG, .JPG, .JPEG, or .GIF format.
|
||
| Step 2 |
Browse to and import the map from anywhere in your file system. |
||
| Step 3 |
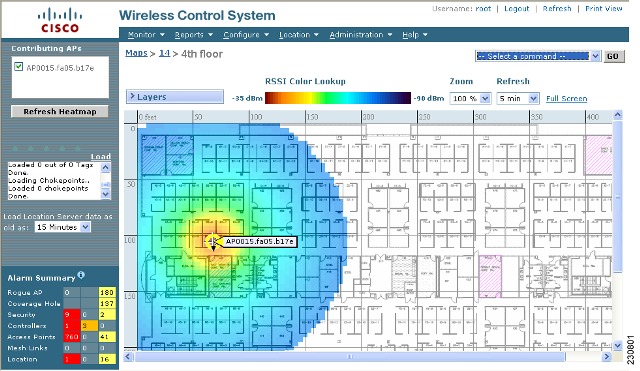
Choose Monitor > Maps to display the Maps page. |
||
| Step 4 |
From the Select a command drop-down list, choose New Campus and click GO. |
||
| Step 5 |
On the Maps > New Campus page, enter the campus name and campus contact name. |
||
| Step 6 |
Browse to and choose the image filename containing the map of the campus and click Open. |
||
| Step 7 |
Select the Maintain Aspect Ratio check box to prevent length and width distortion when the Prime Infrastructure resizes the map. |
||
| Step 8 |
Enter the horizontal and vertical span of the map in feet.
|
||
| Step 9 |
Click OK to add this campus map to the Prime Infrastructure database. The Prime Infrastructure displays the Maps page, which lists maps in the database, map types, and campus status. |
Adding Outdoor Areas
To add an outdoor area to a campus map, follow these steps:
 Note |
You can add outdoor areas to a campus map in the Cisco Prime Infrastructure database regardless of whether you outdoor area maps are in the database. |
Procedure
| Step 1 |
If you want to add a map of the outdoor area to the database, save the map in .PNG, .JPG, .JPEG, or .GIF format. Then browse to and import the map from anywhere in your file system.
|
||
| Step 2 |
Choose Monitor > Maps to display the Maps page. |
||
| Step 3 |
Click the desired campus. Cisco Prime Infrastructure displays the Maps > Campus Name page. |
||
| Step 4 |
From the Select a command drop-down list, choose New Outdoor Area and click GO. |
||
| Step 5 |
On the Campus Name > New Outdoor Area page, follow these steps to create a manageable outdoor area: |
||
| Step 6 |
Click Save. |
Adding a Building to a Campus Map
You can add buildings to the Cisco Prime Infrastructure database regardless of whether you have added campus maps to the database. This section explains how to add a building to a campus map or a standalone building (one that is not part of a campus) to the Prime Infrastructure database.
To add a building to a campus map in the Prime Infrastructure database, follow these steps:
Procedure
| Step 1 |
Choose Monitor > Maps to display the Maps page. |
| Step 2 |
Click the desired campus. Cisco Prime Infrastructure displays the Maps > Campus Name page. |
| Step 3 |
From the Select a command drop-down list, choose New Building and click Go. |
| Step 4 |
On the Campus Name > New Building page, follow these steps to create a virtual building in which to organize related floor plan maps: |
| Step 5 |
Click Save. |
 Feedback