Troubleshooting Service Fulfillment Components

Cisco Unified Communications Domain Manager 10.6(x)/11.5(x)/12.5(x)

This topic describes about the reports, error messages, and troubleshooting.

Health Report

On sign-in, the system displays a health report indicating the status of the system before displaying the CLI user prompt. This health report shows the following:

host: AS01, role: webproxy,application,database, LOAD: 2.74
date: 2014-08-28 13:44:42 +00:00, up: 6 days, 5:23
network: 172.29.42.100, ntp: 196.26.5.10
HEALTH: NOT MONITORED
database: 20GB
DATABASE TRANSACTION SIZE: 21.75GB
DATABASE TRANSACTION COUNT: 500003
Failed logins: 1 since Thu Aug 28 13:44:47 2014 from atlantic.biz

    mail - local mail management          keys - ssh/sftp credentials
 network - network management           backup - manage backups
    voss - voss management tools           log - manage system logs
  notify - notifications control      database - database management
    diag - system diagnostic tools    schedule - scheduling commands
    snmp - snmp configuration           system - system administration
 cluster - cluster management             user - manage users
     web - web server management        drives - manage disk drives
security - security update tools           app - manage applications
template - template pack creator

platform@development:~$

Logs

The system maintains a comprehensive list of logs under /var/log:

  • The platform/ directory has logs pertaining to the general platform.

    • apps.log contains application and process control logging.

    • db.log contains database logs spawned by system transactions.

    • backup.log contains all logging pertaining to backups.

    • cluster.log contains all control-level management of the cluster.

    • config.log contains information relating to the platform-level configuration.

    • execute.log contains low-level information about command execution.

    • notifications.log contains information relating to SNMP notifications.

    • reports.log contains information relating to system reports. Refer to the Scheduling section on how to create a report.

    • security.log contains low-level information relating to security updates.

    • ui.log contains higher-level information relating to UI commands being executed.

    • wsgi.log contains information relating to API-level commands via the WSGI server.

  • The provision/ directory contains logs relating to provisioning. Every module provision is logged to component log files.

  • The health/ directory contains health logs. The health logs are stored automatically every half hour, or whenever health is run, and are of the format health/summary_report-<date>-<time>.

  • The process/ directory contains process logs instrumental in debugging particular processes. All the output from each process is logged to an individual file process/<application>.<process>.log.

  • The install/ directory contains logs detailing the install process.

  • The mongodb/ directory contains logs relating to the Database function.

  • The nginx/ directory contains logs relating to the WebProxy function.

  • The voss-deviceapi/ directory contains logs relating to the Application function.

log list [<search_string>] is used to display a list of logs, optionally matching search_string. For example:

platform@clusternode:~$ log list alternatives.log

selfservice/alternatives.log

voss-deviceapi/alternatives.log

nginx/alternatives.log

mongodb/alternatives.log

alternatives.log

Once a filename is known, the particular log can be viewed with log view <logfile>, or watched (Unix terminology: tail –f) using log follow <logfile>, for example log view process/mongodb.router.log. When the log file is viewed, it can be searched for a particular regular expression using / as with the normal less command.

Log entries have key-value pairs. The keys are as follows:

  • hostname - the hostname of the server

  • level - debug level

  • message - the actual log message

  • name - module where log occurred

  • parent process id - Linux process parent id

  • process id - Linux process id

  • request uuid - identifier to group all logs generated in a request

  • username - user that generated the log

  • user hierarchy - users that generated the log’s hierarchy

  • txn_id - transaction uuid

  • txn_seq_id - transaction ID as seen in the GUI

  • toplevel_txn_seq_id - top level transaction ID

The attempts to auto-complete the prefix if it uniquely identifies a file, for example:

log view process/nginx

Single or multiple logfiles can be sent to a URI destination using log send <URI> <logfile> and log send <URI> <prefix> respectively. The URI must match the URI description detailed under the Networking section. An example of an email URI is mailto:user@server.com. Log files newer than a certain date can be sent using log sendnewer <yyyy-mm-dd> <URI>. If the remote URI destination requires a password, it prompts for the password. A passwordless scp session can be enabled by generating keys locally with key generate, and then sending the local keyset to the remote destination with key send user@<hostname>.

When using log send to a scp and sftp destination, no port should be specified.

All email communication requires notify emailrelay to be configured with the IP address of your mail relay.

Use log collect to collect logs into an archive file. System and database logs can be collected. Mandatory and optional parameters are available to refine the log collection.

The syntax is:

log collect start_time <start-time> output [logs|db|all] end_time <end-time> [limit]

  • The start_time and output parameters are mandatory.

  • The start_time and end_time format is +%Y-%m-%d_%H:%M:%S, for example, 2016-01-10_00:00:00.

  • The output options are:

    • db: collect database logs. By default, this includes transaction activity log records and the detail records of the content of transactions as seen on the GUI as the Log transaction list.

    • logs: collect system application log files from the /var/log directory. The start_time and end_time parameters don't affect the collection of system logs.

    • all:both database and system logs are collected

  • The limit option affects the database logs. It specifies that the detail records of transaction logs are not collected. This option is used if the collected logs are required for a task such as performance analysis and not for a task such as debugging.

Following is an example of the console input and output of the command:

$ log collect start_time 2016-01-10_00:00:00 output all

connected to: 127.0.0.1:27020

exported 240888 records

Output saved to media/logs.atlantic.2016-02-16_08-15-39.tar.gz

The log file archive format is logs.<hostname>.<timestamp>.tar.gz, where <timestamp> is the time that the collection was requested in the format %Y-%m-%d_%H-%M-%S. This file is created in the media/ directory.

The log file archive can then for example be fetched with scp.

The main log rotation scripts rotate the log files only when files exceed 100M or if the disk containing /var/log/ is over 80% full. This is checked once per day. The system attempts to keep five historic zipped files of each log. If the disk containing /var/log is over 90% full, files are purged to ensure that the system continues to function.

100M size logs:

  • mongodb/*.log

  • nginx/*.log

  • selfservice/*.log

  • voss-deviceapi/*.log

10M size logs:

  • other logs in /var/log/ and sub-directories are not specified above

Manually purge all the rotated log files and the log files exceeding 1GB using log purge.

The Mail Command

The system monitors a number of events. For more information, see Warnings and Notifications. The events can be signaled externally using email and snmp. However, a local copy of all events is maintained in the platform user's mailbox.

Command

Description

mail list

Display a list of events stored in the mailbox.

mail read all

Read all mail.

mail read <number>

Read a specific mail message.

mail del <number>

Delete a specific mail message.

mail del <from> <to>

Delete a range of mail messages.

mail del all

Delete all mail messages.

Mail events can accumulate over time. The system purges old events automatically, if the mailbox becomes full (more than 500 messages).

Diagnostic Tools

There is an extensive list of diagnostic tools available under the diag menu.

platform@development:~$ diag
USAGE:
------
diag disk              - display diagnostics for disk usage
diag free              - display diagnostics relating to free memory
diag health            - display a health report
diag health report     - save a health report as a logfile
diag iostat            - IO subsystem statistics
diag iotop             - IO metrics
diag largefiles        - Find the largest files on your system no more than the top 10 items are display
diag mem               - display memory diagnostics
diag monitor           - update the system resource analysis. Use 'diag monitor list' to view the results
diag monitor list      - display system resource analysis
diag nicstat           - Network Interface Statistics
diag perf <commands>   - Linux perf tools (try --help)
diag ping <host>       - ping a remote host to test network reachability
diag proc              - display a list of system processes
diag resolve <host>    - resolve a hostname to IP address
diag tasks             - display constant task listing
diag top               - Process resource statistics
diag traceroute <host> - Discover the network path to <host>
diag unmttests         - Run system unit tests
diag vmstat            - Virtual Memory subsystem statistics

    mail - local mail management          keys - manage ssh / sftp credenti
 network - network management           backup - manage backups
    voss - voss management tools           log - manage system logs
    cert - manage nginx certificates    notify - notifications control
     ssl                              schedule - scheduling commands
    diag - system diagnostic tools      system - system administration
    snmp - snmp configuration             user - manage users
  drives - manage disk drives              app - manage applications
security - security update tools

In particular, the following are mostly used:

Command

Description

diag ping <host>

Test network availability to a network host.

diag resolve <hostname>

Test DNS resolution of a hostname.

diag free

Display the memory usage.

diag disk

Display the disk usage.

diag mem

Display a more detailed memory usage by process.

diag health

Display a comprehensive health summary.

diag top

Display a single UNIX top summary.

Diagnostic Troubleshooting

The health displayed on login normally includes sufficient information to determine that the system is either working, or experiencing a fault. More detailed health reports can be be displayed with diag health.

A rich set of SNMP and SMTP traps are described in the Notifications section which can be used to automate fault discovery.

Determine if all processes are running using app status. If a process is not running, investigate its log file with:

log view process/<application>.<process>

For example, checking processes:

platform@development:~$ app status
development v0.8.0 (2013-08-12 12:41)
voss-deviceapi v0.6.0 (2013-11-19 07:37)
   |-voss-celerycam             running
   |-voss-queue_high_priority   running

   ...
core_services v0.8.0 (2013-08-27 10:46)
   |-wsgi                       running
   |-logsizemon                 running
   |-firewall                   running
   |-mountall                   running
   |-syslog                     running (completed)
   |-timesync                   stopped (failed with error 1)
nginx v0.8.0 (2013-08-27 10:53)
   |-nginx                      running
security v0.8.0 (2013-08-27 11:02)

Followed by a log investigation for a stopped process:

platform@development:~$ log view process/core_services.timesync
2013-08-15 10:55:20.234932 is stopping from basic_stop
2013-08-15 10:55:20:    core_services:timesync killed
  successfully
2013-08-15 10:55:20: Apps.StatusGenerator core_services:timesync
  returned 1 after 1 loops
App core_services:timesync is not running with status stopped

...

+ /usr/sbin/ntpdate 172.29.1.15
2014-02-04 09:27:31: Apps.StatusGenerator core_services:timesync
  returned 0 after 1 loops
2014-02-04 09:27:31: WaitRunning core_services:timesync is reporting
  return code 0
core_services:timesync:/opt/platform/apps/core_services/timesync
  started
4 Feb 09:27:38 ntpdate[2766]: no server suitable for
  synchronization found
+ echo 'Failed to contact server: 172.29.1.15 - retrying'
Failed to contact server: 172.29.1.15 - retrying
+ COUNTER=2
+ sleep 1
+ test 2 -lt 3
+ /usr/sbin/ntpdate 172.29.1.15
4 Feb 09:27:48 ntpdate[3197]: no server suitable for
  synchronization found
+ echo 'Failed to contact server: 172.29.1.15 - retrying'
Failed to contact server: 172.29.1.15 - retrying
+ COUNTER=3
+ sleep 1
+ test 3 -lt 3
+ test 3 -eq 3
+ echo 'Timesync  - could not contact server 172.29.1.15 after
    three tries. Giving up'
Timesync  - could not contact server 172.29.1.15 after
   three tries. Giving up
+ exit 1

The error message and return code being displayed in the browser is also invaluable in determining the cause of the problem.

The system resources can be inspected as follows:

  • diag disk displays the disk status

  • diag free and diag mem displays the memory status

  • diag top displays the CPU status

Warnings and Notifications

The system monitors a number of conditions and generate events as necessary.

Events are grouped into three categories:

  • Info messages that are informational, and do not require further attention

  • Warning notices that indicate that a recoverable event has occurred, and further action is not required.

  • Error notices that indicate a failure, and must be addressed.

The following conditions are monitored:

Condition

Message type

Detail and Action

Backups

Backup failed

Error

Corrective action

  • Attempt a manual backup and monitor output.

  • Ensure sufficient space on the disk is available.

  • Check the automated backup schedule with schedule list.

Backups

Backup successful

Info

Backups

Backup restored successfully

Info

Backups

Backup restore failed

Error

Corrective action

  • Ensure the requested backup exists using backup list.

  • Monitor output of the backup restore process.

  • Ensure there is sufficient space on the database volume.

Backups

Last successful backup more than 2 days ago

Error

Corrective action

  • Perform a manual backup.

  • Schedule automated backups with schedule.

Backups

Backups are running regularly

Info

Condition

Message type

Detail and Action

Logs

Forcing log rotation as disk usage is high

Info

Logs

Autopurging logs due to excessive disk usage

Warn

Logs

Log files larger than 1GB found in /var/log

Error. :

Corrective action

Diagnose large files with
diag largefiles

Logs

Normal log rotation is running

Info

Condition

Message type

Detail and Action

Disk usage

Disk full

Error

Corrective action

  • Use diag disk to analyse disk usage.

  • Remove excess files in user home directories

  • Purge logs with log purge.

  • Check that the disk is not mounted read-only due to disk problems.

Disk usage

Disk usage greater than 80%

Warn

Disk usage

Disk latency excessive (slow)

Error

Corrective action

Monitor hardware performance using hardware specific tools such as Vsphere.

Disk usage

Disk latency returned to normal

Info

Disk usage

Disk /var/log greater than 80%

Error

Corrective actions

Purge logs with log purge.

Condition

Message type

Detail and Action

Mailbox

Mailbox full, > 500 messages, autoarchiving

Info

Mailbox

Messages reduced < 200

Info

Condition

Message type

Detail and Action

Notifications

Email not configured for notifications

Warn

Corrective action

Configure email address and mail relay.

Notifications

Email is configured for notifications

Info

Notifications

SNMP trap failed to be sent

Error

Corrective action

Send test event with
notify test info

Notifications

Test notification sent

Info

Condition

Message type

Detail and Action

Health reports

Error sending health report through email

Error

Health reports

Health reports successfully sent through email

Info

Condition

Message type

Detail and Action

Cluster

One or more nodes down in the cluster

Error

Corrective action

Check cluster status and restart node as necessary.

Cluster

No hosts defined in the cluster

Error

Corrective action

Check cluster list and add nodes as necessary.

Cluster

All nodes in the cluster running

Info

Condition

Message type

Detail and Action

Network

Network failure

Error

Corrective actions

Check network cables, firewalling, routing and hardware.

Network

Network failure resolved

Info

Network

NTP server is not configured

Error

Corrective action

Ensure that the NTP server is set correctly with network ntp

Network

NTP server is configured

Info

Network

NTP offset exceeds 1 second

Warn

Corrective action

Check that the NTP server is correctly configured with network ntp and the NTP server is reachable and functioning correctly.

Network

NTP offset returns to normal

Info

Network

DNS server is not configured

Warn

Network

DNS server is now configured

Info

Network

No DNS domain configured

Warn

Network

DNS domain is configured

Info

Condition

Message type

Detail and Action

Applications

Failed to start service

Error

Corrective action

Check the application status with app status; service log with log view process/<application>.<process>

Applications

Services started successfully

Info

Aplications

Upgrade failed

Error

Corrective action

  • Check the output from the upgrade.

  • Ensure disk space is available with diag disk

Condition

Message type

Detail and Action

Security

Security updates available

Warn

Required action:

Run security update

Security

Security updates applied

Info

Condition

Message type

Detail and Action

Resource usage

High memory usage

Error

Corrective action

  • Check the memory usage with diag free and diag mem

  • Ensure that sufficient memory resources are available to the host through Vsphere

Resource usage

Memory usage returned to normal

Info

Resource usage

CPU has high utilization

Warn

Resource usage

Extremely high CPU utilization

Error. : ;

Corrective action

  • Check the CPU utilisation with diag top

  • Ensure that sufficient CPU resources are available to server through Vsphere

Resource usage

CPU utilization returned to normal

Info

SNMP CPU load notifications are set using:

snmp load <1min load> <5min load> <15min load>

If the threshold is exceeded, a notification is sent. For a server with 2 CPUs, it is recommended that this setting be:

snmp load 8 4 2

This means that notifications are sent if the 2-CPU system load averages over the last 1, 5, and 15 minutes reach these values.

The system can be configured to forward warnings and notifications to various destinations, including:

  • Local email

  • Remote email addresses

  • Remote SNMP destinations

The notification destinations can be displayed with notify list. The destinations for each event level can be set with notify add info|warn|error <destination-URI> Refer to the Network URI Specification topic for a detailed description of URIs. Note that email notifications require the mail relay to be set with notify emailrelay <relayhost>. A test event can be generated with notify test info|warn|error to test the notification delivery mechanism.

Examples:

  • notify add info mailto:sysadmin@mycompany.com

  • notify add error snmp://public@mysnmpserver.com

In addition to external email and SNMP alerts, the system also records various events to a local mailbox.

Error Messages

The following tables provide a reference to the error codes in the system.

To inspect application log messages from the command line, set the debug level on, and view the app log.

voss set_debug 1
log view voss-deviceapi/app.log

The message strings are shown in template format: references to specific properties are shown as placeholders that are represented by {}.

The HTTP Code is 400 unless specified otherwise.

Default Error Code

Message

HTTP Code

0

Invalid Exception

System Error Code

Message

HTTP Code

0000

Error, Mongo service not started

0001

Error, Server too busy

0002

Error, Celery service not started

Python Internal Error Code

Message

HTTP Code

1000

Cannot import Python model name {}

404

1001

Python Type error

Database Error Code

Message

HTTP Code

2000

Cannot setup Mongo DB collection {}

2001

Find failed with spec={}, fields={}, skip={}, limit={}, sort_by={}, err={}

2002

Find one failed with spec={}, fields={}, err={}

2003

Get archive history failed with spec={}, fields={}, skip={}, limit={}, err={}

2004

Remove failed with spec={}, err={}

2005

Find and modify failed with spec={}, modify={}, err={}

2006

Find and modify failed with spec={}, modify={}, err={}

2007

Count failed for {}

2008

Find failed with spec={}, fields={}, err={}

2100

Error, Cannot connect to RESOURCE database collection

2101

Error, Cannot connect to DATA database collection

2102

Error, Cannot connect to ARCHIVE database collection

2104

Bulk insert failed, err={}

400

2999

Unhandled Database Error

API Error Code

Message

HTTP Code

3000

Hierarchy context may not be None, please select Hierarchy

3001

Error, Incorrect request format

3002

Error, Unhandled method for URL

3003

Invalid import file specified. {}

3004

Invalid export URL specified. {}

3005

Error, Invalid list view sort key [{}]. Valid options are {}

3006

Error, Invalid list direction [{}]. Valid options are {}

3007

Error, No schema available during list view

3008

Provisioning Workflow error [{}]

3009

Nothing to export

3010

List delete failed, error [{}]

3011

List size not allowed, requested [{}], maximum [{}]

3012

List sort by hierarchy path not allowed

3013

Function not implemented

3014

Attribute field name required

3015

Hierarchy path [{}] not found.

3016

Model type list [{}] not found.

3017

Bulk update failed, error [{}].

3018

Bulk operation {} failed, error [{}].

3019

Schemas of data being imported have cyclic foreign keys {}.

3027

The current filter caused a long running request. Please add more filter fields, use Case Sensitive or change the criteria types to one of {}.

400

3999

Unhandled API Error

Resource Error Code

Message

HTTP Code

4000

Error, Cannot delete Resource while children exist {}

4001

Error, Duplicate Resource Found. {}

4002

Resource Not Found {}

404

4003

Failed to save {}. {}

4004

Failed to save {}. {}

4005

Model Type cannot be None when adding a new Resource

4006

Resource Parent {} not found

4007

Resource Meta structure corrupt for {}

4008

Cannot create a Resource without a Parent Hierarchy

4009

Failed to save {}. {}

4010

Cannot find Resource relation {}

4011

Cannot find target device for model type {} in current hierarchy context

4012

Cannot find summary attr [{}] in schema root

4013

Cannot perform operation, model {} already has one or more instances

4014

Cannot perform operation, resource is part of domain model {}

4015

Resource Meta structure corrupt. {}

4016

Badly-formed schema; properties missing for data type object

4017

Cannot perform operation, model {} is already referenced by one or more resources: {}

4018

Failed to execute {}. {}

4019

One or more errors occurred during import

4020

Transaction resource failed with errors {}

4021

Resources are not of the same type

4022

Model type for Resources not found

4023

Cannot move Hierarchy Node {} to {}

4024

Resource move failed with error {}

400

4025

Invalid business key {}, expected {}

4026

Cascade delete failed with error {}

400

4999

Unhandled Resource Error

Model Error Code

Message

HTTP Code

5000

[{}] Child model exists; ({})

5001

[{}] Model already exists; ({})

5002

[{}] One or more data sync errors occurred; ({})

5003

[{}] The helper cannot instantiate a model it does not recognize; ({})

5004

[{}] The specified resource could not be found; ({})

404

5005

[{}] A single model instance was expected but more than one was found; ({})

404

5006

[{}] Attempt to modify a read-only model failed; ({})

5007

[{}] Attempt to modify a read-only model field failed; ({})

5008

[{}] Data does not conform to schema; {}

5009

[{}] Badly-formed schema; ({})

5010

[{}] Error manipulating schema; ({})

5011

[{}] Error generating schema; ({})

5008

[{}] Invalid foreign key to {} for business keys {}

5017

[{}] Operation not supported; ({})

405

5018

Unable to determine workflow for operation {}

5019

Workflow {} not found

5020

Workflow operation {} clashes with an existing model attribute/method

5021

Unable to execute provisioning workflow for {}, error {}

5022

Unable to compile data for provisioning workflow for {}, error {}

5022

[{}] Authentication error; ({})

401

5023

[{}] Connection timeout error after ({}) seconds

5024

[{}] Connection error; ({})

5051

New password must have {} characters different from old password.

400

5052

User cannot change their password more than once within {} day(s). Please contact your administrator.

400

5053

Password does not meet minimum length required.

400

5998

{1}

5999

[{}] Unexpected error; ({})

Macro Error Code

Message

HTTP Code

6000

Template must be a dictionary - got {}

6001

No hierarchy supplied

6002

Invalid macro specified: {}

6003

Macro lookup of {} failed at hierarchy {}

6004

Macro lookup of {} returned multiple values {} at hierarchy {}

6005

Macro lookup of {} failed when fetching from {} at hierarchy {}

6006

Macro lookup failed for field {} in context {}

6007

Macro lookup failed for field {} in context {}, type str or int expected not type dict {}

6008

Macro function {} not found

6009

Macro function arguments error - {}

6010

Macro function error - {}

6011

Unexpected business key format - {}

6018

Incorrect hierarchy direction, {}. Allowed: {}.

6999

Error,

Workflow Error Code

Message

HTTP Code

7000

Workflow not found

7001

Maximum workflow recursion depth exceeded

7002

Invalid workflow script identifier {}

7003

Specified workflow script name {} not found

7004

Error looking up workflow script names against API

7005

Invalid workflow action

7006

Workflow {} at step {} failed. {}

7007

Advanced Find Options invalid - Resource not found with options {}

7008

{}

7999

Error,

Script Error Code

Message

HTTP Code

8000

Script not found

8002

Syntax error on line {}

8003

Could not connect to {}

8004

Authentication failed {}

8999

Error,

Schema Error Code

Message

HTTP Code

9000

Unhandled schema property error: [{}]

9999

Error,

Bulk Loader Error Code

Message

HTTP Code

10012

‘{user}’ is not permitted access to resources at ‘{hierarchy}’.

403

10021

Action ‘{action}’ not allowed.

400

10050

Cannot enforce data type ‘{data_type}’ on ‘{data}’. Row data:{row_data}

400

10006

Both parallel and serial are not allowed in ‘{worksheet}’.

400

10047

Malformed entity header ‘{header}’ in cell ‘{cell}’ worksheet ‘{sheet}’.

400

10045

Malformed fields{message}: {fields}.

400

10007

Differing parallel_transaction_limit values are not allowed in ‘{worksheet}’.

400

10004

{success} out of {total} items loaded successfully.

400

10000

File Upload Error for filename : ({})

400

10005

Resource data was not found in worksheet ‘{worksheet}’.

400

10052

The specified meta_prefix ‘{meta_prefix}’ in sheet ‘{sheet_name}’ is in-valid.

400

10041

No search fields specified in row.

400

10011

Hierarchy not specified for row with data; ({})

400

10003

General Error; ({})

400

10044

Malformed search fields: {fields}.

400

10043

Resource not found. Search fields ‘{search}’.

400

10001

File Encoding Error : ({})

400

10010

Data does not conform to schema; ({})

400

10008

Invalid value of ‘{limit}’ for parallel_transaction_limit header in ‘{worksheet}’,should be left blank or a number between 1 and 100(inclusive).

400

10042

More than one resource found. Search fields ‘{search}’.

400

10020

Hierarchy ‘{hierarchy}’ was not found.

400

10051

An internal error occurred while processing workbook ‘{filename}’{note}

400

10046

Cannot find meta actions for specified resource instance.

400

10002

Only valid Excel xlsx files are accepted

400

10030

User ‘{username}’ is not allowed to {operation} {model_type}.

403

10022

Action ‘{action}’ not allowed for model ‘{model}’.

400

10040

Fields do not exist in {model}: {fields}.

400

10061

No match for device ‘{device}’.

400

Data Import Error Code

Message

HTTP Code

11000

Multiple json files {} found in zip archive root; only 1 expected

11999

Error,

Test Connection Error Code

Message

HTTP Code

12000

Please specify the model type of the device connection parameters

12999

Error,

Cisco Unified Communications Domain Manager Version Information

To find detailed information about your version of Cisco Unified Communications Domain Manager:

  1. Log in as hcsadmin administrator.

  2. Select About > Extended Version.

  3. Click the HcsBase version.

    The following information is displayed:

    Field

    Description

    Name

    Always HcsBase

    Release

    The Cisco Unified Communications Domain Manager release

    Version

    The version of the template file.

    Previous Version

    The previous version of the template file, if the template has been upgraded or reinstalled.

    Build Number

    Cisco's build number associated with this load

    Branch

    Development branch

    View

    Development view

    Build Time

    Build Time associated with this load

    Author

    Always Cisco HCS Base

    Deployment Mode

    HCM Standard

    Platform Version

    Matches the installed OVA file version or the version of the latest Cisco Unified Communications Domain Manager upgrade ISO file. The platform version is not displayed if an HCM-F device has not been configured in Cisco Unified Communications Domain Manager.

  4. To export the detailed version information, select Action > Export.

Single Sign On (SSO)

Troubleshooting Self-Provisioning

Getting Started

Inspect transactions and user management logs:

  • Check Transactions: Administration Tools > Transactions

  • Check User Management logs: User Management > Log Messages

  • Check configurations

When Cisco Unified Communications Domain Manager is using LDAP for user management and new users synced with LDAP are not pushed to Cisco Unified Communications Manager confirm Auto Push Users is checked in Site Management > Sites.

When users are pushed to the call manager with an incorrect Primary Extension and Self Service ID check that the Line Mask is correct under User Management > Self Provisioning > Line Mask. Line Mask should exist for each site.

Troubleshooting Specific Failures

Line is not created

  • Ensure that the Directory Number Inventory exists and the number is not in use.

  • If the line mask is applicable, check the following

    • Ensure that the ULT has a site-specific partition

    • Ensure that the Line Mask is configured

    • Ensure that the User Profile is configured and set in the Site Defaults

    • Ensure that the user's attribute value is valid and that the mask is applicable

  • For setting the Self-Service Id, check the following - Ensure Site Defaults default line partition is set - Check Quick Add Group configuration

Users are not in correct sites

Check that filters for each site exist in Manage Filters under User Management.

Users are not getting correct User Profile

Check that the correct User Profile is populated under Default User Profile in Site Management > Defaults.

Quick Add subscriber not getting correct User Profile in Cisco Unified Communications Call Manager

Check that the correct Quick Add Group is selected for Quick Add Subscriber. If correct Quick Add Group is selected, open the Quick Add Subscriber Group and check that the correct template is selected for Default Cisco Unified Communications Manager User Template.

Users are unable to log in to Self Service page

Check that the users are LDAP Authenticated Users. Only the LDAP Authenticated Users can log into the Self Service page.

AD LDS LDAP Synced Users Login Failure

If the LDAP Username is not correctly mapped when defining the LDAP Sync, users synced from an AD LDS LDAP server cannot log in to Cisco Unified Communications Domain Manager. Use this procedure to correct the problem.

Procedure


Step 1

Login as provider administrator.

Step 2

Set the hierarchy path the customer node where the LDAP server is configured.

Step 3

Purge the LDAP synced users.

  1. Select User Management > Sync & Purge > LDAP Users.

  2. In the Action field, select Purge local LDAP device resources.

  3. Click Save.

Step 4

Delete the LDAP Sync with incorrect mapping.

  1. Select LDAP Management > LDAP User Sync.

  2. Select the LDAP User Sync, and click Delete.

Step 5

Readd the LDAP Sync with the correct mapping.

  1. Select LDAP Management > LDAP User Sync.

  2. Click Add.

  3. Click the FieldMapping tab.

  4. Set the LDAP Username field to the correct field.

  5. Click Save.

Step 6

Sync the users from LDAP.

  1. Select User Management > Sync & Purge > LDAP Users.

  2. In the Action field, select Synchronize users from LDAP.

  3. Click Save.

Step 7

Log in as an LDAP synced user with username@hierarchy.

Example:

jdoe@sys.hcs.provider1.customerA.

Unable to Configure UC Applications 10.5(2)

Symptom:

When you try to configure a 10.5(2) UC App in Cisco Unified Communications Domain Manager, 10.5 is not available as the UC App Version.

Resolution:

Ensure that HCM-F has been upgraded to 10.6(2), and that the HCM-F device on Cisco Unified Communications Domain Manager has the version set to v10_6.

Transactions

Transaction Logging and Audit

Activity on the system results in transactions that are recorded. The Transaction menu provides auditing information for each transaction.

The recorded information includes:

  • Transaction ID - Identifier of the transaction

  • Action - The type of action that is recorded in the transaction, for instance Execute, Create, Modify, Data Import, and so on.

  • Resource - the affected resource of the transaction, including the model type (for example, data or User), and its hierarchy.

  • Username - Of the user who initiated the transaction.

  • Submitted Time, Started Time, and Completed Time - The date and time of the progress of the transaction.

  • Rolled Back - Indicates whether the transaction was rolled back or not.

  • Status - for running transactions, this is In Progress; for completed transactions there are three scenarios:

    • Fail

    • Success

    • Success with Async failure

  • Detail - A brief description of the processed transaction.

  • Duration - The duration of the selected transaction. If there are subtransactions, this parent transaction duration is the total duration of the transaction. This includes the total duration of import transactions that carry out provisioning workflows asynchronously.

  • Submitter hostname - The hostname of the application node that scheduled the transaction. On a clustered system, this can differ from the Processor hostname.

  • Processor hostname - The hostname of the application node that processed the transaction (this value is only set once the transaction is processed). On a clustered system, this can differ from the Submitter hostname.

The Unified CDM GUI displays the transaction details upon selection of transaction in the list view.

When a transaction is selected, the Base tab shows details of the columns of the transaction list view. The button bar on the detail list view shows Help and Refresh buttons if the transaction is still running. If the transaction is running, click the Refresh button to update the Progress field.

If you want to cancel a transaction while it is running, click the Cancel button. A pop-up confirmation dialog is displayed. Click Yesto cancel, or No to cancel the request. If a transaction, with subtransactions, is cancelled, the subtransaction currently in progress completes. This subtransaction and all preceding subtransactions rolls-back to their previous states. Bulk load transactions do not follow this behavior. Each bulk load subtransaction is seen as a main transaction, and only the ‘in progress’ subtransaction rolls back to its previous state.

The Replay button is available if the transaction is complete. A transaction can be replayed if necessary, for example if a transaction failed because a target system service was not running. The replay of the transaction can then be used instead of reentering data on a GUI form.

The Edit and Replay button is also available for completed transactions. This is similar to the Replay button, but allows you to first change the previously submitted form before the transaction is resubmitted.

The button is available for transactions, that did not originate from bulk loads, wizards, or pop-up forms.

The bulk loader does not support Replay; and Edit and Replay functionalities because the bulk load files are not stored by default. The bulk loader extracts data from the spreadsheets and then performs the necessary actions. The only time a bulk load file is stored in the database is when the bulk load is scheduled. In this case, the bulk loader keeps the file until it triggers the scheduler to execute the actions in the file. When the data is extracted from the file, it is deleted.

When using Edit and Replay for a failed Quick Add Subscriber transaction, the user information fields do not automatically update when changing the Username field:

  • Entitlement Profile

  • Firstname

  • Lastname

  • Email

  • Jabber Device

These are edited manually.

Selecting the button opens the original input form that resulted in the transaction. The form also contains the original data that was posted. This data can be edited and the form can be submitted to replay the transaction. This functionality can therefore be used, for example, to edit a failed transaction or to modify data of a successful transaction.

Since GUI Rules apply to a form from a specific hierarchy, the Edit and Replay functionality is only used from the same hierarchy as the original transaction was executed.

The Logs section on the Transaction base tab displays Message and Severity details of transactions that are performed by . For example, if the Severity has the status of error, the Message section can be expanded to inspect the error, and optionally copy it and send it to Support. If a workflow is inspected, a separate log entry provides details of each step with a log message as Step n, starting with Step 0.

The Resource tab, which has content for transaction types where a resource changed, displays the additional information, depending on the transaction type:

  • Hierarchy - The point in the hierarchy at which the transaction occurred.

  • Model Type - For example, data or User.

  • Current State - if available, click the Entity link to inspect the instance on the GUI form.

The Back button on the button bar can be used to navigate to the previous screen; for example, from the parent transaction screen to the list view of all transactions.

View a Transaction

You can only view transactions that are relevant to your specific hierarchy level. For instance, if you are logged into the system as a Customer Administrator, you can view all transactions that were performed at the customer for which you are the administrator. This includes transactions that were performed at any of the sites that belong to the customer. If you are logged in as a Site Administrator, you can view only the transactions that were performed at your specific site. Follow the steps on the GUI.

Procedure

Step 1

Log in as the sysadmin administrator.

Step 2

Click Administration > Tools > Transactions. The Transaction list view is displayed.

The Transaction list view shows transactions in progress or executed. This is indicated in the Status column of the list. For completed transactions, the Success column indicates if the transaction was successful.

The Description column provides additional details on the transaction, if available.

Step 3

Click an individual transaction (if required) to show a detailed view of the transaction.

Step 4

If there are subtransactions, click the Link in the Sub Transactions list to show its details.


Transaction Choices

A URL endpoint and parameter is available to list the transaction actions as they are shown in the transaction log.

  • The API call to get the list of transaction actions use the parameter and value: field=action, for example:
    GET api/tool/Transaction/choices/?
    field=action&
    hierarchy=[hierarchy]&
    format=json
    The output shows the list of transaction actions:
    [
    {
    "value": "Auto Migrate Base Customer Dat",
    "title": "Auto Migrate Base Customer Dat"
    },
    {
    "value": "Auto Migrate Base Provider",
    "title": "Auto Migrate Base Provider"
    },
    {
    "value": "Auto Migrate Base Site Dat",
    "title": "Auto Migrate Base Site Dat"
    },
    {
    "value": "Auto Migrate Dial Plan",
    "title": "Auto Migrate Dial Plan"
    },
    {
    "value": "Auto Migrate Feature Subscriber Phone Cft",
    "title": "Auto Migrate Feature Subscriber Phone Cft"
    },
    {
    "value": "Auto Migrate Hotdial Data",
    "title": "Auto Migrate Hotdial Data"
    },
    {
    "value": "Auto Migrate Init Ippbx",
    "title": "Auto Migrate Init Ippbx"
    },
    {
    "value": "Auto Migrate Internal Number Inventory",
    "title": "Auto Migrate Internal Number Inventory"
    },

Transaction Details

The Detail column of the list of transactions in the transaction log user interface shows information according to the type of entity and the operation carried out by the transaction.

The rules listed below are considered when creating a transaction filter and specifying the value of the filter text.

The following conditions apply to content in the Detail column:
Action Entity Comment

Create, Update, Clone, and Delete

All models Detail contains the name on the model.
Execute

DataSync, Workflow, Event, Scheduler

Detail contains the instance name.

Bulk operations on Modify, Delete, Move

All models
  • The parent transaction detail contains: “[no. of succeeded / no. of total] were [updated/deleted /moved to destination_hierarchy] successfully.”

  • Bulk move from different hierarchies to one hierarchy show the destination hierarchy name in the parent transaction detail.

  • Each child transaction detail contains the name of instance that is deleted.

Data Import All models Detail shows only the imported filename.

Device Import

All devices Detail shows hostname or device address.
All operations All models

The following attribute values are considered first for inclusion in the Detail column: country_name, DialPlanName, name, ip, host, address, description, username, type, entity_id, userid, pattern, RoleCurrent. Otherwise, the first string field in the view or in the left model of the relation is shown.


Note

The contents of the Detail column of transaction lists are not localized.


Transaction Filters

In addition to the filter parameters that can be applied to transactions as indicated in the topic on API Parameters, transactions in particular can be filtered by the following values:

  • For the URL parameter filter_field:

    • Transaction ID: id

    • Start or end submitted time: submitted_time

    • The transaction message: message

  • Use URL paramter to list subtransactions and value subtransactions=true. By default, subtransactions are not listed, in other words, the value is false.

  • To carry out a filter on subtransactions of a parent transaction, the /sub-transactions/endpoint is added to the GET request:

    /api/tool/Transaction/[parent-pkid]/sub-transactions/
  • To carry out a filter on transaction logs of a parent transaction, the /logs/ endpoint is added to the GET request:

    /api/tool/Transaction/[parent-pkid]/log/

    The transaction filters do not apply to logs.

The parameters can have the filter_condition values:

  • eq (equals)

  • ne (not equals)

  • gt (greater than)

  • gte (greater than or equals)

  • lt (less than)

  • lte (less than or equals)

The date-time is a filter_text value for filter_field=submitted_time.

The format is YYYY-MMDDTHH: MM:SS.f, where:

  • “T” is the time separator and the character is added.

  • “Z” indicates UTC time and the character is added.

  • “f” represents the decimal fraction of a second and the character is not added. The specification of the decimal fraction is optional.

Transaction Behavior

The transaction engine for ensures that configuration changes are made efficiently and reliably.

If a transaction failure or error occurs, Unified CDM lets you roll transactions back to a state preceding the failed transaction.

For example, where a workflow step fails, all successful steps before a failed step are rolled back.

Transactions are hierarchical and have parent-child relationships with other transactions. Subtransactions are always executed sequentially and synchronously. In other words, the child transactions of a workflow parent transaction are executed one after another.

Transaction behavior is different for the following actions in the system:

  • API

    The API supports executing transactions in both synchronous and asynchronous modes. When executed in synchronous mode, the API responds only after the transaction is completed. When executed asynchronously, the API responds immediately with a transaction ID so that the progress and status of the transaction can be polled.

  • Bulk Loaders

    With bulk loading, the load of each row on a sheet is a separate transaction. These transactions are run in series. There is no rollback of rows that have loaded successfully before or after a failed transaction (a failed row on a sheet). Multiple bulk load sheets can be loaded in parallel.

  • Data Import

    One transaction is created for each record in the import file. If a transaction fails, the import continues and does not roll back the preceding successful transactions.

  • Data Sync

    A data sync transaction contains subtransactions that record each device model operation that takes place during a data sync action, for example add, update and delete.

  • Events

    Events are triggered as part of data sync operations or as triggers on operations performed on certain model types. The provisioning workflow executed when the event triggers is executed as a new parent transaction. Transaction failures with the workflow executed after an event do not affect the original transaction that triggered the event.

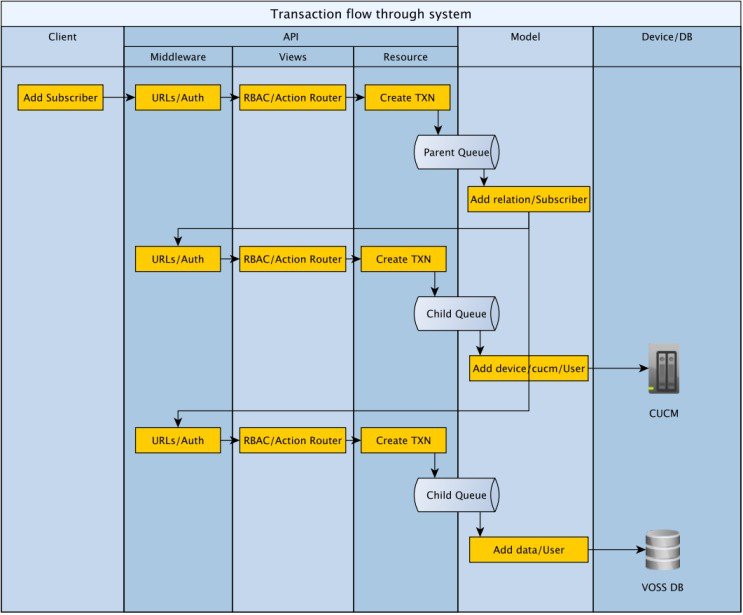
All transactions are placed on a queue before they are run. Parent transactions can run concurrently, but their subtransactions run serially. Parent transactions are prioritized so that user input, such as adding on a GUI form, is prioritized over a running import or bulk load process.

The following diagram shows an example transaction flow and also the relationship between parent and child transaction queues and workers.

Figure 1. Example Transaction Flow


Cluster Failure Scenarios

Cluster Failure Scenarios

The status of the cluster can be displayed from the command line on any node using the command:

cluster status

The system can automatically signal email and SNMP events if a node is found to be down.

Refer to the diagrams in the section on deployments.

Loss of an Application Role

The Web Proxy keeps directing traffic to alternate application role servers. There is no downtime.

Loss of a Web Proxy

Communication with the lost Web Proxy fails, unless some another load balancing infrastructure is in place (DNS, external load balancer, VIP technology). The node can be installed as a HA pair so that the VMware infrastructure restores the node if it fails. Downtime takes place while updating the DNS entry or returning the Web Proxy to service. For continued service, traffic can be directed to an alternate Web Proxy or directly to an Application node if available. Traffic can be directed manually (in other words, network elements must be configured to forward traffic to the alternate Web Proxy).

In the sections that follows, it is assumed that the service provider has assigned the recommended database (DB) weights, for four Unified Nodes in active/active setup, as follows:
  • Primary Unified Node (UN1) database weight = 40

  • Secondary Unified Node (UN2) database weight = 30

  • Secondary Unified Node (UN3) database weight = 20

  • Secondary Unified Node (UN4) database weight = 10

The Unified CDM system automatically assigns Voting Members to the Unified Nodes that are based on their DB weights noted previously for four Unified Nodes:

  • Primary Unified Node (UN1) Voting Members = 2

  • Secondary Unified Node (UN2) Voting Members = 2

  • Secondary Unified Node (UN3) Voting Members = 2

  • Secondary Unified Node (UN4 ) Voting Members = 1

In the sections that follows, it is assumed that the service provider has assigned the recommended database (DB) weights, for six Unified Nodes in active/standby setup, as follows:

  • Primary Unified Node (UN1) database weight = 60

  • Secondary Unified Node (UN2) database weight = 50

  • Secondary Unified Node (UN3) database weight = 40

  • Secondary Unified Node (UN4) database weight = 30

  • Secondary Unified Node (UN5) database weight = 20

  • Secondary Unified Node (UN6) database weight = 10

The Unified CDM system automatically assigns Voting Members to the Unified Nodes based on their DB weights noted previously for Six Unified Nodes:

  • Primary Unified Node (UN1) Voting Members = 2

  • Secondary Unified Node (UN2) Voting Members = 1

  • Secondary Unified Node (UN3) Voting Members = 1

  • Secondary Unified Node (UN4) Voting Members = 1

  • Secondary Unified Node (UN5) Voting Members = 1

  • Secondary Unified Node (UN6) Voting Members = 1

The relative size of the database weights determines the hierarchy of the nodes in a failure scenario. The Unified Node (UN) with the highest database weight is the Primary.

The number of Voting Members is used to establish a quorum, and is the basis for the behavior of the system in a multinode failure scenario. There are a total of seven Voting Members, the default value in a four node system is (2 + 2 +2 +1) and default value in a six node system is (2+1+1+1+1+1).

The subsequent tables illustrate the behavior of the system in various failure scenarios. In all cases where a UN has failed, it is assumed that the entire node (and therefore the database function referenced earlier in this section) is out of service. Any in-flight transactions on nodes that failed are lost.

Table 1. Single Unified Node Failure Scenarios

UN1 State [Voting Members = 2] (Primary)

UN2 State [Voting Members = 2]

UN3 State [Voting Members = 2]

UN4 State [Voting Members = 1]

System Status under Scenario

In Service

In Service

In Service

In Service

System is functioning normally.

In Service

In Service

In Service

Fail

System continues functioning normally.

In Service

In Service

Fail

In Service

System continues functioning normally.

In Service

Fail

In Service

In Service

System continues functioning normally.

Fail

In Service

In Service

In Service

Some downtime occurs. System automatically fails over to UN2.

Table 2. Multiple Unified Node Failure Scenarios

UN1 State [Voting Members = 2] (Primary)

UN2 State [Voting Members = 2]

UN3 State [Voting Members = 2]

UN4 State [Voting Members = 1]

Voting Members in Service

System Status under Scenario

In Service

In Service

In Service

In Service

7

System is functioning normally.

Fail

Fail

In Service

In Service

3

Manual Intervention is required to restore service.

In Service

In Service

Fail

Fail

4

System continues functioning normally.

In Service

Fail

Fail

In Service

3

Manual Intervention is required to restore service.

In Service

Fail

In Service

Fail

4

System continues functioning normally.

In all the scenarios, whenever 50% or more (greater than or equal to four) Voting Members are in service, the system remains in service. Manual steps are required to restore the cluster.

Loss of a Database role

If the primary Database service is lost, the system automatically reverts to the secondary Database. The primary and secondary database nodes can be configured with the command-line interface using database weight<ip><weight>. For example, the primary can be configured with a weight of 40, and the secondary with a weight of 30. If both the primary and the secondary Database servers are lost, the remaining Database servers vote to elect a new primary Database server. There is downtime (no more than a few seconds) during election and failover, with a possible loss of data in transit (a single transaction). The GUI web-frontend transaction status can be queried to determine if any transactions failed. The downtime for a Primary to Secondary failover is less and the risk of data loss likewise reduced. A full election (with higher downtime and risk) is therefore limited only to cases of severe outages where it is unavoidable. Although any values can be used, for 4 database nodes the weights: 40, 30, 20, 10 is recommended.

Loss of a site

Unified and Database nodes have database roles. The status of the roles can be displayed using cluster status. If 50% or more of the database roles are down, then there is insufficient availability for the cluster to function as is. Either additional role servers must be added, or the nodes with down roles must be removed from the cluster and the cluster is reprovisioned. If there is insufficient (less than 50% means that the system is down) Database role availability, manual intervention is required to reprovision the system – downtime depends on the size of the cluster. Refer to the Operations Guide for details on DR Failover. Database role availability can be increased by adding Database roles, providing greater probability of automatic failover. To delete a failed node, and replace it with a new one if database primary is for example lost: The node can be deleted using cluster del <ip>. Extra nodes can be deployed and added to the cluster with cluster add <ip>. The database weights can be adjusted using database weight <ip> <weight>. Finally, the cluster can be reprovisioned with cluster provision.

The console output below shows examples of these commands.

The cluster status:

platform@cpt-bld2-cluster-01:~$ cluster status


Data Centre: jhb
 application : cpt-bld2-cluster-04[172.29.21.243]
 cpt-bld2-cluster-03[172.29.21.242]

 webproxy : cpt-bld2-cluster-06[172.29.21.245]
 cpt-bld2-cluster-04[172.29.21.243]
 cpt-bld2-cluster-03[172.29.21.242]

 database : cpt-bld2-cluster-04[172.29.21.243]
 cpt-bld2-cluster-03[172.29.21.242]


Data Centre: cpt
 application : cpt-bld2-cluster-02[172.29.21.241]
 cpt-bld2-cluster-01[172.29.21.240] (services down)

 webproxy : cpt-bld2-cluster-05[172.29.21.244]
 cpt-bld2-cluster-02[172.29.21.241]
 cpt-bld2-cluster-01[172.29.21.240] (services down)

 database : cpt-bld2-cluster-02[172.29.21.241]
 cpt-bld2-cluster-01[172.29.21.240] (services down)

Deleting a node:

platform@cpt-bld2-cluster-01:~$ cluster del 172.29.21.245
You are about to delete a host from the cluster. Do you wish to continue? y
Cluster successfully deleted node 172.29.21.245

Please run 'cluster provision' to reprovision the services in the cluster

Please note that the remote host may still be part of the database clustering
and should either be shut down or reprovisioned as a single node BEFORE this
cluster is reprovisioned
You have new mail in /var/mail/platform

Adding a node:

platform@cpt-bld2-cluster-01:~$ cluster add 172.29.21.245

Cluster successfully invited node 172.29.21.245

Please run 'cluster provision' to provision the services in the cluster

Database weights: listing and adding

platform@DC30-UN1:~$ database weight list
172.16.30.101:
weight: 40
172.16.30.102:
weight: 30
172.16.40.203:
weight: 20
172.16.40.204:
weight: 10
platform@DC30-UN1:~$ database weight add 172.16.30.101 40
172.16.30.101:
weight: 40
172.16.30.102:
weight: 30
172.16.40.203:
weight: 20
172.16.40.204:
weight: 10

Troubleshooting Installation

Fixing Keyboard Repeat Problems on vSphere

On VMware vSphere, there are known issues with key repeat problems which can sometimes cause problems while entering the password on the console during OVA deployment over slow-speed links.

This is documented in the http://kb.vmware.com/ on the VMware Knowledge Base as follows:

Procedure

Step 1

Power off the virtual machine

Step 2

Right-click the virtual machine and select Edit Settings.

Step 3

Click Options > General > Configuration Parameters.

Step 4

Click Add Row.

Step 5

Under Name, enter keyboard.typematicMinDelay. In the Value field, enter 2000000.

Step 6

Click OK.

Step 7

Power on the virtual machine.


Troubleshooting User Issues

Unlock a Locked Out User

If a user is locked out because a credential policy violation, an administrator responsible for the user can unlock the user account.

Procedure

Step 1

Log in as provider, reseller, or customer admin.

Step 2

Select User Management > Users.

Step 3

Click the user whose account you want to unlock.

Step 4

Click the Account Information tab.

Step 5

Uncheck the Locked check-box.

Step 6

Click Save.


Unlock a Locked Out Administrator

If an administrator is locked out because a credential policy violation, an administrator at a hierarchy node above the locked out administrator can unlock the administrator account.

Procedure

Step 1

Log in as provider, reseller, or customer admin, depending on the location of the locked out administrator.

Step 2

Select User Management > Local Admins.

Step 3

Click the administrator whose account you want to unlock.

Step 4

Click the Account Information tab.

Step 5

Uncheck the Locked check box.

Step 6

Click Save.


Credential Policies Rate Limiting

uses two types of failed login attempt rate limiting. These use a token bucket algorithm.

  • Per-user rate limiting

  • Per-source rate limiting

Failed Login Attempt Per-user Rate Limiting

Per-user failed login attempt rate limiting works as follows:

  • One token is added to the username-specific bucket at the interval specified in Reset failed Login Count per User (minutes).

  • The bucket can hold at most the number of tokens as specified in Failed Login Count per User. If the token is added when the bucket is full, it is discarded.

  • When a login attempt is made with an incorrect password, one token is removed from the bucket. When the last token is removed from the bucket, the rate limiting threshold is reached and the user account is locked for the number of minutes specified in Lock Duration (minutes).

  • Rate limiting is done for both existing and nonexistent system users.

  • The system user triggers a transaction, when an existing user account is locked. Example detail: Password retry limit reached. Locking account with the username "customer".

  • When an account is locked, subsequent login requests (regardless of whether the password is correct or not) from the GUI receives the following message: Too many failed login attempts for this user account. Try again later.

  • A locked account is automatically unlocked on the first login request after the number of minutes specified in Lock Duration (minutes) has lapsed. Account unlocking triggers a transaction as the "system" user. Example detail: Automatic account lockout duration lapsed. Unlocking the account with username "customer".

  • Per-user rate limiting can be disabled by checking the Disable Failed Login Limiting per User check-box.

Failed Login Attempt Per-source Rate Limiting

Per-source rate limiting process is similar to the per-user variant and works as follows:

  • One token is added to the source-specific bucket at the interval that is specified in Reset Failed Login Count per User (minutes).

  • The bucket can hold at most the number of tokens as specified in Failed Login Count per-source. If a token is added when the bucket is full, it is discarded.

  • When a login attempt is made with an incorrect password, one token is removed from the bucket. When the last token is removed from the bucket, the rate limiting threshold is reached and subsequent login requests from the source IP address are locked out for the number of minutes specified in Lock Duration (minutes).

  • No transactions are triggered when per-source rate limits triggered, since there is no associated resource.

  • When a source IP address is locked out, subsequent login requests (regardless of whether the password is correct or not) from the given IP address through the GUI receives the following message: Too many failed login attempts from the computer. Try again later.

  • A locked out source IP address is automatically unlocked on the first login request after the number of minutes specified in Lock Duration (minutes) has lapsed.

  • Per-source rate limiting can be disabled by checking the Disable Failed Login Limiting per-source check box.

Reset Your Own Password

You can reset your password only if you have already provided answers to the security questions created by your administrator.

If you forget your password while attempting to log in to :

  1. Enter your username in the Username field on the Log in screen.

  2. Click the Forgot Password? hyperlink that is located below the Log in button.

  3. Enter your username again.

  4. Click Reset my password.

  5. Click in each security question field and type the correct answer.

  6. Click in the New Password field and type your new password.

  7. Click in the Repeat Password field and retype your new password.

  8. Click Reset my Password. Your password is changed.

  9. Click the Login hyperlink if you want to attempt to log in again.

Troubleshooting Managed Services

Cisco Hosted Collaboration Mediation Fulfillment

Troubleshooting HCM-F Platform

This section describes about how to troubleshoot HCM-F.

Troubleshooting Backup and Restore

Issue: HCM-F backup appears incomplete.

Procedure
  Command or Action Purpose
Step 1

Run the utils disaster_recovery show_registration <hostname> command to check the list of registered components.

Step 2

Deactivate and reactive the services that were not registered as the components.

Step 3

Restart the services that were not registered as the components.

Step 4

Start the backup process again.

What to do next
See the Cisco Hosted Collaboration Mediation Fulfillment Maintain and Operate Guide for more information about Backup and Restore error messages.

Troubleshooting License Issues

HCM-F failed to generate license reports
Procedure
  Command or Action Purpose
Step 1

Delete duplicate entries of clusters in the HCM-F database.

Step 2

Clear the HCMF database. Verify if the HCM-F disk is full. If the disk is full, resolve the HCM-F disk full issue. For details on resolving the HCMF-disk full issue, refer to the Periodic Maintenance of HCM-F Disk Space topic in the

Cisco Hosted Collaboration Mediation Fulfillment Maintain and Operate Guide

Step 3

Ensure that UC applications are added to Unified CDM.

Step 4

Verify the version of PLM as minor version is not supported. Ensure that PLM is upgraded otherwise PLM fails to generate licenses for Unified CM and Unity Connection. For details on compatible version of PLM, refer to Cisco Hosted Collaboration Solution Compatibility Matrix.

What to do next

For information about troubleshooting Prime License Manager, see Cisco Hosted Collaboration Solution License Management.

Troubleshooting Infrastructure Manager

This section describes about troubleshooting Infrastructure Manager.

Troubleshooting Shared Data Repository

Procedure

Step 1

From the command line, issue the utils service list command to verify that the Cisco CDM Database Service is still running.

Step 2

Check the log files.

  • The activelog cdm/api logs contain only POJO API logs. Each service has its own log file. Cisco recommends that you use these log files to investigate only the issues that are not service-specific.

  • The activelog cdm/database logs contain database transaction logs.


Troubleshooting Cisco HCS Fulfillment Service

Procedure

Step 1

Issue the utils service list command to verify that the following services are running:

  • Cisco CDM Database

  • Cisco JMS Broker

  • Cisco HCS Fulfillment Service

Step 2

Issue the show hcs link auto-vm-linkage command to verify that the Cisco Hosted Collaboration Mediation Link Auto-VM-Linkage is enabled.

Step 3

Issue the utils diagnose hcs fulfillment command to view diagnostics for the Fulfillment service.

Step 4

Review the Fulfillment alarms located in activelog syslog/CiscoSyslog.

See Alarms Management on Cisco HCM-F Platform.
Step 5

Review the Fulfillment log files that are located in activelog hcs/fulfillment.

See Trace Management on Cisco HCM-F Platform and Table 1.

Troubleshooting Domain Manager Adapter for Service Assurance

Procedure

Step 1

Issue the utils service list command to verify that the following services are running:

  • Cisco CDM Database

  • Cisco JMS Broker

  • Cisco HCS Fulfillment Service

  • Cisco HCS DMA-SA Service

Step 2

Issue the show hcs link auto-primecollab-linkage command to verify that the Cisco Hosted Collaboration Mediation Link Auto-PrimeCollab-Linkage is enabled.

Step 3

Issue the utils diagnose hcs dmasa command to view diagnostics for the DMA-SA service.

Step 4

Review the DMA-SA alarms that are located in activelog syslog/CiscoSyslog.

See Alarms Management on Cisco HCM-F Platform.
Step 5

Review the DMA-SA log files that are located in activelog hcs/dmasa.

See Trace Management on Cisco HCM-F Platform and Table 1.

Troubleshoot HCS License Manager

The following sections identify common HLM errors.

Symptom: Deployment mode changed from enterprise mode to HCS mode in SDR.

Resolution: Set the deployment mode based on the license type that is used for PLM. For example, if you have added HCS license to PLM, set the Default Deployment Mode to HCS.

Symptom: Failed to set the default deployment mode for Unity cluster.

Resolution:

  1. Verify that the Unity Connection active disk partition is full. Check if the logs files are taking the active partition space. If yes, delete the unwanted logs.

  2. Verify that the VMware Tools update on Unified CM.

  3. Reboot the Unity Connection server.

  4. Assign Unity Connection server to PLM via HLM.

  5. Perform a sync on PLM.

Symptom: Can't create a Prime License Manager in the HCS space.

Resolution:

  • Check the network connection to the installed Prime License Manager with the specified hostname.

  • Verify that the User-ID/Password for connecting to the Prime License Manager is valid.

  • If an FQDN is used for the Prime License Manager name, verify that HCM-F can resolve it.

  • Ensure that the Prime License Manager name entered is not used by any existing Prime License Manager instances in the HCS space.

  • Upload a valid license file to the installed Prime License Manager.

Symptoms: PLM doesn't cover foundation licenses.

Resolution

  • Verify that the license that is installed on the PLM is correct. For example, HCS, HCS-LE or Enterprise license.

  • Verify the deployment mode. The deployment mode must match with the license that is installed on the PLM. If there is mismatch, PLM fails to recognize the licenses.

Symptom: Can't delete a Prime License Manager instance from the HCS space.

Resolution: Determine if a Unified Communications Manager cluster is still assigned to the Prime License Manager.

Symptom: The License Manager Summary page doesn't display the cluster after clicking on Assign. HCM-F displays the Sorry an error occurred message.

Resolution: Verify if it is the JMS timeout issue. If yes, install two cop files. Contact Cisco TAC for cop files.

Symptom: The provisioned UC cluster doesn't appear in the eligible list for assigning to a Prime License Manager. Sorry an error occurred message is displayed in HCM-F.

Resolution

  • Ensure that the Unified Communications cluster is either a Unified Communications Manager cluster or a Cisco Unity Connection cluster.

  • Verify that the cluster version is 9.0 or later. Verify that the UC application is a publisher node in HCM-F.

  • Verify that there are no duplicate entries (of any cluster or customer).

Symptom: An eligible Unified Communications cluster assignment operation isn't allowed.

Resolution
  • Ensure that the number of clusters that is assigned to the target Prime License Manager doesn't exceed 1000.

  • Ensure to add the reseller configuration manually to the SDR, if the cluster has a reseller configured. Perform a resync operation after the configuration.

  • Verify the Prime License Manager configuration in HCM-F. Ensure that valid information is provided in all mandatory fields.

Symptom: Hosted PLM giving App errors on CER customers. Post upgrade to PLM 11.5, all the CER customer clusters lost their licenses despite successful sync everyday. CER shows status as application error on the PLM.

Resolution: Reboot the PLM. In HCM-F, unassign and reassign the CER cluster (which shows the application error) to PLM.

Symptom: An eligible Unity Cluster assignment to PLM fails with the following error message: Status: Failed Description: Assigning cluster C-CCA-VM1 to LM hcs01plm001 failed

Resolution: Verify the firewall pinhole and ensure that it is resolved.

Symptom: Assigning or unassigning a cluster failed.

Resolution:

  • Verify that the provisioned platform (OS Admin) credential for the cluster is valid.

  • Verify the network connection to the Unified Communications cluster and Prime License Manager.

  • If an FQDN is used for the Prime License Manager name, verify that HCM-F can resolve it.

  • Ensure that the Platform Administrative Web Service is started in the Unified Communications cluster.

  • Review the job description to identify the cause.

  • Configure the platform credentials in Prime License Manager for the Unified Communications cluster so that they can be licensed.

Symptom: Receiving a HLMAuditWarningAlarm.

Resolution: It has the following resolutions:

  • Verify that the cluster was added back to the Prime License Manager by HLM, if SDR reported that an extra cluster was assigned to a Prime License Manager but Prime License Manager doesn't have it.

  • Manually remove the cluster from Prime License Manager if it wasn't assigned by HLM and when the Prime License Manager reports an extra cluster assigned to it.

  • Verify that the assigned cluster's platform credential is the same as its credential in Prime License Manager, if auditing reported a mismatch.

Symptom: Receiving a HLMChangeNotifAlarm.

Resolution: Review the HLM log to identify which component was affected. If a cluster was deleted, log into Prime License Manager to ensure that the cluster isn't assigned. Remove the cluster from Prime License Manager if it's in the inventory. If a customer was deleted, log in to Prime License Manager to ensure none of this customer's clusters are still assigned. Remove the clusters from Prime License Manager if any of them appear in the inventory.

Symptom: Receiving a HLMClusterPLMIncompatibleAlarm after assigning a cluster.

Resolution: Log into Prime License Manager and perform a synchronization. Verify that the newly assigned cluster's license is compliant. If the license compliance fails, unassign the cluster then upgrade the cluster to the same version of Prime License Manager. Or assign the cluster to the Prime License Manager with the same version.

Symptom: Unable to upload the HCM-F licenses in HCS License Manager.

Resolution: Verify that the correct procedures are followed for adding a cluster, and then assigning a cluster to PLM.

Symptom: Cisco Dual-Mode for iPhone uses a separate HCS foundation license. In Unified CM, a user has been associated with a deskphone (xxxx), a Jabber Softphone and a Cisco Dual-Mode for iPhone, and the HCMF server shows a report that the Subscriber has three devices with the same phone number but the Dual-Mode device consuming a 'HCS Foundation License' at the same time. If the Subscriber is 'HCS Standard User' and has all three devices associated, then Dual-mode device must NOT be consuming an HCS Foundation License.

Resolution: Reboot the Unified CM publisher.

Symptom: The UC clusters are removed from the HCM-F environment without unassigning them from PLM -from where, but they are still present in HCM-F in the Cluster page (Infrastructure Manager > Cluster Management > Clusters), and in the assigned state on the License Management Summary page (Infrastructure Manager > License Manager Summary). This results in License Reports failure.

Resolution: Remove the UC cluster instance from HCM-F DB.

Troubleshooting Cisco HCS North Bound Interface Web Service API

Procedure

Step 1

Issue the utils service list command to verify that the following services are running:

  • Cisco CDM Database Service

  • Cisco JMS Broker

  • Cisco Tomcat

  • Cisco HCS Admin UI

  • Cisco HCS SDR UI

  • Cisco HCS North Bound Interface Web Service

  • Cisco HCS VCenterSync Service

  • Cisco HCS License Manager Service

  • Cisco HCS Service Inventory

  • Cisco HCS NBI REST FF Web Service

  • Cisco HCS NBI REST SDR Web Service

Step 2

Issue the utils diagnose hcs nbi command to review diagnostics information for the North Bound Interface Web Service.

Step 3

Review the log file activelog tomcat/logs/nbi/log4j.


Troubleshooting SDR Change Notification Service

Procedure

Step 1

Issue the utils service list command to verify that the following services are running:

  • Cisco CDM Database

  • Cisco JMS Broker

Step 2

Issue the utils diagnose hcs sdrcnf command to view diagnostic information on the SDRCNF service.

Step 3

Review the SDRCNF alarms that are located in the activelog syslog/CiscoSyslog.

For more information, see Alarms Management on Cisco HCM-F Platform.
Step 4

Review the SDRCNF log files that are located in the activelog hcs/sdrcnf .

See Trace Management on Cisco HCM-F Platform and Table 1.

Troubleshooting Synchronization Services

This section describes about troubleshooting all the synchronization services.

Troubleshooting Cisco HCS UCSMSync Service

Procedure

Step 1

Issue the utils service list command to verify that the following services are running:

  • Cisco CDM Database

  • Cisco JMS Broker

  • Cisco Tomcat

  • Cisco HCS Admin UI

  • Cisco HCS SDR UI

  • Cisco HCS Fulfillment Service

  • Cisco HCS UCSMSync Service

Step 2

Review the diagnostics information for the UCSMSync service.

  • From the CLI, run the utils diagnose hcs ucsmsync command.
  • From the Infrastructure Manager interface, select Administration > Diagnostics. Select UCSMSync and click Request Diagnostics.
Step 3

From the Infrastructure Manager interface, select Administration > Sync Request to run a manual UCSMSync.

Step 4

From the Infrastructure Manager interface, select Administration > Jobs to review the Status Info and Recommended Action in the job results table.

Step 5

Review the UCS Manager alarms that is located in activelog syslog/CiscoSyslog.

See Alarms Management on Cisco HCM-F Platform.
Step 6

Review the UCSMSync log files that are located in activelog hcs/ucsmsync.

See Trace Management on Cisco HCM-F Platform and Table 1.
Step 7

Use HCM-F RTMT to connect to the HCM-F and check the overall health of the system.

Using HCM-F RTMT, you can browse, query, and collect trace and log files. You can also view alarms and enable remote real time tracing.

Troubleshooting Cisco HCS VCenterSync Service

Procedure

Step 1

Issue the utils service list command to verify that the following services are running:

  • Cisco CDM Database

  • Cisco JMS Broker

  • Cisco Tomcat

  • Cisco HCS Admin UI

  • Cisco HCS SDR UI

  • Cisco HCS Fulfillment Service

  • Cisco HCS VCenterSync Service

Step 2

Review the diagnostics information for the VCenterSync service.

  • From the CLI, run the utils diagnose hcs vcentersync command.
  • From the Infrastructure Manager interface, select Administration > Diagnostics. Select VCenterSync and click Request Diagnostics.
Step 3

From the Infrastructure Manager interface, select Administration > Sync Request to run a manual VCenterSync.

Step 4

From the Infrastructure Manager interface, select Administration > Jobs to review the Status Info and Recommended Action in the job results table.

Step 5

Review the VCenterSync alarms that are located in activelog syslog/CiscoSyslog.

See Alarms Management on Cisco HCM-F Platform.
Step 6

Review the VCenterSync log files that are located in activelog hcs/vcentersync.

See Trace Management on Cisco HCM-F Platform and Table 1.
Step 7

Use HCM-F RTMT to connect to the HCM-F and check the overall health of the system.

Using HCM-F RTMT, you can browse, query, and collect trace and log files. You can also view alarms and enable remote real time tracing.

Troubleshooting Platform Manager

This section describes about how to troubleshoot Platform Manager.

Prime Collaboration Deployment for UC Applications

Cisco Prime Collaboration Deployment helps you to manage Unified Communications (UC) applications. Its functions are to:

  • Migrate a cluster of UC servers to a new cluster (such as MCS to virtual, or virtual to virtual).


    Tip

    Cisco Prime Collaboration Deployment does not delete the source cluster VMs after migration is complete. You can fail over to the source VMs if there is a problem with the new VMs. When you are satisfied with the migration, you can manually delete the source VMs.


  • Perform operations on clusters, such as:

    • Upgrade

    • Switch version

    • Restart

  • Fresh install a new release UC cluster

  • Change IP addresses or hostnames in clusters (for a network migration).

    Cisco Prime Collaboration Deployment supports simple migration and network migration. Changing IP addresses or hostnames is not required for a simple migration. For more information, see the Prime Collaboration Deployment Guide.

The functions that are supported by the Cisco Prime Collaboration Deployment can be found in the Prime Collaboration Deployment Administration Guide.

Cisco supports virtualized deployments of Cisco Prime Collaboration Deployment. The application is deployed by using an OVA that contains the preinstalled application. This OVA is obtained with a licensed copy of Cisco Unified Communications Manager software. For more information about how to extract and deploy the PCD_VAPP.OVA file, see the Cisco Prime Collaboration Deployment Administration Guide.

In your Cisco HCS environment, install only one instance of Cisco Prime Collaboration Deployment, which must have the following:
  • Access to all Cisco Unified Communications Manager clusters for all customers, including those behind a NAT

  • A fixed, nonoverlapping IP address

Use the Cluster Discovery feature to find application clusters on which to perform fresh installs, migration, and upgrade functions. Perform this discovery on a blade-by-blade basis.

For more information about features, installation, configuration and administration, best practices, and troubleshooting, see the following documents:

Troubleshooting Cisco HCS Platform Manager Service

Procedure

Step 1

Issue the utils service list command to verify that the Cisco Platform Manager Service is running.

Step 2

Check for communication problems between the servers.

Verify that the Platform SOAP Services or Platform Administrative Web Service is active on any of the Cisco Unified Presence, Cisco Unified Communications Manager, or Cisco Unity Connection servers you want Platform Manager to access.
Step 3

If you have an issue with an upgrade task, check the server type in the server group. For upgrade tasks, the publisher server and subscriber servers cannot be in the same group.

Step 4

Review the Platform Manager error messages.

See Common Platform Manager Errors.
Step 5

Review the Platform Manager log files.

See:

Common Platform Manager Errors

This section describes about the common Platform Manager errors.

Could Not Contact Server or Server Not Available

Ensure that the connections between all Unified Communications applications and Platform Manager are established before you run a task. All Unified Communications applications must be contacted at least once before you run the first Platform Manager task. SFTP or FTP and Unified Communications applications must be routable from Platform Manager; for example, if NATs are used, use public IP. Likewise, the SFTP or FTP servers must be routable from the Unified Communications applications.

Cannot Edit a Backup Schedule Task
A backup schedule task exists but needs some updates

A backup task cannot be edited after it is created; however, you can edit a backup schedule task.

  1. Save settings for the backup that needs to be changed.

  2. Create a new backup with the saved settings.

  3. When you create the new backup, use the saved settings from the first step.

  4. Modify the settings, as required.

  5. Save the backup.

  6. Delete the old backup.

Cancelled a Backup but Some Servers Still Backed Up
Backup server task was cancelled but some servers were still backed up

Backup schedule tasks can be cancelled while in process. Any servers in the group, however, that have started backing up when you cancel the task do not stop midtask. These servers are still backed up.

Could Not Diagnose a Failed Backup
A backup failed and more details are required to determine the issue

If a backup schedule task fails, review the DRS logs.

Servers in Backup Task Marked as Skipped
The backup server task completed but some servers were listed as "Skipped"

"Skipped" servers have a first node server. After the first node server is backed up, all other servers in the group are skipped. Backing up the first node server ensures that the other servers in the group are also backed up. These servers appear as "Skipped" in the Backup Task List. A server also appears Skipped if it has a pre 9.x release version. Backup Scheduler can only backup servers with software versions higher than 9.0.

Platform Manager Log Files

When you troubleshoot issues for Platform Manager, you can access the following log files on the Cisco HCM-F platform at the following locations:

  • file get activelog tomcat/logs/platform-api/log4j/*—This log file includes information generated by the Unified Communications applications. The same log file is also stored on the application server. Using this command, you can view:

    • SOAP messages from Platform Manager including inputs, results, errors, and messages

    • Calls to underlying OS components like the upgrade scripts

  • file get activelog tomcat/logs/pm/log4j/*—This log file includes information from Platform Manager. Using this command, you can view:

    • REST traffic between the browser and Platform Manager including inputs, results, errors, and messages

    • SOAP messages to the Unified Communications applications including inputs, results, errors, and messages

    • Database access including updates, queries, and results

    • Task-related events like scheduling, starting, and updating tasks

    • Background jobs like synchronization tasks

Troubleshooting Service Inventory

This section describes about how to troubleshoot Service Inventory.

Troubleshooting Cisco HCS Service Inventory

Procedure

Step 1

Issue the utils service list command to verify that the Service Inventory service is running.

Depending on the reports requested, verify that the following services are also running:
  • Cisco HCS Admin UI

  • Cisco HCS SDR UI

  • Cisco HCS SI UI

  • Cisco CDM Database

  • Cisco HCS North Bound Interface Web Service

  • Cisco HCS Fulfillment Service

  • Cisco HCS NBI REST SDR Web Service

  • Cisco HCS UCPA Service

  • Cisco HCS Provisioning Adapter Service

  • Cisco Tomcat

Step 2

Check the status of the Service Inventory jobs by selecting Administration > Jobs from the Infrastructure Manager menu. Service Inventory Report jobs who the Entity Name as "ONDEMAND" and "DAILY_SCHEDULE".

Only one report can run at a time. A report that is currently running shows the Status as
In Progress.
Queued reports show the Status as
Requested. 
Step 3

If a job is stuck, you can remove the job by selecting in it on the Jobs page and clicking Delete Selected. Restarting the HCS Service Inventory service from the CLI fails any in progress jobs and cancel any requested jobs.

Step 4

Enabling aggregate reports by selecting Each reseller and customer when scheduling a report can slow down the report processing, and require additional resources. So, check this only when required.

Enabling aggregate reports creates additional report files for each reseller and customer apart from the regular. SI file also creates a Provider Level Summary file. All these reports are pushed to SFTP and Backup SFTP, if those have been configured under Service Inventory.
Step 5

If you have to generate a location report, at least one SI report has to be previously generated.

Step 6

Review the Cisco HCS Service Inventory alarms that are located in activelog syslog/CiscoSyslog.

See Alarms Management on Cisco HCM-F Platform.
Step 7

Review the Cisco HCS Service Inventory log files that are located in:

  • activelog tomcat/logs/catalina.out which includes request and response messages to and from Cisco Unified Communications Domain Manager.

  • activelog tomcat/logs/si/log4j which contains all Service Inventory-specific operations.

See Trace Management on Cisco HCM-F Platform and Table 1.

If you are using SI without Unified CDM, log in as root in HCM-F Command Line Interface (CLI), and review the logs in the following location:

  • /var/log/active/hcs/chpa – Provisioning Adapter Service Log files

  • /var/log/active/hcs/ucpa– ucpa Service Log files


Common Service Inventory Errors

The following section contains common Service Inventory errors.

Service Inventory Job Scheduling Does Not Work-Report Does Not Get Generated

Service Inventory job scheduling relies on the service provider name for Cisco Unified Communications Domain Manager, which appears in the Infrastructure Manager administrative interface (Service Provider > Administration) and exists in the Shared Data Repository.

If Cisco Unified Communications Domain Manager is used, the Service Provider is automatically pushed to HCM-F.

If Cisco Unified Communications Domain Manager is not used, the Service Provider can be manually configured in Infrastructure Manager.

Perform the following tasks, depending on your configuration:

Service Inventory Cannot Authenticate to Cisco Unified Communications Domain Manager-Cannot Receive Files

The Service Inventory service encountered a runtime error and cannot validate the request from Cisco Unified Communications Domain Manager; therefore, the Service Inventory service cannot receive the files from Cisco Unified Communications Domain Manager.

Verify that you configured the username and password correctly for Cisco Unified Communications Domain Manager in the Infrastructure Manager administrative interface.

Service Inventory Connection to Cisco Unified Communications Domain Manager Failed-Cannot Retrieve Files

The Service Inventory service encountered a runtime error and cannot connect to the Cisco Unified Communications Domain Manager; therefore, the Service Inventory service cannot receive the files from Cisco Unified Communications Domain Manager.

Perform the following tasks:

  • Verify that Cisco Unified Communications Domain Manager is up and running.

  • In the Infrastructure Manager administrative interface, verify that you correctly configured the SOAP port for Cisco Unified Communications Domain Manager.

  • In the Infrastructure Manager administrative interface, verify that you correctly configured the hostname and IP address for Cisco Unified Communications Domain Manager.

Service Inventory Did Not Receive the Files from Cisco Unified Communications Domain Manager After Time Passed

Service Inventory did not receive the files from Cisco Unified Communications Domain Manager after 1 hour passed.

Perform the following tasks:

  • Log in to Cisco Unified Communications Domain Manager. Select General Tools > Transactions. Review the transactions to determine if the transactions failed.

    • For example, the following message may appear in the transaction: Unhandled exception encountered while performing request processing. Report generation failure. FTP failure. Is there a file of the same name on the FTP server?

      In the Service Inventory administrative interface, verify that you configured the SFTP port correctly on the Configuration page.

    • For example, the following message may appear in the transaction: Unhandled exception encountered while performing request processing. Report generation failure. FTP failure. Authentication failed.

      On the Configuration page in the Service Inventory administrative interface, correct the user credentials for Cisco Unified Communications Domain Manager SFTP access to Service Inventory.

    • For example, the following message may appear in the transaction: Unhandled exception encountered while performing request processing. Report generation failure. FTP failure. Is there a file of the same name on the FTP server? [Errno -2] Name or service not known.

    • Ensure that the Cisco HCM-F platform network connection works as expected.

    • If Cisco Unified Communications Domain Manager has DNS enabled, run the nslookup command on Cisco Unified Communications Domain Manager to ensure that the Service Inventory hostname is resolved.

    • If Cisco Unified Communications Domain Manager does not use DNS, verify that you configured the IP address for the Service Inventory server on the Configuration page in the Service Inventory administrative interface.

Service Inventory Received an Empty or Incomplete File from Cisco Unified Communications Domain Manager

Service Inventory received the file from Cisco Unified Communications Domain Manager, but the file is empty or does not contain all data.

In the Infrastructure Manager administrative interface, verify that the Provider configuration matches the configuration that is in Cisco Unified Communications Domain Manager.

The Remote SFTP Server Did Not Receive the Report

Symptoms

The remote SFTP server did not receive the report that Service Inventory transferred.

Resolution

  • Connection to SFTP servers have failed at either the primary or secondary location. On the Configuration page in the Service Inventory administrative interface, verify that the remote SFTP server configuration is correct.

Display Diagnostic Reports

This section provides information about the diagnostic reports.

Using Infrastructure Manager Administration GUI

Procedure

Step 1

From the Infrastructure Manager interface, select Administration > Diagnostics.

Step 2

Select the diagnostic you want from the pulldown menu, and click Request Diagnostics.


Utils Commands

Use the following commands to diagnose problems for Cisco HCS services:

Note

The commands shown here are available on an Application Node. A WS Node has a different set. Use the help utils diagnose hcs command to display the available commands.


  • utils diagnose hcs

  • utils diagnose hcs agp

  • utils diagnose hcs chpa

  • utils diagnose hcs cnf

  • utils diagnose hcs cucdmpa

  • utils diagnose hcs dmasa

  • utils diagnose hcs fulfillment

  • utils diagnose hcs hlm

  • utils diagnose hcs nbi

  • utils diagnose hcs sdrcnf

  • utils diagnose hcs si

  • utils diagnose hcs ucpa

  • utils diagnose hcs ucsmsync

  • utils diagnose hcs usersync

  • utils diagnose hcs vcentersync

Troubleshooting with Cisco HCM-F Real-Time Monitoring Tool

Cisco HCM-F Real-Time Monitoring Tool (RTMT), which runs as a client-side application, uses HTTPS to monitor system performance. RTMT has performance counters for Memory, Network, CPU, Disk, Process, and Services including JVM statistics. RTMT can connect directly to devices through HTTPS to troubleshoot system problems.

Launch RTMT

The RTMT application launches when you double-click the application icon or open the application, but does not work properly unless you log in on the proper type of server. In this case, a Cisco Hosted Collaboration Mediation Fulfillment (Cisco HCM-F) server.


Note

You can launch more than one RTMT session, with each session connecting to a different server (for example, one session connection to the HCM-F application server and another session connection to an HCM-F Web Services server). However, Cisco does not recommend multiple RTMT sessions.

For details on installing RTMT, see section Install HCM-F Real Time Monitoring Tool, in the Cisco Hosted Collaboration Mediation Fulfillment Install and Configure Guide.


Before you begin

Ensure that a Cisco CDM Database service is running on the Cisco HCM-F server to which you want to establish the RTMT connection.

Procedure

Step 1

To launch RTMT, perform one of the following tasks:

  • On the Windows desktop, double click the Real-Time Monitoring Tool icon.

    Alternatively, select Start > Programs > Cisco > HCS > Real-Time Monitoring Tool.

  • For Linux: If a shortcut does not appear on the desktop, you can use /opt/Cisco/HCS/JRtmt to start the RTMT.

The Real-Time Monitoring Tool Login dialog appears.

Step 2

In the Host IP Address field, enter either the IP address or the hostname of the Cisco HCM-F server.

Step 3

Enter the port that the application uses to listen to the server.

The default port is 8443.

Step 4

Check the Secure Connection check box.

Step 5

Click OK.

If the Add Certificate to Store dialog appears, click Accept to continue.

The Authentication Required dialog appears.

Step 6

In the User Name field, enter the Administrator username for the application.

Step 7

In the Password field, enter the password for the Administrator username.

If the authentication fails or if the server is unreachable, RTMT prompts you to reenter the server and authentication details, or you can click Cancel to exit the application.

If authentication succeeds, RTMT launches the monitoring module from local cache or from a remote server, if the local cache does not contain a monitoring module that matches the back-end version. The Cisco HCM-F Real-Time Monitoring Tool window and the Select Configuration dialog box appear.

Step 8

Select a profile, and then click OK.


Alarms Management on Cisco HCM-F Platform

Alarms provide information about runtime status and the state of the system, so you can troubleshoot problems that are associated with your system; for example, to identify issues with the Disaster Recovery System. Alarm information, which includes an explanation and recommended action, also includes the application name and machine name to help you perform troubleshooting.

You configure the alarm interface to send alarm information to multiple locations, and each location can have its own alarm event level (from debug to emergency). Alarms can go to the Syslog Viewer (local syslog), Syslog file (remote syslog), SNMP traps, Cisco HCM-SA (Service Assurance), or to all destinations.

When a service issues an alarm, the alarm interface sends the alarm information to the locations that you configure (and that are specified in the routing list in the alarm definition). The system can either forward the alarm information, as is the case with SNMP traps, or the system can write the alarm information to its final destination (such as a log file).

When you enter the alarm CLI command, the system prompts you for the required parameters. Enter the values to see the output.

The following table shows the commands for working with alarms on the Cisco HCM-F platform:

Table 3. Alarm CLI Commands

Task

Command

Display the alarm configuration for a specific service or list of all services

show alarm

Required Parameter:

servicename—Name of the service. It can contain multiple words.

Example:

Enter the servicename as all to show the alarm configurations of all the services.

Enter the servicename as Cisco Tomcat to show the alarm configuration of Cisco Tomcat service.

Enable or Disable alarms for a particular destination

set alarm status

Required Parameters:

status—enable or disable.

servicename—Name of the service. It can contain multiple words.

monitorname—SDI, SDL, Event_Log, or Sys_Log.

Enable alarms for a remote Syslog server

set alarm remotesyslogserver

Required Parameters:

servicename—Name of the service. It can contain multiple words.

servername—Name of the remote Syslog server.

Set the event level for an alarm

set alarm severity

Required Parameters:

servicename—Name of the service. It can contain multiple words.

monitorname—SDI, SDL, Event_Log, or Sys_Log.

severity equals one of the following:

  • Emergency—This level designates the system as unusable.

  • Alert—This level indicates that immediate action is needed.

  • Critical—The system detects a critical condition.

  • Error—This level signifies that an error condition exists.

  • Warning—This level indicates that a warning condition is detected.

  • Notice—This level designates a normal but significant condition.

  • Informational—This level designates information messages only.

  • Debug—This level designates detailed event information that Cisco TAC engineers use for debugging.

Set alarm configuration to default values

Tip 
This option is available only for service names beginning with Cisco.

set alarm default

Required Parameters:

servicename—Name of the service. It can contain multiple words.

Trace Management on Cisco HCM-F Platform

Traces assist you in troubleshooting issues with your application. You use the CLI to specify the level of information that you want traced as well as the type of information that you want included in each log file. You can configure trace parameters for any service on the Cisco HCM-F platform.

After you configure the information that you want to include in the log files for each service, you can collect and view log files through log collection. To do this, configure trace using the set trace CLI command.

You can configure the level of information that you want traced (debug level), what information you want to trace (trace fields), and information about the trace files (such as number of files per service, size of file, and time that the data is stored in the log files).

Trace Setup

You use the command line interface (CLI) to enable and disable tracing as well as to configure trace settings for specific services on the Cisco HCM-F platform. As soon as you enter the CLI command, the system prompts you for the required parameters. For more information regarding trace collection, see Log Collection.

The following table shows the commands for working with traces on the Cisco HCM-F platform:

Table 4. Trace CLI Commands

Task

Command

Display the trace configuration for a specified service

show trace

Required parameter:

servicename—Name of the service. It can contain multiple words.

Example:

Enter the servicename as all to show the trace configurations of all the services.

Enter the servicename as Cisco AMC Service to show the trace configuration of Cisco AMC Service.

Display the trace levels available for a specified service

show tracelevels

Required parameter:

servicename—Name of the service. It can contain multiple words.

Enable or Disable trace for a specified service

set trace status

Required parameters:

status—enable or disable

servicename—Name of the service. It can contain multiple words.

Specify the debug trace level settings for a specified service

set trace tracelevel

Required parameters:

tracelevel—Use show tracelevels CLI command to find the trace levels for a given servicename.

servicename—Name of the service. It can contain multiple words. You can obtain the name of the service from the utils service list CLI command.

Specify the maximum size of a trace files for a specific service from 1 to 10 megabytes.

set trace maxfilesize

Required parameters:

servicename—Name of the service. It can contain multiple words.

size—Maximum size of the trace files from 1 to 10 megabytes.

Specify the maximum number of log files per service.

The system automatically appends a sequence number to the file name to indicate which file it is; for example, cus299.txt. When the last file in the sequence is full, the trace data begins writing over the first file.

set trace maxnumfiles

Required parameters:

servicename—Name of the service. It can contain multiple words.

filecount—Number of trace files from 1 to 10000.

Set the user categories flag to the value provided, for a specified service.

Tip 
This option is available only for service names beginning with Cisco.

set trace usercategories

Required parameters:

flagnumber—Hexadecimal value from 0 to 7FFF. 7FFF means all the flags are enabled.

servicename—Name of the service. It can contain multiple words.

Set trace configuration to default values for a specified service.

Tip 
This option is available only for service names beginning with Cisco.

set trace default

Required parameter:

servicename—Name of the service. It can contain multiple words.

Log Collection

You can collect log files by performing any of the following tasks:

  • To view the log files directly from the CLI, enter the following the CLI commands:

    • file list

    • file view

    • file search

  • To bundle the various log files and send them to the local SFTP directory, enter the CLI command file get.

    Then, use an SFTP client to obtain the .tar files and send them to the team that troubleshoots.

Use Cisco HCM-SA (Service Assurance) tools to obtain the log files.

Alarms

A number of HCM-F services generate alarms that the system captures in /var/log/active/syslog/CiscoSyslog. The following table shows the HCM-F services with the default alarm severity setting.

Service Default Alarm Severity Setting for Event Log
Cisco HCS VCenterSync Service Error
Cisco HCS Fulfillment Service Error
Cisco HCS DMA-SA Service Error
Cisco HCS Service Inventory Error
Cisco Platform Manager Service Error
HCS License Manager Service Error

HCS License Manager Alarm Integration

Alarm Name Severity Description
HLMGenericAlarm Error This alarm indicates an uncategorized problem within HLM.
HLMAssignFailAlarm Error Assign a component (cluster/customer) to a PLM has failed.
HLMUnassignFailAlarm Error Unassign a component(cluster/customer) from a PLM has failed.
HLMAuditWarningAlarm Warning A discrepancy between assigned clusters in SDR and a PLM has been discovered while running the HLM periodical audit.
HLMSetDeploymentModeFailAlarm Error Failed to set a component to the HCS Global deployment mode.
HLMChangeNotifyAlarm Warning A change notification on a component has been observed.
HLMClusterELMIncompatibleAlarm Error The cluster was not defined on the HCMF.

View and Set Alarm Severity Level

Use the CLI show alarm command to view alarm configuration. At the prompt, enter the service name to view the current alarm severity setting for the service. To view the alarm configuration for all the services, use all in place of a service name.

Use the CLI set alarm severity command to set the HCM-F service alarm severity. Use the CLI set alarm default command to reset the service alarm settings to the default values.

Performance Counters and Objects Collection

Download the RIS Performance Log file (cm/log/ris/csv/PerfMon_hostname_date_time.csv). Use Windows Perfmon Viewer to view the log file. You can also use the RTMT client to view the downloaded HCM-F RIS Performance log file.

Cisco Prime License Manager

For information about troubleshooting Cisco Prime License Manager, see the Troubleshooting section in the Prime License Manager User Guide.

Common License Dashboard Errors

This topic provides the type of error scenarios of License Dashboard while using APIs.

License Dashboard doesn't show the license information of Customers.

Symptoms: System displays the following error:
Response Code: 404 Not Found

{
 "componentCode" : "NBIREST",
 "msgCode" : "LICENSE_DASHBOARD_QUERY_ID_NOT_FOUND",
 "subParams" : null,
 "message" : "No License Info found for customer. Check if Customer Exists"
}

Resolution: Verify that the customer is associated with the PLM using the URL https://HCM-F_Server_IPaddress:8443/sdr/rest/licenseAnalytics/customerview/stats

License Dashboard doesn't show the license information of PLMs.

Symptoms: System displays the following error:
Reponse Code: 404 Not Found

{
 "componentCode" : "NBIREST",
 "msgCode" : "LICENSE_DASHBOARD_QUERY_ID_NOT_FOUND",
 "subParams" : null,
 "message" : "No License Info found for PLM. Check if PLM Exists"
}

Resolution: Verify that the PLM exists in HCM-F using the URL https://HCM-F_Server_IPaddress:8443/sdr/rest/licenseAnalytics/customerview/stats

License Report isn't generated for customers and PLMs.

Symptoms: System displays the following error:
Response Code: 503 Service Unavailable


{
 "componentCode": "NBIREST",
 "msgCode": "LICENSE_DASHBOARD_REPORT_MISSING_ERROR",
 "subParams": null,
 "message": "License Dashboard Information is not present. Cisco HCS Service Inventory Service is not running.
Please ensure there is a Daily Scheduled Service Inventory Job present for up-to-date License Dashboard. "
}

Resolution: Check the Last Sync time in the License Dashboard. The last sync time must be less than 24 hours. If it is more than 24 hours, ensure that you have triggered at least one Service Inventory Job (scheduled or on-demand).

License Dashboard shows old report for customers and PLMs.

Resolution: Check the Last Sync time in the License Dashboard. The last sync time must be less than 24 hours. If it is more than 24 hours, ensure that you have triggered one Service Inventory Job (scheduled or on-demand).


Note

We recommend triggering one Service Inventory Job (scheduled or on-demand) daily (every 24 hours) for License Dashboard to show the latest license information at PLM or Customer level. You can also set up schedule for report generation. For details on setting up the scheduled report, refer Set up Schedule for Daily Report Generation topic in Cisco Hosted Collaboration Solution Maintain and Operate Guide.

Expressway XMPP Architecture

This topic provides an overview of the internal architecture that is used for XMPP processing.

The above graphic illustrates an overview of the internal architecture that is used for XMPP processing.

Expressway-E and -C are extensions of the XMPP network. The green box with white circle is the XCP Router and runs in all nodes, including the Cisco Unified Communications Manager IM and Presence Service nodes. This component is responsible for routing stanzas from source to destination node in the overall XCP cluster. Various plug-in components run in each of the nodes to allow clients to log in, show presence, use contact lists (rosters), send and receive messages.

  • Connection Manager (CM) accepts connections from Jabber clients. Since clients can connect either directly to IM&P when inside the corp network, or through Expressway-E when outside the corp network, CM runs on IM and Presence Service and Expressway-E, but not Expressway-C.

  • Single Domain Name Service (SDNS) is responsible for routing login requests to the right authentication service running on IM and Presence Service. It translates the domain in the user's JID to an authentication service JID. SDNS is a component of the jabbered process.

Log Locations

XMPP and XCP logs are available in the Expressway-E, Expressway-C, and IM&P nodes. Here's how to access the logs in each node.

Node Type

How to Log In

Log Location

Log Configuration

Expressway

Log in with the root account

/mnt/harddisk/log/developer_log

You can tail the XCP logs only with the following command:

logfilter -i XCP

  • Sign in to GUI

  • Navigate to Maintenance > Diagnostics > Advanced > Support Log Configuration

  • Set the following to Debug or Trace level:

    • developer.xcp

    • developer.xcp.cm (applies to EXP-E only)

    • developer.xcp.jabber

IM&P

Log in with remote admin account, or log in to the admin CLI account and use corresponding file commands.

/var/log/active/epas/trace/xcp/log

XCP router logs are in rtr-jsm log files.

Authentication logs are in auth-svc log files.

  • Sign in to Serviceability page

  • Navigate to Trace > Configuration

  • Select IM&P server

  • Service group: IM and Presence Services

  • Service: Cisco XCP Router for router and jsm logs, Cisco XCP Authentication Service for auth logs, and so on.

  • Set Debug Trace Level to Debug

  • Save

Verify Jabber Connection Mesh

The first step to troubleshooting is to verify the connections that are used for XMPP messaging are properly established. This can be done easily using the following command that is logged in as root on each of the Expressway-E and Expressway-C nodes:

lsof -i :7400

lsof -i :5222

The two commands lists each of the connections that are established and listening on the 7400 and 5222 ports. The 7400 port is used for XMPP messaging between Expressway-E/Expressway-C and between Expressway-C/Cisco Unified Communications Manager IM and Presence Service. The 5222 port is used by Connection Manager (CM) for external message from Jabber to Expressway-E.

You can confirm this mesh with the Jabber configuration here:

/opt/jabber/xcp/etc/sdns_plugin-1.xml

Check JSM Sessions

The Jabber Session Manager (JSM) component in XCP is responsible to track all Jabber client login sessions. In our environment, JSM is only used in the IM&P node, not Expressway. All login sessions, either direct or through MRA, are tracked in the IM&P node that is assigned to the user. You can check the JSM sessions currently active in an IM&P node using the perfmon counters output from the admin CLI.

Procedure


Step 1

Log in to the IM&P admin CLI (not the remote admin account).

Step 2

Issue the following command:

show perf list instances "Cisco XCP JSM Session Counters"

This lists all sessions across all users. For example, the following output shows 2 sessions for user1 and 1 session for user2.

admin:show perf list instances "Cisco XCP JSM Session Counters"
==>perf class (Cisco XCP JSM Session Counters) has instances:
* Instance Name
- user1@customer018.com/composed
- user2@customer018.com/composed
- user3@customer018.com/composed
- user2@customer018.com/jabber_17231
- user1@customer018.com/jabber_17358
- user1@customer018.com/jabber_12321

Delayed Cisco XCP Router Restart

The delayed Cisco XCP Router restart feature is only available when the Cisco Expressway-E are in multitenant mode.

The Expressway-E enters multitenant mode when a second Expressway-C cluster is detected.

Multitenancy allows a service provider to share an Expressway-E cluster among multiple tenants. Each tenant has a dedicated Expressway-C cluster that connects to the shared Expressway-E cluster.

See the Cisco Expressway Multitenant Deployment Guide on the Expressway configuration guides page.

A restart is required for XCP router configuration changes to take effect across all nodes in a multitenant Expressway-E cluster. The restart affects all users across all customers.

Certain configuration changes on the Expressway-E cluster, or a customer’s Expressway-C cluster, require a restart of the XCP router on each Expressway-E in the shared cluster.

To reduce the frequency of this restart, and the impact it has on users, you can use the delayed XCP router restart feature.


Note

Without the delayed restart feature that is enabled, the restart happens automatically and occurs each time that you save any configuration change that affects the XCP router. If multiple configuration changes are required, resulting in several restarts of the XCP router, it can adversely affect users. We strongly recommend that multitenant customers enable the delayed XCP router restart feature.


The delayed restart feature lets you control when the restart takes place. You can make a batch of configuration changes - followed by a single XCP router restart – and apply all the changes at once.

A delayed restart generates the latest configuration and performs an XCP router restart on each node in the multitenant Expressway-E cluster.

When a restart of the XCP router occurs, all XMPP clients (such as Cisco Jabber) across all customers go offline for a few minutes and then reconnect. Because of this impact, Cisco recommends that you take advantage of the delayed restart capability.

Once enabled, you can carry out the restart manually or set it to be schedule-based. In either mode, you can initiate the restart at any time and the system determines which XCP router instances require a restart, performing the restart only as needed.

When you set the restart to be scheduled, the restart happens at the scheduled time, but again only as needed. Cisco recommends performing the XCP router restart during off-peak hours whenever possible.


Note

  • Nodes on the latest configuration are not impacted. This action disconnects all external XCP-based users connected through the delayed nodes during the restart.

  • All nodes will be on the latest configuration after the restart.


To configure the delayed XCP router restart:

  1. Go to Configuration > Unified Communications > Delayed Cisco XCP Router restart..

  2. Under Configuration, turn Delayed Cisco XCP Router restart to On.

  3. If you do not enable scheduled restart, click Restart to initiate the restart manually as configuration changes do not happen automatically.

To schedule the restart:

  1. Under Configuration, set Scheduled Restart to On and set the time that all nodes in the multitenant Expressway-E cluster are updated each day. Only nodes that are not running on the latest configuration are impacted.

  2. Set the time that the restart takes place each day using the Scheduled restart time (UTC) option.

Configuration Changes Requiring Restart of the Cisco XCP Router

If you make any system configuration changes in the following areas, the Cisco XCP Router restarts:

  • XMPP federation

  • Internal and external Ethernet

  • Hostname or IP address

  • DNS

  • NTP

  • Option keys

  • QoS

  • Clustering

  • Zones

  • MRA

  • Domains

  • Maintenance mode

  • Cisco XCP Router delayed restart

  • Cisco XCP Router / XMPP changes through networking

  • Server-to-server communication to IM and Presence Service

  • Changes to the logging flags for any of the above

Refer to the Impact of Configuration Changes on a Live System section of the Cisco Unified Communications XMPP Federation guide.

See Multitenancy with Cisco Expressway on the Expressway configuration guides page.

Restart XCP Router on IMP

If you think something is wrong in the XCP Router, JSM or SDNS modules, you can restart without rebooting the entire box.
Procedure

Step 1

Access Serviceability > Tools > Control Center - Network Services.

Step 2

Restart the XCP Router service.

The above image illustrates about how to restart the XCP Router service,
Step 3

Ensure that all XCP services are running.


SIP Logging for Multitenant Configurations

When SIP logging is enabled in Maintenance > Diagnostics > Advanced > Support Log configuration, all SIP messages are logged to the appropriate log file. Depending on which loggers you have enabled, some logs go to the network log, while others go to the developer log.

Normal SIP logging includes SIP OPTION messages. SIP OPTION messages are sent on a recurring basis between the Expressway-C and Expressway-E nodes even when there is no network traffic. These messages are also sent across all nodes on the Expressway-E and Expressway-C clusters, creating a full mesh of constant traffic. These messages are used as heartbeats between the nodes, and they carry information from the Expressway-C cluster to the Expressway-E cluster as well.

On single-tenant systems, this mesh is usually small so that its impact is manageable. When debugging issues in the field, the engineer must filter these SIP OPTION messages out so they can troubleshoot the problem. In multitenant customers, the sheer number of these messages generated becomes overwhelming. It is difficult to review logs to troubleshoot issues when there are so many of these SIP OPTION messages filling up the logs.

To solve this problem, enable the developer.sip.transportmsg module, which sends all SIP transport layer logs to developer log file except SIP OPTIONS pings.

The developer.sip.transportmsg logger works as follows:

  • The logger defaults to INFO level.

  • This logger will not log anything at the INFO level. At this level, the logger will not add any additional load to the system.

  • The logger will only log messages at Debug or Trace levels.

  • Since it is a developer logger, it will log all SIP messages to the developer log except the OPTION messages.

  • If an issue arises at a site, the administrator enables this logger from Maintenance > Diagnostics > Advanced > Support Log configuration and turns on SIP message logging without getting all the OPTIONS ping messages.

  • If an administrator turns on this logger and the normal SIP logging, some of these messages may be logged twice.

  • For single-tenant systems, leaving the flag at INFO gives you the identical behavior that is currently in the product.

Manage Cisco Directory Connector

Check Directory Connector for Errors

You receive an email that states the Cisco Directory Connector is not working.

Procedure


Step 1

First, ensure that the machine where the connector was installed has connectivity to the network.

Step 2

Run Directory Connector and sign in to the Dashboard.

Step 3

Verify that there are no errors in the Dashboard.

Step 4

Follow the troubleshooting steps.


Cisco Directory Connector Stopped Working

Problem You received alert emails notifying you that your Cisco Directory Connector is not working.

  • The Cisco Directory Connector may not be installed correctly.

  • The Cisco Directory Connector may not be running.

  • The network may not be available.

Solution Try the following:

  • Open the Control Panel, then Programs and Features. Locate Cisco Directory Connector. If it’s not there, download the latest version from Cisco Webex Control Hub and install it.

  • Open Service and locate Cisco DirSync Service. Make sure that it displays the status as Started. If the service is stopped, right-click and select Start to restart the service.

  • Make sure the server on which you installed the Cisco Directory Connector has the access to Internet.

Troubleshooting and Fixes for Cisco Directory Connector

You may encounter an error message or other issue in Cisco Directory Connector. Also, after Cisco Directory Connector synchronizes user information, the connector may send you an email report that lists any problems with the synchronization. See the sections that follow for problems that may arise, possible causes, and proposed solutions you can try before contacting support.

Troubleshooting Cisco Webex Hybrid Call Services

Cisco Webex Status Page

If calls from Cisco Webex to your enterprise are not ringing on the enterprise side, walk through the points in this checklist to double-check your configuration.

Before you walk through these troubleshooting suggestions, see https://status.webex.com for the latest information on any cloud outages. From that status page, you can also subscribe to notifications.

Restart the Call Connector from the Expressway-C

Disable and reenable the Call Connector, so that the connector captures Unified CM user and device configuration changes that you made while deploying Cisco Webex Hybrid Call Service. During this restart cycle, the connector creates a remote destination with the Cisco Webex SIP address on the Cisco Webex remote device. This address is associated with end user accounts and the corresponding Cisco Webex accounts. Toggle this setting as a troubleshooting step if you experience any issues, too.

When you upgrade your Unified CM an environment with Cisco Webex Hybrid Services and Webex, information that is cached in the Call Connector might be stale. In this case, the affected items are the automatic synchronization of the database cache or reporting the new Unified CM version to the Cisco Webex cloud. Restart the Call Connector to select the latest information in the new database and also publish the new Unified CM version information to the Cisco Webex cloud services.

Before you begin


Caution

Restarting the Call Connector creates extra load on Unified CM publishers. Consider restarting the Call Connector during off-peak hours; during busy hours, a restart may cause service issues.


Procedure


Step 1

From Expressway-C, go to Applications > Hybrid Services > Call Service > Call Service Overview, change the call connector status to Disabled, and then click Save.

Step 2

Change the status back to Enabled, and then save again.

Troubleshooting Tips

Later, you may need to change to Unified CM end users or devices. If you do this to fix a configuration error, even if the call connector's "user validation test" passes for that user, you must restart Call Connector so that it selects the configuration change.


Things to Keep in Mind About Unified CM Cache

Call Connector maintains a cache of Unified CM data, so that AXL requests have limited performance impact on Unified CM nodes during user discovery and activation.

Cached data includes:

  • Users

  • Devices (including user associations)

  • Directory numbers (including line appearances, user association, URIs)

  • Remote Destinations

Call Connector uses change notifications on the publisher nodes to pull new user data. The poll interval is every 2 minutes. Because of limitations with Unified CM change notifications, the cache is rebuilt every night at 11 pm local time or upon Call Connector restart.

Mutual TLS and SIP Destination

Check these troubleshooting points related to the mutual TLS connection and certificates:

  • Install the Cisco Webex cloud root certificate bundle on the Expressway-E.

  • Configure a dedicated mutual TLS port on the Expressway-E.

  • Configure a DNS zone for the cloud on the Expressway-E.

  • Open the mutual TLS port number in your firewall—5062, which may not be open by default.

  • Determine which root certificate option you are using in the Cisco Webex cloud—The option is used to verify your Expressway-E's SIP TLS certificate.

    • Default store—Is your Expressway-E certificate signed by one of the public authorities? If you are unsure, use the custom store option.

    • Custom store—Is your Expressway-E certificate or its signer installed in the cloud? Does the certificate contain verified Expressway-E hostnames?

From the customer view in https://admin.webex.com, go to Services > Hybrid Call > Settings. Check these points that are related to your SIP destination that you set during the deployment process:

  • The value points at your Expressway-E dedicated mutual TLS port.

  • Try to connect to the IP address:port. (Multiple addresses if you configured an SRV.)

  • If you configured an IP address or hostname, specify the mutual TLS port.

  • If you used an SRV, ensure it is in the format _sips._tcp.<domain you put in as SIP Destination>.

  • If you do not want to set up an SRV, you can enter IP address:port or hostname:port as your organization's SIP destination.

Test Calls

  • Try a test call between two Cisco Webex users in the same organization; for this test, we recommend that both callers be enabled for Cisco Webex Hybrid Call Service.

  • If either of the users is configured for Cisco Webex Calling (formerly Spark Call), the call does not route to your environment.

  • Try to route a call from the enterprise side to the cloud first. This test allows you to verify that mutual TLS is set up correctly without having Cisco Webex routing decisions in the equation.

Expressway Pair Configuration

  • For calls that route from Cisco Webex toward the enterprise, check the search history and network logs on the Expressway-E. This step helps you isolate the problem to either the cloud or the enterprise.

  • For calls between hybrid users in Cisco Webex that result in two call notifications on the called party’s app: ensure that SIP Parameter Preservation is enabled on the Expressways. This setting is required to carry a parameter that Cisco Webex adds to the contact header and fixes the double-call issue.

  • If you reuse an existing B2B zone and search rules, consider creating dedicated zones and search rules instead. This setup avoids interference with existing zone settings for B2B/MRA, avoids routing loops, and makes troubleshooting easier.

  • Check the search history and network logs on the Expressway-E. Verify that the SIP INVITE from the cloud arrives at the Expressway-E and matches the DNS zone that you configured for the cloud.

    • If the SIP INVITE does not arrive or match the configured DNS zone, then follow the route of the call toward the Cisco Unified Communications Manager. This step helps you find where the call is failing or lost.

    • See the mutual TLS troubleshooting checklist.

  • Check the route header. Verify that it contains the cluster fully qualified domain name (FQDN) value that is configured under Cisco Unified Communications Manager enterprise settings and in the Expressway search rules. See this example route header and highlighted cluster FQDN:

    • Route: <sip:[Obfuscated];transport=tls;lr>,<sip:myucmcluster.example.com;lr>

      • In this example, the home cluster FQDN is myucmcluster.example.com.

      • The call connector takes that value from the cluster FQDN setting on that same Cisco Unified Communications Manager, caches the value in the cloud, and uses it for every call that must go to that cluster.

  • If a hybrid user calls a phone number from the Cisco Webex app, the cloud sends it to the Expressway in the user=phone format as phonenumber@CFQDN;user=phone. The CFQDN in the route header determines the path that the call takes from Expressway to Cisco Unified Communications Manager. Cisco Unified Communications Manager accepts the user=phone format and CFQDN as the domain.

Troubleshooting Cisco Webex Hybrid Services and Connector

This section describes how to troubleshoot Cisco Webex Hybrid Services.

Diagnostic Tools on Expressway-C Connector Host

Use these diagnostic tools to investigate a problem with Cisco Webex Hybrid Services connectors that are installed on the Expressway-C.

  • Access the Cisco Webex Hybrid Services log levels and enable debug mode if instructed to do so by support. Go to Maintenance > Diagnostics > Hybrid Services Log Levels.

  • Check the event log for errors and warnings. Go to Status > Logs > Event Log.

  • Check for related alarms on Status > Alarms. Alarms that are related to Cisco Webex Hybrid Services are tagged [Hybrid Services] and have IDs in the 60000–69999 range. You can also see these alarms in Cisco Webex Control Hub (https://admin.webex.com).

  • Run diagnostic logging while you recreate the issue, and take a tcpdump during that period. Go to Maintenance > Diagnostics > Diagnostic logging and read the online help for more details.

  • Take a system snapshot to provide to support for diagnosis. Go to Maintenance > Diagnostics > System snapshot.

  • Configure syslog if you have remote logging servers. Go to Maintenance > Logging.

  • Configure incident reporting so that any Expressway failures are automatically reported to us. Go to Maintenance > Diagnostics > Incident reporting > Configuration.

For more details, read the Cisco Expressway Serviceability Guide, or search the help on the Expressway.

Check Connector Health on Expressway-C

When you're having a problem with Cisco Webex Hybrid Services, you can check the status of the connectors and restart any stopped connectors.

Before you begin

If a connector is stopped, you can open a ticket with support and send a log first before you restart the connector.

Procedure


Step 1

On the Expressway-C, go to Applications > Hybrid Services > Connector Management to check the status of your connectors.

The Connector Management section shows all the installed connectors, their version numbers and their status.

Step 2

If a connector is Stopped, click the name of that connector.

You'll see a more detailed status page with a Restart button.

Step 3

Click Restart.


What to do next

If the restart generates an alarm, or if the connector stops again, try the following:

  • Follow the guidance on the alarm. You can also see these alarms in Cisco Webex Control Hub (https://admin.webex.com).

  • From the customer view in https://admin.webex.com, click your username, and then click Feedback to open a ticket and send logs.

  • Use the diagnostic tools to look for problem signatures.

  • Roll back to the previous version of the connector (try this if the problem started after a connector upgrade).

Roll Back to the Previous Version of a Connector

Under normal conditions, your Expressway-C upgrades your connectors automatically after you choose to upgrade in Cisco Webex Control Hub or set a scheduled upgrade time. You can roll back to the previous version of a connector if something goes wrong with an upgraded connector.

Procedure


Step 1

On the Expressway-C, go to Applications > Hybrid Services > Connector Management to check the health status of your connectors.

The Connector Management section shows all the installed connectors, their version numbers, and their status.

Step 2

Click the name of the connector.

A more detailed status page shows the currently installed version and the version that you can roll back to. The page also shows any versions that you previously rejected (by rolling back from them).

Step 3

Click Roll back to reject the currently installed version, and replace it with the Target version.

The page displays the formerly installed version number in the Rejected version field, which means that the will not allow that version to install itself in future.

If you click Back to connector list, you can see the previous version is now running. An alarm is raised because you rejected an upgrade. You can safely ignore that alarm; it appears because of your choice, and it is lowered when a newer version is installed.

When a newer version is available on Cisco Webex, the automatic upgrade resumes.

Step 4

To reverse your decision and accept the Rejected version, click Allow this upgrade.