Real Time Monitoring Tool
For Cisco Unified Intelligence Center, Live Data, and Cisco Identity Service (Cisco IdS), download the Real Time Monitoring Tool (RTMT) from the Cisco Unified Intelligence Center Administration page (Tools > RTMT Plugin Download).
Live Data and the Cisco IdS do not host the RTMT installer. For this reason, always connect to the Cisco Unified Intelligence Center Server and sign in to the Administration page to download the RTMT installer. You can, however, run the same RTMT client to connect to any of the Cisco Unified Intelligence Center, Live Data, or Cisco IdS servers (standalone or coresident).
RTMT runs as a client-side application. You can install RTMT on a Windows workstation or a Linux machine. RTMT is cluster-aware. RTMT provides critical service and performance monitoring (perfmon), trace/log collection and viewing, and Alert Management on the node for the IP address you request at launch. RTMT does not provide the status of all critical applications on all the nodes at the same time.
Use RTMT to:
-
Monitor the health of the system by generating email alerts for objects whose values go above or below a threshold
-
Collect and view traces
-
View syslog messages
-
Monitor performance counters
RTMT has extensive online help. Refer to it for information on alerts, schedule collection, performance monitoring, and collecting and downloading tracing and logging data.
Launch RTMT
Procedure
|
Step 1 |
In the left navigation pane, choose Tools and then click RTMT Plugin Download. |
|
Step 2 |
In the RTMT Plugin dialog box:
|
|
Step 3 |
To launch:
|

RTMT Client Support Services
RTMT uses the following services/servlets:
-
Cisco AMC service
-
Cisco CallManager Serviceability RTMT
-
Cisco RIS Data Collector
-
Cisco Tomcat Stats Servlet
-
Cisco Trace Collection Service
-
Cisco Log Partition Monitoring Tool
-
Cisco SOAP-Real_Time Service APIs
-
Cisco-SOAP-Performance Monitoring APIs
-
Cisco RTMT Reporter Servlet
RTMT Integration
Tracing and Logging
Critical Services

Alerts

Performon and Statistics
The RTMT Interface
The following RTMT system monitoring objects are available in the left pane of the RTMT page:
-
System Summary
Displays information on Virtual Memory usage, CPU usage, Common Partition usage, and the alert history log.
-
Server
Server objects are:
-
CPU and Memory - Displays information on Virtual memory usage and CPU usage for the server.
-
Process - Displays information on the processes running on the server.
-
Disk Usage - Displays information on the disk usage on the server.
-
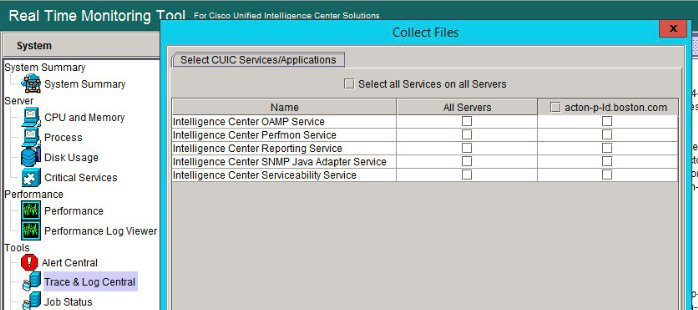
Critical Services - Displays the name of the critical service, the status (whether the service is up, down, activated, stopped by the administrator, starting, stopping, or in an unknown state), and the elapsed time during which the services have existed in a particular state for the server or for a particular server in a cluster (if applicable).
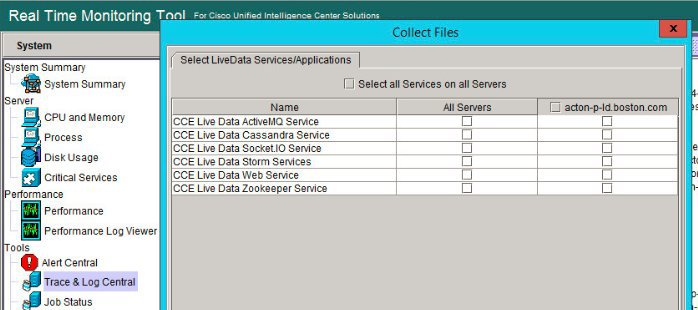
The Cisco Unified Intelligence Center services are listed under the Intelligence Center tab. The Live Data and Cisco IdS services are listed, along with the System services, under the System tab.
-
-
Performance
Performance objects are:
-
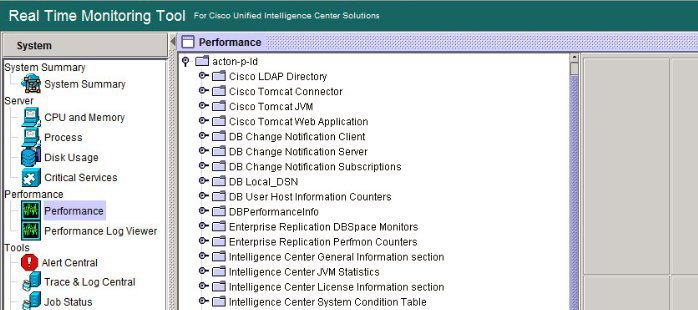
Performance - Performance monitoring allows you to monitor performance counters related to the Unified Intelligence Center server. You can continuously monitor a set of preconfigured objects and receive notification in the form of an email message. You can associate counter threshold settings to alter notification. Up to six perfmon counters in one chart for performance comparisons can be displayed. Performance queries can be used to add a counter to monitor. You can also save and restore settings, such as counters being monitored, threshold settings, and alert notifications, for customized troubleshooting tasks.
-
Performance Log Viewer - Displays data for counters from perfmon CSV log files in a graphical format.
-
-
Tools
Tools objects are:
-
Alert Central - Displays the history and status of every alert in the system. Click the Intelligence Center tab to see Unified Intelligence Center alerts, including those related to Cisco IdS.
-
Trace & Log Central - Allows you to browse or download trace and log files for a specific date range or absolute time.
-
Job Status - Shows the status of trace collection events.
-
Syslog Viewer - Allows you to view (by node) the system, application, and security logs.
-
VLT - Not applicable.
-
AuditLog Viewer - Allows you to view system audit logs.
-
Cisco Unified Intelligence Center Services
-
Intelligence Center Perfmon Service—Performance data collection process, which persists counters relating to Unified Intelligence Center report execution and live data statistics from Unified Intelligence Center, Socket.IO, and CCE Live Data ActiveMQ Service process, which will be helpful in debugging performance issues.
-
Intelligence Center Reporting Service— Core service for the Unified Intelligence Center reporting functionality.
-
Intelligence Center SNMP Java Adapter Service—SNMP service that interfaces between JMX counters and the SNMP Primary Agent.
-
Intelligence Center Serviceability Service— Services that exposes RTMT counters from the Unified Intelligence Center server.
Unified IC performance objects and counters
Unified Intelligence Center performance objects are named for system components that generate data. Each performance object provides performance counters that represent data specific to that object. The Unified Intelligence Center Reporting object has counters for the number of reports that are running and the number of reports that have failed. The counters for each object display when the folder expands.

When the data for the report is available, the Data Processing Center computes the formula fields and global report footers. The gauge, grid, and chart managers in the engine pre-process the data to generate subsets of information that will be consumed by their corresponding peer components on the User Interface. The diagram shows which processes have a high cost of execution and the importance of closely monitoring the operations performed by charts, grids, data processing center, the data sources, and so forth. Monitor these components to track the behavior of each component and its total contribution to the cost of executing a report.
Aggregating the costs of all components provides a holistic view of the system performance. Keeping counters at the component level allows the system and application administrator to drill down into the details to determine what each component is doing and to perform any necessary corrective actions that.
This section lists all the performance objects monitored for Unified Intelligence Center and explains the counters for each.
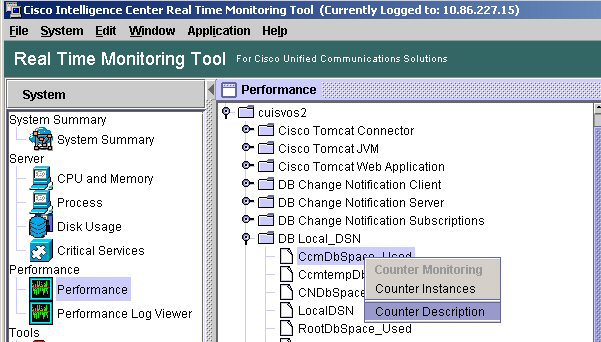
 Note |
Online help is available for each counter. Right-click the counter and select Counter Description. |
For information on the objects and counters that are kept for the operating system, refer to the RTMT online help.
Intelligence Center Perfmon Service
-
Intelligence Center Reporting Service
-
CCE Live Data ActiveMQ Service
Performance counter values are stored to the logs in the directory: /opt/cisco/cuic/logs/perfmon. The Intelligence Center Perfmon Service is configured to retain approximately 10 days of data at any given time. This service is independent of other services and is not required by other processes in the system.
Cisco Unified Intelligence Center Counters
Counters:
CUIC Tomcat Connector
The Tomcat Connector object provides information about Tomcat secure Hypertext Transport Protocol (HTTP) connectors. A Tomcat Connector represents an endpoint that receives requests and sends responses.
The Connector handles HTTP requests and sends HTTP responses that occur when Cisco Unified Intelligence Center web pages are accessed.
|
Counter |
Description |
|---|---|
|
Errors |
The total number of HTTP errors (for example, 401 Unauthorized ) encountered by the Connector. |
|
MBytes Received |
The total number of data received by the Connector. |
|
MBytes Sent |
The total number of data that the Connector has sent. |
|
Requests |
The total number of requests that have been handled by the Connector. |
|
ThreadsBusy |
The Connector's current number of busy/in-use request processing threads. |
|
ThreadsMax |
The Connector's maximum number of request processing threads. |
|
ThreadsTotal |
The Connector's current total number of request processing threads, including available and in-use threads. |
CUIC Tomcat JVM
The Tomcat Java Virtual Machine (JVM) object provides information about the Tomcat JVM, which represents, among other things, a pool of common resource memory used by Unified Intelligence Center.
|
Counter |
Description |
|---|---|
|
KBytesMemoryFree |
The amount of free dynamic memory block (heap memory) in the Tomcat Java Virtual Machine. The dynamic memory block stores all objects created by Tomcat and its web applications such as Unified Intelligence Center. When the amount of free dynamic memory is low, more memory is automatically allocated and total memory size (represented by the KbytesMemoryTotal counter) increases up to the maximum (represented by the KbytesMemoryMax counter). You can determine the amount of memory in use by subtracting KBytesMemoryFree from KbytesMemoryTotal. |
|
MemoryMax |
The maximum dynamic memory block size for the Unified Intelligence Center Tomcat Java Virtual Machine. |
|
MemoryTotal |
This current total dynamic memory block size - including free and in-use memory - for the Tomcat Java Virtual Machine. |
CUIC Tomcat Web Application
The Tomcat Web Application object provides information about running Cisco Unified Intelligence Center. The instance name for each Tomcat Web Application is based on the URL for the web application.
|
Counter |
Description |
|---|---|
|
Errors |
The total number of HTTP errors (for example, 401 Unauthorized) encountered by a Cisco Unified Intelligence Center related web application. |
|
Requests |
The total number of requests handled by the web application. Each time a web application is accessed, its Requests counter increments accordingly. |
|
Sessions Active |
The number of currently active (in use) sessions the web application currently has. |
DB Change Notification Client
|
Counter |
Description |
|---|---|
|
MessagesProcessed |
The number of database change notifications that have been processed. This counter refreshes every 15 seconds by default. |
|
MessagesProcessing |
The number of change notification messages in the change notification queue for this client that are currently being processed or are waiting to be processed. This counter refreshes every 15 seconds by default. |
|
QueueHeadCounter |
The head pointer of the change notification queue. The head pointer is the starting point in the change notification queue. To determine the number of notifications in the queue, subtract the head pointer value from the tail pointer value. This counter refreshes every 15 seconds by default. |
|
QueueMax |
The largest number of change notification messages to be processed for this client. This counter is cumulative since the last restart of the Cisco Database Layer Monitor service. |
|
QueueTailPointer |
The tail pointer of change notification queue. The tail pointer represents the ending point in the change notification queue. To determine the number of notifications in the queue, subtract the head pointer value from the tail pointer value. This counter refreshes every 15 seconds by default. |
|
TablesSubscribed |
The number of tables to which this client has subscribed. |
DB Change Notification Server
|
Counter |
Description |
|---|---|
|
Clients |
The total number of change notification clients. |
|
CNProcessed |
The total number of change notification messages processed by server since reboot. |
|
QueueDelay |
The number of seconds that the change notification process has messages to process, but is not processing them. This condition is true if either Change Notification Requests Queued in Database (QueuedRequestsInDB) and Change Notification Requests Queued in Memory (QueuedRequestsInMemory) are non-zero or if the Latest Change Notification Messages Processed count is not changing. This condition is checked every 15 seconds. |
|
QueuedRequestsInDB |
The number of records from DBCNQueue table. |
|
QueuedRequestsInMemory |
The number of change notification requests queued in memory. |
DB Change Notification Subscriptions
|
Counter |
Description |
|---|---|
|
SubscribedTable |
The table(s) for which the service or servlet will receive change notifications. This information is provided for informational purposes only; no counter will increment. |
DB Local DSN
|
Counter |
Description |
|---|---|
|
CcmDbSpace_Used |
The amount of ccm dbspace consumed. |
|
CcmtempDbSpace_Used |
The amount of ccmtemp dbspace consumed. |
|
CNDbSpace_Used |
The percentage of CN dbspace consumed. |
|
Local DSN |
The data source name (DSN) that is being referenced from the local machine. |
|
RootDBSpaceUsed |
The amount of root dbspace consumed. |
|
SharedMemory_Free |
Total shared memory that is free. |
|
SharedMemory_Used |
Total shared memory that is used. |
DB User Host Information Counters
|
Counter |
Description |
|---|---|
|
DB:User:Host Instances |
The number of connections that are present for each instance of DB:User:Host. |
DBPerformance Info
|
Counter |
Description |
|---|---|
|
CuicDbSpace_Used |
The amount of Unified Intelligence Center dbspace consumed. |
|
CuicSbSpace_Used |
The amount of Unified Intelligence Center Blob Space consumed. |
|
CuicTempDbSpace_Used |
The amount of Unified Intelligence Center Temp dbspace consumed. |
|
RootDbSpace_Used |
The amount of root dbspace consumed. |
Enterprise Replication DBSpace Monitors
|
Counter |
Description |
|---|---|
|
ERDbSpace_Used |
The amount of enterprise replication DbSpace consumed. |
|
ERSBDbSpace_Used |
The amount of ERDbSpace consumed. |
Enterprise Replication Perfmon Counters
|
Counter |
Description |
|---|---|
|
ReplicationQueueDepth |
Displays the replication queue depth. |
Intelligence Center General Information Section
|
Counter |
Description |
|---|---|
|
DeviceType |
The number id of the device type. |
|
Global StatisticInterval |
Size in milliseconds of the global statistics interval. |
|
InetAddress Type |
The type of the ip address of the device, either IPv4 or IPv6. |
|
Time Zone Offset Hours |
The hours component of the offset of the default configured time zone. |
|
Time Zone Offset Minutes |
The minutes component of the offset of the default configured time zone. |
|
Uptime (sec) |
Null. |
Intelligence Center JVM Statistics
|
Counter |
Description |
|---|---|
|
EnvMaxThreadsUsed |
The real-time maximum threads used object is a real-time snapshot metric indicating the peak amount of threads used simultaneously in the runtime environment since startup. The maximum number of threads used by the runtime environment includes all Unified Intelligence Center standalone and thread pool threads as well as threads created by the web application server running within the same runtime environment. |
|
EnvRtCommitMemUsed |
The real-time current memory used object is a real-time snapshot metric indicating the memory committed by the runtime environment. This memory is guaranteed to be available to the runtime environment. This can change dynamically over time but is never less than EnvRtCurrMemUsed. The object value is expressed as a count of megabytes. |
|
EnvRtCurrMemAvail |
The real-time current memory available object is a real-time snapshot metric indicating the amount of system memory not being used. The object value is expressed as a count of Mega bytes and indicates the amount of current system memory that is not currently being used. |
|
EnvRtCurrMemUsed |
The real-time current memory used object is a real-time snapshot metric indicating the current memory usage by the runtime environment. The object value is expressed as a count of Mega bytes and indicates the current amount of memory used by this runtime environment. |
|
EnvRtCurrThreadsInUse |
The real-time current threads in use object is a real-time snapshot metric indicating a count of threads that are in use in the runtime environment. The number of threads in use by the runtime environment include all of the Unified Intelligence Center standalone and thread pool threads as well as those threads created by the web application server running within the same runtime environment. |
|
EnvRtMaxMemAvail |
The real-time maximum memory available object is a real-time snapshot metric indicating the maximum amount of System memory available. The object value is expresses as a count of megabytes. |
|
EnvRtMaxMemUsed |
The real-time maximum memory used object is a real-time snapshot metric indicating the peak memory allocated to the runtime environment. The object value is expressed as a count of megabytes and indicates the high water mark of memory that can be used by the runtime environment. |
|
EnvRtUpTime |
The real-time up time object is a real-time snapshot metric indicating how long the Unified Intelligence Center application has been running. The object value is expressed as a count of milliseconds that have elapsed since the application began executing. |
Intelligence Center System Condition Table
|
Counter |
Description |
|---|---|
|
CUIC_DATASOURCE _UNAVAILABLE |
This counter is no longer valid with the counter value -1. It has been rendered obsolete by the Await Write Time counter. |
|
CUIC_DB_REPLICATION _FAILED |
Database replication failed. |
|
CUIC_REPORT_ EXECUTION_FAILED |
Could not run the report. Could be because associated data source is offline. |
|
CUIC_SERVICE_UNAVAILABLE |
Service going down. |
|
Infrastructure_DEADLOCK_DETECTED |
A deadlock between two or more application threads has been detected. This is an unrecoverable error and the server must be restarted. Detailed information about the deadlock can be found in the logs. |
|
Infrastructure_ LOG_PURGER_ERROR |
An error occurred while log files were being purged. |
|
Infrastructure_ PERSISTENT_STORE_SIZE_ALMOST_FULL |
The message store that persists reporting data during a connection loss is approaching capacity. If it fills completely, reporting data will be lost. |
|
Infrastructure_ PERSISTENT_STORE_SIZE_FULL |
The message store that persists reporting data during a connection loss is at capacity. Reporting data will be lost until the connection with the reporting server is restored. |
|
Infrastructure_ PERSISTENT_STORE_SIZE_WARN |
The message store that persists reporting data during a connection loss is more than half full. If it fills completely, reporting data will be lost. |
|
Infrastructure_ PORT_SECURITY_MANAGER_ERROR_LOADING |
Error manipulating PortSecurityManager firewall rules. |
|
Infrastructure_ SC_JMX_CONFIGURATION_ERROR |
There is a configuration problem with JMX ports. |
|
Infrastructure_ SERVER_NOT_READY |
The Server state is not ready. |
|
Infrastructure_ SNMP_CONNECTION_ERROR |
The connection to SNMP Subagent Failed. |
|
Infrastructure_ SOFTWARE_CONFIGURATION_ERROR |
There is an error in the files configuring the software on the disk. |
|
Infrastructure_ SUBSYSTEM_HEARTBEAT_FAILED |
Heartbeats from one or more subsystems have stopped. |
|
Infrastructure_ SUBSYSTEM_START_FAILURE |
One or more subsystems failed to start. |
|
Infrastructure_ SUBSYSTEM_STOP_FAILURE |
One or more subsystems failed to stop. |
|
Infrastructure_SYSTEM_SHUT_DOWN |
One or more subsystems shut down. |
|
RS_CONFIG_ UNAVAILABLE |
System detected critical error accessing configuration. |
|
RS_DATABASE_ UNAVAILABLE |
System detected critical error with database. |
|
RS_MAINTENANCE_ IN_PROGRESS |
System has detected maintenance in progress on Reporting Server. |
|
RS_SYSTEM_ THRESHOLD_REACHED |
System has detected a critical system threshold reached on Reporting Server. |
|
RS_UNRECOVERABLE _ERROR |
System has detected an internal error within Reporting Server which may prevent it from functioning correctly. Restart may be required. |
Intelligence Center Tomcat Connector - HTTPS
The Unified Intelligence Tomcat Connector object provides information about a secure Hypertext Transport Protocol (HTTPS) Tomcat connector. A Tomcat Connector represents an endpoint that receives requests and sends responses.
The Connector handles HTTPS requests and sends HTTPS responses that occur when Cisco Unified Intelligence Center web pages are accessed. There is an instance of this object based on the Secure Sockets Layer (SSL) status of the URLs for web applications: http-8444 for SSL (HTTPS) connections.
|
Counter |
Description |
|---|---|
|
Errors |
The total number of errors (for example, 401 Unauthorized ) encountered by the Connector. |
|
MBytes Received |
The total number of data received by the Connector. |
|
MBytes Sent |
The total number of data that the Connector has sent. |
|
Requests |
The total number of requests that have been handled by the Connector. |
|
ThreadsBusy |
The Connector's current number of busy/in-use request processing threads. |
|
ThreadsMax |
The Connector's maximum number of request processing threads. |
|
ThreadsTotal |
The Connector's current total number of request processing threads, including available and in-use threads. |
IP
The IP object provides information on the IPv4-related statistics on your system.
|
Counter |
Description |
|---|---|
|
Frag Creates |
The number of IP datagrams fragments that have been generated at this entity. |
|
Frag Fails |
The number of IP datagrams that were discarded at this entity because the datagrams could not be fragmented, such as datagrams where the Do not Fragment flag was set. |
|
Frag OKs |
The number of IP datagrams that were successfully fragmented at this entity. |
|
In Delivers |
The number of input datagrams that were delivered to IP user protocols. This includes Internet Control Message Protocol (ICMP). |
|
In Discards |
The number of input IP datagrams where no problems were encountered, but which were discarded. Lack of buffer space provides one possible reason. This counter does not include any datagrams that were discarded while awaiting reassembly. |
|
In HdrErrors |
The number of input datagrams that were discarded with header errors. This includes bad checksums, version number mismatch, other format errors, time-to-live exceeded, and other errors that were discovered in processing their IP options. |
|
In Receives |
The number of input datagrams that were received from all network interfaces. This counter includes datagrams that were received with errors. |
|
In UnknownProtos |
The number of locally addressed datagrams that were received successfully but discarded because of an unknown or unsupported protocol. |
|
InOut Requests |
The number of incoming IP datagrams that were received and the number of outgoing IP datagrams that were sent. |
|
Out Discards |
The number of output IP datagrams that were not transmitted and were discarded. Lack of buffer space provides one possible reason. |
|
Out Requests |
The total number of IP datagrams that local IP user-protocols (including ICMP) supply to IP in requests transmission. This counter does not include any datagrams that were counted in ForwDatagrams. |
|
Reasm Fails |
The number of IP reassembly failures that the IP reassembly algorithm detected, including time outs, errors, and so on. This counter does not represent the discarded IP fragments because some algorithms, such as the algorithm in RFC 815, can lose track of the number of fragments because it combines them as they are received. |
|
Reasm OKs |
The number of IP datagrams that were successfully reassembled. |
|
Reasm Reqds |
The number of IP fragments that were received that required reassembly at this entity. |
IP6
The IP6 object, which supports Cisco Unified Communications Manager, provides information on the IPv6-related statistics on your system.
|
Counter |
Description |
|---|---|
|
Frag Creates |
The number of IP datagrams fragments that have been generated at this entity. |
|
Frag Fails |
The number of IP datagrams that were discarded at this entity because the datagrams could not be fragmented, such as datagrams where the Do not Fragment flag was set. |
|
Frag OKs |
The number of IP datagrams that were successfully fragmented at this entity. |
|
In Delivers |
The number of input datagrams that were delivered to IP user protocols. This includes Internet Control Message Protocol (ICMP). |
|
In Discards |
The number of input IP datagrams where no problems were encountered, but which were discarded. Lack of buffer space provides one possible reason. This counter does not include any datagrams that were discarded while awaiting reassembly. |
|
In HdrErrors |
The number of input datagrams that were discarded with header errors. This includes bad checksums, version number mismatch, other format errors, time-to-live exceeded, and other errors that were discovered in processing their IP options. |
|
In Receives |
The number of input datagrams that were received from all network interfaces. This counter includes datagrams that were received with errors. |
|
In UnknownProtos |
The number of locally addressed datagrams that were received successfully but discarded because of an unknown or unsupported protocol. |
|
InOut Requests |
The number of incoming IP datagrams that were received and the number of outgoing IP datagrams that were sent. |
|
Out Discards |
The number of output IP datagrams that were not transmitted and were discarded. Lack of buffer space provides one possible reason. |
|
Out Requests |
The total number of IP datagrams that local IP user-protocols (including ICMP) supply to IP in requests transmission. This counter does not include any datagrams that were counted in ForwDatagrams. |
|
Reasm Fails |
The number of IP reassembly failures that the IP reassembly algorithm detected, including time outs, errors, and so on. This counter does not represent the discarded IP fragments because some algorithms, such as the algorithm in RFC 815, can lose track of the number of fragments because it combines them as they are received. |
|
Reasm OKs |
The number of IP datagrams that were successfully reassembled. |
|
Reasm Reqds |
The number of IP fragments that were received that required reassembly at this entity. |
Memory
The memory object provides information about the usage of physical memory and swap memory on the server.
|
Counter |
Description |
|---|---|
|
% Mem Used |
Displays the system physical memory utilization as a percentage. The value of this counter equals (Total KBytes - Free KBytes - Buffers KBytes - Cached KBytes + Shared KBytes) / Total KBytes, which also corresponds to the Used KBytes/Total KBytes. |
|
% Page Usage |
The percentage of active pages. |
|
% VM Used |
The system virtual memory utilization as a percentage. The value of this counter equals (Total KBytes - Free KBytes - Buffers KBytes - Cached KBytes + Shared KBytes + Used Swap KBytes) / (Total KBytes + Total Swap KBytes), which also corresponds to Used VM KBytes/Total VM KBytes. |
|
Buffers KBytes |
The capacity of buffers in your system in kilobytes. |
|
Cached KBytes |
The amount of cached memory in kilobytes. |
|
Free KBytes |
The total amount of memory that is available in your system in kilobytes. |
|
Free Swap KBytes |
The amount of free swap space that is available in your system in kilobytes. |
|
HighFree |
The amount of free memory in the high region. Linux kernel splits the virtual memory address space into memory regions. The high memory is memory above a certain physical address, and its amount depends on the total memory and the type of kernel on the system. |
|
HighTotal |
The total amount of memory in the high region. |
|
LowFree |
The free low (non-paged) memory for kernel. |
|
LowTotal |
The total low (non-paged) memory for kernel. |
|
PageFaultsPerSec |
This represents the number of page faults (major + minor) made by the system per second (post 2.5 kernels only). This is not a count of page faults that generate I/O, because some page faults can be resolved without I/O. |
|
PageMajorFaultsPerSec |
This represents the number of major faults the system has made per second, those which have required loading a memory page from disk (post 2.5 kernels only). |
|
Pages |
The number of pages that the system paged in from the disk plus the number of pages that the system paged out to the disk. |
|
Pages Input |
The total number of pages that the system paged in from the disk. |
|
Pages Input Per Sec |
The total number of kilobytes the system paged in from disk per second. |
|
Pages Output |
The total number of pages that the system paged out to the disk. |
|
Pages Output Per Sec |
This represents the total number of kilobytes the system paged out to disk per second. |
|
Shared KBytes |
The amount of shared memory in your system in kilobytes. |
|
SlabCache |
This represents all memory used by created slabcaches by various kernel components, as a macroscopic counter representing the sum of all the individual entries in the proc's slab info. |
|
SwapCached |
This represents the amount of Swap used as cache memory. Memory that once was swapped out, is swapped back in, but is still in the swapfile. |
|
Total KBytes |
The total amount of memory in your system in kilobytes. |
|
Total Swap KBytes |
The total amount of swap space in your system in kilobytes. |
|
Total VM KBytes |
The total amount of system physical and memory and swap space (Total Kbytes + Total Swap Kbytes) that is in use in your system in kilobytes. |
|
Used KBytes |
The amount of system physical memory that is in use on the system in kilobytes. The value of the Used KBytes counter equals Total KBytes - Free KBytes - Buffers KBytes - Cached KBytes + Shared KBytes. The Used KBytes value differs from the Linux term that displays in the top or free command output. The Used value that displays in the top or free command output equals the difference in Total KBytes - Free KBytes and also includes the sum of Buffers KBytes and Cached KBytes. |
|
Used Swap KBytes |
The amount of swap space that is in use on your system in kilobytes. |
|
Used VM KBytes |
The system physical memory and the amount of swap space that is in use on your system in kilobytes. The value equals Total KBytes - Free KBytes - Buffers KBytes - Cached KBytes + Shared KBytes + Used Swap KBytes. This corresponds to Used Mem KBytes + Used Swap KBytes. |
Network Interface
The Network Interface object provides information about the network interfaces on the system.
|
Counter |
Description |
|---|---|
|
RxBytes |
The number of bytes, including framing characters, that was received on the interface. |
|
Rx Dropped |
This represents the number of inbound packets that was chosen to be discarded even though no errors had been detected. Discarding packets prevents the packet from being delivered to a higher layer protocol, for example, to free up buffer space. |
|
Rx Errors |
This represents the number of inbound packets (for packet-oriented interfaces) and the number of inbound transmission units (for character-oriented or fixed-length interfaces) that contained errors that prevented them from being deliverable to a higher layer protocol. |
|
Rx Multicast |
This represents the number of multicast packets that was received on this interface. |
|
Rx Packets |
This represents the number of packets that this sublayer delivered to a higher sublayer. This does not include the packets that were addressed to a multicast or broadcast address at this sublayer. |
|
Total Bytes |
This represents the total number of received (Rx) bytes and transmitted (Tx) bytes. |
|
Total Packets |
This represents the total number of received (Rx) packets and transmitted (Tx) packets. |
|
Tx Bytes |
This represents the total number of octets, including framing characters, that was transmitted out of the interface. |
|
Tx Dropped |
This represents the number of outbound packets that was chosen to be discarded even though no errors were detected. Discarding a packet prevents the packet from being delivered to a higher layer protocol, for example, to free up buffer space. |
|
Tx Errors |
This represents the number of outbound packets (for packet-oriented interfaces) and the number of outbound transmission units (for character-oriented or fixed-length interfaces) that could not be transmitted because of errors. |
|
Tx Packets |
This represents the total number of packets that the higher level protocols requested for transmission, including those that were discarded or not sent. This does not include packets that were addressed to a multicast or broadcast address at this sublayer. |
|
Tx QueueLen |
This represents the length, measured in packets, of the output packet queue. |
Number of Replicates Created and State of Replication
The Number of Replicates Created and State of Replication object provides real-time replication information for the system.
|
Counter |
Description |
|---|---|
|
Number or Replicates Created |
Displays the number of replicates that were created by Informix for the DB tables. This counter displays information during Replication Setup. |
|
Replicate_State |
This counter represents the state of replication. The following list provides possible values:
|
Partition
The Partition object provides information about the file system, its usage in the system, and the disk utilization on a per-partition basis on the system.
|
Counter |
Description |
|---|---|
|
% CPU Time |
The percentage of CPU time that is dedicated to handling IO requests that were issued to the disk. |
|
% Used |
The percentage of disk space that is in use on this file system. |
|
% Wait in Read |
Not used. It has been rendered obsolete by the Await Read Time counter. |
|
% Wait in Write |
Not used. It has been rendered obsolete by the Await Write Time counter. |
|
Await Read Time |
The average time, measured in milliseconds, for read requests issued to the device to be served. |
|
Await Time |
The average time, measured in milliseconds, for I/O requests that were issued to the device to be served. This includes the time that the requests spent in queue and the time that was spent servicing them. |
|
Await Write Time |
The average time, measured in milliseconds, for write requests that are issued to the device to be served. |
|
Queue Length |
The average queue length for the requests that were issued to the disk. |
|
Read Bytes Per Sec |
The amount of data in bytes per second that was read from the disk. |
|
Total Mbytes |
The amount of total disk space in megabytes that is on this file system. |
|
Used Mbytes |
The amount of disk space in megabytes that is in use on this file system. |
|
Write Bytes Per Sec |
The amount of data that was written to the disk in bytes per second. |
PermalinkInfo
|
Counter |
Description |
|---|---|
| DashboardPermalinksViewed | Total number of dashboard permalink views. |
| DashboardPermalinksViewedInterval | Total number of dashboard permalinks viewed over the last interval. |
| ExcelPermalinksViewed | Total number of excel permalink views. |
| ExcelPermalinksViewedInterval | Total number of excel permalinks viewed over the last interval. |
| HTMLPermalinksViewed | Total number of HTML permalink views. |
| HTMLPermalinksViewedInterval | Total number of HTML permalinks viewed over the last interval. |
| TotalPermalinksViewed | The sum of report and dashboard permalinks viewed. |
| TotalPermalinksViewedInterval | The sum of report and dashboard permalinks viewed over the last interval. |
| XMLPermalinksViewed | Total number of XML permalink viewed. |
| XMLPermalinksViewedInterval | Total number of XML permalinks viewed over the last interval. |
Process
|
Counter |
Description |
|---|---|
|
% CPU Time |
Expressed as a percentage of total CPU time, represents the task's share of the elapsed CPU time since the last update. |
|
% Memory Usage |
The percentage of physical memory that a task is currently using. |
|
Data Stack Size |
The stack size for task memory status. |
|
Nice |
The nice value of the task. A negative nice value indicates that the process has a higher priority. A positive nice value indicates that the process has a lower priority. If the nice value equals zero, do not adjust the priority when you are determining the dispatchability of a task. |
|
Page Fault Count |
The number of major page faults that a task encountered that required the data to be loaded into memory. |
|
PID |
The task's unique process ID, which periodically wraps, though never restarting at zero. |
|
Process Status |
The task's process status: 0 - Running, 1 - Sleeping, 2 - Uninterruptible disk sleep, 3 - Zombie, 4 - Traced or stopped (on a signal), 5 - Paging, 6 - Unknown. |
|
Shared Memory Size |
The amount of shared memory, in KB, that a task is using. Other processes could potentially share the same memory. |
|
STime |
The amount of system time (STime), measured in jiffies, for which this process has been scheduled in kernel mode. A jiffy corresponds to a unit of CPU time and gets used as a base of measurement. One second is equal to 100 jiffies. |
|
Thread Count |
The number of threads that are currently grouped with the task. A negative value -1 indicates that this counter is currently not available because thread statistics (including all performance counters in the Thread object as well as the Thread Count counter in the Process object) have been turned off because the system's total processes and threads have exceeded the default threshold value. |
|
Total CPU Time Used |
The total CPU time, measured in jiffies, that the task has consumed in user mode and kernel mode since the start of the task. One second is equal to 100 jiffies. |
|
UTime |
The amount of time, measured in jiffies, that the task has been scheduled for in user mode. One second is equal to 100 jiffies. |
|
VmDate |
The virtual memory usage of the heap for the task in kilobytes (KB). |
|
VmRSS |
The virtual memory (Vm) resident set size (RSS) that is currently in physical memory in kilobytes (KB), including Code, Data, and Stack. |
|
VmSize |
The total amount of virtual memory, in KB, that the task is using. It includes all code, data, shared libraries, and pages that have been swapped out: Virtual I |
Processor
|
Counter |
Description |
|---|---|
|
% CPU Time |
The processor's share of the elapsed CPU time excluding the idle time since last update, expressed as a percentage of CPU time. |
|
Idle Percentage |
The percentage of time that the CPU or CPUs were idle and the system did not have an outstanding disk I/O request. |
|
IOwait Percentage |
The percentage of time that the CPU or CPUs were idle, during which the system had an outstanding disk I/O request. |
|
Irq Percentage |
The percentage of time that the processor is executing the interrupt request which is assigned to devices for interrupt, or sending a signal to the computer when it is finished processing. |
|
Nice Percentage |
The percentage of CPU utilization that occurred while running at the user level with nice priority. |
|
Softirq Percentage |
The percentage of time that the processor is executing the softirq, which means that task switching is deferred until later to achieve better performance. |
|
System Percentage |
The percentage of CPU utilization that occurred while running at the system level (kernel). |
|
User Percentage |
The percentage of CPU utilization that occurred while running at the user level (application). |
Ramfs
|
Counter |
Description |
|---|---|
|
FilesTotal |
The total number of files in the ram-based filesystem (ramfs). |
|
SpaceFree |
The amount of free data blocks in the ram-based filesystem (ramfs). A block is a uniformly sized unit of data storage for a filesystem. The block size specifies the size that the filesystem will use to read and write data. |
|
SpaceUsed |
The amount of used data blocks in the ram-based filesystem (ramfs). A block is a uniformly sized unit of data storage for a filesystem. The block size specifies the size that the filesystem will use to read and write data. |
Reporting Engine Info
|
Counter |
Description |
|---|---|
|
Report (H/RT) Completed |
Total number of reports that have been successfully run. |
|
Report (H/RT) CompletedInterval |
Change of counter Report (H/RT) Completed over the last interval. |
|
Report (H/RT) ExecutionQueryTime |
Time taken to run the database query against (H/RT) report (milliSeconds) |
|
Report (H/RT) ExecutionQueryTimeInterval |
Change of counter Report (H/RT) ExecutionQueryTime over the last interval. |
|
Report (H/RT) Failed |
The total number of reports that have failed. The total number of times that Unified Intelligence Center has tried to fetch data from a Data Source but it has not been able to. |
|
Report (H/RT) FailedInterval |
The interval measurement of the Report (H/RT) Failed counter. |
|
Report (H/RT) Running |
The number of (H/RT) reports that are currently running. A report is currently running when the Runnable object has been assigned a thread from the pool. It does not include those that are waiting in a queue for a thread to become available. |
|
Report (H/RT) Running Interval |
The interval measurement of the Report (H/RT) Running counter. |
|
Report (H/RT) Runtime |
Total amount of seconds spent running reports. |
|
Report (H/RT) RuntimeInterval |
Change of counter Report (H/RT) Runtime over the last interval. |
|
Report (H/RT) Waiting |
Total number of reports that are currently queued for run. |
|
ReportsUsersLoggedin |
Total number of users that are currently logged in. |
RESTInfo
|
Counter |
Description |
|---|---|
| ConfigurationCalls | Total number of configuration REST calls made to Unified Intelligence Center. |
| ConfigurationCallsInterval | Total number of configuration REST calls made to Unified Intelligence Center over the last interval. |
| ReportCalls | Total number of Report REST calls made to Unified Intelligence Center. |
| ReportCallsInterval | Total number of Report REST calls made to Unified Intelligence Center over the last interval. |
| ReportDefinitionCalls | Total number of Report Definition REST calls made to Unified Intelligence Center. |
| ReportDefinitionCallsInterval | Total number of Report Definition REST calls made to Unified Intelligence Center over the last interval. |
| TotalRESTCalls | Total number of REST calls made to Unified Intelligence Center. |
| TotalRESTCallsInterval | Total number of REST calls made to Unified Intelligence Center over the last interval. |
SchedulerInfo
|
Counter |
Description |
|---|---|
|
SchedulerJobsFailedCount |
The number of jobs that the scheduler service has failed to complete successfully. |
|
SchedulerJobsRunningCount |
The number of jobs that the scheduler service is currently running. |
|
EmailExcelCount |
The number of jobs which send provided report execution results as Excel in email. |
|
EmailHTMLCount |
The number of jobs which send provided report execution results as HTML in email. |
|
EmailPDFCount |
The number of jobs which send provided report execution results as PDF in email. |
|
SFTPCount |
The number of jobs which saves report execution results to the given remote location. |
System
The System object provides information for file descriptors (FD), total processes and threads, total CPU time measured on the system.
|
Counter |
Description |
|---|---|
|
Allocated FDs |
Represents the total number of allocated file descriptors. |
|
Being Used FDs |
Represents the number of file descriptors that is currently in use in the system. |
|
Freed Fds |
Represents the total number of allocated file descriptors on the system that is freed. |
|
IOAwait |
The average time, in milliseconds, for I/O requests issued to all devices to be served. This includes the time spent by the requests in queue and the time spent servicing the requests. |
|
IOCpuUtil |
The percentage of CPU time during which I/O requests were issued to the device (bandwidth utilization for the device) on this server. |
|
IODeviceReqQueueSize |
The average queue length of the requests that were issued to all devices on this server. |
|
IODeviceReqSectorSize |
The average size in sectors of the requests that were issued to all devices on this server. |
|
IOKBytesReadPerSecond |
The total number of KBytes read per second from all devices on this server. |
|
IOKBytesWrittenPerSecond |
The total number of KBytes written per second to all devices on this server. |
|
IOPerSecond |
The total number of input/output operations on all disk partitions per second on this server. If you experience a system performance issue, use the information in this counter to measure the impact of the aggregate I/O operations on this server. |
|
IOReadReqPerSecond |
The total number of read requests per second that were issued to all devices on this server. |
|
IOReadQueueMergedPerSecond |
The total number of read requests merged per second that were queued to all devices on this server. |
|
IOSectorsReadPerSecond |
The total number of sectors read per second from all devices on this server. |
|
IOSectorsWrittenPerSecond |
The total number of sectors written per second to all devices on this server. |
|
IOServiceTime |
The average service time, in milliseconds, for I/O requests that were issued to all devices on this server. |
|
IOWriteReqPerSecond |
The total number of write requests per second that were issued to all devices on this server. |
|
IOWriteReqQueueMergedPerSecond |
The total number of write requests merged per second that were queued to all devices on this server. |
|
Max Fds |
Represents the maximum number of file descriptors that is allowed on the system. |
|
Total CPU Time |
Represents the total time, measured in jiffies, that the system has been up and running. A jiffy corresponds to a unit of CPU time and gets used as a base of measurement. One second is equal to 100 jiffies. |
|
Total Processes |
Represents the total number of processes on the system. |
|
Total Threads |
Represents the total number of threads on the system. |
TCP
|
Counter |
Description |
|---|---|
|
Active Opens |
The number of times that TCP connections have made a direct transition to the SYN-SENT state from the CLOSED state. |
|
Attempt Fails |
The number of times that TCP connections have made a direct transition to the CLOSED stated from either the SYN-RCVD state or the SYN-RCVD state, plus the number of times TCP connections have made a direct transition to the LISTEN state from the SYS-RCVD state. |
|
Curr Estab |
The number of TCP connections for which the current state is either ESTABLISHED or CLOSE-WAIT. |
|
Estab Resets |
The number of times that the TCP connections have made a direct transition to the CLOSED state from either the ESTABLISHED state or the CLOSE-WAIT state. |
|
In Segs |
The total number of segments received, including those received in error. This count includes segments received on currently established connections. |
|
InOut Segs |
The total number of segments that were sent and the total number of segments that were received. |
|
Out Segs |
The total number of segments sent, including those on current connections but excluding those containing only retransmitted octets. |
|
Passive Opens |
The number of times that TCP connections have made a direct transition to the SYN-RCVD state from the LISTEN state. |
|
RetransSegs |
The total number of segments retransmitted, that is, the number of TCP segments transmitted containing one or more previously transmitted octets. |
Thread
|
Counter |
Description |
|---|---|
|
% CPU Time |
The thread's share of the elapsed CPU time since the last update, expressed as a percentage of total CPU time. |
|
PID |
The thread's leader process ID. |

 Feedback