Cisco Unified Intelligence Center Reporting Application

Cisco Unified Intelligence Center Installation and Setup

Who can install and set up Unified Intelligence Center: any user in your organization.

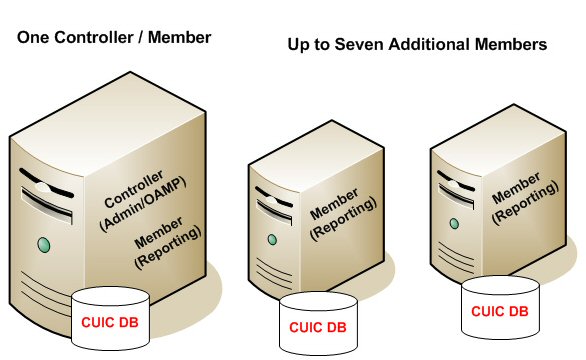
Unified Intelligence Center is installed by DVD media on a Cisco Unified Voice Operating System (VOS) platform. VOS is an appliance or closed box model and does not support navigation into, or manipulation of, the file system.

Unified Intelligence Center can be installed as a standalone server or as a cluster of a maximum of eight server nodes. Unified Intelligence Center consists of one mandatory publisher node (called the Controller) and a maximum of seven subscriber nodes (called Members). The Controller node includes a Member; thus a deployment can consist of a Controller alone.
Figure 1. Unified IC Cluster


Unified Intelligence Center has two web interfaces:

  • The Administration application

    The administration application is the Operation Administration Maintenance and Provisioning (OAMP) interface that provides application-level configuration for Unified Intelligence Center. This interface is offered on the Controller node only and is used by Unified Intelligence Center Super Users.

  • The Unified Intelligence Center Reporting application

    The Unified Intelligence Center reporting application is the interface for reporting users who can have various user roles pertinent to reporting.

You can find the installation instructions in the Installation and Upgrade Guide for Cisco Unified Intelligence Center located at https://www.cisco.com/c/en/us/support/customer-collaboration/unified-intelligence-center/products-installation-guides-list.html.

Access Administration Console

The System Application User who is defined during the installation is by default the initial Super User who can sign in to the Administration Application.

Note


When you log in to the Admin Console site and you do not have any scheduled backup configured and enabled, Unified Intelligence Center returns the message "No active backup schedule is available. Set up a new schedule now." Unified Intelligence Center displays this message only for the administrator.
To access the Administration console:

Procedure


Step 1

Direct your browser to the URL https://<HOST ADDRESS>/oamp where HOST ADDRESS is the IP Address or Hostname of your server.

Step 2

Sign in using your Super User (system application user) ID and password. A successful sign-in launches the OAMP application.


Sign In to Cisco Unified Intelligence Center Reporting Interface

Who can sign in to the Unified Intelligence Center reporting interface:

  • Initially, the System Application User who is the default Superuser.

  • Eventually, any Unified CVP user who was created in the Administration Console as an IMS superuser or an LDAP user.

The URL for logging in to the Unified Intelligence Center reporting application is:

https://<HOST>:8444/cuicui/Main.jsp

Where HOST is the DNS name of a Unified Intelligence Center node.


Note


Unified Intelligence Center does not support HTTP.


Perform the following procedure to sign in to the Unified Intelligence Center reporting interface.

What to do next

If you have CVP Reporting as an on-box VM or an external server, refer to sections in the Configure Unified Intelligence Center section for information on creating the data source for Unified CVP and importing CVP report templates.

Create Reporting Users

Who can create a user:

  • Initially, the System Application User who is the default Superuser.

  • Eventually, any Superuser.

Unified CVP reporting users can sign in to Unified Intelligence Center only if they exist in the Administration console as Superusers or if Active Directory (AD) is configured in the Unified Intelligence Center Administration console for their domain:

  • Superusers who are added are considered to be IP Multimedia Subsystem (IMS) users.

  • Users who are authenticated through Active Directory are considered to be Lightweight Directory Access Protocol (LDAP) users.

Both IMS users and LDAP users can log in to Unified Intelligence Center reporting and are restricted to the limited Login User role until the Unified Intelligence Center reporting security administrator gives them additional roles and flags them as active users.

Create Superusers

Procedure


Step 1

Log in to the Cisco Unified Intelligence Center Administration Console (https://<HOST ADDRESS>/oamp).

Step 2

Navigate to User Management.

Step 3

Click New to add and configure a new user or click the ellipsis icon against an existing username to edit the configuration for that user.

This page has two tabs: General and Credentials. You can configure Policy information from the User Management page. For information about completing these tabs, see Administration Console User Guide for Cisco Unified Intelligence Center at https://www.cisco.com/c/en/us/support/customer-collaboration/unified-contact-center-enterprise/products-maintenance-guides-list.html or the Administration console online help.

Step 4

Click Save.


Create Reporting Users through OAMP

Procedure


Step 1

Log in to the Cisco Unified Intelligence Center Administration Console (https://<HOST ADDRESS>/oamp).

Step 2

Navigate to Device Management > Unified CVP Reporting Server.

Step 3

Select the Reporting Server for which a reporting user is to be created.

Step 4

Navigate to Database Administration > Manage Reporting Users.

Step 5

Click Add User to add and configure a new user or click an existing username to edit the configuration for that user.

Step 6

Click Add to add a new user.

All reporting users are created with Read Only privilege. Elevated privileges can be added with SQL DBA commands.


Configure Active Directory Settings

Fields on the Active Directory tab configure the Active Directory server to authenticate reporting users as they log in to the Unified Intelligence Center Web application.

Configure Active Directory for the Unified ICM/CC supervisors so that they can sign in as Unified Intelligence Center Reporting users.


Note


Cisco Unified Intelligence Center uses LDAP V2 which does not support all Unicode characters that are used in the first name or surname of LDAP users.


Active Directory is not used to authenticate Administration Super Users. These Super Users can only be authenticated through the local database. The first Super User is added during installation. All other Super Users are added through the User Management interface, and their credentials are encrypted into the local database.

To navigate to this page, choose Cluster Configuration > Active Directory Settings.

Table 1. Fields on This Tab

Field

Description

Host Address and Port for Primary Active Directory Server

Provide the hostname or IP address and the port of the Primary Active Directory server.

The port defaults to 389.

Host Name and Port for Secondary Active Directory Server

Provide the hostname or IP address and the port of the Secondary Active Directory server.

The port defaults to 389.

Use SSL

Check these boxes if you want the connection from the Unified device to the Active Directory connection to be encrypted with SSL while doing authentication.

Manager Distinguished Name

Enter the Manager Distinguished Name used to sign in to the Active Directory server.

For example, on a default installation of Microsoft AD: CN=Administrator, CN=users, DC=MYSERVER, DC=COM. Replace MYSERVER and COM with your respective hostname.

Note


If users other than the LDAP administrator are configured as Manager Distinguished Name in the OAMP LDAP configurations, they should have the following rights:

  1. User search permissions on the domain.

  2. Read access to the user objects and their attributes.

  3. Read access to the base DN

  4. Permission to bind to LDAP.

Manager Password

Enter the Active Directory manager password.

User Search Base

Specify the user search base. For example, on a default installation of Microsoft AD, CN=users, DC=MYSERVER, DC=COM, replace MYSERVER and COM with your respective hostname.

Note

 
This example assumes that you placed the users in the USERS subtree of AD. If you created a new organizational unit within your subtree, then the syntax would be: OU=MYUSERS, DC=MYSERVER, DC=COM, instead of "CN=MYUSERS".

Attribute for User ID

Whenever a user signs in, Unified Intelligence Center searches for that user in the LDAP (Lightweight Directory Access Protocol) using the sign-in attribute specified in the LDAP configuration. After the user is found, the full DNS of the user is extracted and used for authenticating the user.

The sign-in attribute specified in the LDAP configuration is the property against which LDAP search is issued to find the matching username. If you do not know which attribute to use, use sAMAccountName, which is the default Microsoft username attribute.

Different organizations settle on different LDAP attributes to identify the username across the organization, depending on the tools used to administer LDAP within their organizations. This attribute allows you to customize the sign-in depending on the attribute used. Even a custom attribute can be specified using this dialog.

sAMAccountName indicates the user attribute to search the user for is the userPrincipalName. sAMAccountName contains just the short username. For example, jDoe for the user John Doe.

userPrincipalName indicates the user attribute to search the user for is the userPrincipalName. This attribute contains the username in the email format, user@compay.com. This entire string becomes the username and not just user. Therefore when this attribute is selected, the user has to type the full email format in as the username in the sign-in box.

Custom User Attribute allows you to specify the attribute used for searching the user in LDAP.

Note


Custom User attributes are not validated and are used as is. Ensure that the correct case and attribute name are used.

Contact your Active Directory Administrator for the correct attribute to use.

User Name Identifiers

Users are stored in Unified Intelligence Center in the format <UserName Identifier>\<username>

The username Identifiers are used to identify the different kinds of users within Unified Intelligence Center. For example, local, LDAP, user-synced user, users from different LDAP domains, nETBIOSName, and so on.

Before you can use it, the username identifier has to be declared for use on this page. When LDAP is configured, at least one identifier must be configured and set as default to enable the system to identify LDAP users.

UserSychronization brings in users in format <syncdomain>\username and collections have users in the same format. Therefore, these users must sign in to Unified Intelligence Center using the <syncdomain>\user syntax. To enable, add <syncdomain> or @<syncdomain> (if you are using userPrincipalName) to the list of valid identifiers.

The maximum allowed length of a username identifier is 128 characters.

Example:

When nETBIOSName and userPrincipalName are same or different:

For sAMAccountName:

Configure in Username Identifiers: <UserNameIdentifier>

Login in cuic : UserNameIdentifier\user

For userPrincipalName:

Configure in Username Identifiers: @<UserNameIdentifier>

Login in cuic : userPrincipalName

This list box is pre-populated with the username Identifiers based on the list of usernames stored in the Unified Intelligence Center database. The most frequently occurring identifier in the list of username is auto-selected as the default.

Note

 
You cannot save LDAP configuration unless you choose a default Identifier from the User Name Identifiers list box and clicking the Set Default button.

Default User Name Identifier

Default identifiers allow users to sign-in without typing the full domain identifier (<domain>\user) or the userPrincipalName suffixes to usernames (user <@company.com>) on the sign-in page.

It can be set by choosing one of the Identifiers from the list box and by clicking the Set Default button.

Users who use any other identifier can still sign-in by typing their full identifier in the sign-in box. For example, domain2\user or netbiosname\user, provided those identifiers are already configured.

Test Connection

Click to test the connection to the primary and secondary LDAP servers and display the connection status.

  • Save saves the configuration information you entered for the Active Directory. Clicking Save does not validate the configuration.

Cisco Unified Customer Voice Protocol Reporting User Role Additions

Who can add Unified CVP user roles:
  • Initially, the system application user who has full permissions in Unified Intelligence Center reporting

  • Eventually, any security administrator.

  • Initially, the system application user (see System Application User) who has full permissions in Unified Intelligence Center reporting

  • Eventually, any security administrator (see User Roles).

Once Unified CVP users log in to Unified Intelligence Center, they are added to the Unified Intelligence Center database and appear on the users list.

New users are initially defined as Login Users: the lowest level user role of Unified Intelligence Center. A Unified Intelligence Center Security Admin user must access the Users page to check if User is Active and to grant additional user roles to the user.

Create Data Source

You can create or edit a data source only if you are assigned with a System Configuration Administrator role.

To create a data source, perform the following steps:

Procedure


Step 1

In the left navigation pane, choose Configure > Data Sources.

Step 2

In the Data Sources window, click New.

Step 3

In the Create Data Source dialog box, enter the datasource Name, Description, and select the Data Source Type.

Step 4

Click Next.

Step 5

In the data source details page, enter the following (Primary Node tab):

Field

Description

Host Settings

Datasource Host

The hostname or IP address of the target data source.

Port

The port number that allows Unified Intelligence Center to communicate with the database.

Typically, the port is 1526.

Note


The port number is a mandatory field only for the Informix database.

Database Name

Enter the name of the database.

The database name can be cvp_data or callback.

Instance

Enter the instance of the database.

By default, this is cvp.

Note


The name of the database instance is a required field only for Informix databases.

Time zone

Select the time zone that the database is located in.

Set CVP datasource timezone configuration to UTC on CUIC.

Authentication Settings

Database User ID

The user ID required to access the database.

(The cvp_dbuser account is created automatically during Unified CVP Reporting server installation.)

Password

The password for the user ID required to access the database.

Charset

The character set that is used by the database.

Choose UTF-8.

Max Pool Size

The maximum pool size.

Note


Value ranges from 5 to 200. The default Max Pool Size value is 100 and is common for both the primary and secondary data source tabs.

Step 6

Click Test Connection to ensure that the database is accessible and the credentials provided are correct.

Step 7

Click the Secondary Node tab to configure a failover for the data source.

Step 8

Check the Enable Failover check box to configure a failover for the data source.

Step 9

Enter the required details for the failover data source. (Refer step 5)

Step 10

Click Save.


Obtain Cisco Unified Customer Voice Portal Report Templates

Who can obtain import Unified CVP report templates: any user in your organization.

To import Unified CVP report templates complete the following:

Procedure


Step 1

On the Unified CVP Reporting Server, click Start.

Step 2

In the search box, type %CVP_HOME%\CVP_Reporting_Templates and press Enter.

Step 3

Compress the reports into a zip folder and copy it to the system from which you will run Unified Intelligence Center Administration.

Step 4

Choose the files and copy them to the client computer from which you will launch the Unified IC Reporting web application.


Import Reports

You can import the Unified Intelligence Center report, which is in either .xml or .zip file format.

To import reports, perform the following steps:

Procedure


Step 1

In the left navigation pane, choose Reports.

Step 2

In the Reports listing page, click Import.

Step 3

Click Browse to select the file (.xml or .zip format) to be imported.

Note


Maximum file size for .zip file format is 60 MB and for .xml file format is 3 MB.

Step 4

Select the required file and click Open.

Step 5

Select the file location from the Save to Folder list to save the file.

Step 6

Click Upload.

Once the file is successfully uploaded, the table gets populated with the corresponding report template, current available version, and incoming version of the files being imported.

Step 7

Select a Data Source for the Report Definition only if the Report Definition for the report being imported is not defined in Unified Intelligence Center.

Step 8

Select a Data Source for the Value List that is defined in the Report Definition.

Note


Selection of a Data Source for the Value List is mandatory:

  • If the Value List does not use the same Data Source as the Report Definition.

  • For Real Time Streaming Report Definitions.

Step 9

Select the files to import or overwrite.

  • Overwrite—If the report being imported exists in the Unified Intelligence Center.

  • Import—If the report being imported is the new set of report files.

Step 10

Click Import.

Note

 
  • If the system does not have report definitions, new report definitions are created in Report Definitions > Imported Report Definitions folder.

  • Importing a report to a different version of Unified Intelligence Center is not supported. However, when you upgrade Unified Intelligence Center, report templates continue to work in the upgraded version.

  • Importing manually edited XMLs is not supported.

  • Templates will not be imported if there is no connection to the correct database in CVP Reporting Server.


Imported Cisco Unified Customer Voice Protocol Report Templates

Unified Intelligence Center has stock report templates and custom report templates.

Stock report templates are the UCCE templates that are installed with Unified Intelligence Center. These templates are populated from the Unified ICM/CC database. They are protected from modification and must be cloned using "Save As".

Custom report templates are templates that are imported. Unified CVP templates, therefore, fall in the custom template category.

Unified Intelligence Center does not protect custom templates from modification.

Retain the imported Unified CVP templates and create Save As versions of the Unified CVP reports and Unified CVP report definitions.

Export Reports and Folders

You can export any custom or stock report or report folders from the Unified Intelligence Center. Reports and report folders are exported in a ZIP file format.

When you export a folder, the reports in the folder are grouped as ZIP files. The grouping is based on the data source that is used by the report definition and the value lists.


Note


  • For customized reports, you must update the version numbers of the value list and report definition before you export the report. Else, the export will not overwrite the existing reports.

  • While exporting folders, ensure that all the Value Lists in the report definitions or folders point to the same data source respectively.


Caution


Do not modify the exported report (XML file) for customization purposes. However, if necessary, you can modify only the EntityVersion of the Report, Report Definition, and ValueList.


When you export a report, the following data that is associated with the report are exported:

  • Report

  • Report Definition

  • Value Lists

  • Views

  • Thresholds

  • Drilldowns

  • Template Help (if not bundled, an empty folder is created in the zip file)


Note


Report Filters and Collections are not exported along with the report.


To export a report or a folder, perform the following steps:

Procedure


Step 1

From the left navigation panel, click Reports.

Step 2

Navigate to the report or the report folder that you want to export and click the ellipsis icon beside the report and click Export.

Note


If necessary, you can rename the report or the report folder. Do not change the file extension (Reports or report folder: zip).

Step 3

Click OK.

The exported file is downloaded into your specified local folder.

Basic Cisco Unified Intelligence Center Reporting Concepts

The following table provides information about basic Unified Intelligence Center reporting concepts.

Table 2. Basic Unified Intelligence Center Reporting Concepts

Term

Explanation

Dashboards

Dashboard is an interface that allows you to add reports, web pages (URLs), web widgets, and notes in a consolidated view. All actions on the Dashboards interface are based on your role and on the user permissions for Dashboards and for Folders.

Data Sources

A data source is a connection to a database from which reports are populated. Each data source has a configuration page with the IP address, username, password, and database type for a database used by Unified Intelligence Center.

Reports

Reports contain data sets that are extracted by database queries and that can be displayed in various views--as grids, as charts, and as gauges.

All reports are based on Report Definitions.

Report Definitions

A Report Definition defines the interface for a report. Each Report Definition contains the dataset that is obtained for a report including the SQL query, the fields, the filters, the formulas, the refresh rate, and the key criteria field for the report.

Unified Intelligence Center separates Reports from Report Definitions.

Report Templates

Report Templates are well-formed XML files based on Report Definitions.

Report Views

A report view is a layout presentation for the data that is retrieved for the report. Unified Intelligence Center supports two types of views:

  • Grid Views

  • Chart Views

All reports have a grid view. The Unified CVP Call Traffic reports also have a chart view.

You can create many views for a report, can define the default view for a report, and can change a report view once the report is generated.

You cannot delete all views. Every report must have at least one view.

Value Lists

Value lists contain all reportable items of the same type, for example, all agents or all skill groups.

Collections

Collections are subsets of value lists that can be used to control the amount of data that users can select to populate a report.

Thresholds

You can set a threshold for a field in a report grid to configure that field to display in a distinctive format.

User Groups

User Groups are constructs that allow security administrators to partition Unified Intelligence Center functionality.

Creating User Groups expedites the provisioning process when multiple users need the same access to dashboards and reports, or when users require distinct permissions and features based on regional or organizational requirements.

User Permissions

Users have permissions associated with the groups in which they are members, and each member of a group has specific permissions in that group.

There are two levels of permissions: VIEW and EDIT.

User Roles

User Roles confer the actions and capabilities that a user has in Unified Intelligence Center. There are seven User Roles, and each user can have multiple roles.

Generate and Manage Reports

Overview

Reports show data returned by Report Definitions (database query). The database queries extract this data and can be displayed in various Report Views—as grids and charts.

Users with the Report Designer user role can click the Reports from the navigation page to open the Reports page.


Note


All actions on the Reports interface are based on user role and on the user's object permissions for reports and for folders.


For more information about creating or editing a report, see Create Reports.

Stock Reports

Cisco provides stock report templates to use with Unified Intelligence Center. You can download Stock reports from Cisco.com. Stock report templates display data that has been saved in the Unified CCE database.

After installing Unified Intelligence Center, you can import stock templates using the Import feature and customize the stock reports to suit your business requirements. You can clone the imported stock templates using the Save As option and customize.

Stock reports have one default grid view. Few stock reports also have a chart view.


Note


Localization of stock report templates is not supported.


The available stock report templates are:

  • Audit Trail—view the sequence of audit records of the transactions related to create, update, modify, and delete that are performed on the entities of a Unified Intelligence Center server.

    By default, only System Administrators can access and view this report. System Administrator can give permissions to other Unified Intelligence Center users to use this report.

  • Group Access Detail—view access rights of groups that use Unified Intelligence Center resources such as Dashboards, Reports, and other resources.

  • Resource Ownership and Access—view access rights of users and about ownership status of users who use Unified Intelligence Center resources such as Dashboards, Reports, and other entities.

  • User's Audit Log—view the audit log data of users such as, Logged In User Detail (name and role), Event Detail, Updated Column, User Detail, and other modified details.

For more information, click the "?" icon (Template Help) from the report in the run mode.

Report Actions

The following table lists various actions that you can perform from the Reports.


Note


You can open a maximum of ten tabs at a time.


Table 3. Report Actions
Action Description

Report-level actions

New

Report

Creates a new report in the selected folder.

Note


You cannot create reports inside the Stock folder. You can only import reports into the Stock folder. To edit or customize reports, clone the report and edit the cloned version.

Folder

Creates a new Folder. Use this feature to categorize reports.

Note


When you move or save the folders to a different location, the drop-down lists all the folders including the disabled folders. You can navigate to subfolders with Edit permissions.

Note


You cannot create folders inside the Stock folder.

Toolbar actions

Refresh

Refreshes the Reports page.

Applies to all folder levels (root, sub folder, and report).

Favorites

To easily access your reports, you can tag Reports as your Favorites.

Click the star icon beside the Report name to add to Favorites.

Search

Searches for a particular the Report.

Import

Imports a report.

To import a report, you need the Report Designer, Report Definition Designer, and Value List Collection Designer roles and the Edit permission on the target folder where you want to import these reports.

For more information, see Import Reports.

Note


Applies to all folder levels (root, subcategory, and report).

Ellipsis(…) actions

Edit

Edits the Report details. In the edit mode, you can add, modify, and delete report details, views and thresholds, and filters.

After editing the Report, click Finish.

Note


You cannot edit a Stock report.

Save As

Saves a copy of the report with a different name.

Note

 
  • By default, the reporting users do not have permission to create a subfolder in the Reports root folder. To get permissions, contact your administrator.

  • You cannot perform the Save As action to move contents (reports or folders) into the Stock folder and its subfolders.

Note

 
The report description does not support the following special characters:
  • Parentheses (( ))

  • Angle brackets (<,>)

  • Forward slash (/)

  • Question mark (?)

  • Quotes (")

  • Any scripts; JavaScript

Clone Report Definition

If you want to create a copy of the Report Definition that is associated with the report being saved:

  1. Click the Clone Report Definition check box.

  2. Enter the new Report Definition Name and select the Report Definition Location.

  3. Click Save.

    The new report gets associated to the cloned Report Definition.

Rename

Renames a folder or a report.

Note


You cannot rename a Stock folder or a Stock report.

Note


Applies to the root-level folder.

Move

Moves Report or Folder from one folder to another.

Note

 
  • You can move a Report or a Folder only if you have Edit permission on the parent folder of the Report or Folder being moved.

  • You cannot move custom folders or reports from within the Stock folder (and its subfolders) to other locations and the other way.

Set Default Filters

Creates report filters.

For more information, see Report Filters.

Note


You can also set the default filter by checking the Set as Default check box in the Choose Filter dialog box during the report run mode.

Add Help

Hosts the help page for Report Templates. For more information, see Add Template Help.

Delete

Deletes a report or a folder.

Note

 
  • You can delete a Report or a Folder only if you have Edit permission on the parent folder of the Report or Folder being deleted.

  • You cannot delete a Stock folder or a Stock report.

Permissions

Assigns appropriate permissions to access and manage the Report.

Groups—Grants View and Edit permissions for the Report.

  • Security Administrators can grant these permissions to various groups.

  • Entity owners can grant these permissions to groups that they are directly associated with.

Users—Grants View and Edit permissions for the Report to various users. Applicable only to Security Administrators.

Note

 
  • Higher permissions (View and Edit) from either an individual user or the user group takes precedence.

  • Only the first 200 records (alphabetical order) are displayed in the Members or Groups panel. To view more records, see Configure > Groups.

  • When you modify a permission and want to switch between Groups and Users tabs, you will be prompted to either save or discard the changes.

Permalinks

Displays the Report permalink.

Note


You can access permanent hyperlink only from a web browser.

Export

Export any custom report or report folders. Reports and report folders are exported in a ZIP file format. To export a report or a report folder, you need the REPORT DESIGNER role. For more information, see Export Reports and Folders.

Add Template Help

You can configure individual help files to each Cisco Unified Intelligence Center report. You can either host the help page separately and point the report to it or create and upload the help page along with the report.

This help content is specific to the report and can contain explanation on:

  • How to use the report

  • Field description

  • Details of the relationship between the fields

  • How to interpret the report data or

  • Any other report related information

You can upload only files in ZIP formats. ZIP files can contain multiple HTML files. The HTML page contents support rich text including images.


Note


Help files does not support videos and other interactive content.


To configure the help page for a report, perform the following steps:

Procedure


Step 1

From the left navigation pane, click Reports.

Step 2

Click the Ellipsis icon (…) next to the report row for which you want to create the help page and click Add Help.

Step 3

In the Add Help dialog box,

  • If you want to set an external help page as the report help, select the URL option and enter the external URL location.

  • If you want to upload the help file, select the Choose file option and click Browse to upload a ZIP file (with HTML files).

Step 4

After uploading the file, click Save.

Note

 
When you run the report, click the "?" icon (Template Help) on the Reports toolbar to view the configured help file.

Report Filters

Filter Types

Report filters in Unified Intelligence Center are used to present selective data. You can define the filter to filter the data that you want to display in the report. There are two ways to view the Filter page.

  • Before the report is generated: You can set and refine the default filter values using the Actions > Set Default Filter option.

  • After the report is generated: You can refine the filter values using the filter icon.


    Note


    You cannot view filters if the Report Designer has selected the Skip filter during the report processing check box during the report filter selection.


Cisco Unified Intelligence Center supports the following types of report filters:

  • Date & Time

  • Key Criteria

  • Field Filters

  • Parameters

Filter parameters are displayed based on the selected query type in the Report Definition for that report.

Table 4. Filter tabs

Report Definition Query Type

Applicable Filter Tabs

Database Query

Date & Time, Key Criteria, Field Filters

Live Data or Real Time Streaming

Key Criteria, Field Filters

Anonymous Block

Parameters

Stored Procedure

Parameters

Date & Time


Note


  • Cisco Unified Intelligence Center uses the browser locale to display the Date & Time format in the filter page. If Cisco Unified Intelligence Center does not support the browser locale language, then the locale selected in the Cisco Unified Intelligence Center application is used.


To configure Date and Time filters for a report, perform the following steps:

Procedure

Step 1

After creating the report, click Set Default Filter from the ellipsis Actions.

Step 2

In the Date & Time filter wizard, select the Date Range and Time Range options.

Step 3

Check the Skip filter during the report execution check box if you want to skip filter selection during the running of report.

Note


In the Choose Filter dialog box (report run mode), you can check the Set as Default check box to set the report filter as the default.

Step 4

Click Next.


Key Criteria

Use the Key Criteria tab in the filter to select value lists or collections. A collection is a pre-configured group of values.


Note


Key Criteria fields are predefined filters and are displayed in the filter screen if they are defined in the Report Definition.

To configure Key Criteria filters, perform the following steps:

Procedure

Step 1

After creating the report, click Set Default Filter from the ellipsis Actions.

Step 2

In the Date & Time filter wizard, select the Date Range and Time Range options and click Next.

Step 3

In the Key Criteria filter wizard, select the collections or values from the Available selection box.

Note


Do not set multiple filter parameters; set any one filter parameter.

Step 4

Use the arrows to move the selected collections or values to the Selected selection box.

Step 5

You can also select multiple collections or values.

Step 6

Click Next.


Field Filters

Use the Field Filters tab to filter any field in the report. Based on the selected field type (date, numeric/decimal, boolean, or string), different operators are available. For example, you can filter calls in queue for greater than two minutes or on all agents in the hold state to filter out the less important information.


Note


You can configure Field Filters in reports:
  • Only for SQL Query based reports.

  • To filter a text, date, boolean, or a decimal field.


To configure Field Filters, perform the following steps:

Procedure

Step 1

After creating the report, click Set Default Filter from the ellipsis Actions.

Step 2

In the Date & Time filter wizard, select the Date Range and Time Range options and click Next.

Step 3

In the Key Criteria filter wizard, select the collections or values from the Available selection box and click Next.

Step 4

In the Field Filters wizard, select the filter according to the following criteria.

Filter criteria/operators depend on the selected field type (date, numeric/decimal, boolean, or string).

  • For Date, the options available in Date Range filter are predefined. Using the Date Range drop-down list, select from Custom, Today, Yesterday, This Week, Last Week, This Month, Last Month, Year to Date, or Last Year.

    Only Custom will allow the user to customize the Calendar, Time Range and Days certain days of the week.

  • For Decimal, select an Operator from Equal To, Not Equal To, Less Than, Less Than or Equal To, or Greater Than and then enter a value; for example, Operator = Greater Than and Value = 16.5.

  • For String, select an Operator from Equal To, Not Equal To, or Matches and then enter a value for the string; for example, Operator = Matches and Value = Team Green.

    • If you select Matches as the Operator, you must specify an SQL pattern to match the string field. The system appends the wild card character % automatically to the beginning and end of the string. You can also use any SQL wild card pattern in between the string.

    • If the filter field is associated with a Value List, then specify any value or move one, all, or some items in the list to the Selected column to filter.

    Note


    Use only the Matches operator to filter the report data records with leading or trailing spaces. Do not use the Equal To or Not Equal To operators in such scenarios as Unified Intelligence Center trims the filter criteria before running the SQL query and hence does not fetch the matching results.

  • For Boolean, select True or False from the Operator list.

Step 5

Using the Operator drop-down list, select the criteria.

Note


If you select Matches operator, you can use any Microsoft SQL wildcard pattern to filter the data. The wildcard character % is added to the beginning and end of every string that is used to filter the data.

Step 6

In the Value field, enter a value against which the data in the field will be filtered.

Step 7

Click Run.


Report Types

There are three types of reports based on the query types:

  • Historical report

  • Real-time report

  • Live Data report

Report Components

These reports consist of the following components:

  • Data Source

    The Data Source defines the sources that contain the data for the report. Unified Intelligence Center supports three types of data sources: Microsoft SQL Server, IBM Informix, and Streaming. The data source should be pre-configured for you. If it is not, contact your administrator to configure the appropriate data source.

  • Report Definitions

    Each report has a Report Definition, which represents how data is retrieved from the data source for that report template. In addition to specifying how data is retrieved (by a simple MS SQL query, stored procedure query, real time streaming or an anonymous block query), a report definition contains the dataset that is obtained. This includes the fields, filters, formulas, refresh rate, and key criteria field for the report.

  • Reports

    Reports show data returned by Report Definitions. This data is extracted by database queries.

  • Time Zone Conversions

    The time zone conversion happens if there is a difference between the user and the data source time zones.

    Daylight savings time consideration for Database Query Reports: The Daylight savings time offset at the start of the date range is considered for the time zone conversion when the report is filtered. If the daylight savings change occurs somewhere in between the filter date and time ranges, the time zone offsets will not be computed properly if the user and the data source are in different time zones. In this case, you will have to split the time filter such that separate report invocations are run before and after the daylight savings time change.


    Note


    The daylight savings time offset depends on the latest system time zone library.


    Note


    Daylight savings start date or end date may (when the data is recorded) create an additional row (in the report output) due to the time zone value change in the SQL database. This applies to any template report, as well as for any query type (Anonymous block, Database Query, Stored Procedure, Real Time Streaming) that these template reports would use. For confirmation that SQL had time zone value change, use the Report Options icon from the report summary page and run the SQL command in AW node to validate the change in the time zone.


    Example 1:

    User time zone: Australia/Sydney

    Data source time zone: America/New_York

    Daylight savings time changes: +1 hour for Sydney at 2013-10-06 02:00 a.m. DST +1 hour is already on for New York

    Filter selected by the user: 2013-10-06 to 2013-10-06, 12:00 a.m. to 11:59 p.m.

    Query formed in data source time zone: 2013-10-05 10:00:00 a.m. to 2013-10-06 09:59:59 a.m.

    Report displayed in user time zone: 2013-10-06 12:00 a.m. to 2013-10-07 12:59 a.m.

    In this case, the report will display an extra hour of data as Sydney Daylight savings time is off at the start of the date range and on at the end of the date range.

    Example 2:

    User time zone: Australia/Sydney

    Data source time zone: America/New_York

    Daylight savings time changes: +1 hour on for Sydney at 2013-10-06 02:00 a.m. DST +1 hour is already on for New York

    Filters selected : 2013-10-06 to 2013-10-10, 03:00 a.m. to 11:59 p.m.

    Query formed in data source timezone: 2013-10-05 12:00:00 p.m to 2013-10-06 08:59:59 a.m.

    Report displayed in user time zone: 2013-10-06 03:00 a.m. to 2013-10-06 11:59 p.m.

    In this case, the conversion happens as expected as there is no Daylight savings time change in between the date ranges.

    Example 3:

    User time zone: America/New_York

    Data source time zone: IST

    Daylight savings time changes: +1 hour DST at 2013-03-03 02:00 a.m. and off at 2013-11-03 02:00 a.m. for New York. No Daylight savings time changes for IST.

    Filter selected by the user : 2013-11-03 to 2013-11-03, 01:30 a.m. to 05:30 p.m.

    Query formed in data source time zone: 2013-11-03 11:00:00 a.m. to 2013-11-03 02:59:59 a.m.

    Report displayed in user time zone: 2013-11-03 01:30 a.m. to 2013-11-03 04:30 p.m.

    In this case, the report will display one hour less of data as New York Daylight savings time is on at the start of the date range and off at the end of the date range.

  • Report Views

    A report can be presented in multiple formats (grid and charts). Each view can have its own set of fields. A single report can have multiple views.

  • Report Help

    You can attach a help page specifically for your report. For more information, see Add Template Help.

Historical and Real Time Reports

Historical report—Retrieves data from the historical data source. Reports are populated with interval data that has a default refresh rate of 15 minutes. Historical reports have an upper limit of 8000 rows.

Real-time report—Retrieves data from the real-time data source. Reports are populated with interval data that has a default refresh rate of 15 seconds. Real-time reports have an upper limit of 3000 rows.

While running Cisco Unified Intelligence Center Historical and Real-Time Reports you can:

  • Filter data in a report

  • Change the view of a report from a grid to a gauge or a chart


    Note


    You can select one of the predefined grid, gauge, or chart views.

    For more information on creating/editing views, see Report Views.


  • Modify reports

Live Data Reports

Live Data report—Receives data from streaming data source. Live Data reports supports only grid view.


Note


Live Data reports do not automatically respond to changes in the system time. If the server or client time is changed or adjusted, the report must be refreshed to accurately display the duration field values. For example, during a daylight saving time (DST) change, active live data reports do not display correct values in the duration field. Live data reports must be refreshed to update.


Manage Reports

Create Reports

All actions on the Reports interface are based on user role and on the user's object permissions for reports and for categories.


Note


By default, reporting users do not have permission to create a subfolder in Reports. An Administrator can create a subfolder and grant access.


To create a new report, perform the following steps:

Procedure

Step 1

In the left navigation pane, choose Reports.

Step 2

Navigate to the folder where you want to create the report.

Step 3

From the Reports toolbar, click New > Report.

To edit an existing report, navigate to the report, click the ellipsis icon beside the report and click Edit.

Step 4

In the Create New Report window, enter the Report Name and Description.

Note


The report name must be unique to Cisco Unified Intelligence Center.

Step 5

Click Next.

Step 6

In the Basic Details tab, enter or select the report details.

Note


Use the arrows to select the appropriate Report Definition.

Step 7

Click Next.

Step 8

In the Manage Views tab, create the report views and click Next.

For more information, see Report Views.

Step 9

In the Thresholds tab, create report thresholds and click Finish.

For more information, see Report Thresholds.

The newly created report is listed in the Reports page.

Report Views

There are two types of report views:

  • Grid View

  • Chart View


Note


Do not delete the Report Definition fields that are currently associated with any of the manually created report views. If deleted, you must reapply the Data Fields for all the manually created report views to save the report.

For default grid views, the deleted field is removed automatically from the Data Fields list retaining any other fields in the Selected Field list. Hence, no additional action is required to save the report.


Create a Grid View

Grids are tabular presentations of the data in rows and columns. By default, all Cisco stock reports have a grid view. For custom reports, a default grid is created from the SQL query in the Report Definition.


Note


Grouping and font size is not supported in Live Data reports.

You can create a Grid View while creating or editing a report.

To create a Grid View, perform the following steps:

Procedure

Step 1

Create or edit a report.

Step 2

Enter the report details in the Basic Details screen and click Next.

The Manage Views screen appears with a default grid view.

Note


You can access Report permalinks only after completing the report creation. Report permalinks allow you to share your report with other users and view reports of other users.

Step 3

You can edit the default view (Actions column > Edit View) or click Create New > Grid view to create a new grid view.

The Edit Grid View or the New Grid View screen appears depending on your selection for edit or create.

Step 4

Enter the Name and Description in the respective fields.

Note


Maximum length allowed for the grid view Name: 50 characters.

Step 5

From the Font selection box, you can select the font size from the list to display the grid data.

Step 6

Use the arrow buttons to select fields from the Available value list box to move to the Selected field list.

Step 7

You can use the following features to improve grid view display:

  • Header—Use this feature to add (+) or delete (-) a header for the selected fields. This helps in categorizing the field set.

    Note


    You cannot save the view with empty headers.

    Post upgrade to Cisco Unified Intelligence Center 12.0 or later, any empty headers that exist in the report views in prior releases are not migrated.

  • Edit icon—In the Selected value list box, click the Edit icon (hover on the field value) if you want to edit the Display Name and Column Width for the selected field and click Done.

    Note


    For Header fields, you can only edit the Display Name.

  • Sort Grid by Field—Select the Sort Grid by Field check box to sort the selected report columns in either Ascending or Descending order. Selecting this check box enables the drop-down list to be populated with the values from the Selected value list box. You can select only one value for sorting.

Step 8

Click Save.

The Report Views screen appears.

Step 9

Click Finish.


Create a Chart View

Cisco Unified Intelligence Center supports the following chart types:

  • Bar—Bar charts display discontinuous events and show the differences between events rather than trends. Bar charts are oriented vertically and can be stacked horizontally or clustered one below the other.

  • Pie/Donut—Pie charts display quantities as proportions of a whole. The circle (pie) represents 100% of the data, with each quantity represented as a wedge of the appropriate size. Pie charts take decimal or numeric fields only. A pie chart cannot have more than 50 wedges. An error occurs if your data set and chart editor selections generate a pie chart with more than 50 wedges.

    A doughnut chart is another display representation of a pie chart.

  • Column—Column charts display discontinuous events and show the differences between events rather than trends. Column charts are oriented horizontally and can be stacked vertically or clustered side by side.

  • Dial Gauge/Numeric—A gauge chart displays the dial representation of the report results as per the defined threshold.

    The Numeric chart displays the report results in a number format highlighted as per the defined threshold.

  • Line charts—Line charts display continuous quantities over time against a common scale. Use the Line charts to show trends.


Note


  • Live Data reports do not support chart view.

  • In the vertically oriented charts, for Cyrillic characters, the data labels in the Horizontal Axis field may be hidden or garbled. This is a known limitation. Hence, for Cyrillic characters, use the horizontally oriented charts.


To create a Chart View, perform the following steps:

Procedure

Step 1

Create or edit a report.

Step 2

Enter the report details in the Basic Details screen and click Next.

The Manage Views screen appears with a default grid view.

Note


You can access Report permalinks only after completing the report creation. Report permalinks allow you to share your report with other users and view reports of other users. For more information, see Permalink for a Report.

Step 3

Click Create New > Chart view.

Step 4

In the Create New Chart View screen, click the required chart type. For more information, see Chart Types.

Step 5

Enter the Chart Information; Name, Description and click Next.

Note


Maximum length allowed for the chart view Name: 50 characters.

For Cartesian type charts (Bar, Column, and Line), select the Group Data check box to group data:

  • By a field—Select this option to create a chart view where the vertical axis shows fields with footer formula configured for line or column chart and horizontal axis with footer formula for bar chart.

  • By label field—Select this option to create a chart view where the vertical axis shows fields of decimal data type for Line or Column chart. In Bar chart, the horizontal axis shows fields of decimal type.

Note


For Pie charts, you can only Group Data by Label Field.

Step 6

In the Add Data Fields screen, select the Label Field from the drop-down list and Data Fields from the list box and click Next.

Step 7

In the Preview and Format screen, enter or select appropriate information based on the selected chart type.

For more information, see Chart Types.

Note

 
For the following Data Fields, the Column Type (Stacked and Grouped) feature is unavailable.
  • Date and Time

  • Boolean

Step 8

Click Save.


Chart Types

Chart Type

Chart Information

Add Data Fields

Preview and Format

Bar

Yes

Yes

Yes

Column

Yes

Yes

Yes

Line

Yes

Yes

Yes

Gauge/Numeric

No

Yes

Note

 
To configure a Gauge chart, Report Definition must have at least one decimal field with footer configured.

Yes

You can select Dial Gauge or Numeric view for this report.

To set the chart view for Dial Gauge/Numeric, perform the following steps:

  1. Enter the Range (min and max). Default: 0-100

  2. Define the zones.

    When the chart value is within any of the defined thresholds,

    • The gauge pointer points to the corresponding color set in the threshold.

    • The Numeric text is displayed in the corresponding color set in the threshold.

  3. Click Save.

Pie

Yes

Yes

Note

 
To configure a Pie chart, Report Definition must have at least one decimal field configured.

Yes

You can select Pie or Donut as the display type for this report.

Report Thresholds

You can set a threshold indicator for a field to display if the field value meets the threshold condition. There are nine colors instead of the color palette for the threshold color selection in this release. Threshold indicators can be set only for view type Grid and Chart > Gauge.

For setting field threshold indicators for a Chart > Gauge view, see Create a Chart View.

For setting field threshold indicators for a Grid view, perform the following steps:

Procedure

Step 1

From the Manage Views screen, after adding the report views, click Next.

The Thresholds screen appears.

Step 2

Select a view to which you want to set the threshold and select the field name from the Create new threshold list.

The screen refreshes with a new panel for the selected field name.

Step 3

Select a field operator and set a condition from the Operator list.

Operator

Description

Matches

The Matches operator accepts Regular Expressions.

Note that the Regular Expressions does not support:

  • Flags (i, g, m, n, y), OR/AND any combinations of these flags.

  • Leading and trailing forward slash (/).

Example:

  • Valid Pattern → \w+\s

  • Invalid Pattern → /\w+\s/g

    (As it contains leading and trailing forward slash (/) and a "g" flag.)

String fields; Always, Equal, Not Equal

Decimal fields; Always, Equal, Not Equal, Greater Than, Less Than, Greater Than Equal To, Less Than or Equal To, Between

In Report Definition, if the %format is defined for any field, then while setting the thresholds for that field, ensure to enter the decimal format of the percentage to render the condition in the report.

For example:

In Report Definition, if %format is defined for the field "SL" (Service Level) and you want to apply thresholds to this field to indicate "Red" if SL is less than 60%, set the following:

  1. Define the threshold for the SL field.

  2. Set the Operator to Less Than.

  3. Enter the percentage value as 0.60.

  4. Select “Red” in the No Fill drop-down.

  5. Click Done.

Step 4

Choose the options from No Fill and edit the threshold fields.

Note


You can set conditions on the same or different fields:

  • condition on same field: threshold and condition on the same field.

  • condition on different field: threshold for a field, based on the condition on the different field.

  • multi conditions on same field: apply threshold for a field based on the condition on different fields.

Caution


When you upgrade to Unified Intelligence Center version 11.6 or later, all the threshold colors are retained for reports that are created in the earlier versions. But, when you modify the threshold, all the old threshold color selection are lost within the report. Hence, you must reconfigure the threshold color selection for that report.

For existing reports, perform the above mentioned steps to add more thresholds.

Note

 
Threshold configuration supports upto 30 thresholds for a field.

To edit an existing threshold from a report run already, click Report options and select Manage Thresholds.

Step 5

Format the text in the field to appear when it matches the threshold condition. Use the following options:

  • Text Bold—Select this check box to highlight the report field in bold.

  • Text/Background Color—Select a color from the drop-down for the text/background color in the field.

  • Text Substitute—Enter a new string if you want the text in the field to be replaced with it when it matches the threshold condition.

    • Syntax to add an html hyperlink as text substitute: <a href=https://www.cisco.com target=_blank>cisco</a>

    • Syntax to add an empty space as text substitute: &nbsp;

  • Image Location—Enter the URL path of the image if you want the text to be replaced with an image.

    Note


    Supports only image URLs reachable from Unified Intelligence Center server. Maximum size limit allowed for the image is 5MB.

Step 6

Click Done.

Step 7

Click Finish.


Run Report

Report Actions - Run Mode

The following table lists all the menu items and actions you can perform when you run a report.

Table 5. Report Actions
Action Description
Report options

Edit View

Displays the Edit View dialog box. You can modify the current report view and click Done to instantly view the modified view.

Save View As

Clones the existing report view. In the Save View dialog box, enter the Name and Description for the cloned view and click Save. The report page refreshes with the cloned view.

Create Chart View

For the report that is run, you can directly create a chart view if you have Edit permissions. After you create the chart view, the report page refreshes with the newly created chart view and gets listed in the view list.

Note


This feature is disabled for Live Data reports.

For more information, see Create a Chart View.

Group By

Add/remove/update grouping configurations for the current view (columns). Cisco Unified Intelligence Center grid reports support up to three levels of grouping.

If you are grouping the column with Date or Date time data type, you can group records on a Daily/Weekly/Monthly basis.

For more information, see Group By.

Manage Thresholds

Sets a threshold indicator for a field to display if the field value meets the threshold condition. Threshold indicators can be set only for views of type Grid and Gauge.

For more information, see Report Thresholds.

SQL

Displays the SQL code used to run this report.

Export

Exports the already run grid report data into your local disk in a .xlsx format.

Note

 
  • When you export a report to an Excel file format, to read the exported report, the client system’s locale must match with the browser’s locale (where you had exported the report).

  • When reports are exported to excel in Report viewer, the custom formatting of DECIMAL data type is not applied.

Report menu

Run or Pause the report

Click to run or pause the report respectively.

Note


Report running times out after three minutes. Rerun the report by modifying the filter, and if the problem persists, contact your administrator.

Print Report

Prints the report using your default printer.

Note


Reports in chart view supports only landscape mode in A3 size paper for printing.

Manage Filters

Displays Choose Filter dialog box to modify filter criteria for this report.

For more information, see Report Filters.

Refresh

Refreshes the Report page.

View Filter Information

Displays the filter information of the report.

Online Help

Displays the configured template help. You can configure template help for the report from the Reports page > Add Help.

For more information, see Add Template Help.

Only Thresholds

Enable this toggle button to view only rows with matching threshold values in the report.

By default, this check box is unchecked for every report.

Note


This button is disabled for the grouped view.

Group By

For a report that is run, use the Group By option to add/remove/update grouping configurations for the current view. Cisco Unified Intelligence Center grid reports support up to three levels of grouping.

If you are grouping the column with Date or Date Time data type, you can group records on a Daily/Weekly/Monthly basis.


Note


Live data reports do not support grouping.


To group the report data, perform the following steps:

Procedure

Step 1

From the report that is run, click the Report options icon and select the Group By option.

Step 2

In the Group By dialog box, specify the Number of Levels you want to group the report.

Depending on the number of levels selected, the Level, Grouped By, Sub Group, and Show Expanded columns are activated.

Cisco Unified Intelligence Center grid reports support up to three levels of grouping.

Step 3

To group the report data by values in a particular column, select the required column name from the Grouped By list.

If you select a date or date and time value from the list, you can select any one of the following from the Sub Group column:
  • None—The report data is grouped by the absolute date or date time values.

  • Daily—The report data is grouped by day.

  • Weekly—The report data is grouped by week.

  • Monthly—The report data is grouped by month.

By default, the Show Expanded option is selected and you can uncheck the option if necessary. The Show Expanded column allows you to view the reports that are run with the group expanded.

Enable the Show Summary Only toggle button to display only the summary row in the report.

For example, if you group by Agent Team and enable the Show Summary Only toggle button, only the summary data row for each team is displayed.

Note

 
If any of the fields have a footer formula defined in the report definition, then a group level summary is also displayed for such fields using that formula.

Step 4

Click Save.

Note

 
  • For the grouped view, the Only Thresholds check box is disabled.

  • Thresholds are not displayed in a grouped field and on summary rows.

  • You cannot perform a drill-down from a report with grouped fields.


Cisco Unified Intelligence Center Reporting User Roles

Your User Role allows you to access the application functionality that corresponds to that role.

With appropriate User Role, you can:

  • Assign a user to one or more of the six User Roles.

  • Assign multiple User Roles to individual users depending on the size, staff, geographical distribution, and security practices of your call center.

  • Distribute each user role to many users.


Note


Role changes to a user who is currently signed in, must sign out and sign in again for the changes to take effect.

When you modify the user roles, the changes are logged in the CCBU-cuic.<timestamp>.startup.log file with ROLES_AUDIT_LOG as prefix to the changes.


Caution


Do not modify the user information of a user who is currently signed in, as the user will be automatically signed out.


Note


The Login User role, earlier identified for all the users who could sign in to Unified Intelligence Center is now integrated within the system. To activate or inactivate a user, you can use the toggle button in the Edit User > User Information tab.

An active login user can:

  • Sign in to Unified Intelligence Center.

  • Access Configure > Users and edit their information. For example, to change their Alias or Last Name.

User Role

Supported Functions

System Configuration Administrator

Manages Data Sources and Scheduler.

Security Administrator

The initial, default Security Administrator is the user who is defined as the System Application User during the installation.

Manages Users, User Groups, and User Permissions.

Also, System Administrators can:

  • Assign User Roles—User Roles are associated with people. User Roles are assigned to users to control access to various functions and what objects you can create.

  • Assign users to User Groups.

  • Assign Permissions—Permissions are associated with objects (Dashboards, Reports, Report Definitions, Data Sources, Value Lists, and Collections).

  • Use the Run As feature to verify other users' permissions.

Dashboard Designer

Manages Dashboards.

Value List Collection Designer

Manages Value Lists and Collections.

Report Designer

Manages Reports. Can access Scheduler to work on reports with appropriate permissions.

Report Definition Designer

Manages Report Definitions.


Note


For users who have been synched into Unified Intelligence Center from Unified CCE or Packaged CCE, you cannot edit the Report Designer and the Dashboard Designer roles.


Users in the Administration Console

There are three user accounts that have access to the Administration console:

Super Users

This user role is defined in the Administration console. It is the only user role for Administration.

The initial and default Super User is the System Application User who is configured during installation.

The initial Super User (the System Application User) can sign in to the Unified Intelligence Center Reporting console and has all User Roles and full permissions for all drawers in Unified Intelligence Center Reporting. Those credentials cannot be removed from the initial Super User.

Additional Super Users who are added in the Administration Console can also sign in to Unified Intelligence Center Reporting and are considered to be IMS users. They have limited Login User role only, until the Unified Intelligence Center Reporting security administrator gives them additional roles and flags them as Active users.

Local users can log in using their IMS username and password. After logging in for the first time, the users are listed on the User List Page. The username is not case sensitive, but the password is case sensitive.

System Application User

This user role is defined during installation. Although it is possible to define unique application user names and passwords during the installation of each node, you must use the same credentials for all installations.

The application user defined during the installation of the Controller is the only System Application User recognized by Unified Intelligence Center.

This user has full rights to all functions in the Administration and Unified Intelligence Center Reporting applications, as described below:

  • Can log in to the Administration application and becomes the initial Super User for Administration.

  • Can create additional Super Users in the Administration application.

  • Can log in to Unified Intelligence Center and has full rights to all functions in Unified Intelligence Center.

  • Is the initial Security Administrator user in the Unified Intelligence Center Reporting application.

  • Can create additional Security Administrator users in the Unified Intelligence Center Reporting application.

  • Cannot have any role taken away from them.

  • Cannot take any role away from himself.

  • This user can log in to the Reporting application and is the initial System user.

System Administration User

The System Administrator account User ID and password are configured at installation for each node. You must enter the same user name and password for all nodes.

The System Administrator for the Controller can access:

  • The Cisco Systems tools on the Navigation drop-down menu in the Administration console: Disaster Recovery System, Cisco Unified Serviceability, and Cisco Unified OS Administration interfaces.

  • The CLI for the Controller.

The System Administrator has no access to functions in the Unified Intelligence Center Reporting application.


Note


If you configure unique System Administrator credentials for Member nodes, use those credentials to access the CLI for those Member servers.