Serviceability Reports Archive
The Cisco Serviceability Reporter service generates daily reports containing charts that display a summary of the statistics for that particular report. Reporter generates reports once a day on the basis of logged information.
Using the serviceability GUI, view reports from . You must activate the Cisco Serviceability Reporter service before you can view reports. After you activate the service, report generation may take up to 24 hours.
The reports contain 24-hour data for the previous day. A suffix that is added to the report names shows the date for which Reporter generated them; for example, AlertRep_mm_dd_yyyy.pdf. The Serviceability Reports Archive window uses this date to display the reports for the relevant date only. The reports generate from the data that is present in the log files, with the timestamp for the previous day. The system considers log files for the current date and the previous two days for collecting data.
The time that is shown in the report reflects the server "System Time."
You can retrieve log files from the server while you are generating reports.
 Note |
The Cisco Unified Reporting web application provides snapshot views of data into one output and runs data checks. The application also allows you to archive generated reports. See the Cisco Unified Reporting Administration Guide for more information. |
Serviceability Report Archive Considerations for Cluster Configurations
This section applies to Unified Communications Manager and IM and Presence Service only.
-
Because the Cisco Serviceability Reporter is only active on the first server, at any time, Reporter generates reports only on the first server, not the other servers.
-
The time that is shown in the report reflects the first server "System Time." If the first server and subsequent servers are in different time zones, the first server "System Time" shows in the report.
-
The time zone differences between the server locations in a cluster are taken into account when data is collected for the reports.
-
You can select log files from individual servers or from all servers in the cluster when you generate reports.
-
Cisco Unified Reporting web application output and data checks include cluster data from all accessible servers.
Serviceability Reporter Service Parameters
Cisco Serviceability Reporter uses the following service parameters:
-
RTMT Reporter Designated Node - Specifies the designated node on which RTMT Reporter runs. This default equals the IP address of the server on which the Cisco Serviceability Reporter service is first activated.
Unified Communications Manager only: Because the Serviceability Reporter service is CPU intensive, Cisco recommends that you specify a non-call-processing node.
-
Report Generation Time - Specifies the number of minutes after midnight. Reports are generated at this time for the most recent day. The minimum value equals 0 and the maximum value equals 1439.
-
Report Deletion Age - Specifies the number of days that the report must be kept on the disk. The system deletes reports that are older than the specified age. The minimum value equals 0, and the maximum value equals 30.
 Tip |
You can disable reports by setting the service parameter Report Deletion Age to a value of 0. |
For more information about service parameter configuration, see the following guides:
-
Unified Communications Manager only: System Configuration Guide for Cisco Unified Communications Manager
-
Connection only: System Administration Guide for Cisco Unity Connection
Note |
Unified Communications Manager only: If a node is removed completely from the network and does not appear in the list of servers in Cisco Unified Communications Manager Administration, Reporter does not include that node when it generates reports, even if the log file contains the data for that node. |
Device Statistics Report
The Device Statistics Report does not apply to IM and Presence Service and Cisco Unity Connection.
The Device Statistics Report provides the following line charts:
-
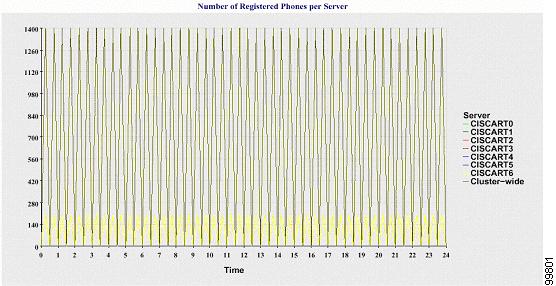
Number of Registered Phones per Server
-
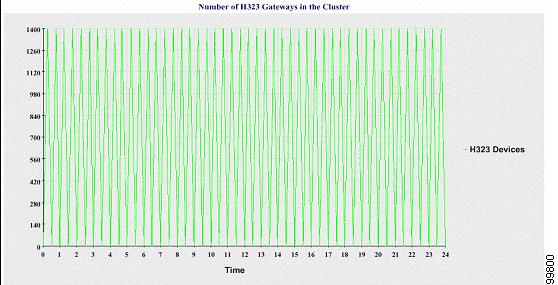
Number of H.323 Gateways in the Cluster
-
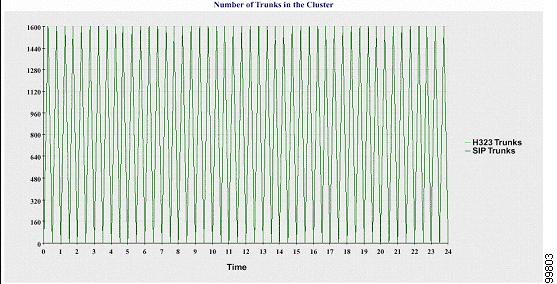
Number of Trunks in the Cluster
Number of Registered Phones Per Server
A line chart displays the number of registered phones for each Unified Communications Manager server (and cluster in a Unified Communications Manager cluster configuration). Each line in the chart represents the data for a server for which data is available, and one extra line displays the clusterwide data (Unified Communications Manager clusters only). Each data value in the chart represents the average number of phones that are registered for a 15-minute duration. If a server shows no data, Reporter does not generate the line that represents that server. If no data exists for the server (or for all servers in a Unified Communications Manager cluster configuration), for registered phones, Reporter does not generate the chart. The message "No data for Device Statistics report available" displays.
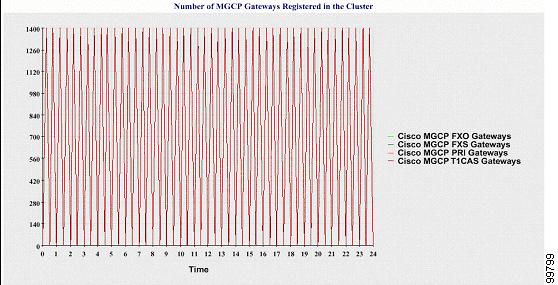
Number of MGCP Gateways Registered in the Cluster
A line chart displays the number of registered MGCP FXO, FXS, PRI, and T1CAS gateways. Each line represents data only for the Unified Communications Manager server (or cluster in a Unified Communications Manager cluster configuration); so, four lines show server (or clusterwide) details for each gateway type. Each data value in the chart represents the average number of MGCP gateways that are registered for a 15-minute duration. If no data exists for a gateway for the server (or all the servers in a cluster), Reporter does not generate the line that represents data for that particular gateway. If no data exists for all gateways for the server (or for all servers in a cluster), Reporter does not generate the chart.
Number of H.323 Gateways in the Cluster
A line chart displays the number of H.323 gateways. One line represents the details of the H.323 gateways (or the clusterwide details in a Unified Communications Manager cluster configuration). Each data value in the chart represents the average number of H.323 gateways for a 15-minute duration. If no data exists for H.323 gateways for the server (or for all servers in a cluster), Reporter does not generate the chart.
Number of Trunks in the Cluster
A line chart displays the number of H.323 and SIP trunks. Two lines represent the details of the H.323 trunks and SIP trunks (or the clusterwide details in a Unified Communications Manager cluster configuration). Each data value in the chart represents the average number of H.323 and SIP trunks for a 15-minute duration. If no data exists for H.323 trunks for the server (or for all servers in a cluster), Reporter does not generate the line that represents data for the H.323 trunks. If no data exists for SIP trunks for the server (or for all servers in the cluster), Reporter does not generate the line that represents data for SIP trunks. If no data exists for trunks at all, Reporter does not generate the chart.
The server (or each server in the cluster) contains log files that match the filename pattern DeviceLog_mm_dd_yyyy_hh_mm.csv. The following information exists in the log file:
-
Number of registered phones on the server (or on each server in a Unified Communications Manager cluster)
-
Number of registered MGCP FXO, FXS, PRI, and T1CAS gateways on the server (or on each server in a Unified Communications Manager cluster)
-
Number of registered H.323 gateways on the server (or on each server in a Unified Communications Manager cluster)
-
Number of SIP trunks and H.323 trunks
Server Statistics Report
The Server Statistics Report provides the following line charts:
-
Percentage of CPU per Server
-
Percentage of Memory Usage per Server
-
Percentage of Hard Disk Usage of the Largest Partition per Server
Cluster-specific statistics are only supported by Unified Communications Manager and IM and Presence Service.
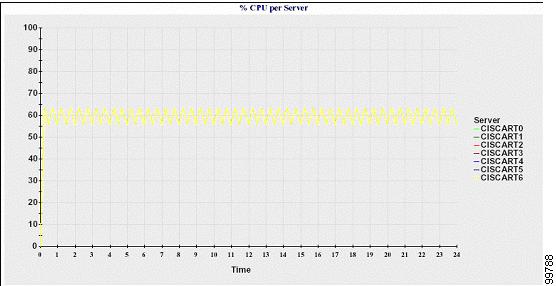
Percentage of CPU Per Server
A line chart displays the percentage of CPU usage for the server (or for each server in a cluster). The line in the chart represents the data for the server (or one line for each server in a cluster) for which data is available. Each data value in the chart represents the average CPU usage for a 15-minute duration. If no data exists for the server (or for any one server in a cluster), Reporter does not generate the line that represents that server. If there are no lines to generate, Reporter does not create the chart. The message "No data for Server Statistics report available" displays.
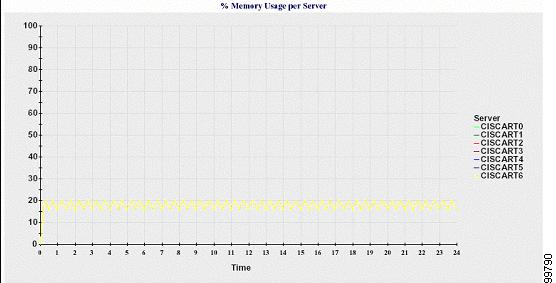
Percentage of Memory Usage Per Server
A line chart displays the percentage of Memory Usage for the Unified Communications Manager server (%MemoryInUse). In a Unified Communications Manager cluster configuration, there is one line per server in the cluster for which data is available. Each data value in the chart represents the average memory usage for a 15-minute duration. If no data exists, Reporter does not generate the chart. If no data exists for any server in a cluster configuration, Reporter does not generate the line that represents that server.
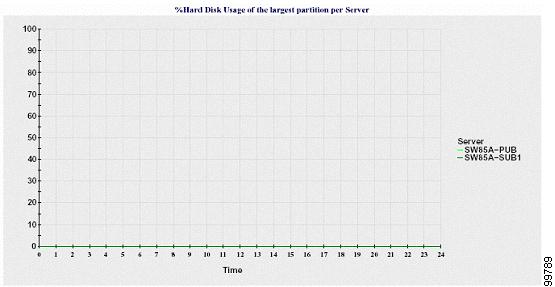
Percentage of Hard Disk Usage of the Largest Partition Per Server
A line chart displays the percentage of disk space usage for the largest partition on the server (%DiskSpaceInUse), or on each server in a cluster configuration. Each data value in the chart represents the average disk usage for a 15-minute duration. If no data exists, Reporter does not generate the chart. If no data exists for any one server in a cluster configuration, Reporter does not generate the line that represents that server.
The server (or each server in a cluster configuration) contains log files that match the filename pattern ServerLog_mm_dd_yyyy_hh_mm.csv. The following information exists in the log file:
-
Percentage of CPU usage on the server (or each server in a cluster)
-
Percentage of Memory usage (%MemoryInUse) on the server (or on each server in a cluster)
-
Percentage of Hard disk usage of the largest partition (%DiskSpaceInUse) on the server (or on each server in a cluster)
Service Statistics Report
The Service Statistics Report does not support IM and Presence Service and Cisco Unity Connection.
The Service Statistics Report provides the following line charts:
-
Cisco CTI Manager: Number of Open Devices
-
Cisco CTI Manager: Number of Open Lines
-
Cisco TFTP: Number of Requests
-
Cisco TFTP: Number of Aborted Requests
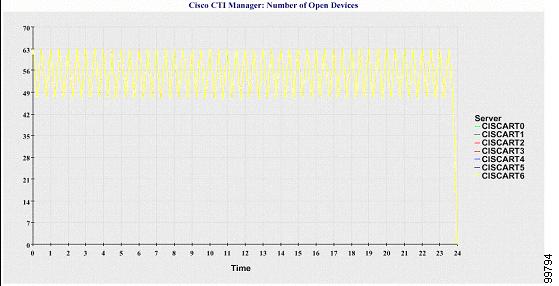
Cisco CTI Manager: Number of Open Devices
A line chart displays the number of CTI Open Devices for the CTI Manager (or for each CTI Manager in a Unified Communications Manager cluster configuration). Each line chart represents the data for the server (or on each server in a Unified Communications Manager cluster) on which service is activated. Each data value in the chart represents the average number of CTI open devices for a 15-minute duration. If no data exists, Reporter does not generate the chart. If no data exists for any one server in a Unified Communications Manager cluster configuration, Reporter does not generate the line that represents that server. The message "No data for Service Statistics report available" displays.
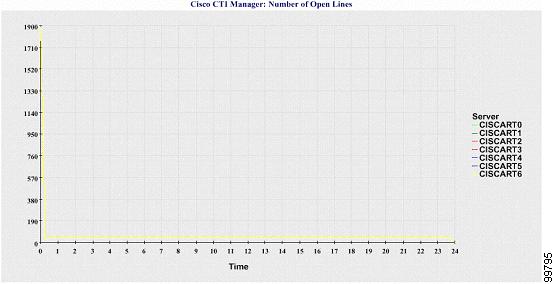
Cisco CTI Manager: Number of Open Lines
A line chart displays the number of CTI open lines for the CTI Manager (or per CTI Manager in a Unified Communications Manager cluster configuration). A line in the chart represents the data for the server (or one line for each server in a Unified Communications Manager cluster configuration) where the Cisco CTI Manager service is activated. Each data value in the chart represents the average number of CTI open lines for a 15-minute duration. If no data exists, Reporter does not generate the chart. If no data exists for any one server in a Unified Communications Manager cluster configuration, Reporter does not generate the line that represents that server.
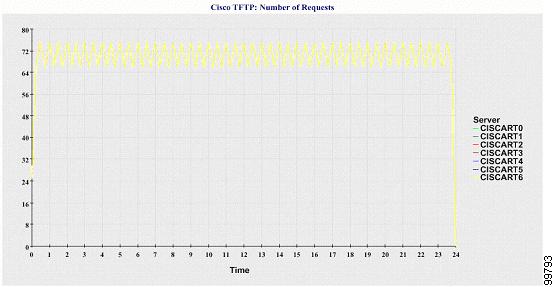
Cisco TFTP: Number of Requests
A line chart displays the number of Cisco TFTP requests for the TFTP server (or per TFTP server in a Unified Communications Manager cluster configuration). A line in the chart represents the data for the server (or one line for each server in a Unified Communications Manager cluster) where the Cisco TFTP service is activated. Each data value in the chart represents the average number of TFTP requests for a 15-minute duration. If no data exists, Reporter does not generate the chart. If no data exists for any one server in a Unified Communications Manager cluster configuration, Reporter does not generate the line that represents that server.
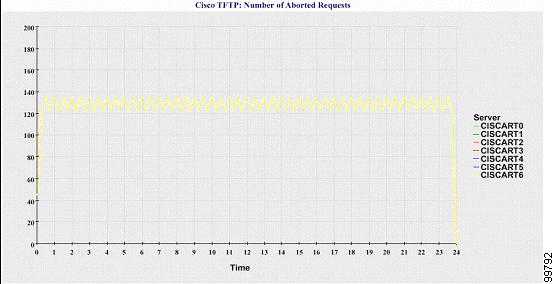
Cisco TFTP: Number of Aborted Requests
A line chart displays the number of Cisco TFTP requests that were aborted for the TFTP server (or per TFTP server in a Unified Communications Manager cluster configuration). A line in the chart represents the data for the server (or one line for each server in a Unified Communications Manager cluster) where the Cisco TFTP service is activated. Each data value in the chart represents the average of TFTP requests that were aborted for a 15-minute duration. If no data exists, Reporter does not generate the chart. If no data exists for any one server in a Unified Communications Manager cluster configuration, Reporter does not generate the line that represents that server.
The server (or each server in a Unified Communications Manager cluster) contains log files that match the filename pattern ServiceLog_mm_dd_yyyy_hh_mm.csv. The following information exists in the log file:
-
For each CTI Manager - Number of open devices
-
For each CTI Manager - Number of open lines
-
For each Cisco TFTP server - TotalTftpRequests
-
For each Cisco TFTP server - TotalTftpRequestsAborted
Call Activities Report
The Call Activities Report does not support IM and Presence Service and Cisco Unity Connection.
The Call Activities Report provides the following line charts:
-
Unified Communications Manager Call Activity for a cluster
-
H.323 Gateways Call Activity for the Cluster
-
MGCP Gateways Call Activity for the Cluster
-
MGCP Gateways
-
Trunk Call Activity for the Cluster
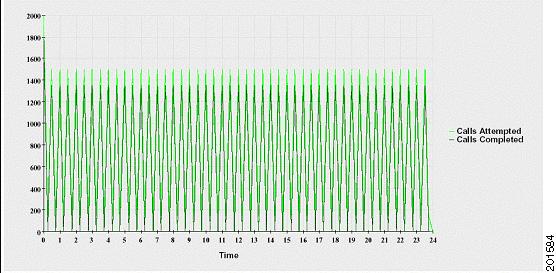
Cisco Unified Communications Manager Call Activity for the Cluster
A line chart displays the number of Unified Communications Manager calls that were attempted and calls that were completed. In a Unified Communications Manager cluster configuration, the line chart displays the number of calls attempted and completed for the entire cluster. The chart comprises two lines, one for the number of calls that were attempted and another for the number of calls that were completed. For a Unified Communications Manager cluster configuration, each line represents the cluster value, which is the sum of the values for all the servers in the cluster (for which data is available). Each data value in the chart represents the total number of calls that were attempted or calls that were completed for a 15-minute duration.
If no data exists for Unified Communications Manager calls that were completed, Reporter does not generate the line that represents data for the calls that were completed. If no data exists for Unified Communications Manager calls that were attempted, Reporter does not generate the line that represents data for the calls that were attempted. In a Unified Communications Manager cluster configuration, if no data exists for a server in the cluster, Reporter does not generate the line that represents calls attempted or completed on that server. If no data exists for Unified Communications Manager call activities at all, Reporter does not generate the chart. The message "No data for Call Activities report available" displays.
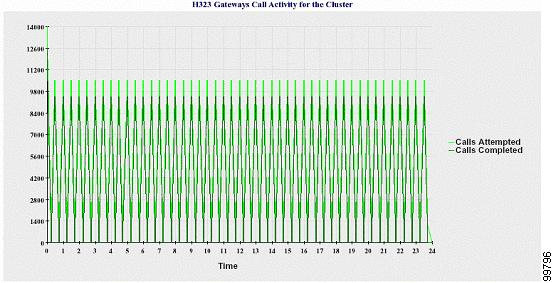
H.323 Gateways Call Activity for the Cluster
A line chart displays the number of calls that were attempted and calls that were completed for H.323 gateways. In a Unified Communications Manager cluster configuration, the line chart displays the number of calls attempted and completed for the entire cluster. The chart comprises two lines, one for the number of calls that were attempted and another for the number of calls that were completed. For a Unified Communications Manager cluster configuration, each line represents the cluster value, which equals the sum of the values for all the servers in the cluster (for which data is available). Each data value in the chart represents the total number of calls that were attempted or calls that were completed for a 15-minute duration. If no data exists for H.323 gateways calls that were completed, Reporter does not generate the line that represents data for calls that were completed. If no data exists for H.323 gateways calls that were attempted, Reporter does not generate the line that represents data for calls that were attempted. In a Unified Communications Manager cluster configuration, if no data exists for a server in the cluster, Reporter does not generate the line that represents calls attempted or completed on that server. If no data exists for H.323 gateways call activities at all, Reporter does not generate the chart.
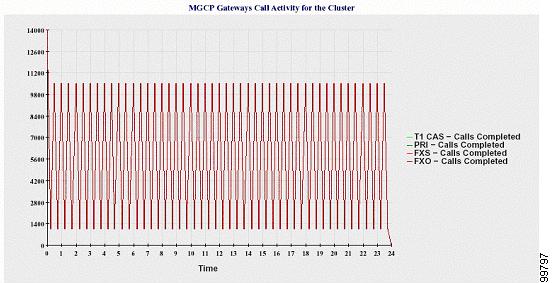
MGCP Gateways Call Activity for the Cluster
A line chart displays the number of calls that were completed in an hour for MGCP FXO, FXS, PRI, and T1CAS gateways. In a Unified Communications Manager cluster configuration, the chart displays the number of calls that were completed for the entire Unified Communications Manager cluster. The chart comprises four lines at the most, one for the number of calls that were completed for each of the gateway types (for which data is available). Each data value in the chart represents the total number of calls that were completed for a 15-minute duration. If no data exists for a gateway, Reporter does not generate the line that represents data for calls that were completed for a particular gateway. If no data exists for all gateways, Reporter does not generate the chart.
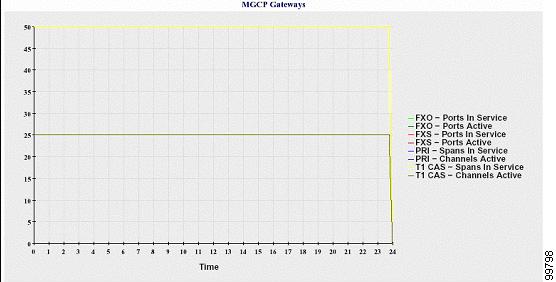
MGCP Gateways
A line chart displays the number of Ports In Service and Active Ports for MGCP FXO, FXS gateways and the number of Spans In Service or Channels Active for PRI, T1CAS gateways. For a Unified Communications Manager cluster configuration, the chart displays the data for the entire Unified Communications Manager cluster. The chart comprises eight lines, two lines each for the number of Ports In Service for MGCP FXO and FXS, and two lines each for the number of Active Ports for MGCP FXO and FXS. Four more lines for the number of Spans In Service and Channels Active for PRI and T1CAS gateways exist. For a Unified Communications Manager cluster configuration, each line represents the cluster value, which is the sum of the values for all servers in the cluster (for which data is available). Each data value in the chart represents the total Number of Ports In Service, Number of Active Ports, Spans In Service or Channels Active for a 15-minute duration. If no data exists for the number of Spans In Service or the Channels Active for a gateway (MGCP PRI, T1CAS) for all servers, Reporter does not generate the line that represents data for that particular gateway.
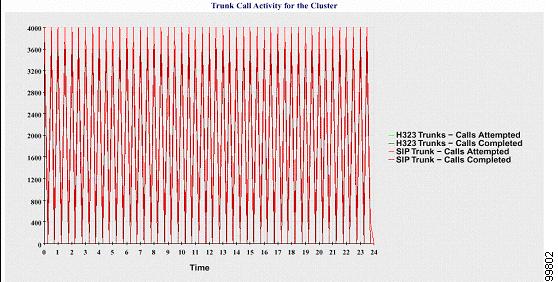
Trunk Call Activity for the Cluster
A line chart displays the number of calls that were completed and calls that were attempted in an hour for SIP trunk and H.323 trunk. For a Unified Communications Manager cluster configuration, the chart displays the number of calls that were completed and calls that were attempted for the entire Unified Communications Manager cluster. The chart comprises four lines, two for the number of calls that were completed for each SIP and H.323 trunk (for which data is available) and two for the number of calls that were attempted. For a Unified Communications Manager cluster configuration, each line represents the cluster value, which is the sum of the values for all nodes in the cluster (for which data is available). Each data value in the chart represents the total number of calls that were completed or number of calls that were attempted for a 15-minute duration. If no data exists for a trunk, Reporter does not generate the line that represents data for the calls that were completed or the calls that were attempted for that particular trunk. If no data exists for both trunk types, Reporter does not generate the chart.
The server (or each server in a Unified Communications Manager cluster configuration) contains log files that match the filename pattern CallLog_mm_dd_yyyy_hh_mm.csv. The following information exists in the log file:
-
Calls that were attempted and calls that were completed for Unified Communications Manager (or for each server in a Unified Communications Manager cluster)
-
Calls that were attempted and calls that were completed for the H.323 gateways (or for the gateways in each server in a Unified Communications Manager cluster)
-
Calls that were completed for the MGCP FXO, FXS, PRI, and T1CAS gateways (or for the gateways in each server in a Unified Communications Manager cluster)
-
Ports in service, active ports for MGCP FXO and FXS gateways and spans in service, channels active for PRI, and T1CAS gateways (in each server in a Unified Communications Manager cluster)
-
Calls that were attempted and calls that were completed for H.323 trunks and SIP trunks
Alert Summary Report
The Alert Summary Report provides the details of alerts that are generated for the day.
Cluster-specific statistics are supported only by Unified Communications Manager and IM and Presence Service.
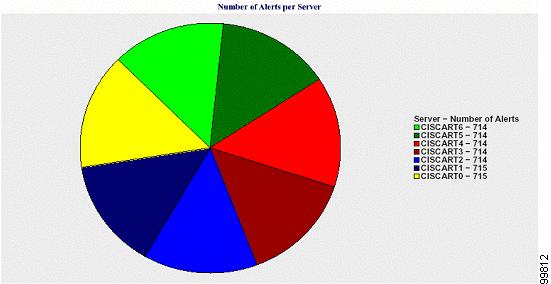
Number of Alerts Per Server
A pie chart provides the number of alerts per node in a cluster. The chart displays the serverwide details of the alerts that are generated. Each sector of the pie chart represents the number of alerts generated for a particular server in the cluster. The chart includes as many number of sectors as there are servers (for which Reporter generates alerts in the day) in the cluster. If no data exists for a server, no sector in the chart represents that server. If no data exists for all servers, Reporter does not generate the chart. The message "No alerts were generated for the day" displays.
Cisco Unity Connection only: A pie chart provides the number of alerts for the server. The chart displays the serverwide details of the alerts that are generated. If no data exists for the server, Reporter does not generate the chart. The message “No alerts were generated for the day” displays.
The following chart shows a pie chart example that represents the number of alerts per server in a Unified Communications Manager cluster.
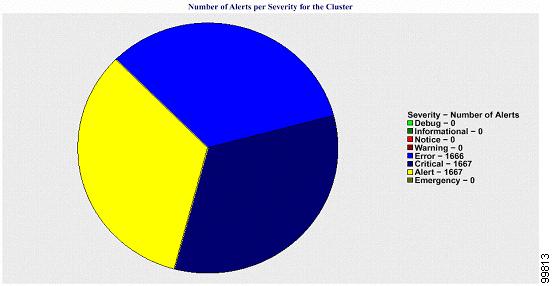
Number of Alerts Per Severity for the Cluster
A pie chart displays the number of alerts per alert severity. The chart displays the severity details of the alerts that are generated. Each sector of the pie chart represents the number of alerts that are generated of a particular severity type. The chart provides as many number of sectors as there are severities (for which Reporter generates alerts in the day). If no data exists for a severity, no sector in the chart represents that severity. If no data exists, Reporter does not generate the chart.
The following chart shows a pie chart example that represents the number of alerts per severity for a Unified Communications Manager cluster.
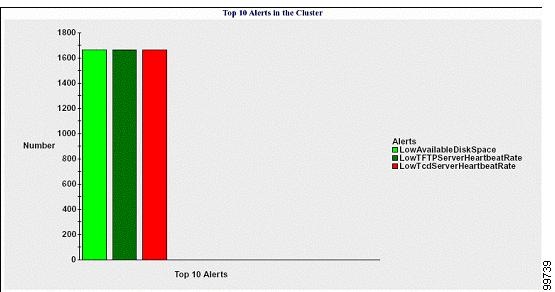
Top Ten Alerts in the Cluster
A bar chart displays the number of alerts of a particular alert type. The chart displays the details of the alerts that are generated on the basis of the alert type. Each bar represents the number of alerts for an alert type. The chart displays details only for the first ten alerts based on the highest number of alerts in descending order. If no data exists for a particular alert type, no bar represents that alert. If no data exists for any alert type, RTMT does not generate the chart.
The following chart shows a bar chart example that represents the top ten alerts in a Unified Communications Manager cluster.
The server (or each server in a cluster) contains log files that match the filename pattern AlertLog_mm_dd_yyyy_hh_mm.csv. The following information exists in the log file:
-
Time - Time at which the alert occurred
-
Alert Name - Descriptive name
-
Node Name - Server on which the alert occurred
-
Monitored object - The object that is monitored
-
Severity - Severity of this alert
Performance Protection Report
The Performance Protection Report does not support IM and Presence Service and Cisco Unity Connection.
The Performance Protection Report provides a summary that comprises different charts that display the statistics for that particular report. Reporter generates reports once a day on the basis of logged information.
The Performance Protection Report provides trend analysis information on default monitoring objects for the last seven that allows you to track information about Cisco Intercompany Media Engine. The report includes the Cisco IME Client Call Activity chart that shows the total calls and fallback call ratio for the Cisco IME client.
The Performance Protection report comprises the following charts:
-
Cisco Unified Communications Manager Call Activity
-
Number of registered phones and MGCP gateways
-
System Resource Utilization
-
Device and Dial Plan Quantities
Cisco Unified Communications Manager Call Activity
A line chart displays the hourly rate of increase or decrease for number of calls that were attempted and calls that were completed as the number of active calls. For a Unified Communications Manager cluster configuration, the data is charted for each server in the cluster. The chart comprises three lines, one for the number of calls that were attempted, one for the calls that were completed, and one for the active calls. If no data exists for call activity, Reporter does not generate the chart.
Number of Registered Phones and MGCP Gateways
A line chart displays the number of registered phones and MGCP gateways. For a Unified Communications Manager cluster configuration, the chart displays the data for each server in the cluster.The chart comprises two lines, one for the number of registered phones and another for the number of MGCP gateways. If no data exists for phones or MGCP gateways, Reporter does not generate the chart.
System Resource Utilization
A line chart displays the CPU load percentage and the percentage of memory that is used (in bytes) for the server (or for the whole cluster in a Unified Communications Manager cluster configuration). The chart comprises two lines, one for the CPU load and one for the memory usage. In a Unified Communications Manager cluster, each line represents the cluster value, which is the average of the values for all the servers in the cluster (for which data is available). If no data exists for phones or MGCP gateways, Reporter does not generate the chart.
Device and Dial Plan Quantities
Two tables display information from the Unified Communications Manager database about the numbers of devices and number of dial plan components. The device table shows the number of IP phones, Cisco Unity Connection ports, H.323 clients, H.323 gateways, MGCP gateways, MOH resources, and MTP resources. The dial plan table shows the number of directory numbers and lines, route patterns, and translation patterns.
Set Up Serviceability Reports Archive Overview
The following steps provide information for configuring the serviceability report archive feature.
Procedure
| Step 1 |
Activate the Cisco Serviceability Reporter service. |
| Step 2 |
Configure the Cisco Serviceability Reporter service parameters. |
| Step 3 |
View the reports that the Cisco Serviceability Reporter service generates. |
Set Up Serviceability Reports Archive
The Cisco Serviceability Reporter service generates daily reports in Cisco Unified Serviceability. Each report provides a summary that comprises different charts that display the statistics for that particular report. Reporter generates reports once a day on the basis of logged information.
This section describes how to use the Serviceability Reports Archive window.
Before you begin
Activate the Cisco Serviceability Reporter service, which is CPU intensive. After you activate the service, report generation may take up to 24 hours.
Unified Communications Manager only: Cisco recommends that you activate the service on a non-call-processing server.
Procedure
| Step 1 |
Choose . The Serviceability Reports Archive window displays the month and year for which the reports are available. |
||
| Step 2 |
From the Month-Year pane, choose the month and year for which you want to display reports. A list of days that correspond to the month displays. |
||
| Step 3 |
To view reports, click the link that corresponds to the day for which reports were generated. The report files for the day that you chose display. |
||
| Step 4 |
To view a particular PDF report, click the link of the report that you want to view.
A window opens and displays the PDF file of the report that you chose. |
Access to Serviceability Reports Archive
Activate Serviceability Reports Archive
Procedure
| Step 1 |
Select . |
| Step 2 |
Select the required server from the Server list box, and then select Go. |
| Step 3 |
Navigate to the Performance and Monitoring services pane. |
| Step 4 |
Check the Cisco Serviceability Reporter service checkbox, and then select Save. |
| Step 5 |
Select . |
| Step 6 |
Select the required server from the Server list box, and then select Go. |
| Step 7 |
Navigate to the Performance and Monitoring services pane and locate the Cisco Serviceability Reporter. |
| Step 8 |
Verify that the status of the Cisco Serviceability Reporter is Started and Activated. If the Cisco Serviceability Reporter is not running, select the Cisco Serviceability Reporter and select Start. |
What to do next
If you opened Cisco Unified IM and Presence Serviceability by entering the server name in the browser, you must sign in to Cisco Unified IM and Presence Serviceability before you can view the report.
The Cisco Unified IM and Presence Serviceability service generates reports only on the first node, even if you turn on the service on other nodes.
Access Serviceability Reports Archive
Before you begin
Activate the Cisco Serviceability Reporter service. After you activate the service, report generation may take up to 24 hours.
Procedure
| Step 1 |
Select . |
||
| Step 2 |
Select the month and year for which you want to display reports in the Month-Year section. |
||
| Step 3 |
Select the link that corresponds to the day for which reports were generated to view the required report. |
||
| Step 4 |
Select the link of the report that you want to view to view a particular PDF report. The section in the Trace Filter Settings area that relates to devices is not relevant to IM and Presence.
|
 Feedback