Logging into Cisco OMD Director
The following sections describe how to access the OMD Director GUI. To access the OMD Director GUI, you must be using one of the following supported browsers:
-
Firefox version 59 or later
-
Chrome version 66 or later
OMD Director HA
OMD Director supports an Active/Standby High Availability (HA) configuration and supports inter-site redundancy. OMD Director HA provides the following:
-
Prevents the loss of any configuration data due to a hardware, software, or network failure
-
Minimizes the loss of monitoring data such as time series metrics, alarms, and notifications due to a hardware, software, or network failure
-
Makes sure alarm emails continue to be sent
-
Continues to support streaming capabilities
In an OMD Director HA configuration, your OMD Director instance can be running in either primary or backup mode. If either the OMD Director primary or backup instance loses connection or fails, the remaining OMD Director instances will transition into a detached state.
The following describes the actions you can perform depending on the mode of the OMD Director instance that you are logged into:
-
Primary: You can only make configuration changes from the primary OMD Director instance. The primary instance is the authoritative instance for all data. Changes to all configurations made from the primary OMD Director instance are replicated to the backup instance.
-
Backup: While logged into the OMD Director instance that is running in backup mode, you can only view the configuration, you cannot make any changes to the configuration. Any buttons or links that would allow configuration changes will be disabled on the backup OMD Director instance. If you are logged into the backup OMD Director instance, the title bar will show “This OMD Director is currently running in backup mode”.
-
Detached: While an OMD Director instance is running in a detached state, you can view the configuration and you can acknowledge, clear, and comment on alarms. The buttons or links for any actions that are not allowed will be disabled. If you are logged into an OMD Director instance that is running in the detached state, the title bar will show “This OMD Director is currently running in detached mode”.
If the primary OMD Director instance fails, you must manually configure the backup OMD Director instance as the new primary OMD Director instance. For information on this procedure, see the Cisco Media Streamer and Cisco Media Broadcaster Installation and Upgrade Guide for more information on this procedure.
Log in to OMD Director
Perform the following steps to log in to OMD Director:
 Note |
If you are running OMD Director in an HA configuration, make sure you are logging into the OMD Director Primary instance if you want to make changes to the CDN configuration. |
Procedure
| Step 1 |
From a web browser, use HTTPS and enter the hostname or IP address of the OMD Director and port number 8099. For example: https://<omd_director_worker_hostname_or_ip_address>:8099 The OMD Director login page is displayed. |
||||
| Step 2 |
Log in with your username and passphrase. If this is the first time you are logging in, enter the username and passphrase that was emailed to you by the system. You will be prompted to change your passphrase as part of your first login. |
||||
| Step 3 |
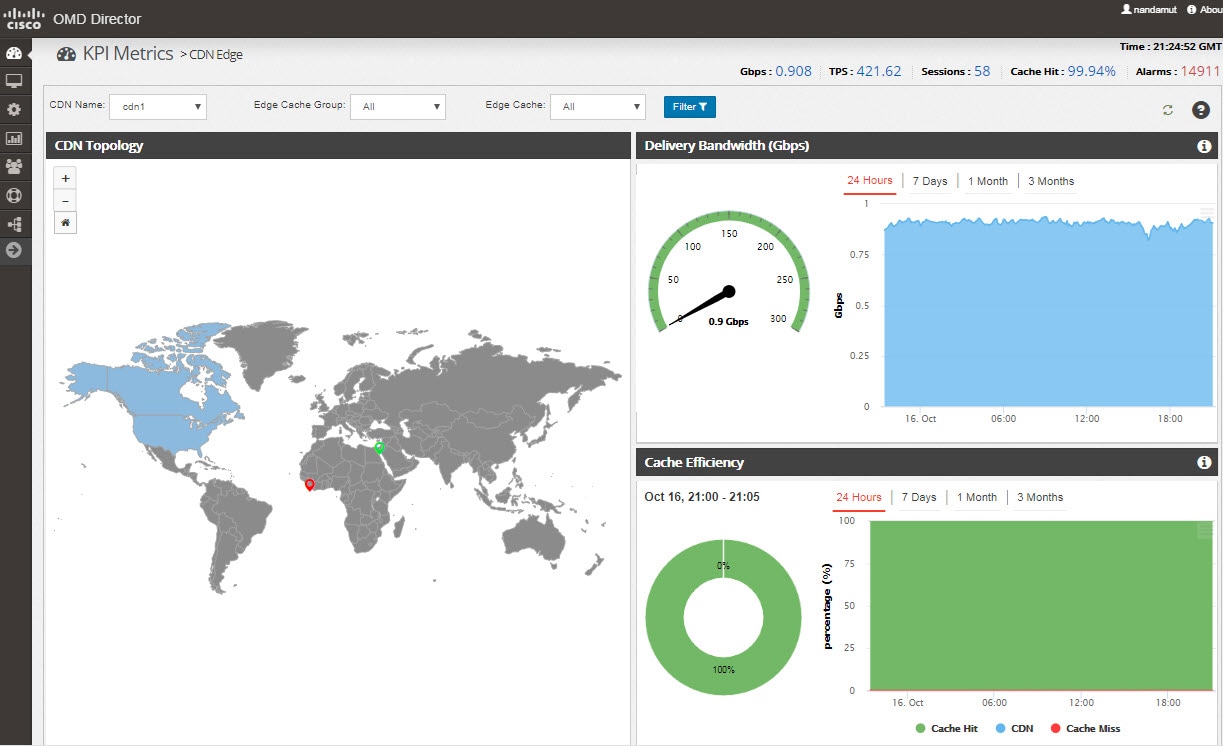
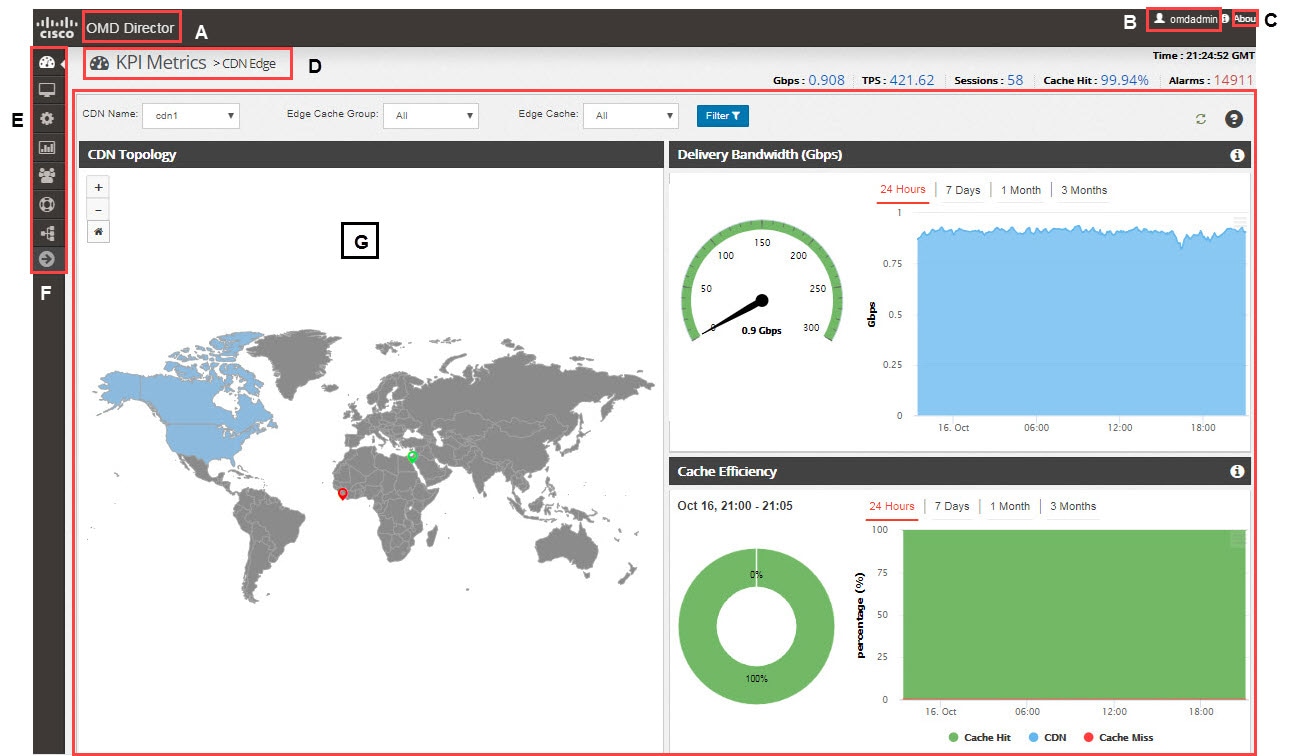
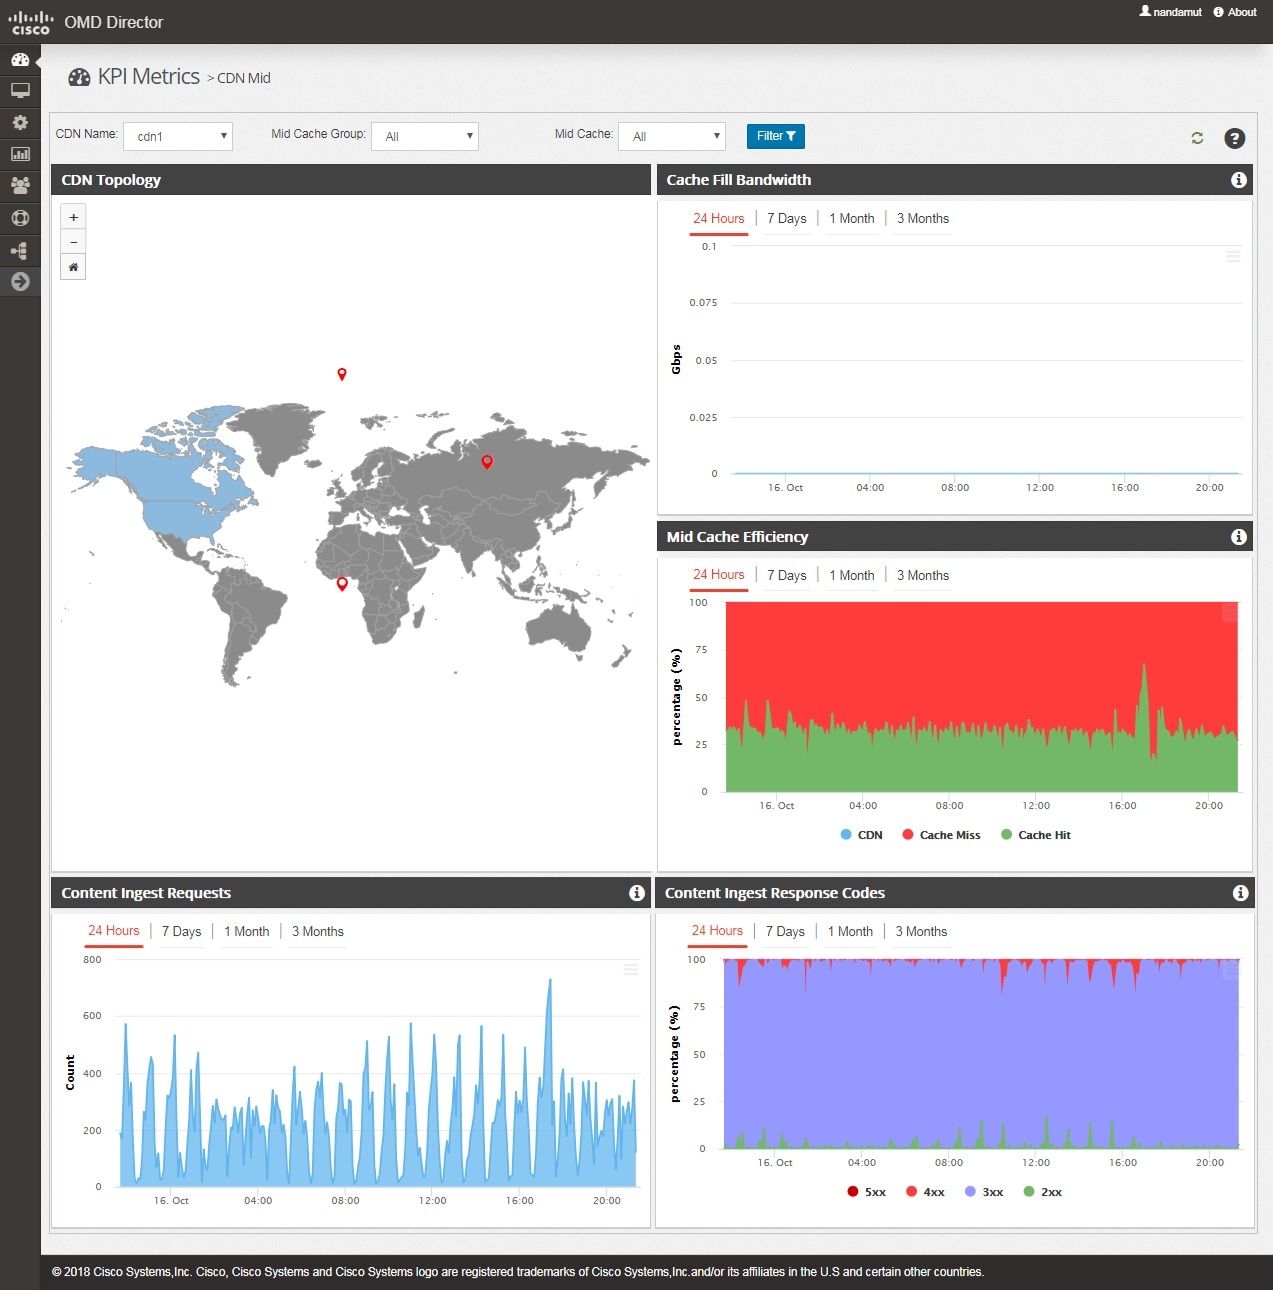
After you log in, the OMD Director home page appears. The home page is the CDN Edge KPI metrics page. If you are logged into either an OMD Director node running in standalone mode or the primary OMD Director node in an HA installation, the title bar of the window should be solid and there will be no message showing the state, as shown below.
 If you are logged into the Backup OMD Director instance, the title bar of the window will show “This OMD Director is currently running in backup mode”, as shown below. 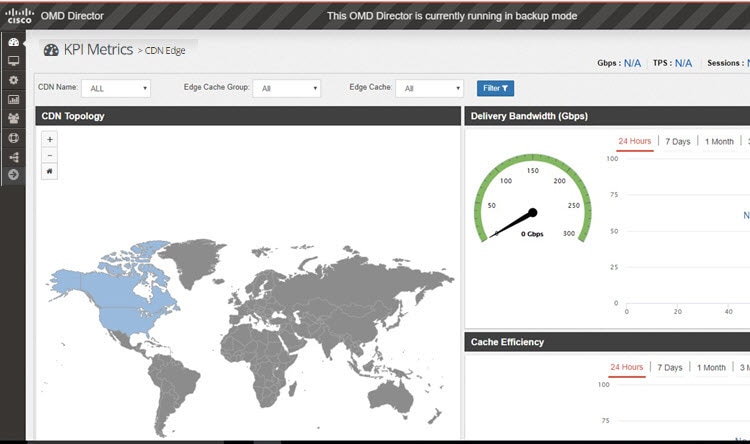 If you are logged into an OMD Director instance that is running in the detached state, the title bar of the window will show “This OMD Director is currently running in detached mode”.
|
Logging out of OMD Director
To logout of OMD Director, click your username in the upper-right corner of the window and choose Logout.


 Feedback