User Guide for Cisco Digital Media Manager 5.2.x
Bias-Free Language
The documentation set for this product strives to use bias-free language. For the purposes of this documentation set, bias-free is defined as language that does not imply discrimination based on age, disability, gender, racial identity, ethnic identity, sexual orientation, socioeconomic status, and intersectionality. Exceptions may be present in the documentation due to language that is hardcoded in the user interfaces of the product software, language used based on RFP documentation, or language that is used by a referenced third-party product. Learn more about how Cisco is using Inclusive Language.
- Updated:
- May 14, 2015
Chapter: DMS-Admin Dashboard
DMS-Admin Dashboard
Revised: May 13, 2015
OL-15762-03

|
|
We prepared this material with specific expectations of you. |


Note This material pertains to multiple releases of Cisco DMS.
Concepts
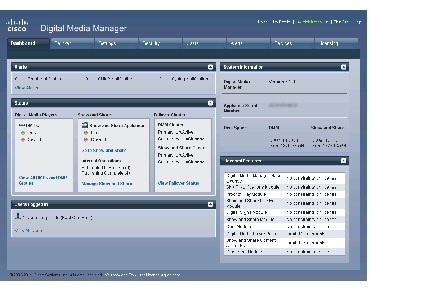
Dashboard Overview
The dashboard for DMS-Admin centralizes many features for system monitoring and log collection. When problems of any kind interfere with the data-collection processes that populate its gauges, they show question marks in addition to the best available data. In this case, check that your systems and network are configured and working correctly.
These are the dashboard gauges.
NEW IN CISCO DMS RELEASE 5.2.3 — The Failover Cluster gauge monitors your use, if any, of failover.
Note Sometimes, a monitoring gauge might leave out a value that you expect it to show. When this occurs, we mark any missing values with a placeholder symbol ( ) to indicate which values we could not show.


Tip![]() Until you install at least one license key, the DMS-Admin dashboard cannot retrieve data to populate its gauges.
Until you install at least one license key, the DMS-Admin dashboard cannot retrieve data to populate its gauges.
Understand the Alerts Gauge
This gauge shows the total count of notification messages delivered in the past 1 hour.


Timesaver Click View Alerts to open the Alerts page.
Understand the System Information Gauge
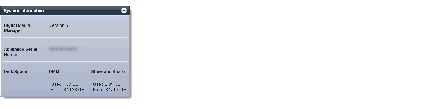
- Tells you the installed release version of your DMM server software.
- Tells you the serial number of your DMM appliance.
- Measures free space and used space for:
–![]() The content partition on your DMM appliance hard drive.
The content partition on your DMM appliance hard drive.
–![]() The content partition on your Show and Share appliance hard drive.
The content partition on your Show and Share appliance hard drive.
Understand the Status Gauge
Tip![]() Refresh your browser to update the data that this gauge shows.
Refresh your browser to update the data that this gauge shows.
Have you set up the hardware and activated the separately licensed software features for server failover, Show and Share, and your DMPs?
If so, this gauge summarizes their current state in three summaries, side-by-side.
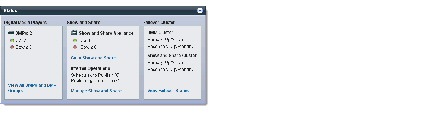
Timesaver Click...
• View All DMPs and DMP Groups to open the DMP Manager page.
• Go to Show and Share to open Show and Share.
• Manage Show and Share to open Show and Share Administration.
• View Failover Status to open the Failover Configuration page.
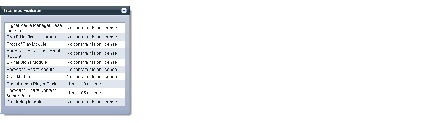
Understand the Licensed Features Gauge
This gauge lists software feature module licenses that are installed on your DMM appliance and describes constraints that your licenses impose.
Understand the Users Logged In Gauge
Counts the total number of users who logged in to your Cisco DMS appliances over the past 1 hour.

Timesaver Click View All Users to open the Users page in DMS-Admin.
Procedures
View Dashboard Gauges
Step 1![]() Click the Dashboard tab.
Click the Dashboard tab.
Step 2![]() Stop. You have completed this procedure.
Stop. You have completed this procedure.
 Feedback