Inventory
This section contains context-sensitive Online Help content for the Cisco DCNM Web Client UI Monitor > Inventory tab.
The Inventory menu includes the following submenus:
Viewing Inventory Information for Switches
Procedure
| Step 1 |
Choose Monitor > Inventory > Switches. The Switches window with a list of all the switches for a selected Scope is displayed. |
||
| Step 2 |
You can also view the following information.
|
||
| Step 3 |
In the Health column, the switch health is calculated by the capacity manager based on the following formula in the server.properties file. The function to implement is: # calculate(x, x1, y, y1, z). # @param x: Total number of modules. # @param x1: Total number of modules in warning. # @param y: Total number of switch ports. # @param y1: Total number of switch ports in warning. # @param z: Total number of events with severity of warning or above. |
||
| Step 4 |
The value in the Health column is calculated based on the following default equation. ((x-x1)*1.0/x) *0.4 + ((y-y1)*1.0/y)*0.3 + ((z*1.0/1000>=1) ? 0: ((1000-z)*1.0/1000)*0.3). In the above formula, the switch health value is calculated based on the following:
You may also have your own health calculation formula by implementing the common interface class: com.cisco.dcbu.sm.common.rif.HealthCalculatorRif. Add the .jar file to the DCNM server and modify the health.calculator property to point to the class name you have created. The default Java class is defined as: health.calculator=com.cisco.dcbu.sm.common.util.HealthCalculator.
|
Viewing System Information
The switch dashboard displays the details of the selected switch.
Procedure
| Step 1 |
From the Cisco DCNM home page, choose Monitor > Inventory > Switches. An inventory of all the switches that are discovered by Cisco Prime DCNM Web Client is displayed. |
| Step 2 |
Click a switch in the Device Name column. The Switch dashboard that corresponds to that switch is displayed along with the following information: |
| Step 3 |
Click the System Information tab. This tab displays detailed system information such as group name, health, module, time when system is up, serial number, the version number, contact, location, DCNM license, status, system log sending status, CPU and memory utilization, and VTEP IP address are displayed. Click Health to access the Health score screen, which includes health score calculation and health trend. The popup contains Overview, Modules, Switch Ports, and Events tabs.
|
VXLAN
You can view VXLANs and their details under the VXLAN tab.
To view VXLANs, choose Inventory > View > Switches, and then click a switch name in the Device Name column.
The following table describes the fields that are displayed:
|
Field |
Description |
|---|---|
|
VNI |
Displays the Layer 2 (network) or Layer 3 (VRF) VXLAN VNI that is configured on a switch. |
|
Multicast address |
Displays the multicast address that is associated with the Layer 2 VNI, if applicable. |
|
VNI Status |
Displays the status of the VNI. |
|
Mode |
Displays the VNI modes: Control Plane or Data Plane. |
|
Type |
Displays whether the VXLAN VNI is associated with a network (Layer 2) or a VRF (Layer 3). |
|
VRF |
Displays the VRF name that is associated with the VXLAN VNI if it is a Layer 3 VNI. |
|
Mapped VLAN |
Displays the VLAN or Bridge domain that is mapped to VNI. |
VLAN
You create a VLAN by assigning a number to it; you can delete VLANs and move them from the active operational state to the suspended operational state.
To configure VLANs, choose Inventory > View > Switches, and then click a switch in the Device Name column.
The following table describes the buttons that appear on this page.
|
Field |
Description |
|---|---|
|
Clear Selections |
Allows you to unselect all the VLANs that you selected. |
|
Add |
Allows you to create Classical Ethernet or Fabric Path VLANs. |
|
Edit |
Allows you to edit a VLAN. |
|
Delete |
Allows you to delete a VLAN. |
|
No Shutdown |
Allows you to enable a VLAN. |
|
Shutdown |
Allows you to disable a VLAN. |
|
Show |
Allows you to display the VLAN show commands. |
This section contains the following:
Adding a VLAN
Procedure
| Step 1 |
Choose Inventory > View > Switches. You see the Switches window displaying a list of all the switches for a selected Scope. |
| Step 2 |
In the Device Name column, select a switch to display the Switch Dashboard. |
| Step 3 |
Click the VLAN tab. |
| Step 4 |
Click Add to create Classical Ethernet or Fabric Path VLANs. In the Add VLAN window, specify the following fields:
|
Editing a VLAN
Procedure
| Step 1 |
Choose Inventory > View > Switches. You see the Switches window displaying a list of all the switches for a selected Scope. |
| Step 2 |
In the Device Name column, select a switch to display the Switch Dashboard. |
| Step 3 |
Select one or more VLANs, and then click the Edit button. |
Deleting a VLAN
Procedure
| Step 1 |
Choose Inventory > View > Switches. You see the Switches window displaying a list of all the switches for a selected Scope. |
| Step 2 |
In the Device Name column, select a switch to display the Switch Dashboard. |
| Step 3 |
Click VLAN tab. |
| Step 4 |
Select the VLAN that you want to delete, and then click Delete. |
Shutting Down a VLAN
Procedure
| Step 1 |
Choose Inventory > View > Switches. You see the Switches window displaying a list of all the switches for a selected Scope. |
| Step 2 |
In the Device Name column, select a switch to display Switch Dashboard. |
| Step 3 |
Click the VLAN tab. |
| Step 4 |
Click Shutdown to disable a VLAN. For example, if you want to stop traffic on a you can shut the VLAN. To enable a VLAN, click No Shutdown button. For example, if you want to start traffic flow on a VLAN you can enable it. |
Displaying VLAN Show Commands
Procedure
| Step 1 |
Choose Inventory > View > Switches. You see the Switches window displaying a list of all the switches for a selected Scope. |
| Step 2 |
In the Device Name column, select a switch to display Switch Dashboard. |
| Step 3 |
Click the VLAN tab. |
| Step 4 |
Click Show to display the VLAN show commands. Based on the VLAN selection, you can show the VLAN commands. Interface Show Commands window helps you to view commands and execute them. |
FEX
The Fabric Extender feature allows you to manage a Cisco Nexus 2000 Series Fabric Extender and its association with the Cisco NX-OS switch that it is attached to. A Fabric Extender is connected to the switch through physical Ethernet interfaces or a Port Channel. By default, the switch does not allow the attached Fabric Extender to connect until it has been assigned a chassis ID and is associated with the connected interface. You can configure a Fabric Extender host interface port as a routed or Layer 3 port. However, no routing protocols can be tied to this routed interface.
 Note |
FEX feature is available on LAN devices only. Therefore, you will see FEX on Cisco DCNM Inventory Switches. FEX is also not supported on Cisco Nexus 1000V devices. |
Note |
4x10G breakout for FEX connectivity is not supported on Cisco Nexus 9500 Switches. |
Note |
The Fabric Extender may connect to the switch through several separate physical Ethernet interfaces or at most one port channel interface. |
This section describes how to manage Fabric Extender (FEX) on Cisco Nexus Switches through Cisco DCNM.
You can create and manage FEX from Cisco DCNM Inventory > Switches.
Note |
FEX tab is visible only if you choose a LAN device. |
The following table describes the fields that appear on this page.
|
Field |
Description |
|---|---|
|
Add |
Click to add a new FEX to a Cisco Nexus Switch. |
|
Edit |
Select any active FEX radio button and click Edit to edit the FEX configuration. You can create an edit template and use it for editing FEX. Select template type as POLICY and sub type as FEX. |
|
Delete |
Select the FEX radio button, and click Delete icon to delete the FEX associated with the switch. |
|
Show |
Allows you to view various configuration details for the selected FEX ID. You can select the following from the drop-down list.
The variables for respective show commands are displayed in the Variables area. Review the Variables and click Execute. The output appears in the Output area. You can create a show template for FEX. Select template type as SHOW and sub type as FEX. |
|
FEX History |
Allows you to view the history of the FEX configuration tasks for a particular FEX. You can review the Event Type, Policy Name, Status, Time of Execution, User Name for the selected FEX. |
|
Field |
Description |
||
|---|---|---|---|
|
Fex Id |
Uniquely identifies a Fabric Extender that is connected to a Cisco NX-OS device. |
||
|
Fex Description |
Description that is configured for the Fabric Extender. |
||
|
Fex Version |
Specifies the version of the FEX that is associated with the switch. |
||
|
Pinning |
An integer value that denotes the maximum pinning uplinks of the Fabric Extender that is active at a time. |
||
|
State |
Specifies the status of the FEX as associated with the Cisco Nexus Switch. |
||
|
Model |
Specifies the model of the FEX. |
||
|
Serial No. |
Specifies the configured serial number.
|
||
|
Port Channel |
Specifies the port channel number to which the FEX is physically connected to the Switch. |
||
|
Ethernet |
Refers to the physical interfaces to which the FEX is connected. |
||
|
vPC ID |
Specifies the vPC ID configured for FEX. |
This chapter includes the following sections:
Add FEX
To add single-home FEX from the Cisco DCNM Web UI, perform the following steps:
Before you begin
You can add a Fabric Extender (FEX) to the Cisco Nexus Switches through the Cisco DCNM Web Client. If the FEX is physically connected to the switch, FEX will become online after it is added. If the FEX is not physically connected to the switch, the configuration is deployed to the switch, which in turn enables FEX when connected.
Note |
You can create only single homed FEX through Inventory > Switches > FEX > Add FEX. To create a dual-homed FEX, use the vPC wizard through Configure > Deploy > vPC. |
Ensure that you have successfully discovered LAN devices and configured LAN credentials before you configure FEX.
Procedure
| Step 1 |
Choose Inventory > Switches > FEX. The FEX window is displayed. |
||
| Step 2 |
Click the Add FEX icon. |
||
| Step 3 |
In the General tab, in the PORTCHANNEL field, enter the interface port channel number which is connected to the FEX. |
||
| Step 4 |
In the INT_RANGE field, enter the interface range within which the FEX is connected to the switch.
|
||
| Step 5 |
In the FEX_ID field, enter the ID for FEX that is connected to a Cisco NX-OS device. The identifier must be an integer value between 100 to 199. |
||
| Step 6 |
Click Add. The configured Single-home FEX appears in the list of FEXs associated to the device. |
Edit FEX
To edit and deploy FEX from the Cisco DCNM Web UI, perform the following steps:
Procedure
| Step 1 |
Choose Inventory > Switches > FEX. The FEX window is displayed. |
||
| Step 2 |
Select the FEX radio button that you must edit. Click Edit FEX icon. |
||
| Step 3 |
In the Edit Configuration window, from the Policy drop-down list, select Edit_FEX to edit the FEX configuration. |
||
| Step 4 |
Edit the pinning and FEX_DESC fields, as required.
|
||
| Step 5 |
Click Preview. You can view the generated configuration for the selected FEX ID. The following is a configuration example for FEX ID 101. |
||
| Step 6 |
After you review the configuration summary on the Preview window, on the Edit Configuration screen, click Deploy to deploy the FEX for the switch. |
VDCs
This section describes how to manage Virtual Device Contexts (VDCs) on Cisco Nexus 7000 Switches through Cisco DCNM.
Users with the network administrator (network-admin) role can create Virtual Device Contexts (VDCs). VDC resource templates limit the amount of physical device resources available to the VDC. The Cisco NX-OS software provides a default resource template, or you can create resource templates.
You can create and manage VDCs from Cisco DCNM Inventory > Switches > VDCs. As Cisco DCNM supports DCNM on Cisco Nexus 7000 Series only, click an active Cisco Nexus 7000 Switch. After you create a VDC, you can change the interface allocation, VDC resource limits, and the high availability (HA) policies.
The following table describes the fields that appear on this page.
|
Field |
Description |
||||
|---|---|---|---|---|---|
|
Add |
Click to add a new VDC. |
||||
|
Edit |
Select any active VDC radio button and click Edit to edit the VDC configuration. |
||||
|
Delete |
Allows you to edit the VDC configuration. Select any active VDC radio button and click Edit to edit the VDC configuration. |
||||
|
Resume |
Allows you to delete the VDC. Select any active VDC radio button and click Delete to remove the VDC associated with the device. |
||||
|
Suspend |
Allows you to suspend an active non-default VDC. Save the VDC running configuration to the startup configuration before suspending the VDC. Otherwise, you will lose the changes to the running configuration.
|
||||
|
Rediscover |
Allows you to resume a non-default VDC from the suspended state. The VDC resumes with the configuration that is saved in the startup configuration. |
||||
|
Show |
Allows you to view the Interfaces and Resources that are allocated to the selected VDC. In the Interface tab, you can view the mode, admin-status, and operational status for each interface associated with the VDC. In the Resource tab, you can view the allocation of resources and current usage of these resources. |
|
Field |
Description |
|---|---|
|
Name |
Displays the unique name for the VDC |
|
Type |
Species the type of VDC. The two types of VDCs are:
|
|
Status |
Specifies the status of the VDC. |
|
Resource Limit-Module Type |
Displays the allocated resource limit and module type. |
|
HA-Policy
|
Specifies the action that the Cisco NX-OS software takes when an unrecoverable VDC fault occurs. You can specify the HA policies for single supervisor module and dual supervisor module configurations when you create the VDC. The HA policy options are as follows: Single supervisor module configuration:
Dual supervisor module configuration:
The default HA policies for a non-default VDC that you create is restart for a single supervisor module configuration and switchover for a dual supervisor module configuration. The default HA policy for the default VDC is reload for a single supervisor module configuration and switchover for a dual supervisor module configuration. |
|
Mac Address |
Specifies the default VDC management MAC address. |
|
Management Interface
|
Species the IP Address of the VDC Management interface. The status shows if the interface if up or down. |
|
SSH |
Specifies the SSH status |
This chapter includes the following sections:
Add VDCs
To add VDC from the Cisco DCNM Web UI, perform the following steps:
Before you begin
Ensure that you have discovered the physical device using a username that has the network-admin role.
Obtain an IPv4 or IPv6 address for the management interface (mgmt 0) if you want to use out-of-band management for the VDC.
Create a storage VDC to run FCoE. The storage VDC cannot be the default VDC and you can have one storage VDC on the device.
Procedure
| Step 1 |
Choose Inventory > Switches > VDC. The VDC window is displayed. |
| Step 2 |
Click the Add VDC icon. |
| Step 3 |
From the drop-down list, select the VDC type. You can configure the VDC in two modes.
The default VDC type is Ethernet. |
| Step 4 |
Click OK. |
Configuring Ethernet VDCs
To configure VDC in Ethernet mode from the Cisco DCNM Web UI, perform the following steps:
Procedure
| Step 1 |
In the General Parameter tab, specify the VDC Name, Single supervisor HA-policy, Dual supervisor HA-policy, and Resource Limit - Module Type. |
|||||||||||||||||||||||||||||||||||||||||||||||||||||||||||||||
| Step 2 |
In the Allocate Interface tab, select the network interfaces (dedicated interfaces membership) to be allocated to the VDC. Click Next. |
|||||||||||||||||||||||||||||||||||||||||||||||||||||||||||||||
| Step 3 |
In the Allocate Resource tab, specify the resource limits for the VDC. Select the radio button and choose Select a Template from existing Templates or Create a New Resource Template. VDC resource templates describe the minimum and maximum resources that the VDC can use. If you do not specify a VDC resource template when you create a VDC, the Cisco NX-OS software uses the default template, vdc-default.
You can edit individual resource limits for a single VDC through the Cisco DCNM Web Client > Inventory > Switches > VDC. Click Next. |
|||||||||||||||||||||||||||||||||||||||||||||||||||||||||||||||
| Step 4 |
In the Authenticate tab, you can allow the Admin to configure the password and also authenticate users using AAA Server Groups. In the Admin User Area:
In the AAA Server Groups area:
Click Next. |
|||||||||||||||||||||||||||||||||||||||||||||||||||||||||||||||
| Step 5 |
In the Management Ip tab, enter IPv4 or IPv6 Address information. Click Next. |
|||||||||||||||||||||||||||||||||||||||||||||||||||||||||||||||
| Step 6 |
In the Summary tab, review the VDC configuration. Click Previous to edit any parameters. Click Deploy to configure VDC on the device. |
|||||||||||||||||||||||||||||||||||||||||||||||||||||||||||||||
| Step 7 |
In the Deploy tab, the status of the VDC deployment is displayed. A confirmation message appears. Click Know More to view the commands that are executed to deploy the VDC. Click Finish to close the VDC configuration wizard and revert to view the list of VDCs configured on the device. |
|||||||||||||||||||||||||||||||||||||||||||||||||||||||||||||||
Configuring Storage VDCs
To configure VDCs in storage mode from the Cisco DCNM Web UI, perform the following steps:
Before you begin
Create a separate storage VDC when you run FCoE on the device. Only one of the VDCs can be a storage VDC, and the default VDC cannot be configured as a storage VDC.
You can configure shared interfaces that carry both Ethernet and Fibre Channel traffic. In this specific case, the same interface belongs to more than one VDC. The shared interface is allocated to both an Ethernet and a storage VDC.
Procedure
| Step 1 |
In the General Parameter tab, specify the VDC Name, Single supervisor HA-policy, Dual supervisor HA-policy, and Resource Limit - Module Type. |
||
| Step 2 |
In the Allocate FCoE Vlan tab, select the available Ethernet Vdc from the drop-down list. The existing Ethernet VLANs range is displayed. Select None not to choose any available Ethernet VDCs. You can allocate specified FCoE VLANs to the storage VDC and specified interfaces. Click Next. |
||
| Step 3 |
In the Allocate Interface tab, add the dedicated and shared interfaces to the FCoE VDC.
You can configure shared interfaces that carry both Ethernet and Fibre Channel traffic. In this specific case, the same interface belongs to more than one VDC. FCoE VLAN and shared interface can be allocated from same Ethernet VDC. Click Next. |
||
| Step 4 |
In the Authenticate tab, you can allow the Admin to configure the password and also authenticate users using AAA Server Groups. In the Admin User Area:
In the AAA Server Groups area:
Click Next. |
||
| Step 5 |
In the Management Ip tab, enter IPv4 or IPv6 Address information. Click Next. |
||
| Step 6 |
In the Summary tab, review the VDC configuration. Click Previous to edit any parameters. Click Deploy to configure VDC on the device. |
||
| Step 7 |
In the Deploy tab, the status of the VDC deployment is displayed. A confirmation message appears. Click Know More to view the commands that are executed to deploy the VDC. Click Finish to close the VDC configuration wizard and revert to view the list of VDCs configured on the device. |
Edit VDC
To edit VDC from the Cisco DCNM Web UI, perform the following steps:
Procedure
| Step 1 |
Choose Inventory > Switches > VDC. The VDC window is displayed. |
| Step 2 |
Select the VDC radio button that you must edit. Click the Edit VDC icon. |
| Step 3 |
Modify the parameters as required. |
| Step 4 |
After you review the configuration summary on the Summary tab, click Deploy the VDC with the new configuration. |
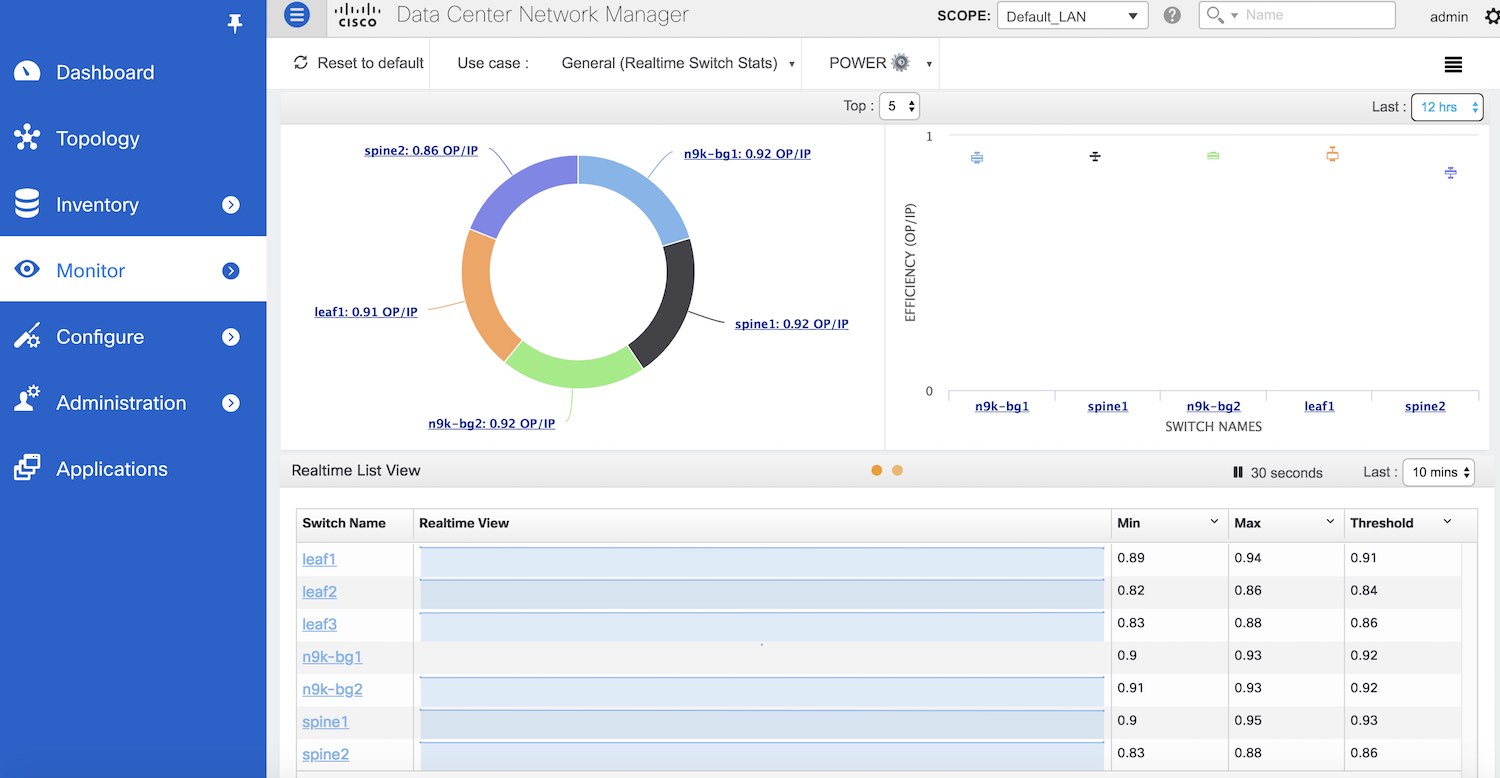
Switch On-Board Analytics
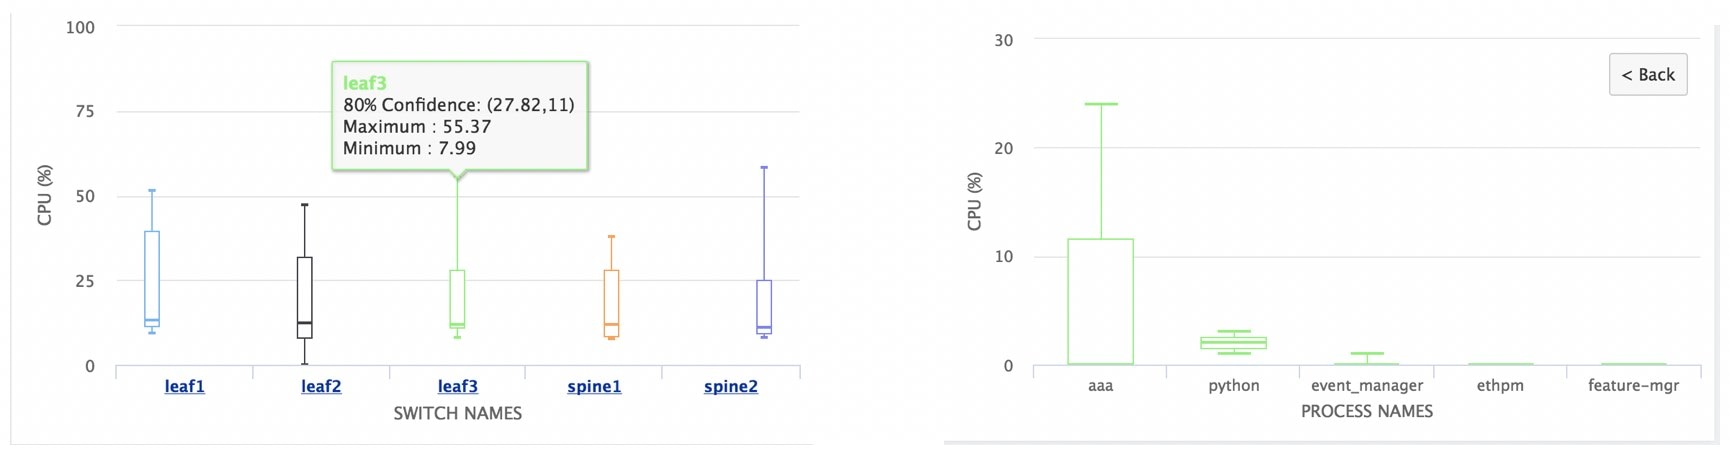
The Switch On-Board Analytics dashboard displays the following charts:
-
Top 10 Slowest Ports
-
Top 10 Slowest Target Ports
-
Top 10 Slowest Flows
-
Top 10 Slowest ITLs
-
Top 10 Port Traffic
-
Top 10 Target Ports Traffic
-
Top 10 Flow Traffic
-
Top 10 ITL Traffic
The following metrics are supported by the Switch On-Board Analytics charts:
-
Read and Write Completion Time—Time that is taken for an IO to complete successfully, that is, the time gap between IO status from a Target and IO command from an Initiator. The following metrics are supported:
-
Read Completion Time Min
-
Read Completion Time Max
-
Write Completion Time Min
-
Write Completion Time Max
The IO engine tracks the maximum and minimum IO completion time for read and write commands in the context of a switch’s port, target port, flows, initiators, and LUNs.
-
-
Read and Write Initiation Time—Time that is taken for an IO to initiate, that is, the time gap between the first response packet from a Target and IO Command from Initiator. The following metrics are supported:
-
Read Initiation Time Min
-
Read Initiation Time Max
-
Write Initiation Time Min
-
Write Initiation Time Max
The IO engine tracks the maximum and minimum IO initiation time for read and write commands in the context of a switch’s port, target port, flows, initiators, and LUNs.
-
-
Read and Write IO Bandwidth—Read and write command bandwidth observed in the context of a switch's port traffic, target port traffic, flow traffic, initiators, and LUNs. The IO bandwidth is computed at every four second time interval based on the number of bytes read or written.
-
Read and Write IO Rate—Read and write command IO rate observed in the context of a switch's port traffic, target port traffic, flow traffic, initiators, and LUNs. The IO rate is computed at every four second time interval that is based on the number of IO performed.
-
Read and Write IO Size—Read and write command IO size observed in the context of a switch's port traffic, target port traffic, flow traffic, initiators, and LUNs. The following metrics are supported:
-
Read IO Size Min
-
Read IO Size Max
-
Write IO Size Min
-
Write IO Size Max
The IO engine tracks the maximum and minimum IO size for read and write commands.
-
Viewing Switch On-Board Analytics
You can view the switch on-board analytics information from the Cisco DCNM Web UI, perform the following steps:
Procedure
| Step 1 |
Choose Inventory > View > Switches. The discovered switches are displayed. |
| Step 2 |
Click a switch name in the Device Name column. The Switch dashboard that corresponds to that switch is displayed. |
| Step 3 |
Click the Switch On-Board Analytics tab. This tab displays the Switch On-Board Analytics charts. |
Configuring Settings for the Switch On-Board Analytics Charts
Perform the following actions to configure the settings for the switch on-board analytics charts:
-
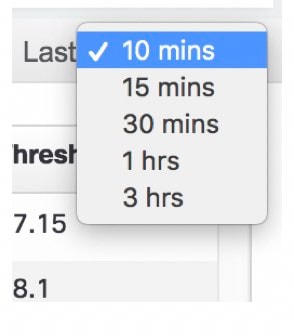
From the Show Time drop-down list, choose time to be shown in the charts. You can choose one of the following options:
-
Microseconds
-
Milliseconds
-
Seconds
By default, Microseconds is chosen.
Note
The Show Time drop-down list is applicable only for the top ten slowest ports, target ports, flows, and ITLs.
-
-
From the Show Flow From drop-down list, choose whether to show flows from a Target or from an Initiator. By default, flows from a Target are chosen.
Note
The Show Flow From drop-down list is applicable only for the charts displaying flows and ITLs.
-
From the bandwidth and size drop-down list, choose the traffic information to be shown in the charts. You can choose one of the following options:
-
Bytes
-
KB
-
MB
By default, Bytes is chosen.
-
-
Check the Single Column check box to display the charts in a single column instead of double columns.
-
Click the Refresh icon in the upper-right corner to refresh the charts.
Viewing Switch On-Board Analytics Charts
Perform the following actions to view the charts under the Switch On-Board Analytics tab:
-
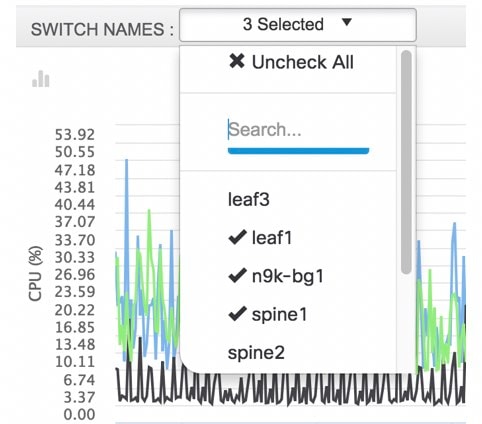
View the charts for the top ten slowest ports, target ports, flows, and ITLs by choosing one of the following variables from the drop-down list:
-
Read Completion Time—The read command completion time observed in the context of a switch’s port.
-
Write Completion Time—The write command completion time observed in the context of a switch’s port.
-
Read Initiation Time—The read command initiation time observed in the context of a switch’s port.
-
Write Initiation Time—The write command initiation time observed in the context of a switch’s port.
Note
-
By default, Read Completion Time is selected and all the units for time are in Microseconds.
-
Each chart contains a legend that provides information about the variable displayed. Each variable has a check box. Unselecting the check box removes the variable data from the chart or table.
-
-
View the charts for the top ten port traffic, target port traffic, flow traffic, and ITL traffic by choosing one of the following variables from the drop-down list:
-
Read IO Rate—The read command data observed in the context of a switch’s port.
-
Write IO Rate—The write command observed in the context of a switch’s port.
-
Read IO Size—The read command size observed in the context of a switch’s port.
-
Write IO Size—The write command size observed in the context of a switch’s port.
-
Read IO Bandwidth—The read command bandwidth observed in the context of a switch’s port.
-
Write IO Bandwidth—The write command bandwidth observed in the context of a switch’s port.
Note
-
By default, Read IO Rate is selected. The Read IO Rate is IO per second. Both Rate and Bandwidth units are per second over an 8-second range. The Size value is for the life of the switch or since the last clear command was run from the CLI.
-
The Read IO Size and Read IO Bandwidth units are in bytes per second. You can change this unit by using the Show Bandwidth and Size drop-down list. You can choose from the three options: Bytes, KB, and MB.
-
Each chart contains a legend that provides information about the variable displayed. Each variable has a check box. Unselecting the check box removes the variable data from the chart or table.
-
-
Choose the format to display information from the Show drop-down list. You can choose one of the following formats:
-
Chart
-
Table
-
Chart and Table
Note
-
To display information in the Chart and Table format, enlarge your browser window or check the Single Column check box on the upper right corner.
-
The default for Top ten Slowest Ports and Top 10 Port Traffic is Chart and Table.
-
-
Use the Chart Type drop-down list to display information in the Bar Chart or Stacked Bar Chart.
-
Use the Actions drop-down list to export information in a CSV or PDF, or print the required information.
-
To view a chart or a table in a new window, click the Detach icon on the upper-right corner of a chart or a table. After detaching a chart or table, you can view the top 25 slowest ports, target ports, flows, ITLs, or their traffic.
Viewing Inventory Information for Modules
Procedure
| Step 1 |
Choose Inventory > View > Modules. The Modules window is displayed with a list of all the switches and its details for a selected Scope. |
| Step 2 |
You can view the following information.
|
Viewing Inventory Information for Licenses
Procedure
| Step 1 |
Choose Inventory > View > Licenses. The Licenses window is displayed based on the selected Scope. |
| Step 2 |
You can view the following information.
|
 Feedback