
Note |
-
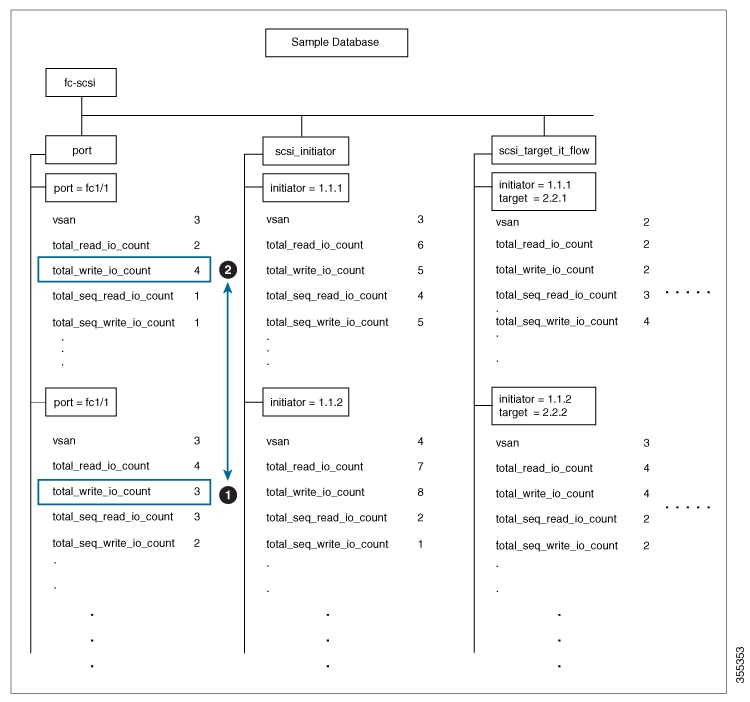
The number after “values” in the output indicates the corresponding record’s number.
-
New metrics were added in Cisco MDS NX-OS Release 8.3(1) because of which the query results may slightly differ between Cisco
MDS NX-OS Release 8.3(1) or later releases and Cisco MDS NX-OS Release 8.2(1).
|
This example shows the output of all the flow metrics of the initiator ITL flow view instance:
switch#  show analytics query 'select all from fc-scsi.scsi_initiator_itl_flow'
{ "values": {
        "1": {
                "port": "fc1/1",
                "vsan": "10",
                "app_id": "255",
                "initiator_id": "0xe80041",
                "target_id": "0xd60200",
                "lun": "0000-0000-0000-0000",
                "active_io_read_count": "0",
                "active_io_write_count": "1",
                "total_read_io_count": "0",
                "total_write_io_count": "1162370362",
                "total_seq_read_io_count": "0",
                "total_seq_write_io_count": "1",
                "total_read_io_time": "0",
                "total_write_io_time": "116204704658",
                "total_read_io_initiation_time": "0",
                "total_write_io_initiation_time": "43996934029",
                "total_read_io_bytes": "0",
                "total_write_io_bytes": "595133625344",
                "total_read_io_inter_gap_time": "0",
                "total_write_io_inter_gap_time": "41139462314556",
                "total_time_metric_based_read_io_count": "0",
                "total_time_metric_based_write_io_count": "1162370358",
                "total_time_metric_based_read_io_bytes": "0",
                "total_time_metric_based_write_io_bytes": "595133623296",
                "read_io_rate": "0",
                "peak_read_io_rate": "0",
                "write_io_rate": "7250",
                "peak_write_io_rate": "7304",
                "read_io_bandwidth": "0",
                "peak_read_io_bandwidth": "0",
                "write_io_bandwidth": "3712384",
                "peak_write_io_bandwidth": "3739904",
                "read_io_size_min": "0",
                "read_io_size_max": "0",
                "write_io_size_min": "512",
                "write_io_size_max": "512",
                "read_io_completion_time_min": "0",
                "read_io_completion_time_max": "0",
                "write_io_completion_time_min": "89",
                "write_io_completion_time_max": "416",
                "read_io_initiation_time_min": "0",
                "read_io_initiation_time_max": "0",
                "write_io_initiation_time_min": "34",
                "write_io_initiation_time_max": "116",
                "read_io_inter_gap_time_min": "0",
                "read_io_inter_gap_time_max": "0",
                "write_io_inter_gap_time_min": "31400",
                "write_io_inter_gap_time_max": "118222",
                "peak_active_io_read_count": "0",
                "peak_active_io_write_count": "5",
                "read_io_aborts": "0",
                "write_io_aborts": "0",
                "read_io_failures": "0",
                "write_io_failures": "0",
                "read_io_timeouts": "0",
                "write_io_timeouts": "1",
                "read_io_scsi_check_condition_count": "0",
                "write_io_scsi_check_condition_count": "0",
                "read_io_scsi_busy_count": "0",
                "write_io_scsi_busy_count": "0",
                "read_io_scsi_reservation_conflict_count": "0",
                "write_io_scsi_reservation_conflict_count": "0",
                "read_io_scsi_queue_full_count": "0",
                "write_io_scsi_queue_full_count": "0",
                "sampling_start_time": "1528535447",
                "sampling_end_time": "1528697457"
        },
       .
       .
       .
        "5": {
                "port": "fc1/8",
                "vsan": "10",
                "app_id": "255",
                "initiator_id": "0xe80001",
                "target_id": "0xe800a1",
                "lun": "0000-0000-0000-0000",
                "active_io_read_count": "0",
                "active_io_write_count": "1",
                "total_read_io_count": "0",
                "total_write_io_count": "1138738309",
                "total_seq_read_io_count": "0",
                "total_seq_write_io_count": "1",
                "total_read_io_time": "0",
                "total_write_io_time": "109792480881",
                "total_read_io_initiation_time": "0",
                "total_write_io_initiation_time": "39239145641",
                "total_read_io_bytes": "0",
                "total_write_io_bytes": "583034014208",
                "total_read_io_inter_gap_time": "0",
                "total_write_io_inter_gap_time": "41479779998852",
                "total_time_metric_based_read_io_count": "0",
                "total_time_metric_based_write_io_count": "1138738307",
                "total_time_metric_based_read_io_bytes": "0",
                "total_time_metric_based_write_io_bytes": "583034013184",
                "read_io_rate": "0",
                "peak_read_io_rate": "0",
                "write_io_rate": "7074",
                "peak_write_io_rate": "7903",
                "read_io_bandwidth": "0",
                "peak_read_io_bandwidth": "0",
                "write_io_bandwidth": "3622144",
                "peak_write_io_bandwidth": "4046336",
                "read_io_size_min": "0",
                "read_io_size_max": "0",
                "write_io_size_min": "512",
                "write_io_size_max": "512",
                "read_io_completion_time_min": "0",
                "read_io_completion_time_max": "0",
                "write_io_completion_time_min": "71",
                "write_io_completion_time_max": "3352",
                "read_io_initiation_time_min": "0",
                "read_io_initiation_time_max": "0",
                "write_io_initiation_time_min": "26",
                "write_io_initiation_time_max": "2427",
                "read_io_inter_gap_time_min": "0",
                "read_io_inter_gap_time_max": "0",
                "write_io_inter_gap_time_min": "25988",
                "write_io_inter_gap_time_max": "868452",
                "peak_active_io_read_count": "0",
                "peak_active_io_write_count": "5",
                "read_io_aborts": "0",
                "write_io_aborts": "0",
                "read_io_failures": "0",
                "write_io_failures": "0",
                "read_io_timeouts": "0",
                "write_io_timeouts": "1",
                "read_io_scsi_check_condition_count": "0",
                "write_io_scsi_check_condition_count": "0",
                "read_io_scsi_busy_count": "0",
                "write_io_scsi_busy_count": "0",
                "read_io_scsi_reservation_conflict_count": "0",
                "write_io_scsi_reservation_conflict_count": "0",
                "read_io_scsi_queue_full_count": "0",
                "write_io_scsi_queue_full_count": "0",
                "sampling_start_time": "1528535447",
                "sampling_end_time": "1528697457"
        }
}}
This example shows the output of requesting specific flow metrics for a specific initiator ID of an initiator ITL flow view
instance:
switch#   show analytics query 'select port,initiator_id,target_id,lun,total_read_io_count,total_write_io_count,read_io_rate,write_io_rate from fc-scsi.scsi_initiator_itl_flow where initiator_id=0xe80001'
{ "values": {
        "1": {
                "port": "fc1/8",
                "initiator_id": "0xe80001",
                "target_id": "0xe800a1",
                "lun": "0000-0000-0000-0000",
                "total_read_io_count": "0",
                "total_write_io_count": "1139010960",
                "read_io_rate": "0",
                "write_io_rate": "7071",
                "sampling_start_time": "1528535447",
                "sampling_end_time": "1528697495"
        }
}}
This example shows the output of requesting specific flow metrics for a specific initiator ID and LUN of an initiator ITL
flow view instance:
switch#   show analytics query 'select port,initiator_id,target_id,lun,total_read_io_count,total_write_io_count,read_io_rate,write_io_rate from fc-scsi.scsi_initiator_itl_flow where initiator_id=0xe80001 and lun=0000-0000-0000-0000'
{ "values": {
        "1": {
                "port": "fc1/8",
                "initiator_id": "0xe80001",
                "target_id": "0xe800a1",
                "lun": "0000-0000-0000-0000",
                "total_read_io_count": "0",
                "total_write_io_count": "1139453979",
                "read_io_rate": "0",
                "write_io_rate": "7070",
                "sampling_start_time": "1528535447",
                "sampling_end_time": "1528697559"
        }
}}
This example shows the output of specific flow metrics for a specific LUN, with the output sorted for the write_io_rate metrics
of a target ITL flow view instance:
switch#   show analytics query 'select port,initiator_id,target_id,lun,total_read_io_count,total_write_io_count,read_io_rate,write_io_rate from fc-scsi.scsi_target_itl_flow where lun=0000-0000-0000-0000 sort write_io_rate'
{ "values": {
        "1": {
                "port": "fc1/6",
                "initiator_id": "0xe80020",
                "target_id": "0xd60040",
                "lun": "0000-0000-0000-0000",
                "total_read_io_count": "0",
                "total_write_io_count": "1103394068",
                "read_io_rate": "0",
                "write_io_rate": "6882",
                "sampling_start_time": "1528535447",
                "sampling_end_time": "1528697630"
        },
        "2": {
                "port": "fc1/6",
                "initiator_id": "0xe80021",
                "target_id": "0xe80056",
                "lun": "0000-0000-0000-0000",
                "total_read_io_count": "0",
                "total_write_io_count": "1119199742",
                "read_io_rate": "0",
                "write_io_rate": "6946",
                "sampling_start_time": "1528535447",
                "sampling_end_time": "1528697630"
        },
        "3": {
                "port": "fc1/8",
                "initiator_id": "0xe80000",
                "target_id": "0xe80042",
                "lun": "0000-0000-0000-0000",
                "total_read_io_count": "0",
                "total_write_io_count": "1119506589",
                "read_io_rate": "0",
                "write_io_rate": "6948",
                "sampling_start_time": "1528535447",
                "sampling_end_time": "1528697630"
        },
        "4": {
                "port": "fc1/8",
                "initiator_id": "0xe80001",
                "target_id": "0xe800a1",
                "lun": "0000-0000-0000-0000",
                "total_read_io_count": "0",
                "total_write_io_count": "1139953183",
                "read_io_rate": "0",
                "write_io_rate": "7068",
                "sampling_start_time": "1528535447",
                "sampling_end_time": "1528697630"
        },
        "5": {
                "port": "fc1/1",
                "initiator_id": "0xe80041",
                "target_id": "0xd60200",
                "lun": "0000-0000-0000-0000",
                "total_read_io_count": "0",
                "total_write_io_count": "1163615698",
                "read_io_rate": "0",
                "write_io_rate": "7247",
                "sampling_start_time": "1528535447",
                "sampling_end_time": "1528697630"
        }
}}
This example shows the output of specific flow metrics for a specific LUN, with the output limited to three records and sorted
for the write_io_rate metrics of an initiator ITL flow view instance:
switch#   show analytics query 'select port,initiator_id,target_id,lun,total_read_io_count,total_write_io_count,read_io_rate,write_io_rate from fc-scsi.scsi_initiator_itl_flow where lun=0000-0000-0000-0000 sort write_io_rate limit 3'
{ "values": {
        "1": {
                "port": "fc1/6",
                "initiator_id": "0xe80020",
                "target_id": "0xd60040",
                "lun": "0000-0000-0000-0000",
                "total_read_io_count": "0",
                "total_write_io_count": "1103901828",
                "read_io_rate": "0",
                "write_io_rate": "6885",
                "sampling_start_time": "1528535447",
                "sampling_end_time": "1528697704"
        },
        "2": {
                "port": "fc1/8",
                "initiator_id": "0xe80000",
                "target_id": "0xe80042",
                "lun": "0000-0000-0000-0000",
                "total_read_io_count": "0",
                "total_write_io_count": "1120018575",
                "read_io_rate": "0",
                "write_io_rate": "6940",
                "sampling_start_time": "1528535447",
                "sampling_end_time": "1528697704"
        },
        "3": {
                "port": "fc1/6",
                "initiator_id": "0xe80021",
                "target_id": "0xe80056",
                "lun": "0000-0000-0000-0000",
                "total_read_io_count": "0",
                "total_write_io_count": "1119711583",
                "read_io_rate": "0",
                "write_io_rate": "6942",
                "sampling_start_time": "1528535447",
                "sampling_end_time": "1528697704"
        }
}}
This example shows the output of specific flow metrics for a specific LUN and target ID of an initiator ITL flow view instance:
switch#   show analytics query 'select port,initiator_id,target_id,lun,total_read_io_count,total_write_io_count,read_io_rate,write_io_rate from fc-scsi.scsi_initiator_itl_flow where lun=0000-0000-0000-0000 and target_id=0xe800a1'
{ "values": {
        "1": {
                "port": "fc1/8",
                "initiator_id": "0xe80001",
                "target_id": "0xe800a1",
                "lun": "0000-0000-0000-0000",
                "total_read_io_count": "0",
                "total_write_io_count": "1139010960",
                "read_io_rate": "0",
                "write_io_rate": "7071"
                "sampling_start_time": "1528535447",
                "sampling_end_time": "1528697495"
        }
}}
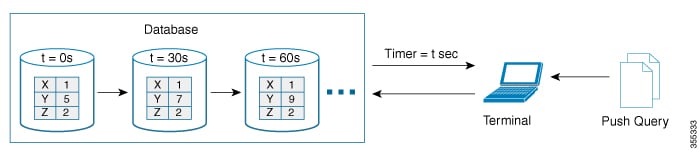
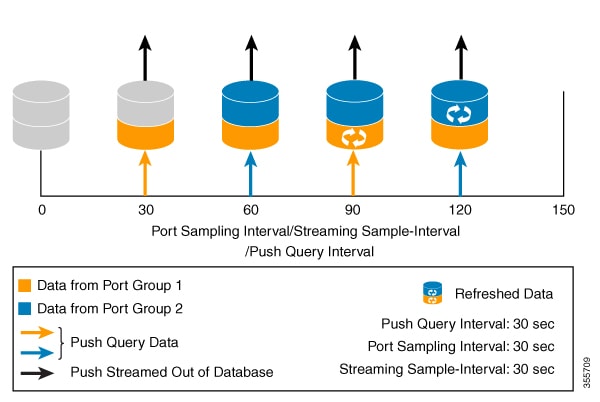
This example shows how to configure a push query when the duration to refresh the flow metrics is set to the default duration
of 30 seconds:
switch# configure terminal
switch(config)# analytics query 'select all from fc-scsi.scsi_initiator_itl_flow' name initiator_itl_flow type periodic
switch(config)# show analytics query name initiator_itl_flow result
{ "values": {
        "1": {
                "port": "fc1/1",
                "vsan": "10",
                "app_id": "255",
                "initiator_id": "0xe80041",
                "target_id": "0xd60200",
                "lun": "0000-0000-0000-0000",
                "active_io_read_count": "0",
                "active_io_write_count": "1",
                "total_read_io_count": "0",
                "total_write_io_count": "1162370362",
                "total_seq_read_io_count": "0",
                "total_seq_write_io_count": "1",
                "total_read_io_time": "0",
                "total_write_io_time": "116204704658",
                "total_read_io_initiation_time": "0",
                "total_write_io_initiation_time": "43996934029",
                "total_read_io_bytes": "0",
                "total_write_io_bytes": "595133625344",
                "total_read_io_inter_gap_time": "0",
                "total_write_io_inter_gap_time": "41139462314556",
                "total_time_metric_based_read_io_count": "0",
                "total_time_metric_based_write_io_count": "1162370358",
                "total_time_metric_based_read_io_bytes": "0",
                "total_time_metric_based_write_io_bytes": "595133623296",
                "read_io_rate": "0",
                "peak_read_io_rate": "0",
                "write_io_rate": "7250",
                "peak_write_io_rate": "7304",
                "read_io_bandwidth": "0",
                "peak_read_io_bandwidth": "0",
                "write_io_bandwidth": "3712384",
                "peak_write_io_bandwidth": "3739904",
                "read_io_size_min": "0",
                "read_io_size_max": "0",
                "write_io_size_min": "512",
                "write_io_size_max": "512",
                "read_io_completion_time_min": "0",
                "read_io_completion_time_max": "0",
                "write_io_completion_time_min": "89",
                "write_io_completion_time_max": "416",
                "read_io_initiation_time_min": "0",
                "read_io_initiation_time_max": "0",
                "write_io_initiation_time_min": "34",
                "write_io_initiation_time_max": "116",
                "read_io_inter_gap_time_min": "0",
                "read_io_inter_gap_time_max": "0",
                "write_io_inter_gap_time_min": "31400",
                "write_io_inter_gap_time_max": "118222",
                "peak_active_io_read_count": "0",
                "peak_active_io_write_count": "5",
                "read_io_aborts": "0",
                "write_io_aborts": "0",
                "read_io_failures": "0",
                "write_io_failures": "0",
                "read_io_timeouts": "0",
                "write_io_timeouts": "1",
                "read_io_scsi_check_condition_count": "0",
                "write_io_scsi_check_condition_count": "0",
                "read_io_scsi_busy_count": "0",
                "write_io_scsi_busy_count": "0",
                "read_io_scsi_reservation_conflict_count": "0",
                "write_io_scsi_reservation_conflict_count": "0",
                "read_io_scsi_queue_full_count": "0",
                "write_io_scsi_queue_full_count": "0",
                "sampling_start_time": "1528535447",
                "sampling_end_time": "1528697457"
        },
        .
        .
        .
        "5": {
                "port": "fc1/8",
                "vsan": "10",
                "app_id": "255",
                "initiator_id": "0xe80001",
                "target_id": "0xe800a1",
                "lun": "0000-0000-0000-0000",
                "active_io_read_count": "0",
                "active_io_write_count": "1",
                "total_read_io_count": "0",
                "total_write_io_count": "1138738309",
                "total_seq_read_io_count": "0",
                "total_seq_write_io_count": "1",
                "total_read_io_time": "0",
                "total_write_io_time": "109792480881",
                "total_read_io_initiation_time": "0",
                "total_write_io_initiation_time": "39239145641",
                "total_read_io_bytes": "0",
                "total_write_io_bytes": "583034014208",
                "total_read_io_inter_gap_time": "0",
                "total_write_io_inter_gap_time": "41479779998852",
                "total_time_metric_based_read_io_count": "0",
                "total_time_metric_based_write_io_count": "1138738307",
                "total_time_metric_based_read_io_bytes": "0",
                "total_time_metric_based_write_io_bytes": "583034013184",
                "read_io_rate": "0",
                "peak_read_io_rate": "0",
                "write_io_rate": "7074",
                "peak_write_io_rate": "7903",
                "read_io_bandwidth": "0",
                "peak_read_io_bandwidth": "0",
                "write_io_bandwidth": "3622144",
                "peak_write_io_bandwidth": "4046336",
                "read_io_size_min": "0",
                "read_io_size_max": "0",
                "write_io_size_min": "512",
                "write_io_size_max": "512",
                "read_io_completion_time_min": "0",
                "read_io_completion_time_max": "0",
                "write_io_completion_time_min": "71",
                "write_io_completion_time_max": "3352",
                "read_io_initiation_time_min": "0",
                "read_io_initiation_time_max": "0",
                "write_io_initiation_time_min": "26",
                "write_io_initiation_time_max": "2427",
                "read_io_inter_gap_time_min": "0",
                "read_io_inter_gap_time_max": "0",
                "write_io_inter_gap_time_min": "25988",
                "write_io_inter_gap_time_max": "868452",
                "peak_active_io_read_count": "0",
                "peak_active_io_write_count": "5",
                "read_io_aborts": "0",
                "write_io_aborts": "0",
                "read_io_failures": "0",
                "write_io_failures": "0",
                "read_io_timeouts": "0",
                "write_io_timeouts": "1",
                "read_io_scsi_check_condition_count": "0",
                "write_io_scsi_check_condition_count": "0",
                "read_io_scsi_busy_count": "0",
                "write_io_scsi_busy_count": "0",
                "read_io_scsi_reservation_conflict_count": "0",
                "write_io_scsi_reservation_conflict_count": "0",
                "read_io_scsi_queue_full_count": "0",
                "write_io_scsi_queue_full_count": "0",
                "sampling_start_time": "1528535447",
                "sampling_end_time": "1528697457"
        }
}}
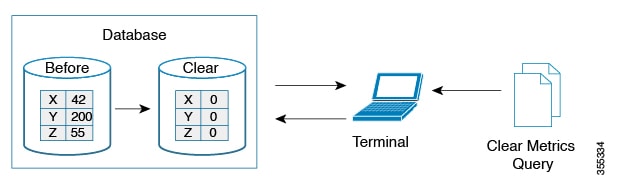
This example shows how to clear all the minimum, maximum, and peak flow metrics:
-
This example show the output before clearing the all the minimum, maximum, and peak flow metrics:
Note |
You must execute the clear command twice for the first time for clearing all the minimum, maximum, and peak flow metrics.
Thereafter, you can execute the clear command once for clearing the flow metrics.
|
switch# show analytics query "select all from  fc-scsi.scsi_target_itl_flow where port=fc1/17" clear
{ "values": {
        "1": {
                "port": "fc1/17",
                "vsan": "1",
                "app_id": "255",
                "target_id": "0xef0040",
                "initiator_id": "0xef0000",
                "lun": "0000-0000-0000-0000",
                "active_io_read_count": "0",
                "active_io_write_count": "1",
                "total_read_io_count": "0",
                "total_write_io_count": "84701",
                "total_seq_read_io_count": "0",
                "total_seq_write_io_count": "1",
                "total_read_io_time": "0",
                "total_write_io_time": "7007132",
                "total_read_io_initiation_time": "0",
                "total_write_io_initiation_time": "2421756",
                "total_read_io_bytes": "0",
                "total_write_io_bytes": "86733824",
                "total_read_io_inter_gap_time": "0",
                "total_write_io_inter_gap_time": "2508109021",
                "total_time_metric_based_read_io_count": "0",
                "total_time_metric_based_write_io_count": "84701",
                "total_time_metric_based_read_io_bytes": "0",
                "total_time_metric_based_write_io_bytes": "86733824",
                "read_io_rate": "0",
                "peak_read_io_rate": "0",
                "write_io_rate": "8711",
                "peak_write_io_rate": "8711",
                "read_io_bandwidth": "0",
                "peak_read_io_bandwidth": "0",
                "write_io_bandwidth": "8920576",
                "peak_write_io_bandwidth": "8920576",
                "read_io_size_min": "0",
                "read_io_size_max": "0",
                "write_io_size_min": "1024",
                "write_io_size_max": "1024",
                "read_io_completion_time_min": "0",
                "read_io_completion_time_max": "0",
                "write_io_completion_time_min": "74",
                "write_io_completion_time_max": "844",
                "read_io_initiation_time_min": "0",
                "read_io_initiation_time_max": "0",
                "write_io_initiation_time_min": "24",
                "write_io_initiation_time_max": "775",
                "read_io_inter_gap_time_min": "0",
                "read_io_inter_gap_time_max": "0",
                "write_io_inter_gap_time_min": "26903",
                "write_io_inter_gap_time_max": "287888",
                "peak_active_io_read_count": "0",
                "peak_active_io_write_count": "3",
                "read_io_aborts": "0",
                "write_io_aborts": "0",
                "read_io_failures": "0",
                "write_io_failures": "0",
                "read_io_timeouts": "0",
                "write_io_timeouts": "0",
                "read_io_scsi_check_condition_count": "0",
                "write_io_scsi_check_condition_count": "0",
                "read_io_scsi_busy_count": "0",
                "write_io_scsi_busy_count": "0",
                "read_io_scsi_reservation_conflict_count": "0",
                "write_io_scsi_reservation_conflict_count": "0",
                "read_io_scsi_queue_full_count": "0",
                "write_io_scsi_queue_full_count": "0",
                "sampling_start_time": "1530683133",
                "sampling_end_time": "1530684301"
        },
}}
-
This examples shows the output after clearing all the minimum, maximum, and peak flow metrics. The metrics that were cleared
are highlighted in the output.
switch# show analytics query "select all from  fc-scsi.scsi_target_itl_flow where port=fc1/17" clear
{ "values": {
        "1": {
                "port": "fc1/17",
               "vsan": "1",
                "app_id": "255",
                "target_id": "0xef0040",
                "initiator_id": "0xef0000",
                "lun": "0000-0000-0000-0000",
                "active_io_read_count": "0",
                "active_io_write_count": "0",
                "total_read_io_count": "0",
                "total_write_io_count": "800615",
                "total_seq_read_io_count": "0",
                "total_seq_write_io_count": "1",
                "total_read_io_time": "0",
                "total_write_io_time": "66090290",
                "total_read_io_initiation_time": "0",
                "total_write_io_initiation_time": "22793874",
                "total_read_io_bytes": "0",
                "total_write_io_bytes": "819829760",
                "total_read_io_inter_gap_time": "0",
                "total_write_io_inter_gap_time": "23702347887",
                "total_time_metric_based_read_io_count": "0",
                "total_time_metric_based_write_io_count": "800615",
                "total_time_metric_based_read_io_bytes": "0",
                "total_time_metric_based_write_io_bytes": "819829760",
                "read_io_rate": "0",
                "peak_read_io_rate": "0",
                "write_io_rate": "0",
                "peak_write_io_rate": "0",
                "read_io_bandwidth": "0",
                "peak_read_io_bandwidth": "0",
                "write_io_bandwidth": "0",
                "peak_write_io_bandwidth": "0",
                "read_io_size_min": "0",
                "read_io_size_max": "0",
                "write_io_size_min": "0",
                "write_io_size_max": "0",
                "read_io_completion_time_min": "0",
                "read_io_completion_time_max": "0",
                "write_io_completion_time_min": "0",
                "write_io_completion_time_max": "0",
                "read_io_initiation_time_min": "0",
                "read_io_initiation_time_max": "0",
                "write_io_initiation_time_min": "0",
                "write_io_initiation_time_max": "0",
                "read_io_inter_gap_time_min": "0",
                "read_io_inter_gap_time_max": "0",
                "write_io_inter_gap_time_min": "0",
                "write_io_inter_gap_time_max": "0",
                "peak_active_io_read_count": "0",
                "peak_active_io_write_count": "0",
                "read_io_aborts": "0",
                "write_io_aborts": "0",
                "read_io_failures": "0",
                "write_io_failures": "0",
                "read_io_timeouts": "0",
                "write_io_timeouts": "0",
                "read_io_scsi_check_condition_count": "0",
                "write_io_scsi_check_condition_count": "0",
                "read_io_scsi_busy_count": "0",
                "write_io_scsi_busy_count": "0",
                "read_io_scsi_reservation_conflict_count": "0",
                "write_io_scsi_reservation_conflict_count": "0",
                "read_io_scsi_queue_full_count": "0",
                "write_io_scsi_queue_full_count": "0",
                "sampling_start_time": "1530683133",
                "sampling_end_time": "1530684428"
        },
}}
These examples show how to stream only the ITL flow metrics that have changed between streaming intervals:
-
This example shows the output before using the differential option:
switch# show analytics query "select port, target_id, initiator_id,lun,total_write_io_count from fc-scsi.scsi_target_itl_flow where port=fc1/17" differential
{ "values": {
        "1": {
                "port": "fc1/17",
                "target_id": "0xef0040",
               "initiator_id": "0xef0000",
                "lun": "0001-0000-0000-0000",
                "total_write_io_count": "1515601",
                "sampling_start_time": "1530683133",
                "sampling_end_time": "1530683484"
        },
        "2": {
                "port": "fc1/17",
                "target_id": "0xef0040",
                "initiator_id": "0xef0020",
                "lun": "0000-0000-0000-0000",
                "total_write_io_count": "1515601",
                "sampling_start_time": "1530683133",
                "sampling_end_time": "1530683484"
        },
        "3": {
                "port": "fc1/17",
                "target_id": "0xef0040",
                "initiator_id": "0xef0020",
                "lun": "0001-0000-0000-0000",
                "total_write_io_count": "1515600",
                "sampling_start_time": "1530683133",
                "sampling_end_time": "1530683484"
        },
        "4": {
                "port": "fc1/17",
                "target_id": "0xef0040",
                "initiator_id": "0xef0000",
                "lun": "0000-0000-0000-0000",
                "total_write_io_count": "1515600",
                "sampling_start_time": "1530683133",
                "sampling_end_time": "1530683484"
        }
}}
-
This example shows the output with the differential option and shows only the records that have changed:
switch# show analytics query "select port, target_id, initiator_id,lun,total_write_io_count from fc-scsi.scsi_target_itl_flow where port=fc1/17" differential
{ "values": {
       "1": {
                "port": "fc1/17",
                "target_id": "0xef0040",
                "initiator_id": "0xef0000",
                "lun": "0001-0000-0000-0000",
                "total_write_io_count": "1892021",
                "sampling_start_time": "1530683133",
                "sampling_end_time": "1530683534"
        },
        "2": {
                "port": "fc1/17",
                "target_id": "0xef0040",
                "initiator_id": "0xef0020",
                "lun": "0000-0000-0000-0000",
                "total_write_io_count": "1892021",
                "sampling_start_time": "1530683133",
                "sampling_end_time": "1530683534"
        },
        "3": {
                "port": "fc1/17",
                "target_id": "0xef0040",
                "initiator_id": "0xef0000",
                "lun": "0000-0000-0000-0000",
                "total_write_io_count": "1892021",
                "sampling_start_time": "1530683133",
                "sampling_end_time": "1530683534"
        }
}}
This example shows how to remove an installed query name:
switch(config)# no analytics name initiator_itl_flow
These examples show how to clear flow metrics:
-
This example show the output before clearing flow metrics:
switch# show analytics query "select port,target_id,total_write_io_count,
total_write_io_bytes,total_time_metric_based_write_io_count,write_io_rate,
peak_write_io_rate,write_io_bandwidth,peak_write_io_bandwidth,
write_io_size_min,write_io_size_max,write_io_completion_time_min,
write_io_completion_time_max,write_io_initiation_time_min,
write_io_initiation_time_max,write_io_inter_gap_time_min,write_io_inter_gap_time_max
from fc-scsi.scsi_target where
target_id=0x650060"
{ "values": {
        "1": {
                "port": "fc3/17",
                "target_id": "0x650060",
                "total_write_io_count": "67350021",
                "total_write_io_bytes": "17655403905024",
                "total_time_metric_based_write_io_count": "67349761",
                "write_io_rate": "0",
                "peak_write_io_rate": "6300",
                "write_io_bandwidth": "0",
                "peak_write_io_bandwidth": "1651572736",
                "write_io_size_min": "262144",
                "write_io_size_max": "262144",
               "write_io_completion_time_min": "192",
                "write_io_completion_time_max": "9434",
                "write_io_initiation_time_min": "21",
                "write_io_initiation_time_max": "199",
                "write_io_inter_gap_time_min": "2553",
                "write_io_inter_gap_time_max": "358500",
                "sampling_start_time": "1531204359",
                "sampling_end_time": "1531215327"
        }
-
This example shows how to clear flow metrics:
Note |
Clearing metrics is allowed only on view instances and not on individual flow metrics.
|
switch# clear analytics query "select all from fc-scsi.scsi_target where target_id=0x650060"
-
This example shows the output after clearing flow metrics:
switch# show analytics query "select port,target_id,total_write_io_count,
total_write_io_bytes,total_time_metric_based_write_io_count,write_io_rate,
peak_write_io_rate,write_io_bandwidth,peak_write_io_bandwidth,
write_io_size_min,write_io_size_max,write_io_completion_time_min,
write_io_completion_time_max,write_io_initiation_time_min,
write_io_initiation_time_max,write_io_inter_gap_time_min,write_io_inter_gap_time_max
from fc-scsi.scsi_target where target_id=0x650060"
{ "values": {
        "1": {
                "port": "fc3/17",
                "target_id": "0x650060",
                "total_write_io_count": "0",
                "total_write_io_bytes": "0",
                "total_time_metric_based_write_io_count": "0",
                "write_io_rate": "0",
                "peak_write_io_rate": "0",
                "write_io_bandwidth": "0",
                "peak_write_io_bandwidth": "0",
                "write_io_size_min": "0",
                "write_io_size_max": "0",
                "write_io_completion_time_min": "0",
                "write_io_completion_time_max": "0",
                "write_io_initiation_time_min": "0",
                "write_io_initiation_time_max": "0",
                "write_io_inter_gap_time_min": "0",
                "write_io_inter_gap_time_max": "0",
                "sampling_start_time": "1531204359",
                "sampling_end_time": "1531215464"
        }
This example shows the output after purging the flow metrics:
Note |
Only the port key value is allowed with the where clause for purging metrics.
|
switch# purge analytics query "select all from fc-scsi.scsi_target where port=fc3/17"
switch# show analytics query "select all from fc-scsi.scsi_target where port=fc3/17"
Table is empty for query "select all from fc-scsi.scsi_target where port=fc3/17"


 Feedback