Monitoring

This chapter contains the following sections:

Faults, Errors, Events, Audit Logs


Note


For information about faults, events, errors, and system messages, see the Cisco APIC Faults, Events, and System Messages Management Guide and the Cisco APIC Management Information Model Reference, a Web-based application.

The APIC maintains a comprehensive, current run-time representation of the administrative and operational state of the ACI Fabric system in the form of a collection of MOs. The system generates faults, errors, events, and audit log data according to the run-time state of the system and the policies that the system and user create to manage these processes.

The APIC GUI enables you to create customized "historical record groups" of fabric switches, to which you can then assign customized switch policies that specify customized size and retention periods for the audit logs, event logs, health logs, and fault logs maintained for the switches in those groups.

The APIC GUI also enables you to customize a global controller policy that specifies size and retention periods for the audit logs, event logs, health logs, and fault logs maintained for the controllers on this fabric.

Faults

Based on the run-time state of the system, the APIC automatically detects anomalies and creates fault objects to represent them. Fault objects contain various properties that are meant to help users diagnose the issue, assess its impact and provide a remedy.
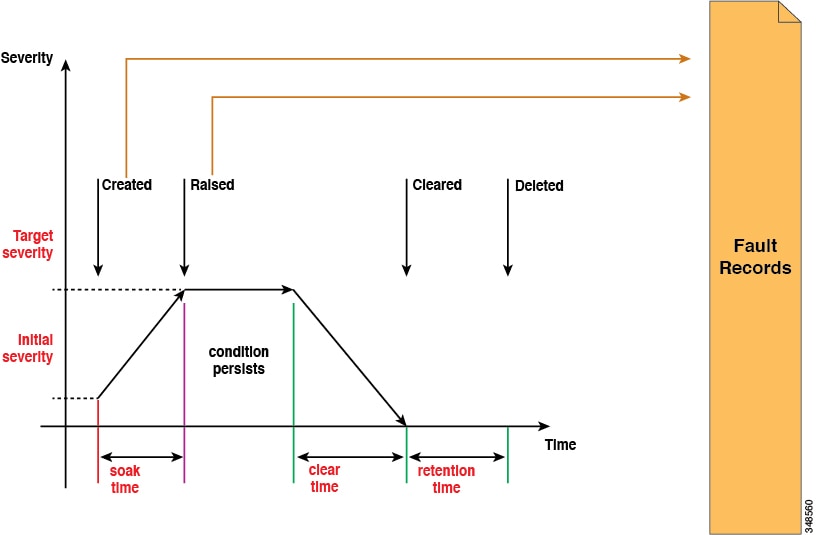
For example, if the system detects a problem associated with a port, such as a high parity-error rate, a fault object is automatically created and placed in the management information tree (MIT) as a child of the port object. If the same condition is detected multiple times, no additional instances of the fault object are created. After the condition that triggered the fault is remedied, the fault object is preserved for a period of time specified in a fault life-cycle policy and is finally deleted. See the following figure.
Figure 1. Fault Life Cycle


A life cycle represents the current state of the issue. It starts in the soak time when the issue is first detected, and it changes to raised and remains in that state if the issue is still present. When the condition is cleared, it moves to a state called "raised-clearing" in which the condition is still considered as potentially present. Then it moves to a "clearing time" and finally to "retaining". At this point, the issue is considered to be resolved and the fault object is retained only to provide the user visibility into recently resolved issues.

Each time that a life-cycle transition occurs, the system automatically creates a fault record object to log it. Fault records are never modified after they are created and they are deleted only when their number exceeds the maximum value specified in the fault retention policy.

The severity is an estimate of the impact of the condition on the capability of the system to provide service. Possible values are warning, minor, major and critical. A fault with a severity equal to warning indicates a potential issue (including, for example, an incomplete or inconsistent configuration) that is not currently affecting any deployed service. Minor and major faults indicate that there is potential degradation in the service being provided. Critical means that a major outage is severely degrading a service or impairing it altogether. Description contains a human-readable description of the issue that is meant to provide additional information and help in troubleshooting.

Events

Event records are objects that are created by the system to log the occurrence of a specific condition that might be of interest to the user. They contain the fully qualified domain name (FQDN) of the affected object, a timestamp and a description of the condition. Examples include link-state transitions, starting and stopping of protocols, and detection of new hardware components. Event records are never modified after creation and are deleted only when their number exceeds the maximum value specified in the event retention policy.
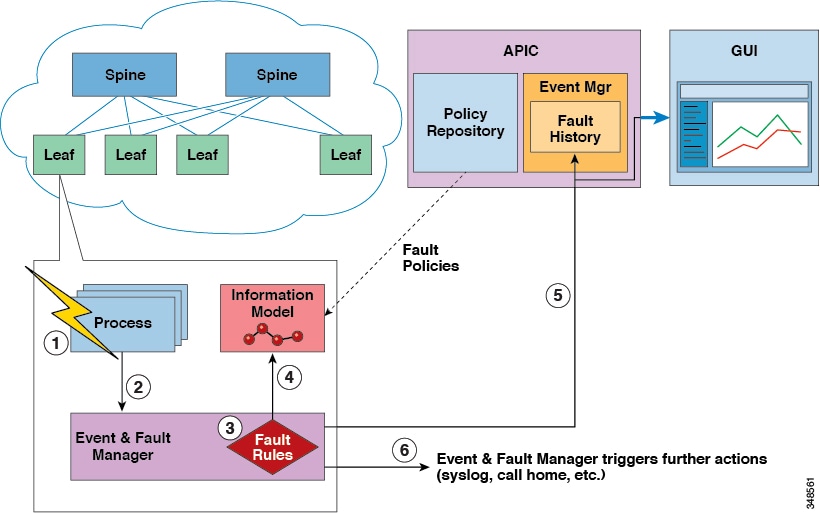
The following figure shows the process for fault and events reporting.
Figure 2. Faults and Events Reporting/Export


  1. Process detects a faulty condition.

  2. Process notifies Event and Fault Manager.

  3. Event and Fault Manager processes the notification according to the fault rules.

  4. Event and Fault Manager creates a fault Instance in the MIM and manages its life cycle according to the fault policy.

  5. Event and Fault Manager notifies the APIC and connected clients of the state transitions.

  6. Event and Fault Manager triggers further actions (such as syslog or call home).

Errors

APIC error messages typically display in the APIC GUI and the APIC CLI. These error messages are specific to the action that a user is performing or the object that a user is configuring or administering. These messages can be the following:

  • Informational messages that provide assistance and tips about the action being performed

  • Warning messages that provide information about system errors related to an object, such as a user account or service profile, that the user is configuring or administering

  • Finite state machine (FSM) status messages that provide information about the status of an FSM stage

Many error messages contain one or more variables. The information that the APIC uses to replace these variables depends upon the context of the message. Some messages can be generated by more than one type of error.

Audit Logs

Audit records are objects that are created by the system to log user-initiated actions, such as login/logout and configuration changes. They contain the name of the user who is performing the action, a timestamp, a description of the action and, if applicable, the FQDN of the affected object. Audit records are never modified after creation and are deleted only when their number exceeds the maximum value specified in the audit retention policy.
Statistics Properties, Tiers, Thresholds, and Monitoring

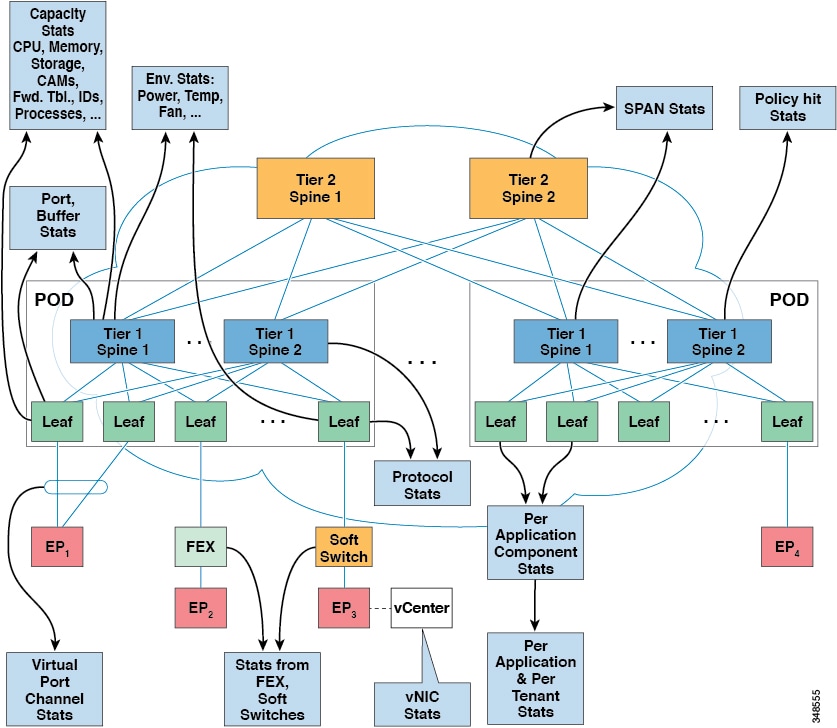
Statistics enable trend analysis and troubleshooting. Statistics gathering can be configured for ongoing or on-demand collection. Statistics provide real-time measures of observed objects. Statistics can be collected in cumulative counters and gauges.

Figure 3. Various Sources of Statistics


Policies define what statistics are gathered, at what intervals, and what actions to take. For example, a policy could raise a fault on an EPG if a threshold of dropped packets on an ingress VLAN is greater than 1000 per second.

Statistics data are gathered from a variety of sources, including interfaces, VLANs, EPGs, application profiles, ACL rules, tenants, or internal Cisco Application Policy Infrastructure Controller (APIC) processes. Statistics accumulate data in 5-minute, 15-minute, 1-hour, 1-day, 1-week, 1-month, 1-quarter, or 1-year sampling intervals. Shorter duration intervals feed longer intervals.

A variety of statistics properties are available, including last value, cumulative, periodic, rate of change, trend, maximum, minimum, average. Collection and retention times are configurable. Policies can specify if the statistics are to be gathered from the current state of the system or to be accumulated historically or both. For example, a policy can specify that historical statistics be gathered for 5-minute intervals over a period of 1 hour. The 1 hour is a moving window. Once an hour has elapsed, the incoming 5 minutes of statistics are added, and the earliest 5 minutes of data are abandoned.


Note


The maximum number of 5-minute granularity sample records is limited to 12 samples in releases earlier than 3.1 and 3 samples in the 3.1 releases with one hour of statistics in any of these releases. All other sample intervals are limited to 1,000 sample records. For example, hourly granularity statistics can be maintained for up to 41 days. Statistics will not be maintained for longer than these limits. To gather statistics for longer durations, create an export policy.

About Statistics Data

The following types of managed objects (MOs) are associated with statistics data that is collected by the observer module:

  • History data

  • Current data

The MO names corresponding to these objects start with a two-letter prefix: HD or CD. HD indicates history data while CD indicates current data. For example, "CDl2IngrBytesAg15min." The MO name is also an indicator of the time interval for which the data is collected. For example, "CDl2IngrBytesAg15min" indicates that the MO corresponds to 15-minute intervals.

A CD object holds currently running data, and the values that the object holds change as time passes. However, at the end of a given time interval, the data collected in a CD object is copied to an HD object and the CD object attributes are reset to 0. For example, at the end of a given 15-minute interval, the data in the CDl2IngrBytesAg15min object is moved to the HDl2IngrBytesAg15min object and the CDl2IngrBytesAg15min object is reset.

If a CD...15min object data is closely observed for more than 15 minutes, you can notice that the value goes to 0, then gets incremented twice and goes to 0 again. This is because the values are getting updated every 5 minutes. The third update (at the end of 15 minutes) goes unnoticed, as the data was rolled up to the HD object and the CD object was reset as soon as that update occurred.

CD...15min objects are updated every 5 minutes and CD...5min objects are updated every 10 seconds. CD...15min objects are rolled up as HD...15min objects and CD...5min are rolled up as HD...5min objects.

The data that any CD object holds is dynamic and for all practical purposes it must be considered to be internal data. HD data objects can be used for any further analytical purposes and can be considered to be published or static data.

The HD objects are also rolled up as time passes. For example, three consecutive HD...5min data objects contribute to one HD...15min object. The length of time that one HD...5min object resides in the system is decided by the statistic collection policies.

Configuring Monitoring Policies

Administrators can create monitoring policies with the following four broad scopes:

  • Fabric Wide: includes both fabric and access objects

  • Access (also known as infrastructure): access ports, FEX, VM controllers, and so on

  • Fabric: fabric ports, cards, chassis, fans, and so on

  • Tenant: EPGs, application profiles, services, and so on

The Cisco Application Policy Infrastructure Controller (APIC) includes the following four classes of default monitoring policies:

  • monCommonPol (uni/fabric/moncommon): applies to all fabric, access, and tenant hierarchies

  • monFabricPol (uni/fabric/monfab-default): applies to fabric hierarchies

  • monInfraPol (uni/infra/monifra-default): applies to the access infrastructure hierarchy

  • monEPGPol (uni/tn-common/monepg-default): applies to tenant hierarchies

In each of the four classes of monitoring policies, the default policy can be overridden by a specific policy. For example, a monitoring policy applied to the Solar tenant (tn-solar) would override the default one for the Solar tenant while other tenants would still be monitored by the default policy.

Each of the four objects in the figure below contains monitoring targets.

Figure 4. Four Classes of Default Monitoring Policies


The Infra monitoring policy contains monInfra targets, the fabric monitoring policy contains monFab targets, and the tenant monitoring policy contains monEPG targets. Each of the targets represent the corresponding class of objects in this hierarchy. For example, under the monInfra-default monitoring policy, there is a target representing FEX fabric-facing ports. The policy details regarding how to monitor these FEX fabric-facing ports are contained in this target. Only policies applicable to a target are allowed under that target. Note that not all possible targets are auto-created by default. The administrator can add more targets under a policy if the target is not there.

The common monitoring policy (monCommonPol) has global fabric-wide scope and is automatically deployed on all nodes in the fabric, including the Cisco APICs. Any source (such as syslog, callhome, or SNMP) located under the common monitoring policy captures all faults, events, audits and health occurrences. The single common monitoring policy monitors the whole fabric. The threshold of the severity for syslog and snmp or urgency for callhome can be configured according to the level of detail that a fabric administrator determines is appropriate.

Multiple monitoring policies can be used to monitor individual parts of the fabric independently. For example, a source under the global monitoring policy reflects a global view. Another source under a custom monitoring policy deployed only to some nodes could closely monitor their power supplies. Or, specific fault or event occurrences for different tenants could be redirected to n.jpgy specific operators.

Sources located under other monitoring policies capture faults, events and audits within a smaller scope. A source located directly under a monitoring policy, captures all occurrences within the scope (for example fabric or infra). A source located under a target, captures all occurrences related to that target (for example, eqpt:Psu for power supply). A source located under a fault/event severity assignment policy captures only the occurrences that match that particular fault or event as ide.jpgied by the fault/event code.

When a fault/event/audit is generated, all applicable sources are used. For example, consider the following configuration:

  • Syslog source 4, pointing to syslog group 4 is defined for fault F0123.

  • Syslog source 3, pointing to syslog group 3 is defined for target power supply (eqpt:Psu).

  • Syslog source 2, pointing to syslog group 2 is defined for scope infra.

  • Syslog source 1, pointing to syslog group 1 is defined for the common monitoring policy.

If fault F0123 occurs on an MO of class eqpt:Psu in scope infra, a syslog message is sent to all the destinations in syslog groups 1-4, assuming the severity of the message is at or above the minimum defined for each source and destination. While this example illustrates a syslog configuration, callhome and SNMP configurations would operate in the same way.

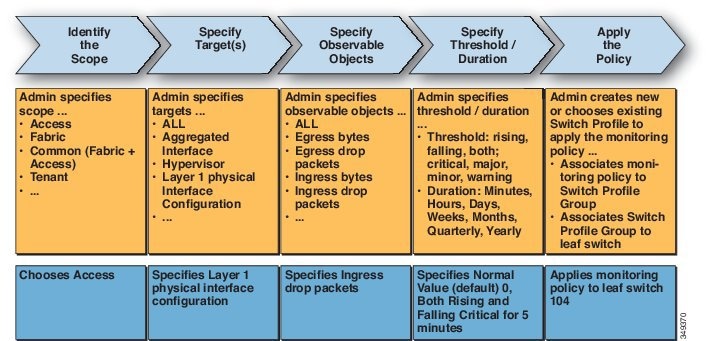
The following figure shows how the process works for configuring a fabric monitoring policy for statistics.

Figure 5. Workflow for Configuring an Access Monitoring Policy

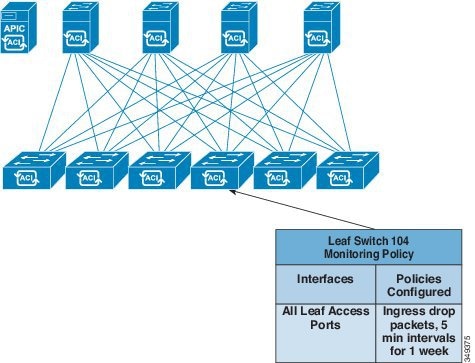
The Cisco APIC applies this monitoring policy as shown in the following figure:

Figure 6. Result of Sample Access Monitoring Policy


Monitoring policies can also be configured for other system operations, such as faults or health scores. The structure of monitoring policies map to this hierarchy:

Monitoring Policy

  • Statistics Export

  • Collection Rules

  • Monitoring Targets

    • Statistics Export

    • Collection Rules

    • Statistics

      • Collection Rules

      • Thresholds Rules

      • Statistics Export

Statistics Export policies option in the following figure define the format and destination for statistics to be exported. The output can be exported using the FTP, HTTP, or SCP protocols. The format can be JSON or XML. The user or administrator can also choose to compress the output. Export can be defined under Statistics, Monitoring Targets, or under the top-level monitoring policy. The higher-level definition of Statistics Export takes precedence unless there is a defined lower-level policy.

Monitoring policies are applied to specific observable objects (such as ports, cards, EPGs, and tenants) or groups of observable objects by using selectors or relations. Monitoring policies define the following things:

  • Statistics are collected and retained in the history.

  • Threshold crossing faults are triggered.

  • Statistics are exported.

Collection rules are defined per sampling interval, as specified by the granularity. The rules configure whether the collection of statistics should be turned on or off, and when turned on, what the history retention period should be. Monitoring Targets correspond to observable objects (such as ports and EPGs). Collection Rules can be defined under Statistics, Monitoring Targets, or under the top-level Monitoring Policy. The higher-level definition of Collection Rules takes precedence unless there is a defined lower-level policy.

Statistics correspond to groups of statistical counters (such as ingress-counters, egress-counters, or drop-counters).

Threshold rules are defined under collection rules and are applied to the corresponding sampling-interval that is defined in the parent collection rule.

Tetration Analytics

About Cisco Tetration Analytics Agent Installation

The Cisco Tetration Analytics agent installation is accomplished by downloading the RPM Package Manager (RPM) file from the Cisco Tetration Analytics cluster and upload it to APIC. The Cisco Tetration Analytics cluster send a notification to the switch whenever a later version of the Cisco Tetration Analytics agent is uploaded.

There are two possible scenarios regarding the installation of the image on the switch:

  • The Cisco Tetration Analytics image is not installed on the switch: the switch receives a notification from APIC, downloads and installs the Cisco Tetration Analytics agent image on the container on the switch.

  • The Cisco Tetration Analytics image is installed on the switch and the switch receives a notification from the APIC. The switch checks if the APIC version is higher than that of the agent image already installed. If the version is higher, the switch downloads and installs the latest Cisco Tetration Analytics image on the container on the switch.

The image is installed in persistent memory. On reboot, after receiving controller notification from APIC, the switch starts the Cisco Tetration Analytics agent irrespective of the image that is available on APIC.

NetFlow

About NetFlow

The NetFlow technology provides the metering base for a key set of applications, including network traffic accounting, usage-based network billing, network planning, as well as denial of services monitoring, network monitoring, outbound marketing, and data mining for both service providers and enterprise customers. Cisco provides a set of NetFlow applications to collect NetFlow export data, perform data volume reduction, perform post-processing, and provide end-user applications with easy access to NetFlow data. If you have enabled NetFlow monitoring of the traffic flowing through your datacenters, this feature enables you to perform the same level of monitoring of the traffic flowing through the Cisco Application Centric Infrastructure (Cisco ACI) fabric.

Instead of hardware directly exporting the records to a collector, the records are processed in the supervisor engine and are exported to standard NetFlow collectors in the required format.

For information about configuring NetFlow with virtual machine networking, see the Cisco ACI Virtualization Guide.


Note


NetFlow is only supported on EX switches. See the Cisco NX-OS Release Notes for Cisco Nexus 9000 Series ACI-Mode Switches document for the release that you have installed for a list of the supported EX switches.


NetFlow Support and Limitations

The following list provides information about the available support for NetFlow and the limitations of that support:

  • NetFlow on spine switches with X9732C-EX or X9732C-S line cards is not supported, and tenant level information cannot be derived locally from the packet on the spine.

  • The hardware does not support any active/inactive timers. The flow table records get aggregated as the table gets flushed, and the records get exported every minute.

  • At every export interval, software cache gets flushed and the records that are exported in the next interval will have a reset packet/byte count and other statistics, even if the flow was long-lived.

  • The filter TCAM has no labels for bridge domain or interfaces. If a NetFlow monitor is added to 2 bridge domains, the NetFlow monitor uses 2 rules for IPv4, or 8 rules for IPv6. As such, the scale is very limited with the 1K filter TCAM.

  • ARP/ND are handled as IP packets and their target protocol addresses are put in the IP fields with some special protocol numbers from 249 to 255 as protocol ranges. NetFlow collectors might not understand this handling.

  • The ICMP checksum is part of the Layer 4 src port in the flow record, so for ICMP records, many flow entries will be created if this is not masked, as is similar for other non-TCP/UDP packets.