Service Status
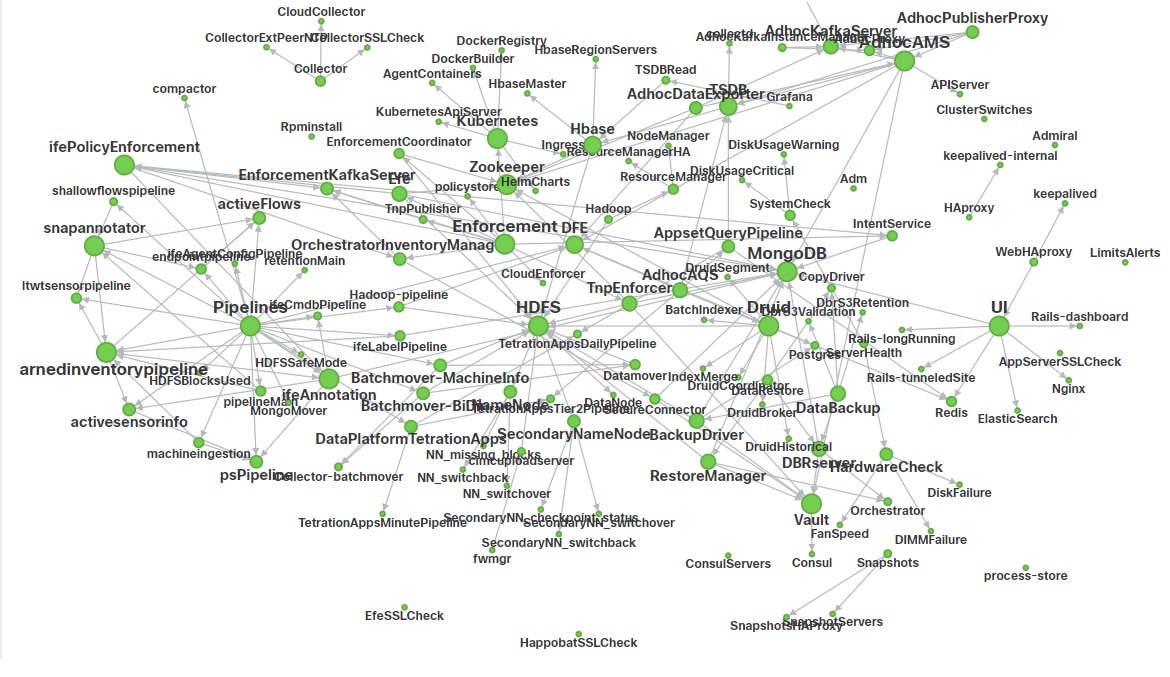
In the left navigation pane, the page displays the health of all services that are used in your Cisco Secure Workload cluster along with their dependencies.
The documentation set for this product strives to use bias-free language. For the purposes of this documentation set, bias-free is defined as language that does not imply discrimination based on age, disability, gender, racial identity, ethnic identity, sexual orientation, socioeconomic status, and intersectionality. Exceptions may be present in the documentation due to language that is hardcoded in the user interfaces of the product software, language used based on RFP documentation, or language that is used by a referenced third-party product. Learn more about how Cisco is using Inclusive Language.
In the navigation pane, the options that you see under the Troubleshoot menu depends on your user role.
In the left navigation pane, the page displays the health of all services that are used in your Cisco Secure Workload cluster along with their dependencies.
Admiral is an integrated alerting system. It processes alerts off the service health reported by Service Status. Thus, users have a unified way of determining service/cluster health. Service Status shows the current (point in time) health of a service. The service is considered down when it reports as red on service status, otherwise it is considered as up. Uptime is the time when the service is reported as up. Admiral evaluates service health reported by service status over a period of time and raises an alert if the service uptime percentage falls below a certain thresold. This evaluation over a duration of time ensures that we reduce false positives and alert only on true service outages.
As services are different in their alerting needs, this percentage and time interval are fixed differently for different services.
Customers can use admiral notifications to be notified of these events. They are also visible on the page under type PLATFORM.
 Note |
Only a chosen subset of services have an admiral alert associated with them. If a service is not in the above subset, no admiral alert will be raised when it goes down. This subset of services with admiral alerts and their alerting threshold percentages and time intervals are fixed i.e. not user configurable. |
The following sections describe admiral alerts and notifications in more detail.
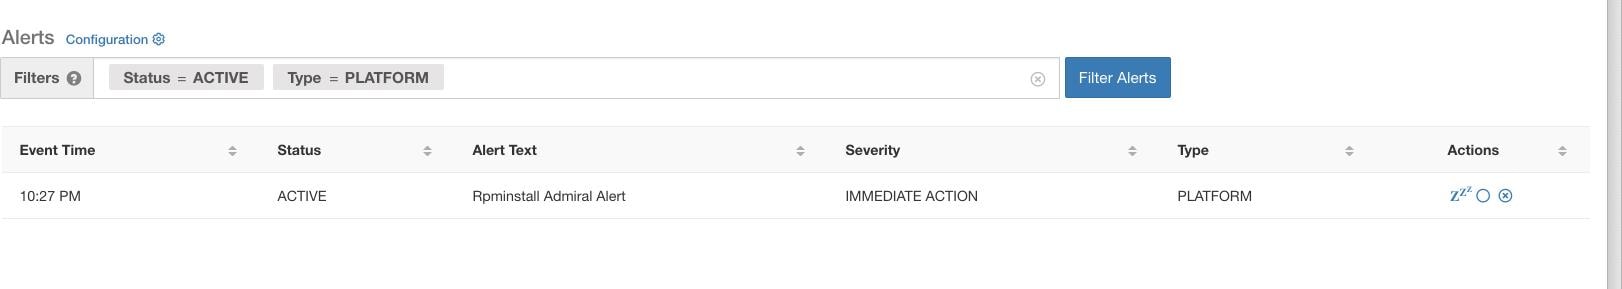
Admiral checks for the uptime of services on service status. It raises an alert when this uptime becomes lower than the pre-configured threshold for alerting.
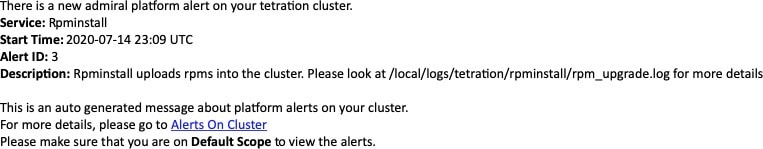
As an example, Rpminstall is a service which is used to install rpms during deploy, upgrades, patches etc. It is configured to generate an admiral alert if its uptime is less than 80% over one hour. If Rpminstall service goes down for a duration longer than the threshold specified above, an admiral alert for Rpminstall is generated with status ACTIVE.
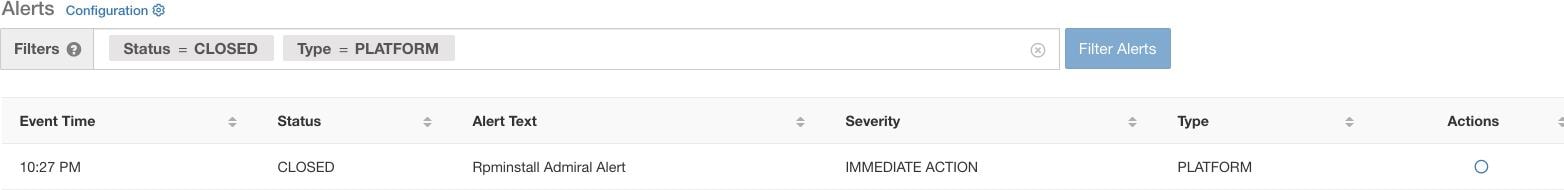
When the service recovers, its uptime percentage starts increasing. When the uptime goes higher than its threshold , the alert auto closes and its status moves to CLOSED. In the Rpminstall example described above, Rpminstall Admiral Alert will auto close when its uptime goes over 80% in one hour.
Note |
The close of alert will ALWAYS lag the service becoming normal. This is because admiral looks at service health over a duration of time. In the above example, since Rpminstall alert threshold is set to 80% of an hour of uptime , it will need to be up for at least 48 minutes (80% of one hour) before the alert will close. |
No action is required to close the alert. This ensures that all ACTIVE admiral alerts indicate a current underlying issue that needs attention.
Note |
No dedicated notification is generated when alerts close. |
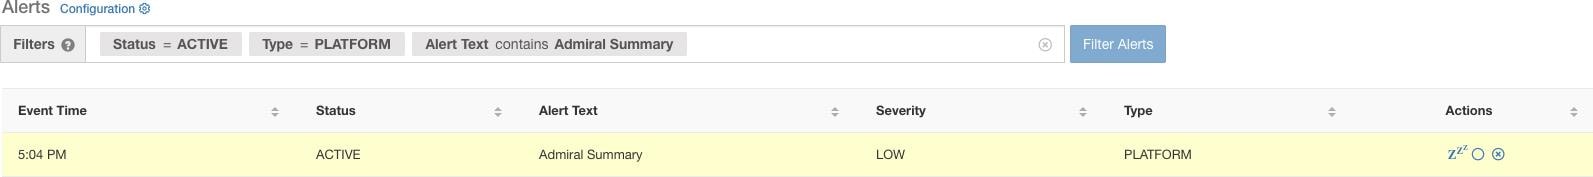
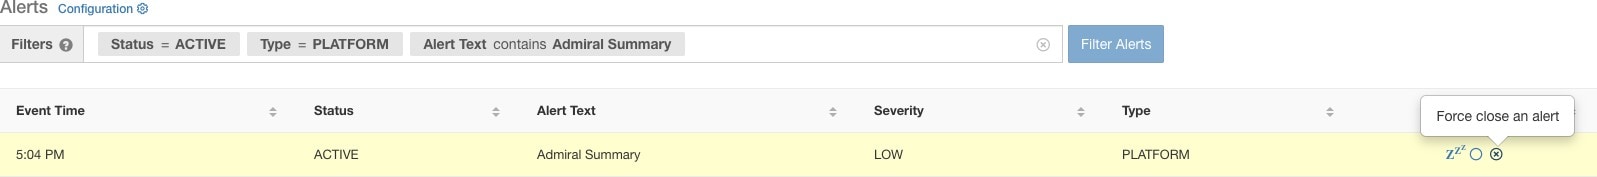
After an alert moves to CLOSED, it will no longer show under ACTIVE alerts. Closed alerts can still be seen on the UI using the filter Status=CLOSED as shown below:
There are two kinds of admiral alerts:
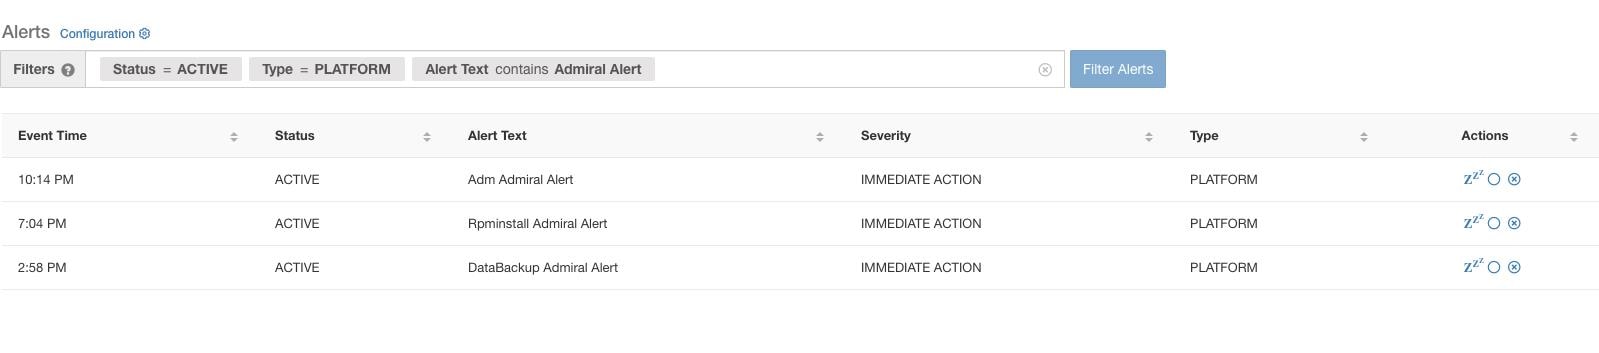
The alerts that are described in the previous section, alerts that are raised for individual services, fall under the Individual Admiral Alert category. The alert text always contains <Service Name> Admiral Alert. This makes it easy to filter individual alerts by service or by the Admiral Alert suffix.
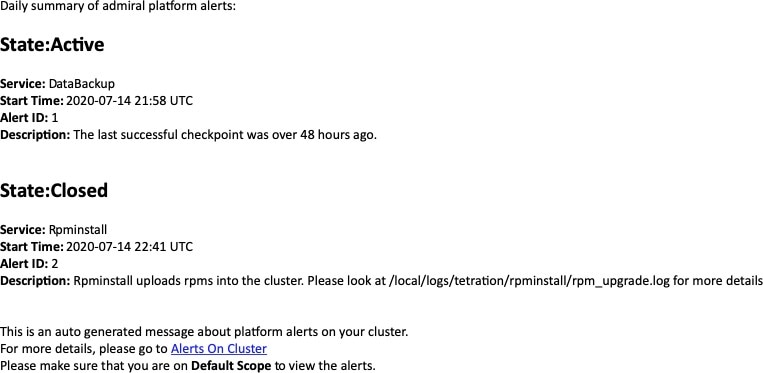
The admiral generates daily Summary Alerts at midnight UTC. They contain a list of currently active alerts and all alerts closed within the last one day. This allows the user to see the overall cluster health reported by admiral in one place. This is also useful to see closed alerts which do not generate a dedicated notification otherwise. If the cluster is healthy and no alerts were closed within the last one day, no summary notifications are generated for that day. This is done to reduce unnecessary notifications and noise.
The Alerts Text in this case is always Admiral Summary. This makes it easy to filter summary alerts as shown in the following figure.
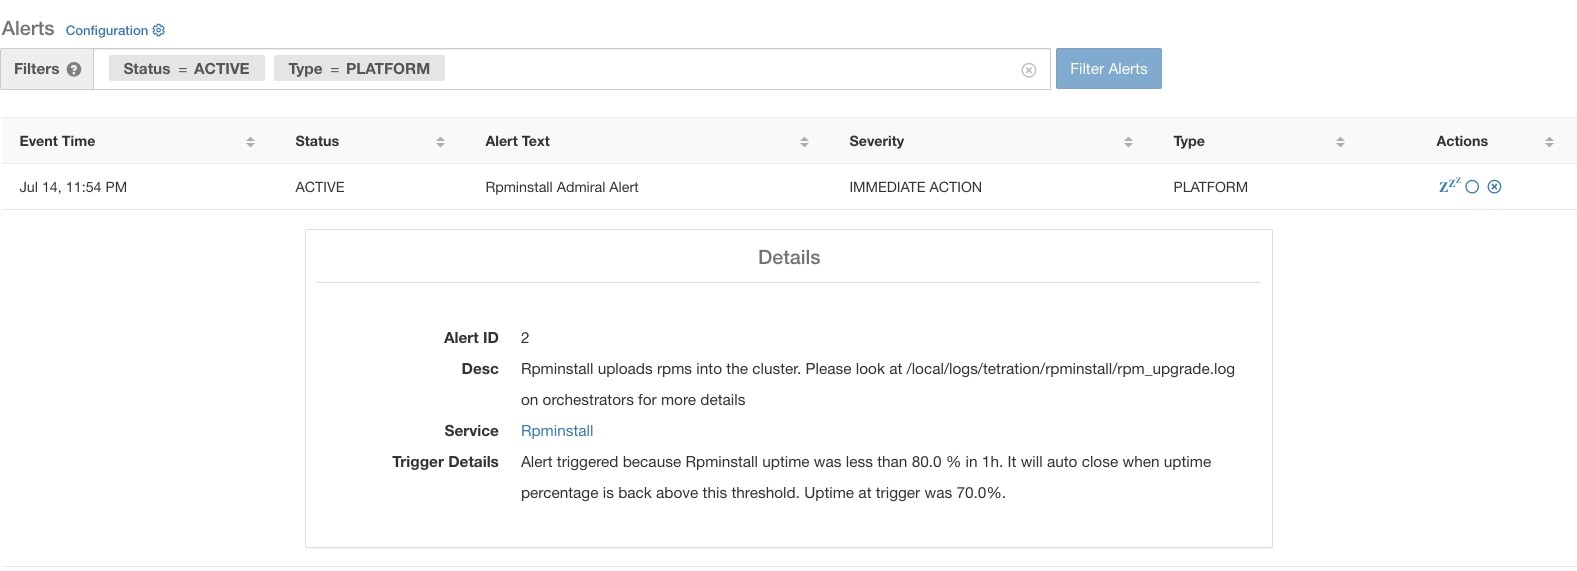
On clicking the alert for an individual admiral alert, it expands to show fields useful for debugging and analyzing the alert.
|
Field |
Description |
|---|---|
|
Alert ID |
Unique ID for alerts. This helps uniquify a particular incidence of a service going down. As mentioned earlier, when the underlying uptime of the service being reported by the alert becomes normal, the alert auto closes. If the same service goes down again next, a new alert with a different Alert ID is generated. Thus the alert id helps uniquify each incident of the alert being raised. |
|
Desc |
The description field contains additional information about the service issue causing the alert. |
|
Service |
This contains a link taking the user to the service status page where the status of the service can be seen. User can also get more details on why the service is being marked down in the service status page. |
|
Trigger Details |
This contains the details on the trigger thresholds for the service. User can understand when to expect the alert to close after its underlying service is restored by looking at these thresholds. For example, Rpminstall threshold is mentioned as 80% uptime over one hour. Thus rpminstall service must be up for at least 48 minutes (80% of one hour) before the alert will auto close. This also shows the uptime value that is seen for the service when the alert was fired. |
The following is a sample JSON Kafka output:
  {
  "severity": "IMMEDIATE_ACTION",
  "tenant_id": 0,
  "alert_time": 1595630519423,
  "alert_text": "Rpminstall Admiral Alert",
  "key_id": "ADMIRAL_ALERT_5",
  "alert_id": "/Alerts/5efcfdf5497d4f474f1707c2/DataSource{location_type='TETRATION', location_name='platform', location_grain='MIN', root_scope_id='5efcfdf5497d4f474f1707c2'}/66eb975f5f987fe9eaefa81cee757c8b6dac5facc26554182d8112a98b35c4ab",
  "root_scope_id": "5efcfdf5497d4f474f1707c2",
  "type": "PLATFORM",
  "event_time": 1595630511858,
  "Check  /local/logs/tetration/rpminstall/rpm_upgrade.log on
orchestrators for more details\",\"Trigger Details\":\"Alert triggered because Rpminstall
uptime was less than 80.0 % in 1h. It will auto close when uptime percentage is back above
this threshold. Uptime at trigger was 65.0%. \"}"
  }
All individual alerts follow the JSON Kafka format. The services (from service status) that are covered by admiral monitoring are listed in the following table:
|
Service |
Trigger Condition |
Severity |
|---|---|---|
|
KubernetesApiServer |
Service Uptime falls below 90% in last 15 mins. |
IMMEDIATE ACTION |
|
Adm |
Service Uptime falls below 90% in the last one hour. |
IMMEDIATE ACTION |
|
DataBackup |
Service Uptime falls below 90% in the last 6 hours. |
IMMEDIATE ACTION |
|
DiskUsageCritical |
Service Uptime falls below 80% in the last one hour. |
IMMEDIATE ACTION |
|
RebootRequired |
Service Uptime falls below 90% in the last one hour. |
IMMEDIATE ACTION |
|
Rpminstall |
Service Uptime falls below 80% in the last one hour. |
IMMEDIATE ACTION |
|
SecondaryNN_checkpoint_status |
Service Uptime falls below 90% in the last one hour. |
IMMEDIATE ACTION |
For 8 or 39 RU physical clusters, the following services are also monitored:
|
Service |
Trigger Condition |
Severity |
|---|---|---|
|
DIMMFailure |
Service Uptime falls below 80% in the last one hour. |
IMMEDIATE ACTION |
|
DiskFailure |
Service Uptime falls below 80% in the last one hour. |
IMMEDIATE ACTION |
|
FanSpeed |
Service Uptime falls below 80% in the last one hour. |
IMMEDIATE ACTION |
|
ClusterSwitches |
Service Uptime falls below 80% in the last one hour. |
IMMEDIATE ACTION |
Note |
Admiral relies on processing metrics that are generated by Service Status to generate alerts. If metric retrieval is not possible for a prolonged duration (For Eg: If service status is down), then an alert (TSDBOracleConnectivity) is raised notifying that service-based alert processing is off on the cluster. |
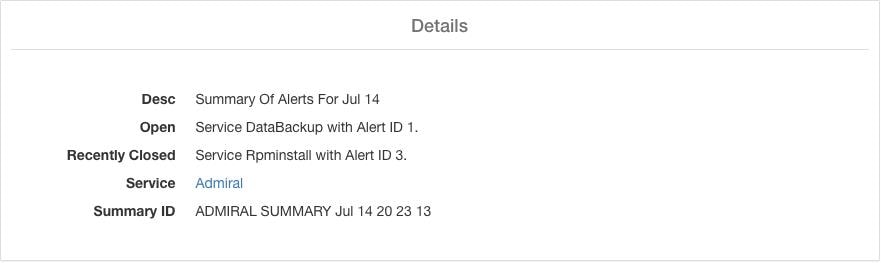
Summary alerts are informational in nature and are always set to LOW priority. On clicking an admiral summary alert, it expands to show various fields containing summary information on admiral alerts.
|
Field |
Description |
|---|---|
|
Desc |
The description field contains the day for the daily summary. |
|
Open |
The open alerts indicate which alerts were active when the summary was generated. |
|
Recently Closed |
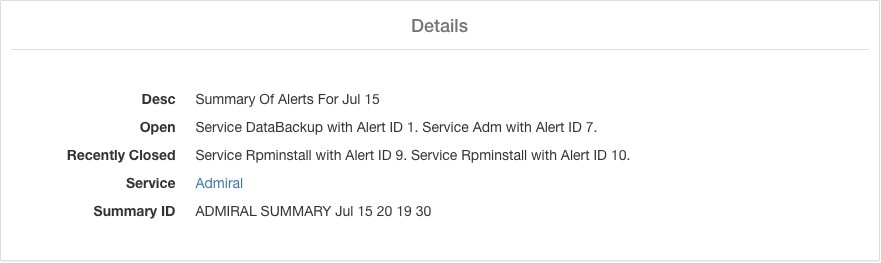
This contains alerts which closed within the last 24 hours i.e. during the day for which the summary was generated. Each alert’s ID is also included. Since the alerts auto close, a given service could have gone down and created an alert, then become normal and alert auto closed. It could have done this multiple times in a day in which case recently closed will list each incident along with its unique alert id. However, this is not expected to happen often given that each service has to be up for a threshold time before its alert is closed. User can filter with Status = CLOSED to get more information on each incident. |
|
Service |
Service Status link for Admiral which is the service processing and generating the daily summary. |
|
Summary ID |
ID of the summary alert. |
The following is a sample JSON Kafka output:
  {
    "severity": "LOW",
    "tenant_id": 0,
    "alert_time": 1595721914808,
    "alert_text": "Admiral Summary",
    "key_id": "ADMIRAL_SUMMARY_Jul-26-20-00-04",
    "alert_id": "/Alerts/5efcfdf5497d4f474f1707c2/DataSource{location_type='TETRATION', location_name='platform', location_grain='MIN', root_scope_id='5efcfdf5497d4f474f1707c2'}/e95da4521012a4789048f72a791fb58ab233bbff63e6cbc421525d4272d469aa",
    "root_scope_id": "5efcfdf5497d4f474f1707c2",
    "type": "PLATFORM",
    "event_time": 1595721856303,
    "alert_details": "{\"Desc\":\"Summary of alerts for Jul-26\",\"Recently Closed\":\"None\",\"Open\":\" Service Rpminstall with Alert ID 5.\",\"Service\":\"Admiral\",\"Summary ID\":\"ADMIRAL_SUMMARY_Jul-26-20-00-04\"}"
  }
An example summary alert containing a service raising multiple alerts in a day is shown below:
Since admiral alerts generate an individual notification only once per alert, including/excluding or snoozing specific alerts are not needed. Alerts auto close when the service becomes normal for threshold uptime as described above. There is a force close option available to forcibly close an alert. This should normally be used only to remove summary alerts from the UI as individual alerts close automatically.
 Warning |
Individual alerts should not be closed forcefully. Doing so while the underlying service is still down or its uptime is below its expected threshold will lead to another alert getting raised for the same service on the next admiral processing iteration. |
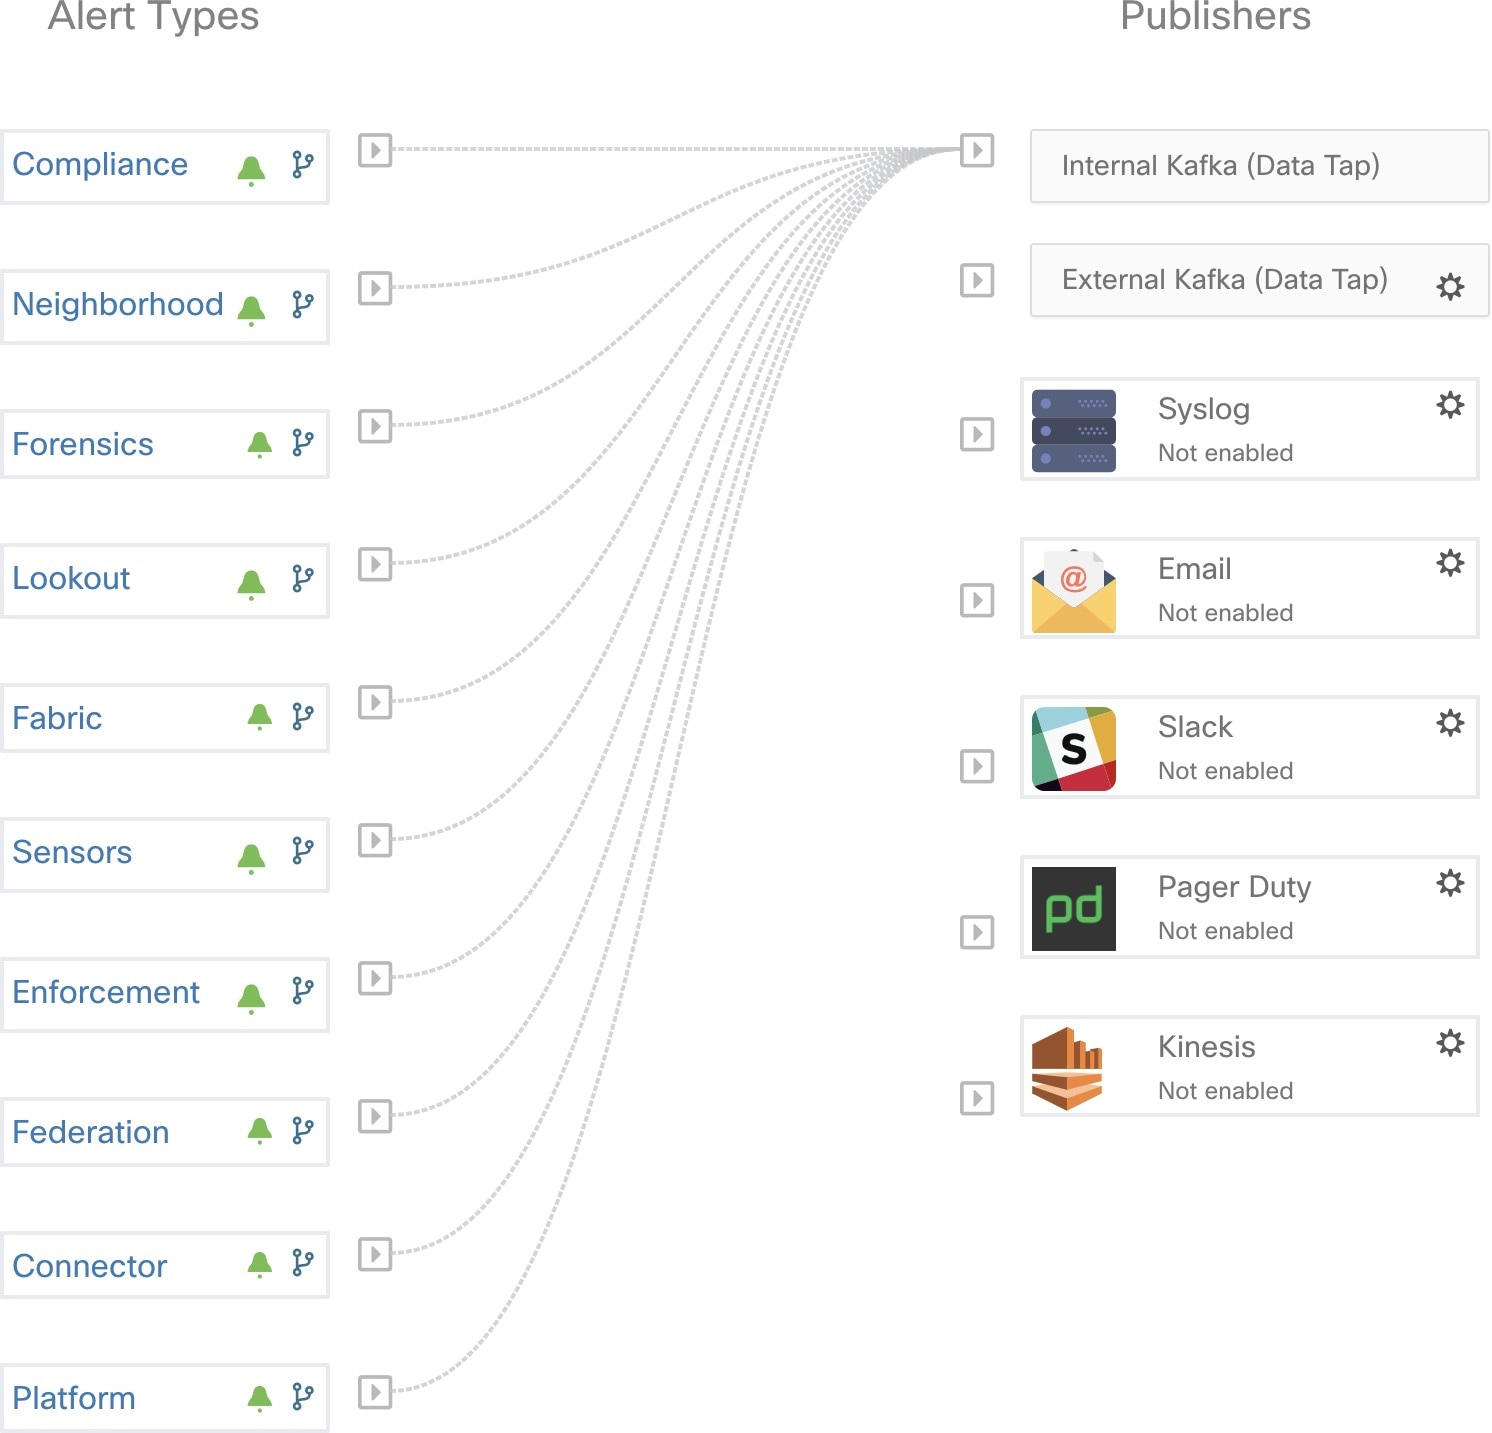
Admiral Alerts are of Type PLATFORM. As such, these alerts can be configured to be sent to various publishers by appropriate connections for Platform Alerts via the configuration page ./configuration. For convenience, the connec- tion is turned on between Platform Alerts and Internal Kafka by default which allows admiral alerts to be seen on the Current Alerts page (go to ) without any manual configuration.
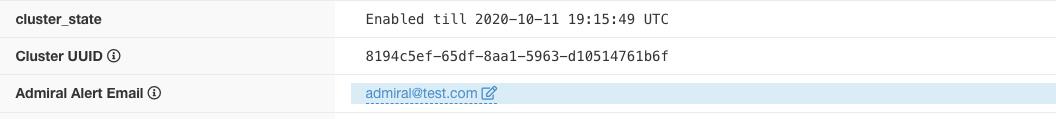
Admiral Alerts are also sent to the email address configured under .
Thus, users can receive admiral notifications even if they don’t have the TAN edge appliance setup. This is similar to Bosun behavior in previous releases.
These email notifications are generated based on the same triggers as the Current Alerts page. Thus, they are sent on alert creation and a daily summary email at midnight UTC. The daily summary email lists all active alerts and those closed within the last 24 hours.
If there are no active alerts and no alerts closed within the last 24 hours, the summary emails are skipped to reduce email noise.
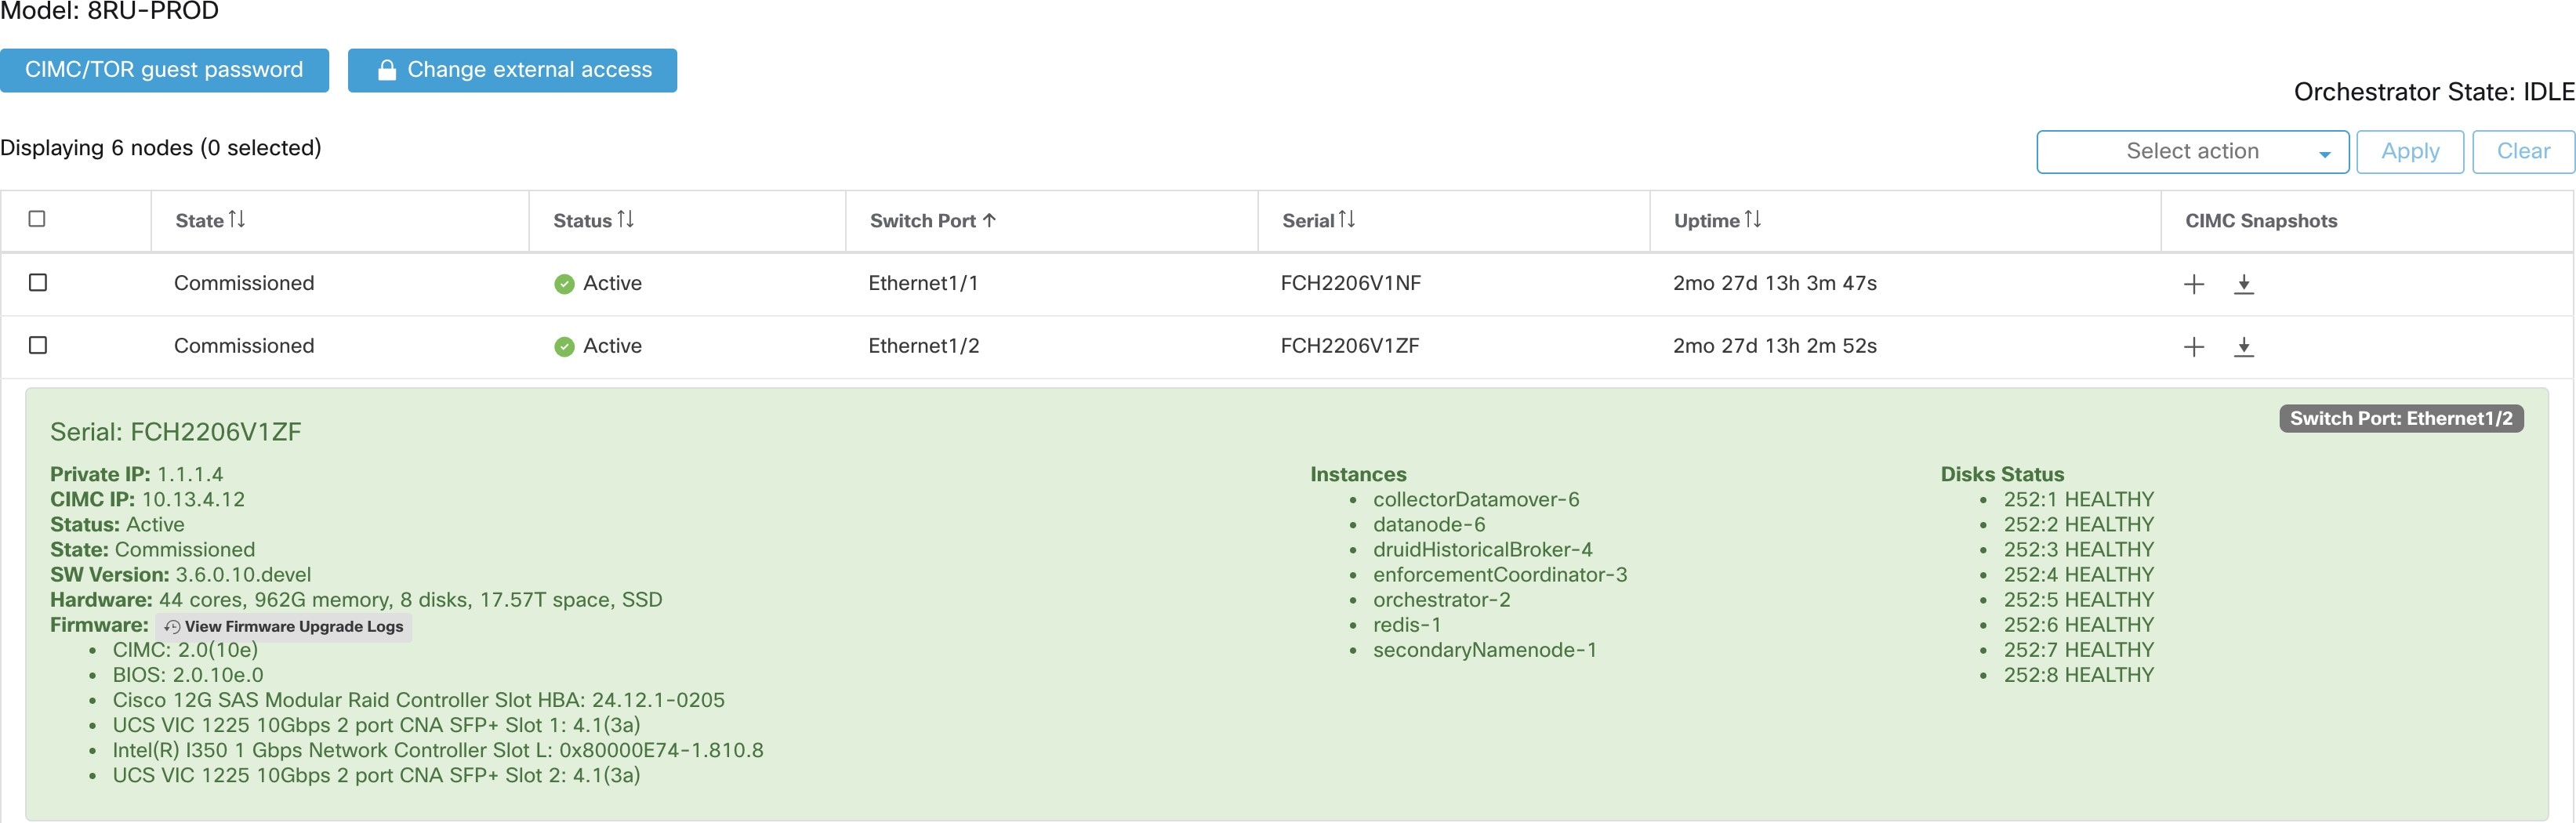
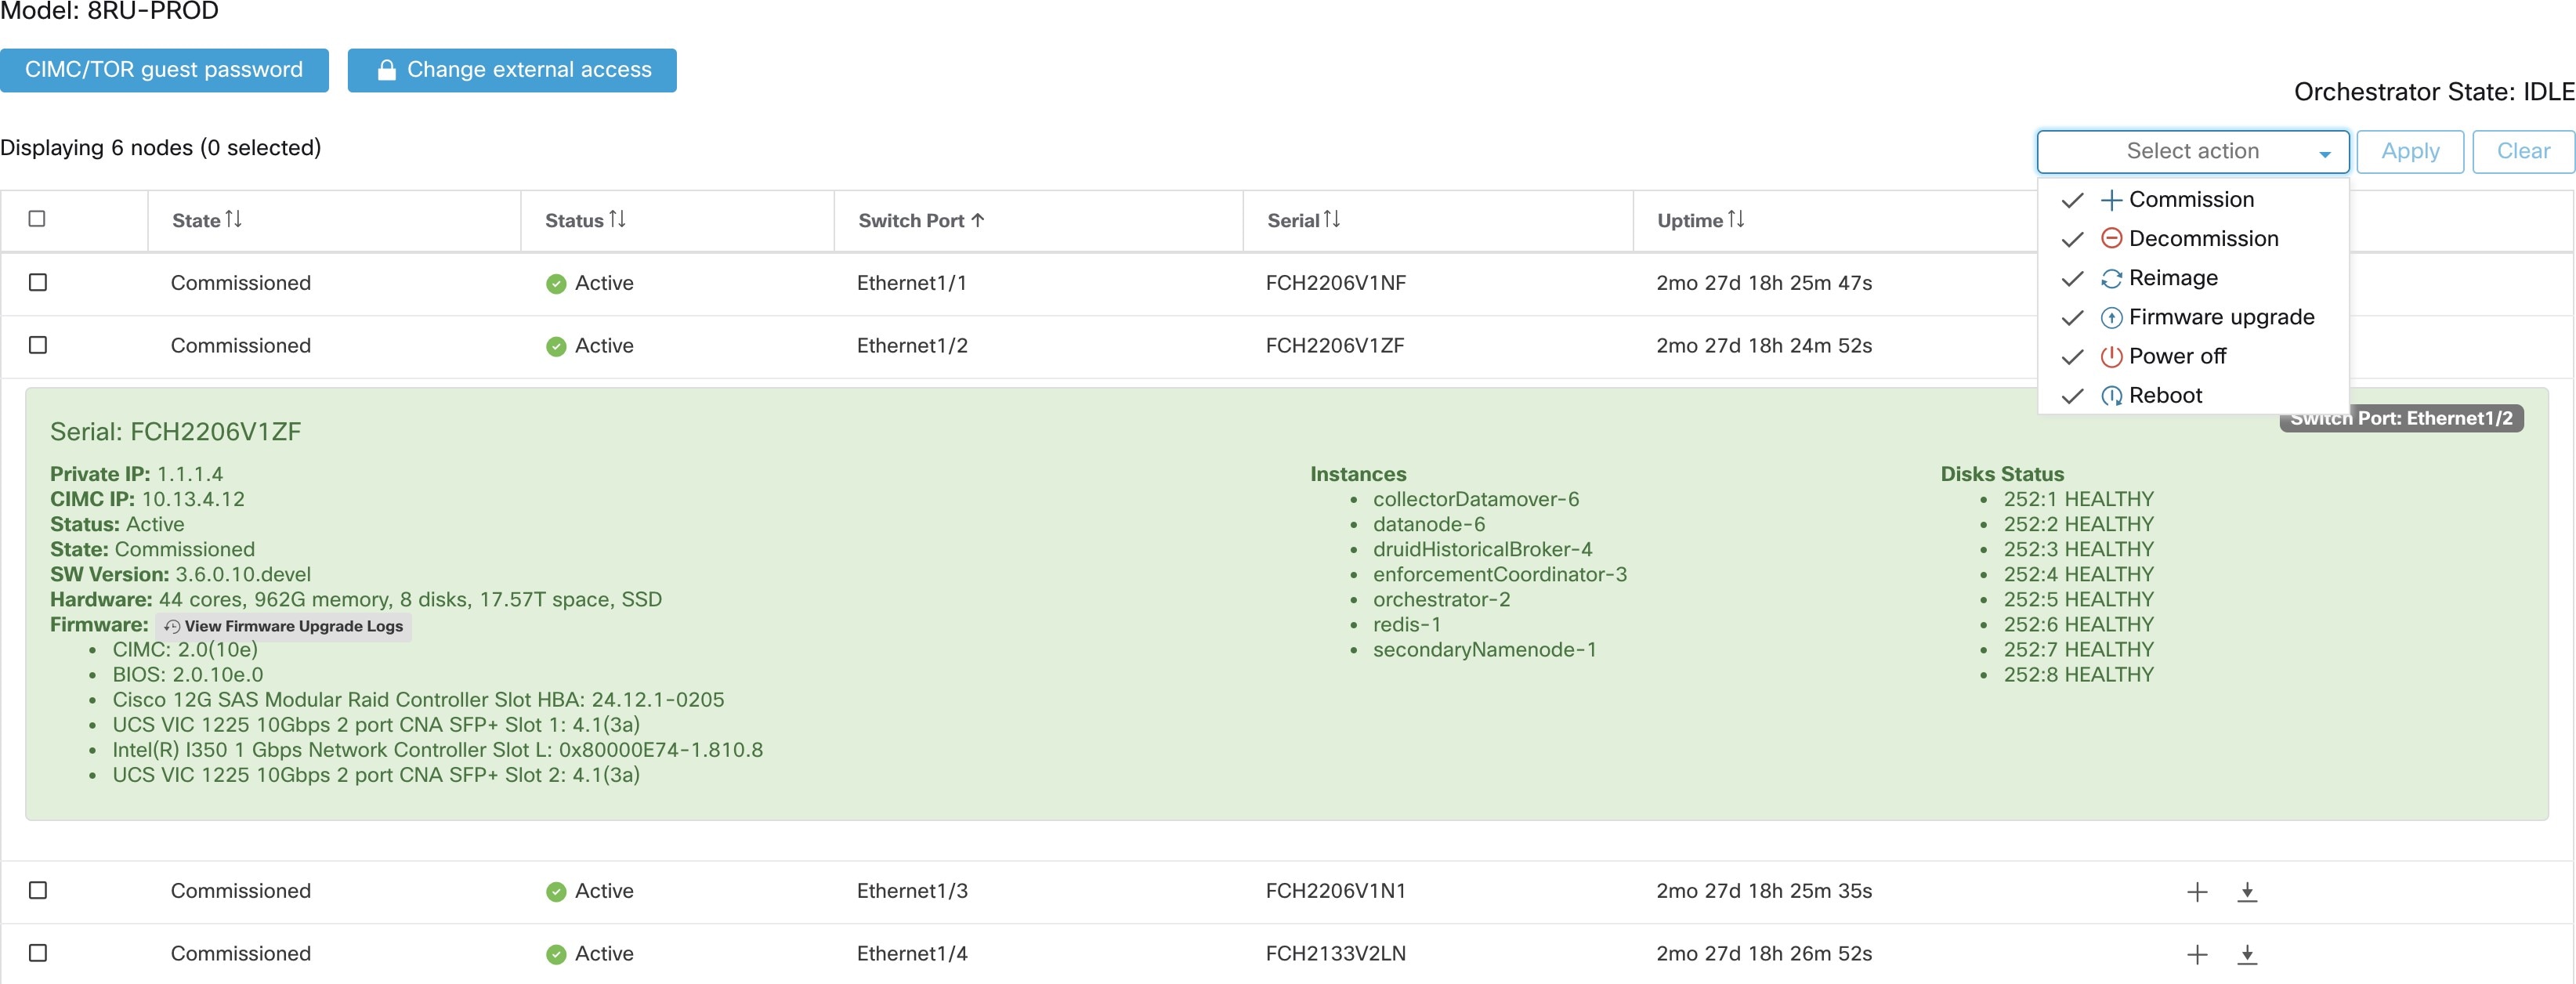
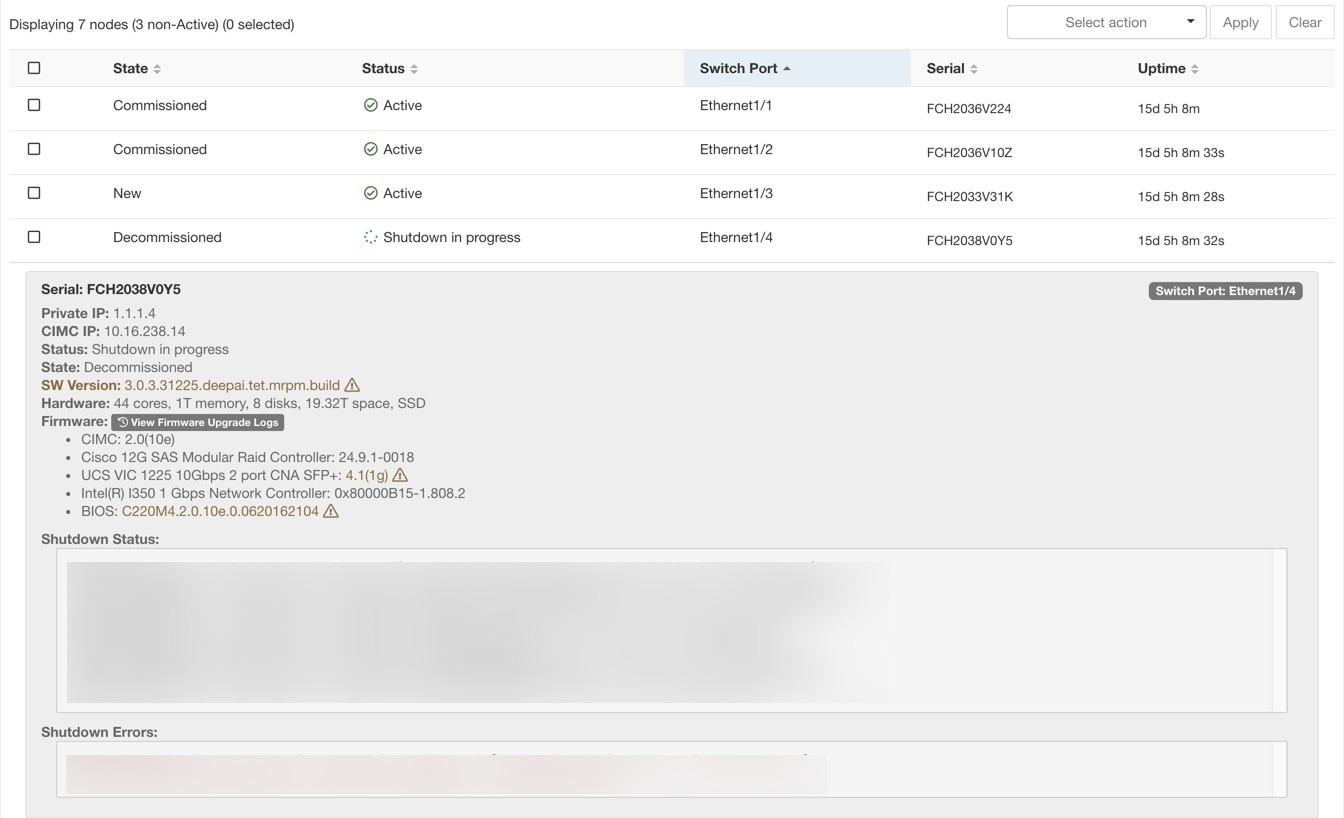
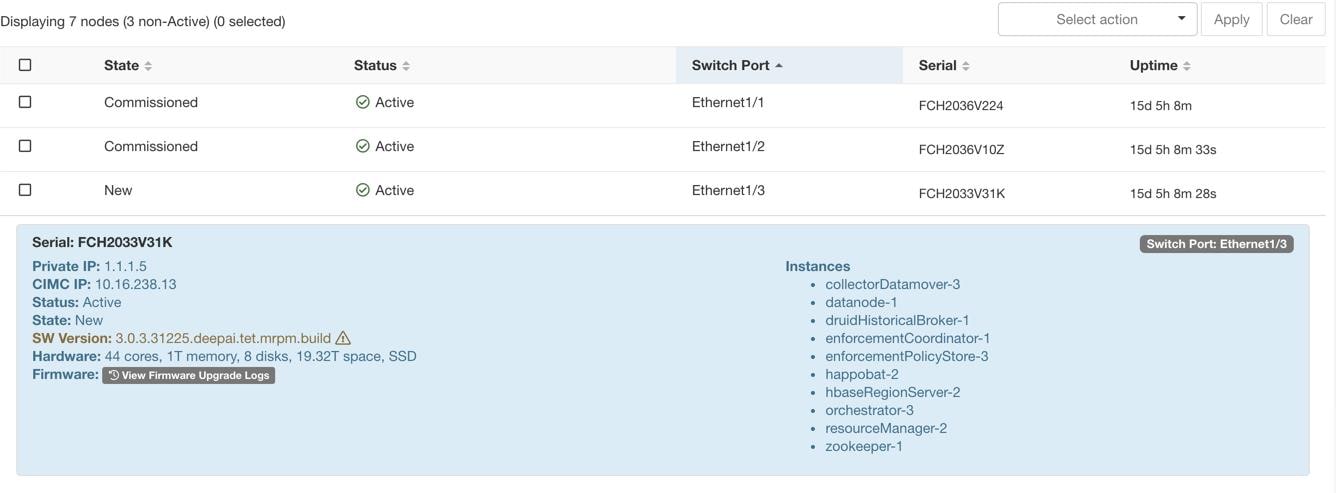
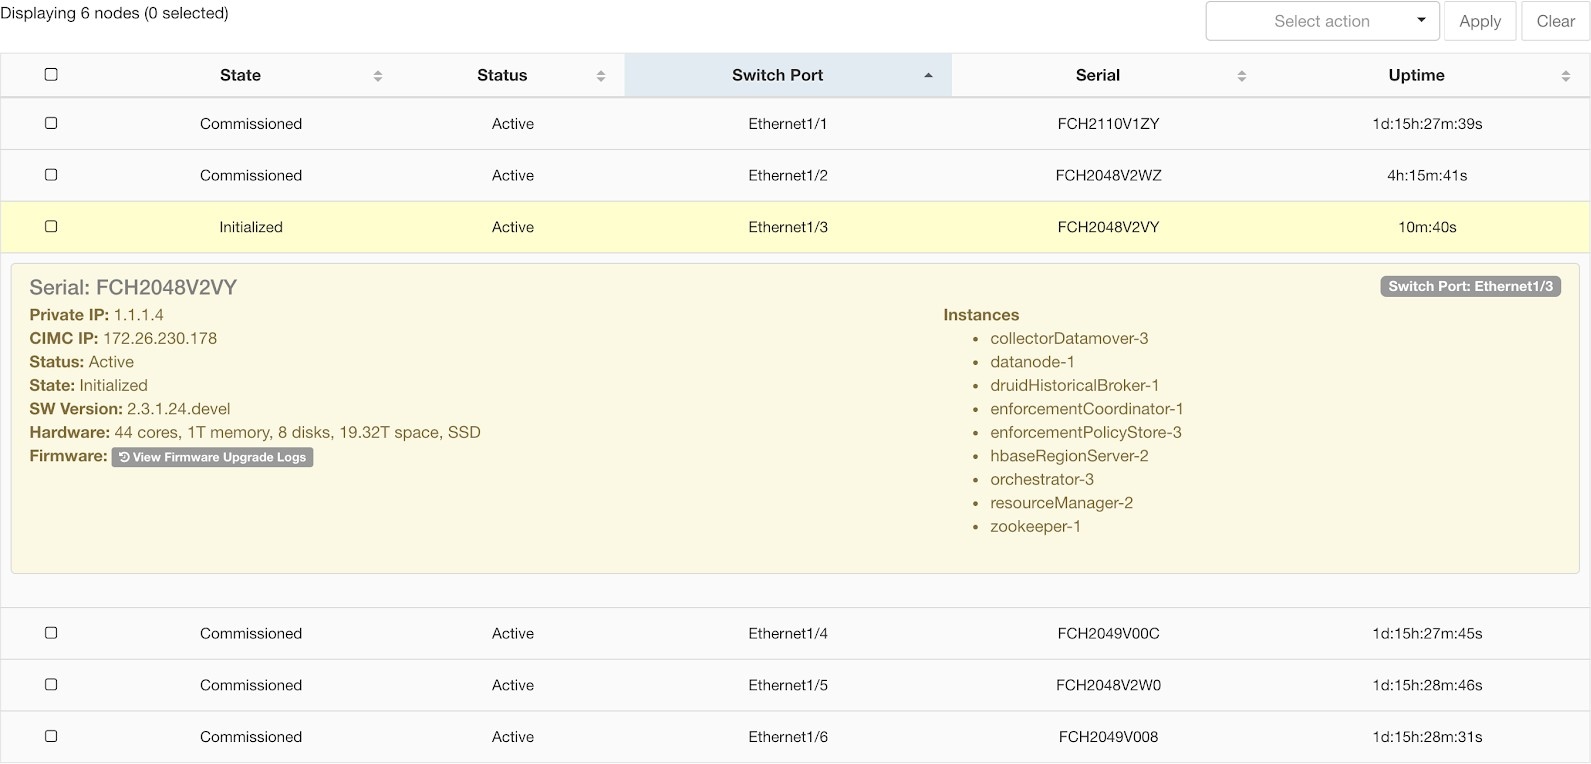
The Cluster Status page under the Troubleshoot menu in the left navigation bar can be accessed by Site Admin users but the actions can be carried out by Customer Support users only. It shows the status of all the physical servers in the Cisco Secure Workload rack. Each row in the table represents a physical node with details such as its hardware and firmware configuration and CIMC IP address (if assigned). The detail view of the node can be viewed by clicking on the row. In this page, we can also change the CIMC password of the nodes and enable or disable external access to them. Orchestrator state is also displayed on the cluster status page to provide context for customer support.
Actions that affect all nodes
Changing CIMC password and enabling or disabling external CIMC access can be done using the CIMC/TOR guest password and Change external access options. The actions affect all nodes in the cluster.
External CIMC Access Node Details
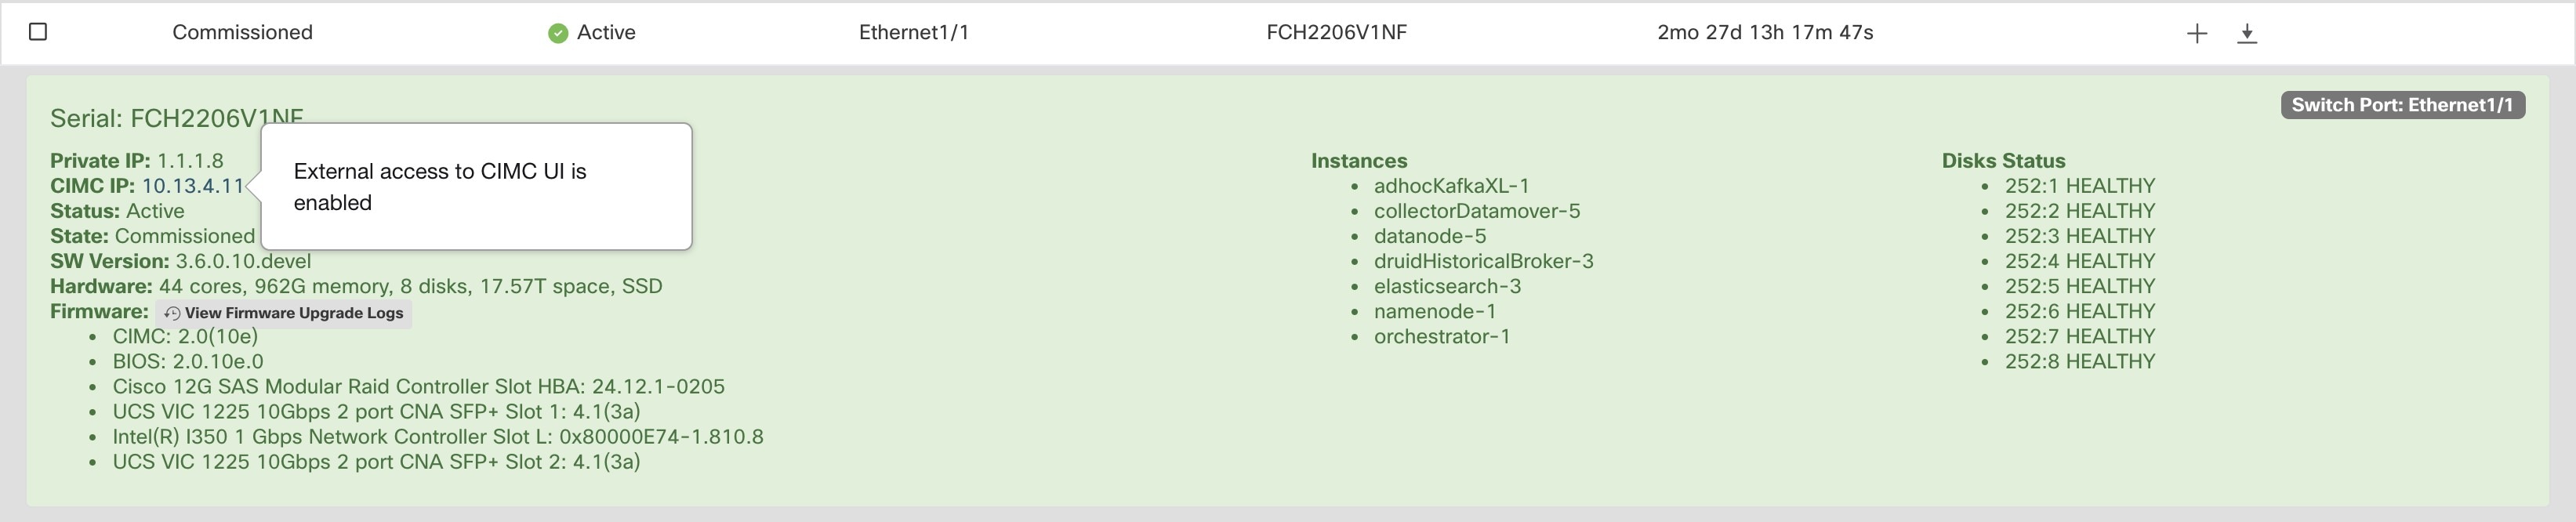
Clicking Change external access opens a dialog box that provides the status of external CIMC access and allows external access to CIMC to be enabled, renewed, or disabled.
Clicking Enable configures the cluster in the background to enable external CIMC access. It can take up to 60 seconds for the tasks to complete and external CIMC access to be fully enabled. When external CIMC access is enabled, a dialog box displays when access is set to automatically expire and Enable changes to Renew to reflect that you can renew external CIMC access. Renewing external CIMC access increases the expiry time by two hours from the current time.
If external CIMC access is enabled, the CIMC IP address in the node details (viewable by clicking on a row for a node) becomes a clickable link that allows you directly access the CIMC UI. You may need to reload the cluster status page to view the links.
The CIMC UI usually has a self-signed certificate, accessing the CIMC UI will likely result in an error in the browser indicating that the certificate is not valid. If you are using Google Chrome this may require you to type thisisunsafe without quotes when the invalid certificate error is shown in Google Chrome to bypass the certificate check and access the CIMC UI.
Within the CIMC UI, KVM access is only functional if the CIMC version is 4.1(1g) or later. After external CIMC access is enabled, it is automatically disabled in two hours time unless access is renewed or disabled.
Disabling external CIMC access configures the cluster in the background to disable external CIMC access. It can take up to 60 seconds for the task to complete and external CIMC access to be fully disabled.
|
Field |
Description |
|---|---|
|
Status |
The Status field indicates the power status of the node. Possible values are:
|
|
State |
The State field indicates the cluster membership state for the node. Possible values are:
|
|
Switch Port |
Refers to the switch port of the two switches on which the physical node is connected. |
|
Uptime |
Indicates the time for which the node has been running without a restart or shutdown. |
|
CIMC Snapshots |
Can be used to initiate a CIMC Tech Support collection and download a CIMC Tech Support. |
|
Action |
Description |
||
|---|---|---|---|
|
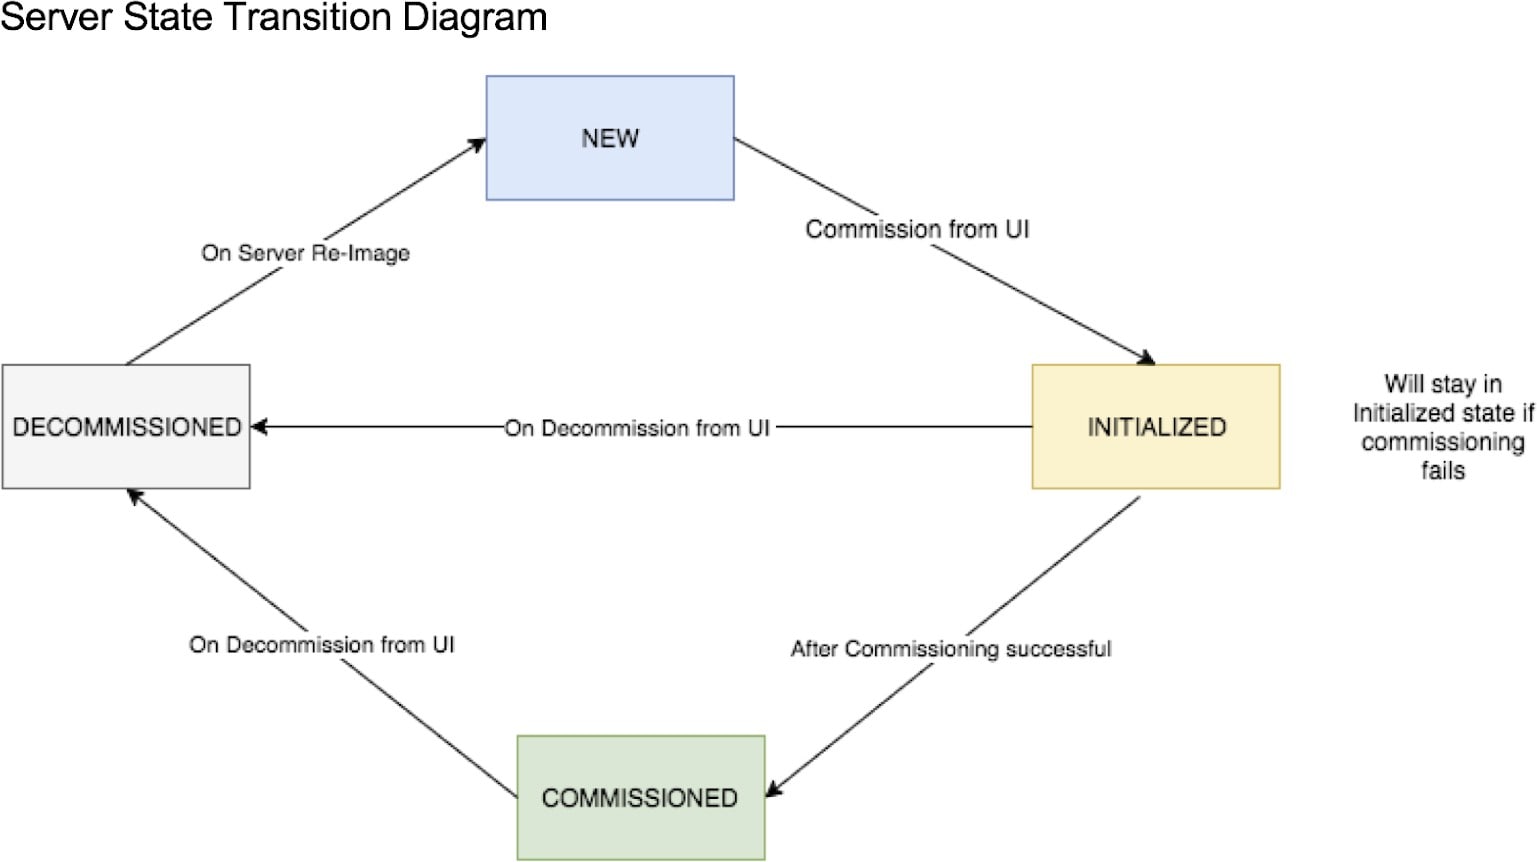
Commission |
Select this action to integrate new nodes into the cluster. Only nodes with the state New are selectable for this action. |
||
|
Decommission |
Select this action to remove nodes that are part of the cluster. Only the nodes with state Commissioned or Initialized are selectable for this action. |
||
|
Reimage |
Select this action to redeploy the Secure Workload. This could erase all cluster data and is especially useful to upgrade the bare metal operating system from an older version to a new one. This step is required when a bare metal is decommissioned. |
||
|
Firmware upgrade |
Firmware information is available for the nodes where CIMC IP is reachable. This action is helpful to upgrade firmware on the nodes with older versions. |
||
|
Power off |
Select this action to power down the nodes.
|
The Secure Workload on-premises cluster bundles a Unified Computing System (UCS) Cisco Integrated Management Controller (CIMC) Host Upgrade Utility (HUU) ISO. The firmware upgrade option on the Cluster Status page can be used to update a physical bare metal to the version of UCS firmware included in the HUU ISO that has been bundled in the Secure Workload RPMs.
A bare metal host can have the firmware update started on it when the status is Active or Inactive as long as the bare metal state is not Initialized or SKU Mismatch. Only one bare metal can have its UCS firmware that is updated at a time. To start the firmware update, the Secure Workload orchestrator state must be Idle. When the UCS firmware update is initiated, some of the UI functionality specific to the Cluster Status page may be temporarily impacted if the consul leader, active orchestrator, or active firmware manager (fwmgr) must be switched to other hosts - these switchovers should occur automatically. During the firmware update, the firmware details for the bare metal being updated will not be displayed and after the update it may take up to 15 minutes for the firmware details to display again in the Cluster Status page. Before starting the firmware update, check the Service Status page to verify that all services are healthy.
When you initiate a firmware update on a bare metal, fwmgr will verify that the update can continue, gracefully power down the bare metal if needed, then login to the CIMC on the bare metal and start the HUU-based firmware update. That HUU-based firmware update process involves booting the bare metal into the HUU ISO, doing the update, rebooting CIMC to activate the new firmware then booting the bare metal back into the HUU ISO to verify the update was completed. The overall update process can take 2+ hours for a G1 bare metal or 1+ hours for a G2 bare metal. When the firmware update process is initiated, the Service Status page may indicate that some services are unhealthy since a bare metal and all the virtual machines running on that bare metal are no longer active in the cluster. When the firmware update completes, it can take an extra 30 minutes for the bare metal to become active in the cluster again and more time may be needed for all services to become healthy again. If services do not recover within two hours after a firmware update, contact a customer service representative.
You can click a bare metal node in the Cluster Status page to expand details about the bare metal. When a firmware update is initiated, you can click the View Firmware Upgrade Logs button to view the status of the firmware update. The log contains the overall status of the firmware update and the status can be one of the following:
Firmware update has been triggered: The firmware update was requested but has not started yet. During this status fwmgr will be checking to make sure the services required for the firmware update are functional and that CIMC can reach those services.
Firmware update is running: The firmware update has been started. When a firmware update reaches this state, CIMC and HUU are in control of the update, and the Secure Workload cluster will report the status that it gets from CIMC about the update.
Firmware update has timed out: This indicates that some process from the firmware update has exceeded the time that we expect it to complete. The overall firmware update process has a 240-minute time limit when it enters the Firmware update is running phase. During the firmware update CIMC may become unreachable when it reboots into the new version, this unreachable state has a timeout of 40 minutes before the firmware update is declared as timed out. When the firmware update has started, the monitoring of that update will time out after 120 minutes.
Firmware update has failed with an error: This indicates that an error occurred and the firmware update has failed. CIMC usually does not give an indication of success or failure so this state usually indicates an error occurred before the firmware update actually running.
Firmware update has finished: The firmware update finished without running into any errors or time outs. CIMC usually does not give an indication of success or failure, it is best to verify that the UCS firmware versions are updated when those details become available in the Cluster Status page - it can take up to 15 minutes for those details to become available.
Below the overall status in the View Firmware Upgrade Logs pop-up is an Update progress section that will contain timestamped log messages indicating the progress of the firmware update. When the Rebooting Host In Progress status is displayed in these log messages, CIMC is in control of the update and the cluster is monitoring that update - most log messages after this come directly from CIMC and are only added to the list of log messages if the status of the update changes.
Below the Update progress section of the View Firmware Upgrade Logs pop-up a Component update status section will be shown when CIMC starts providing individual component update statuses. This section summarizes the status of the update of the various UCS components on the bare metal.
Data backup and restore is a disaster recovery mechanism which copies data from Secure Workload cluster, connectors, and external orchestrators to an off-site storage. If a disaster occurs, data is restored from the off-site storage to a cluster of the same form-factor. You can also switch between different backup sites.
Data backup and restore is supported for physical clusters—8 and 39 RU.
Data can be backed up to any external object store compatible with the S3V4 API.
Secure Workload requires sufficient bandwidth and storage to back up data. Slow network speeds and high latency can result in failed backups.
Data storage limits are based on the selected type of backup.
For data backup using the continuous mode, we recommend 200 TB of storage for full backups, including flow data. To determine the actual storage space required, use the Capacity Planner option available on the Data Backup page. For more information, see Use Capacity Planner. Lack of storage space for multiple backups result in frequent deletion of old backups to be able to manage backups within the storage limit. There must be sufficient storage for at least one backup.
For lean mode backups, 1 TB of storage is sufficient because flow data, which constitutes most of the backup data, is not included in the backup.
Data can only be restored to a cluster of compatible form-factor, running the same version as the primary. For example, you can restore data from an 8 RU cluster only to another 8 RU.
A schedule for data backup can be configured using the Data Backup section on the UI. The backups are triggered either once a day and at the scheduled time based on the configured settings or can be configured to run continuously. A successful backup is called a checkpoint. A checkpoint is a point in time snapshot of the cluster’s primary datastores.
A successful checkpoint can be used to restore the data onto another cluster or the same cluster.
The cluster configuration data are always backed up for every checkpoint. Flow and other data contribute to the bulk of the data backed up. Therefore, if configured appropriately, only incremental changes are backed up. Incremental backups help reduce the amount of data pushed to the external storage, which avoids overloading the network. Optionally, a full backup can be triggered on a schedule for all data sources when incremental backup is configured. A full backup copies every object in a checkpoint, even if it is already copied and the object has not changed. This can add significant load on the cluster, on the network between the cluster and the object store, and the object store itself. A full backup may be necessary if there are corruptions in the objects or the object store has any unrecoverable hardware failures. Additionally, if the bucket provided for backup changes, a full backup is automatically enforced since a full backup is necessary before incremental backups will be useful.
|
Secure Workload Cluster Data |
Is the Data Backed Up in the Full Backup Mode? |
Is the Data Backed Up in the Lean Mode? |
|---|---|---|
|
Cluster configurations |
Yes |
Yes |
|
RPMs used for imaging the cluster |
Yes |
Yes |
|
Software agent deployment images |
Yes |
Yes |
|
Flow database |
Yes |
No |
|
Data required for automatic policy discovery |
Yes |
No |
|
Data to help with forensics such as file hashes, data leak models |
Yes |
No |
|
Data to help with attack surface analysis |
Yes |
No |
|
CVE databases |
Yes |
No |
Note |
|
To obtain an activation key for the Data Backup and Restore (DBR) feature, send an email to ta-entitlement@cisco.com requesting a DBR activation key. Attach the cluster ID file in the email.
Note |
The license entitlement is required only for the primary (active) cluster and not for the standby cluster. |
The access and secret keys for the object store are required. The Data backup and restore option does not work with the preauthenticated link for object store.
Configure any policing to throttle the bandwidth that is used by the Secure Workload appliance to an object store. Policing with low bandwidth when the volume of data to be backed up is high can cause backup failures.
Configure the cluster FQDNs and ensure that software agents can resolve the FQDNs.
Note |
After you enable data backup and restore, only the current and later software agent versions are available for installation and upgrades. Versions earlier to the current cluster version remain hidden due to incompatibility. |
Software Agent or Kafka FQDN Requirements
Software agents use IP addresses to get control information from the Secure Workload appliance. To enable data backup and restore and allow for seamless failover after disaster, agents must switch to using FQDN. Upgrading the Secure Workload cluster is not sufficient for this switch. Software agents support the use of FQDN starting Secure Workload version 3.3 and later. Therefore, to enable agent failover and to ensure that agents are ready for data backup and restore, upgrade the agents to version 3.3 or later.
If FQDNs are not configured, the default FQDNs are:
|
IP Type |
Default FQDN |
|---|---|
|
Sensor VIP |
wss{{cluster_ui_fqdn}} |
|
Kafka 1 |
kafka-1-{{cluster_ui_fqdn}} |
|
Kafka 2 |
kafka-2-{{cluster_ui_fqdn}} |
|
Kafka 3 |
kafka-3-{{cluster_ui_fqdn}} |
The FQDNs can be changed on the page.
Update the DNS record for the FQDNs with the IPs provided on the same page. The following table lists the mapping of IPs and FQDNs.
|
Field Name |
Corresponding IP Field |
Description |
|---|---|---|
|
Sensor VIP FQDN |
Sensor VIP |
Update the FQDN to connect to cluster control plane |
|
Kafka 1 FQDN |
Kafka 1 IP |
Kafka node 1 IP |
|
Kafka 2 FQDN |
Kafka 2 IP |
Kafka node 2 IP |
|
Kafka 3 FQDN |
Kafka 3 IP |
Kafka node 3 IP |
Note |
FQDN for sensors VIP and Kafka hosts can only be changed before data backup and restore is configured. After the configuration, FQDN cannot be changed. |
The object store must provide a S3V4 complaint interface.
Note |
A few S3V4-compliant object stores do not support the DeleteObjects functionality. The DeleteObjects functionality is required to delete outdated checkpoint information. The lack of this functionality can lead to failures when attempting to delete outdated checkpoints from the storage and can cause the storage to run out of space. |
Location
The location of the object store is critical to the latency involved in backing up and restoring from the store. To improve restore time, ensure that the object store is located closer to the standby cluster.
Bucket
Create a new and dedicated bucket for Secure Workload in the object store. Only the cluster should have write access to this bucket. The cluster will write objects and manage retention on the bucket. Provision at least 200 TB of storage for the bucket and obtain an access and secret key for the bucket. Data backup and restore in Secure Workload will not work with pre-authenticated links.
Note |
If you are using Cohesity as an object store, disable multi-part uploads while scheduling. |
HTTPS
The data backup option supports only HTTPS interface with the object store. This is to ensure that data in transit to the object store is encrypted and secure. If the storage SSL/TSL certificate is signed by trusted third-party CA, the cluster will use them to authenticate the object store. In case the object store uses self-signed certificate, the public key or the CA can be uploaded by selecting the Use Server CA Certificate option.
Server-side Encryption
It is strongly recommended to turn ON server-side encryption for the bucket assigned to Secure Workload cluster. The cluster will use HTTPS to transfer data to object store. However, the object store should encrypt the objects to ensure that the data at rest is secure.
To configure data backup in Secure Workload, perform the following:
Planning: The data backup option provides a planner to test the access to the object store, determine the storage requirement, and the backup duration needed for each day. This can be used to experiment before configuring a schedule.
To use data backup and restore calculators, navigate to . If data backup and restore is not configured, this will navigate to the Data Backup landing page.
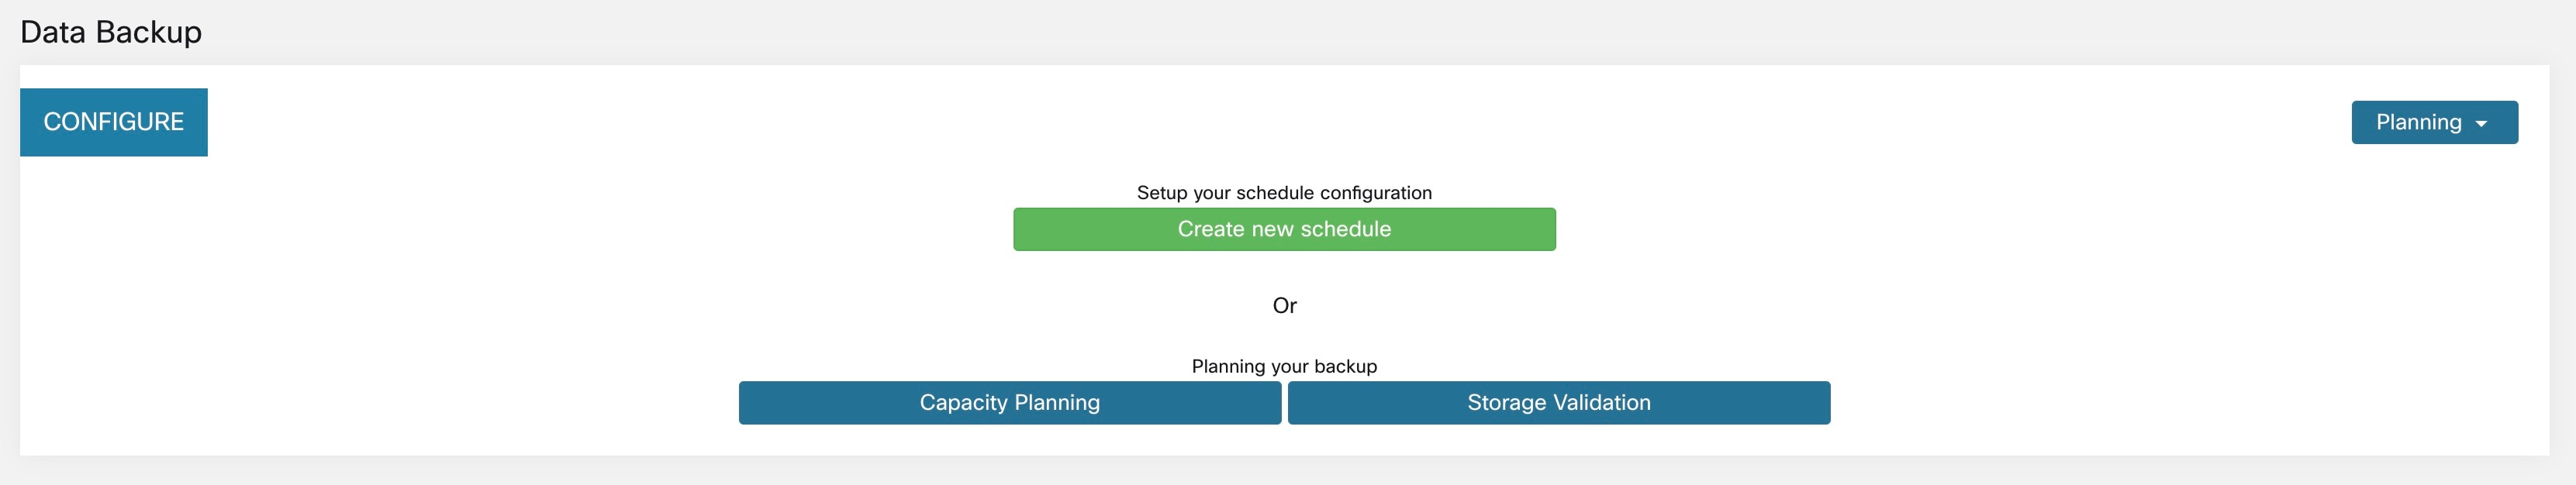
Note |
If you are unable to view the Data Backup option under Platform, ensure that you have the license to enable data backup and restore. |
Configuring and scheduling data backup: Secure Workload will copy data to object store only in the configured time-window. While configuring backup for the first time, the pre-checks will run to ensure the FQDNs are resolvable and resolves to the right IP. After the initial validation, an update is pushed to registered software agents to switch to using FQDNs. Without FQDN, the agents cannot failover to another cluster after a disaster event. To support this, agents must be upgraded to the latest version supported by the cluster and all the agents should be able to resolve the sensor VIP FQDN. As of Secure Workload release 3.3 and later, only deep visibility and enforcement agents support data backup and restore and will switch to using FQDN.
To create a schedule and configure data backup, see Configure Data Backup.
|
Step 1 |
To ensure that the storage is compatible with Secure Workload, perform one of the following actions:
|
|
Step 2 |
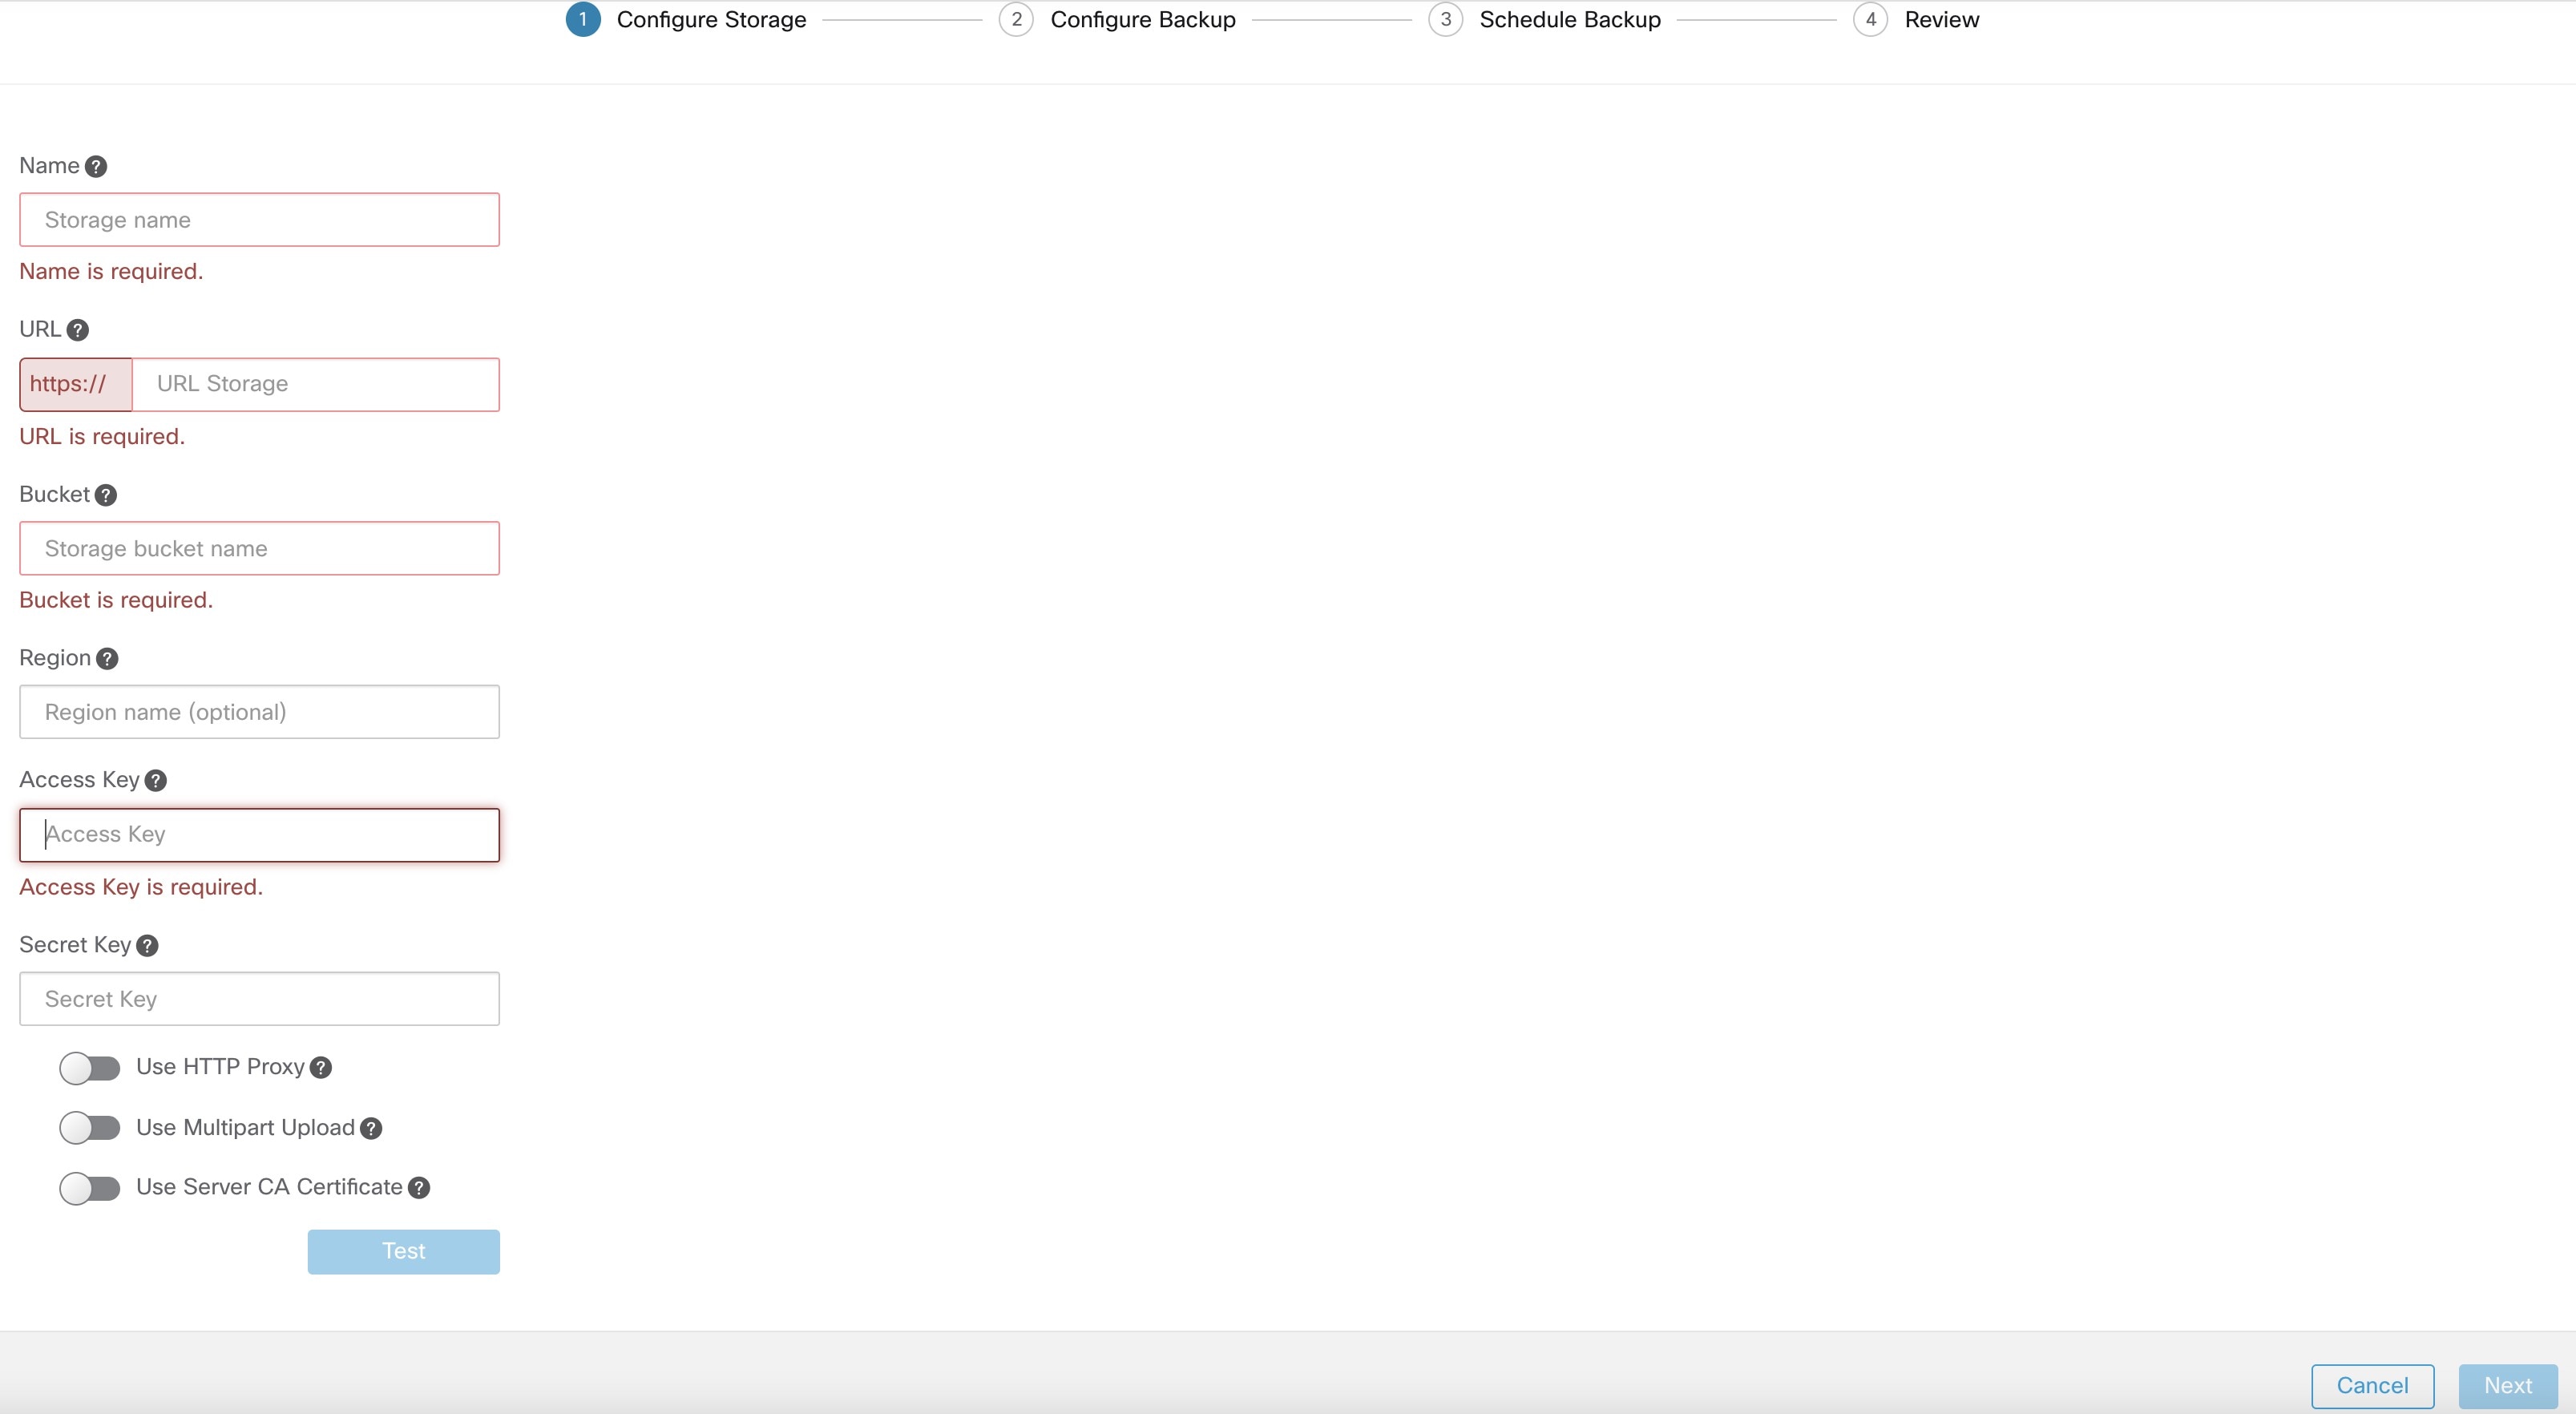
Enter the following details:
|
|
Step 3 |
(Optional) If required, you can enable HTTP proxy. |
|
Step 4 |
(Optional) To use multi-part uploads of the backed data, enable Use Multipart Upload. |
|
Step 5 |
(Optional) If a CA certificate is required to authenticate the storage server, enable Use Server CA Certificate and enter the certificate details. |
|
Step 6 |
Click Test. |
The storage validation will test:
Authentication and access to the object store and bucket.
Upload to and download from the configured bucket.
Bandwidth checks.
The storage planning process can take about five minutes to complete.
|
Step 1 |
To plan the storage size and the backup window estimates, perform one of the following actions:
|
|
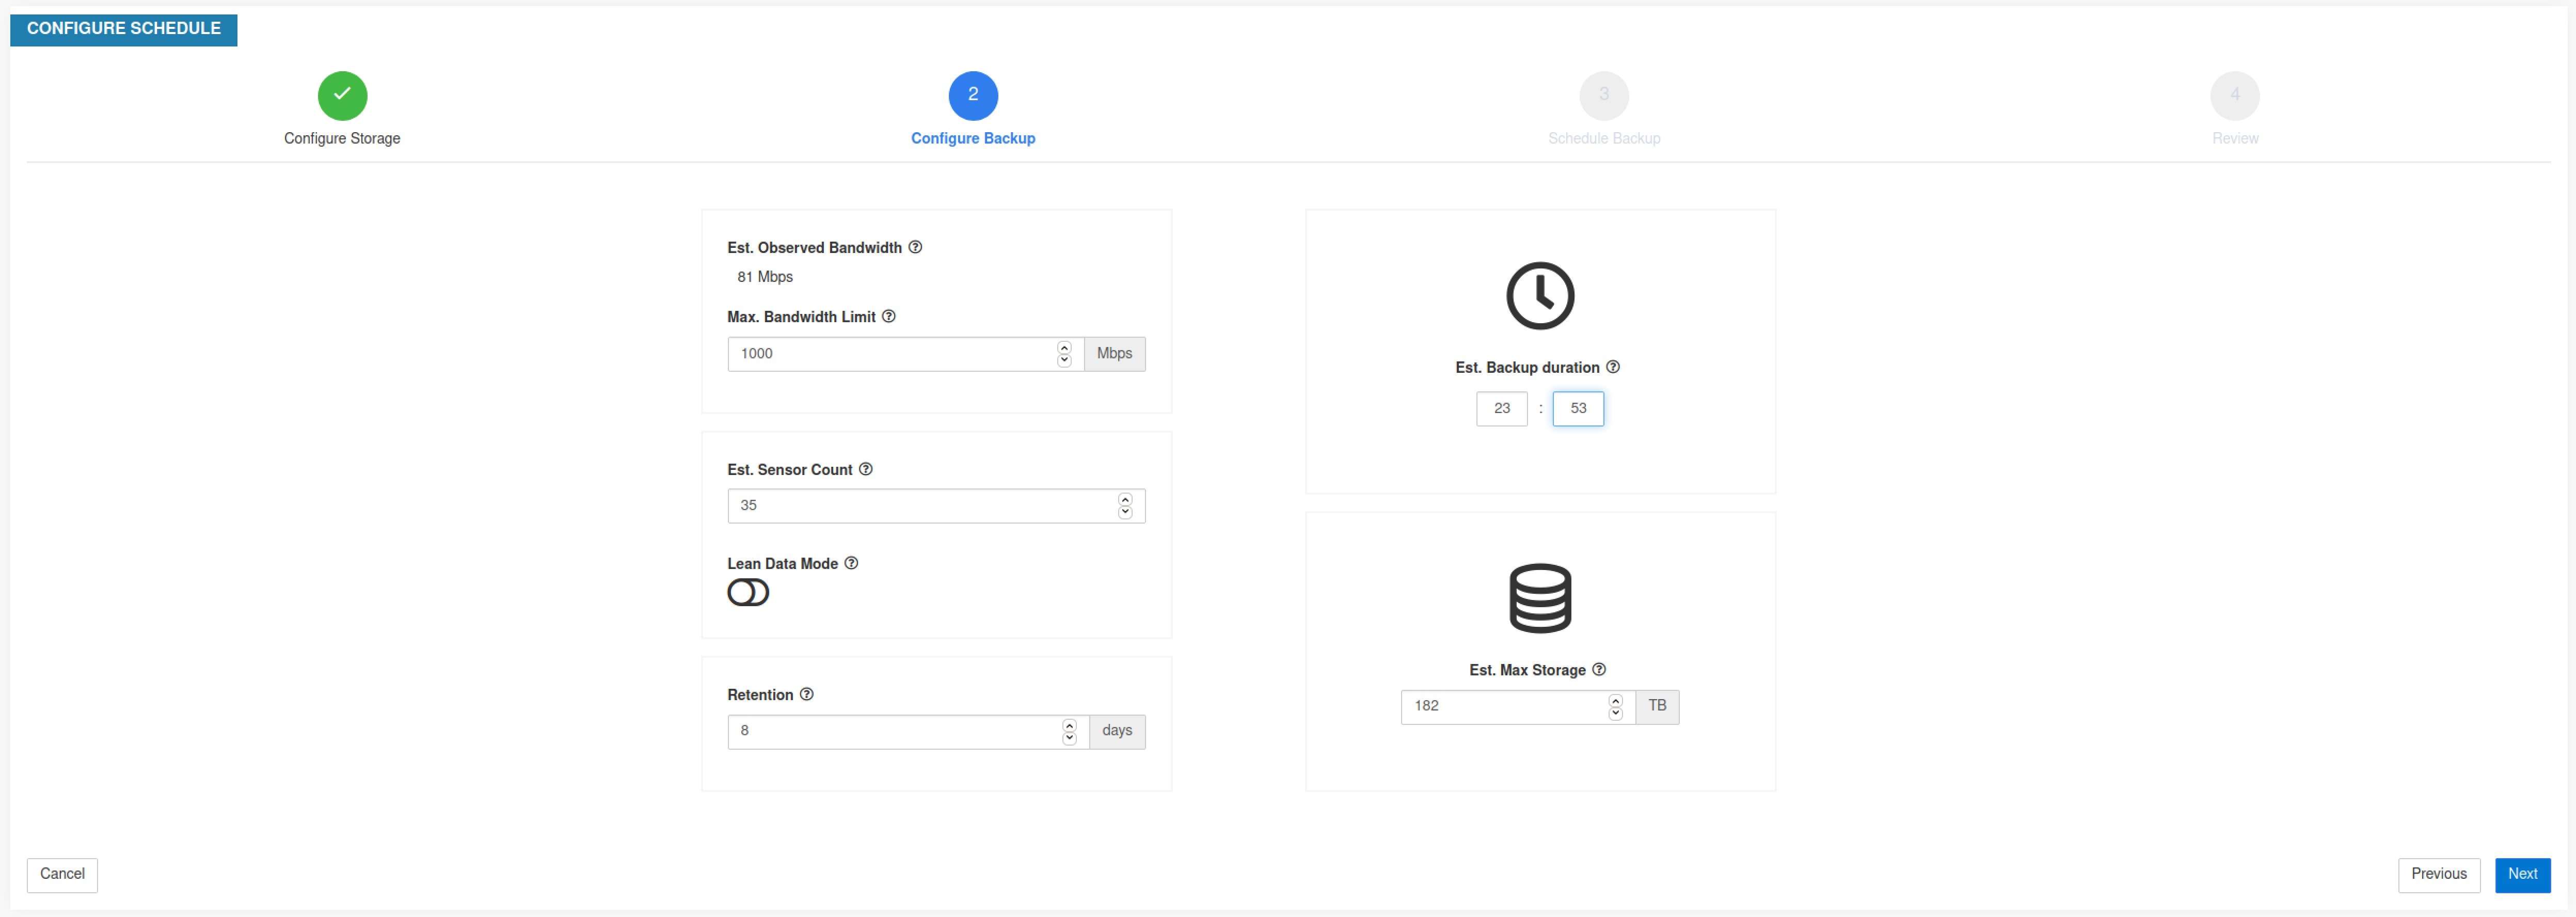
Step 2 |
Enter the maximum bandwidth limit to back up the data. This bandwidth must at most be the policer configuration that will throttle data to the object store. |
|
Step 3 |
Registered software agents count is automatically populated. Based on forecasts, you can change the agents count. |
|
Step 4 |
(Optional) Enable Lean Data Mode to exclude the non-configuration data from being backed up. Using this option reduces the storage limitation by 75%. |
|
Step 5 |
The maximum storage configured for the storage bucket. This will automatically set the retention period for the backups. |
After the required details are entered, the Estimated Backup Duration displays the time required to backup data of a day. This is an estimate based on typical agent load, estimated agents count, and the maximum bandwidth configured. The Estimated Maximum Storage displays the estimate of maximum storage required by Secure Workload to support specified retention and estimated agents count.
|
Step 1 |
On the data backup landing page, click Create new schedule. |
||
|
Step 2 |
To confirm the prerequisite checks to run, check the Approve buttons and click Proceed. The prerequisite check takes about 30 minutes to complete and are run only during the first time a schedule is configured. 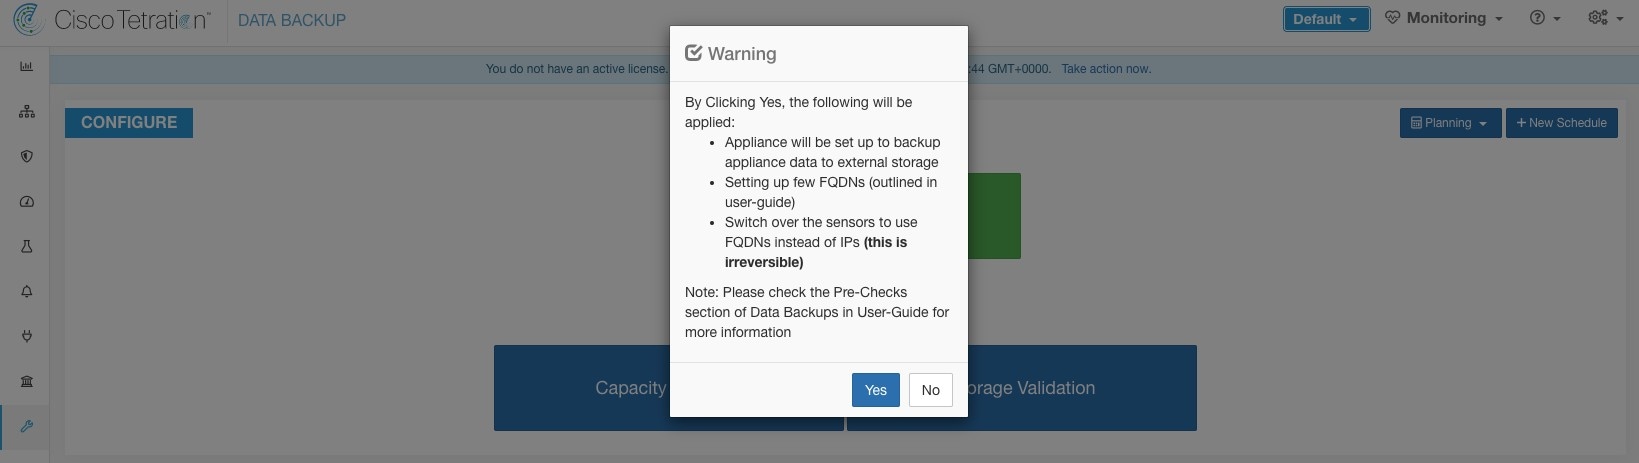
|
||
|
Step 3 |
To configure the storage, enter the following details and click Test.
|
||
|
Step 4 |
To configure the storage capacity, enter the following details:
|
||
|
Step 5 |
To schedule the backup, enable the following:
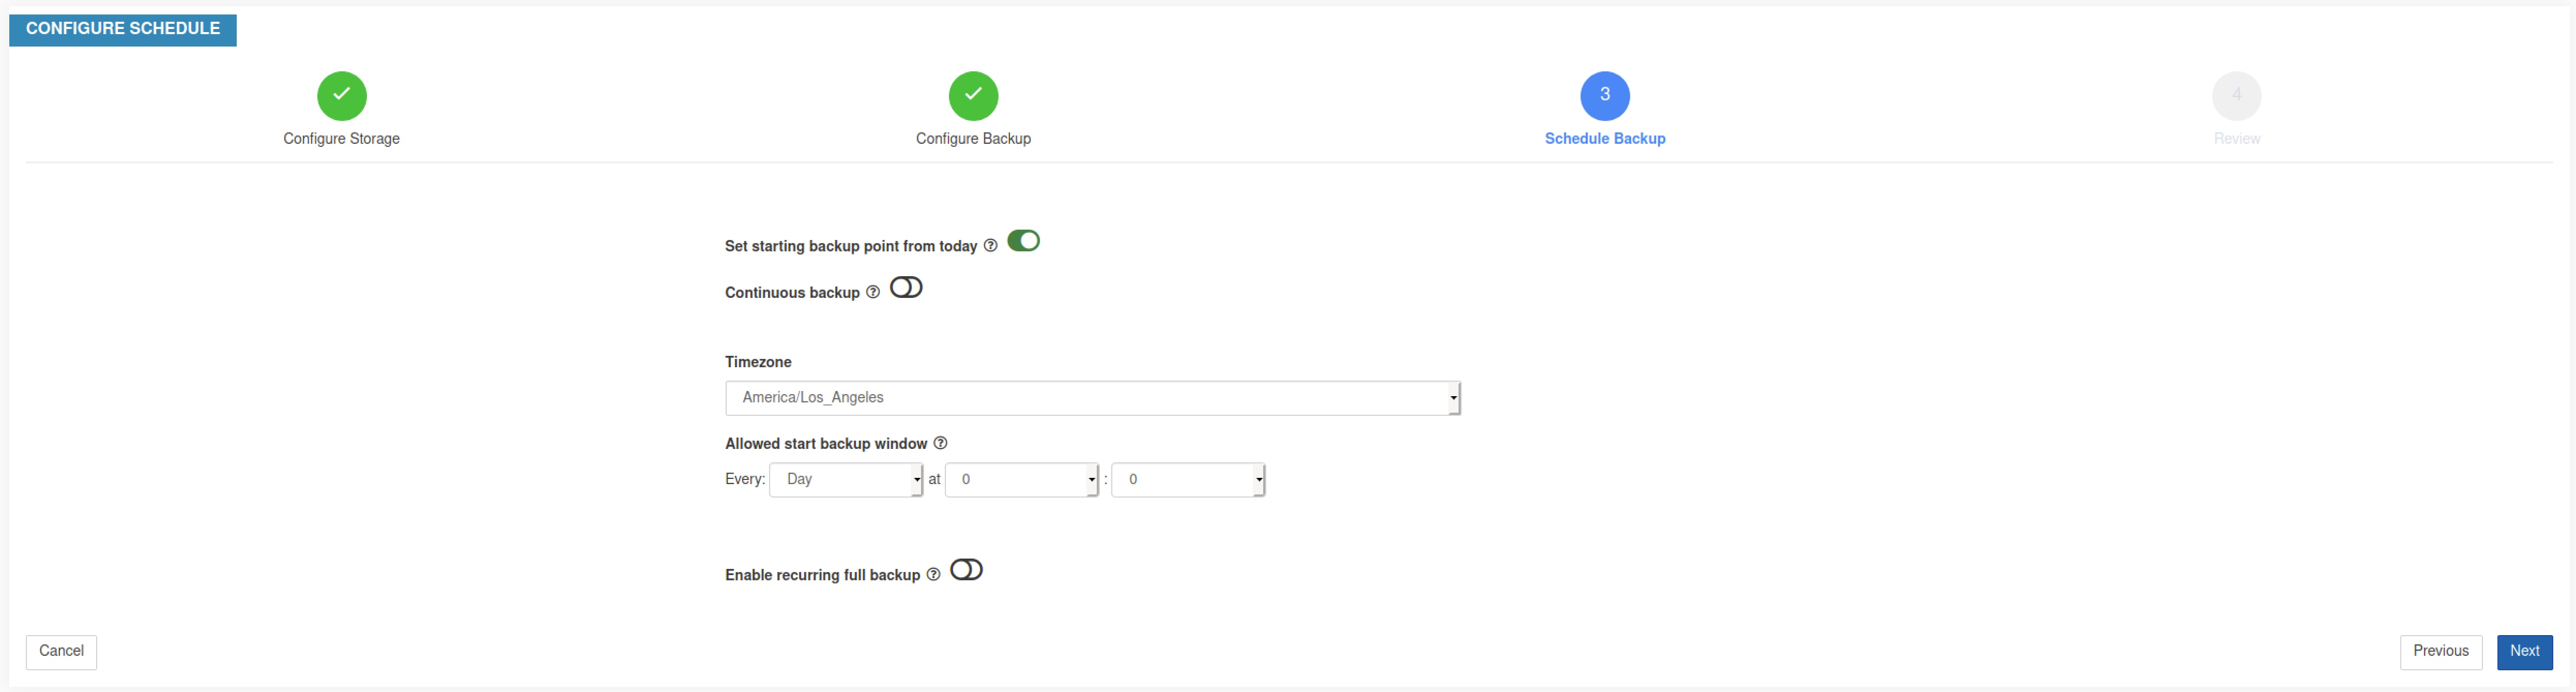
|
||
|
Step 6 |
Review the configured backup schedule and settings, and then click Initiate Job. 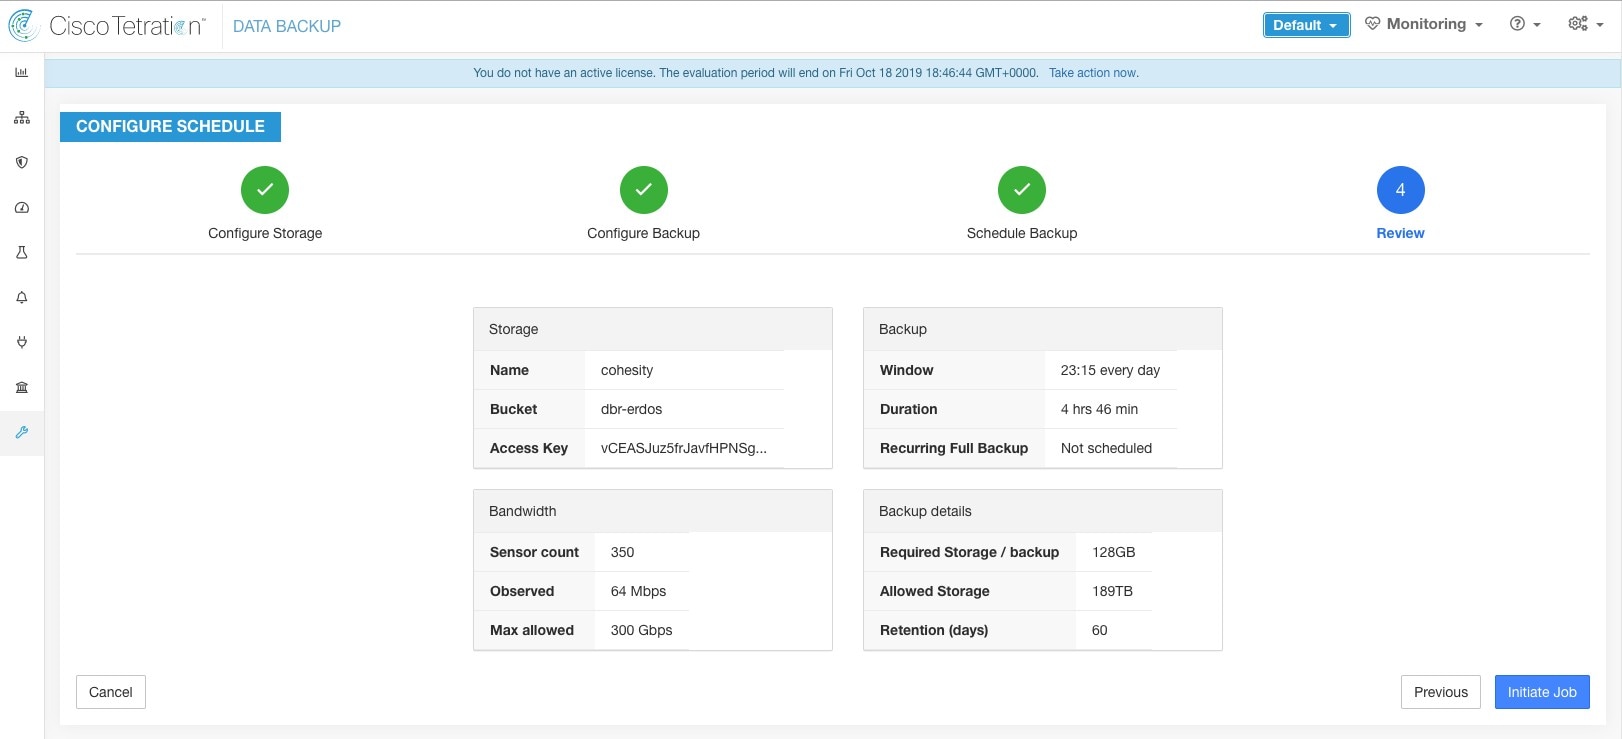
|
After the configuration of data backup, backup is triggered everyday at a scheduled time, unless continuous mode is enabled. Status of the backups can be seen on the Data Backup dashboard by navigating to .
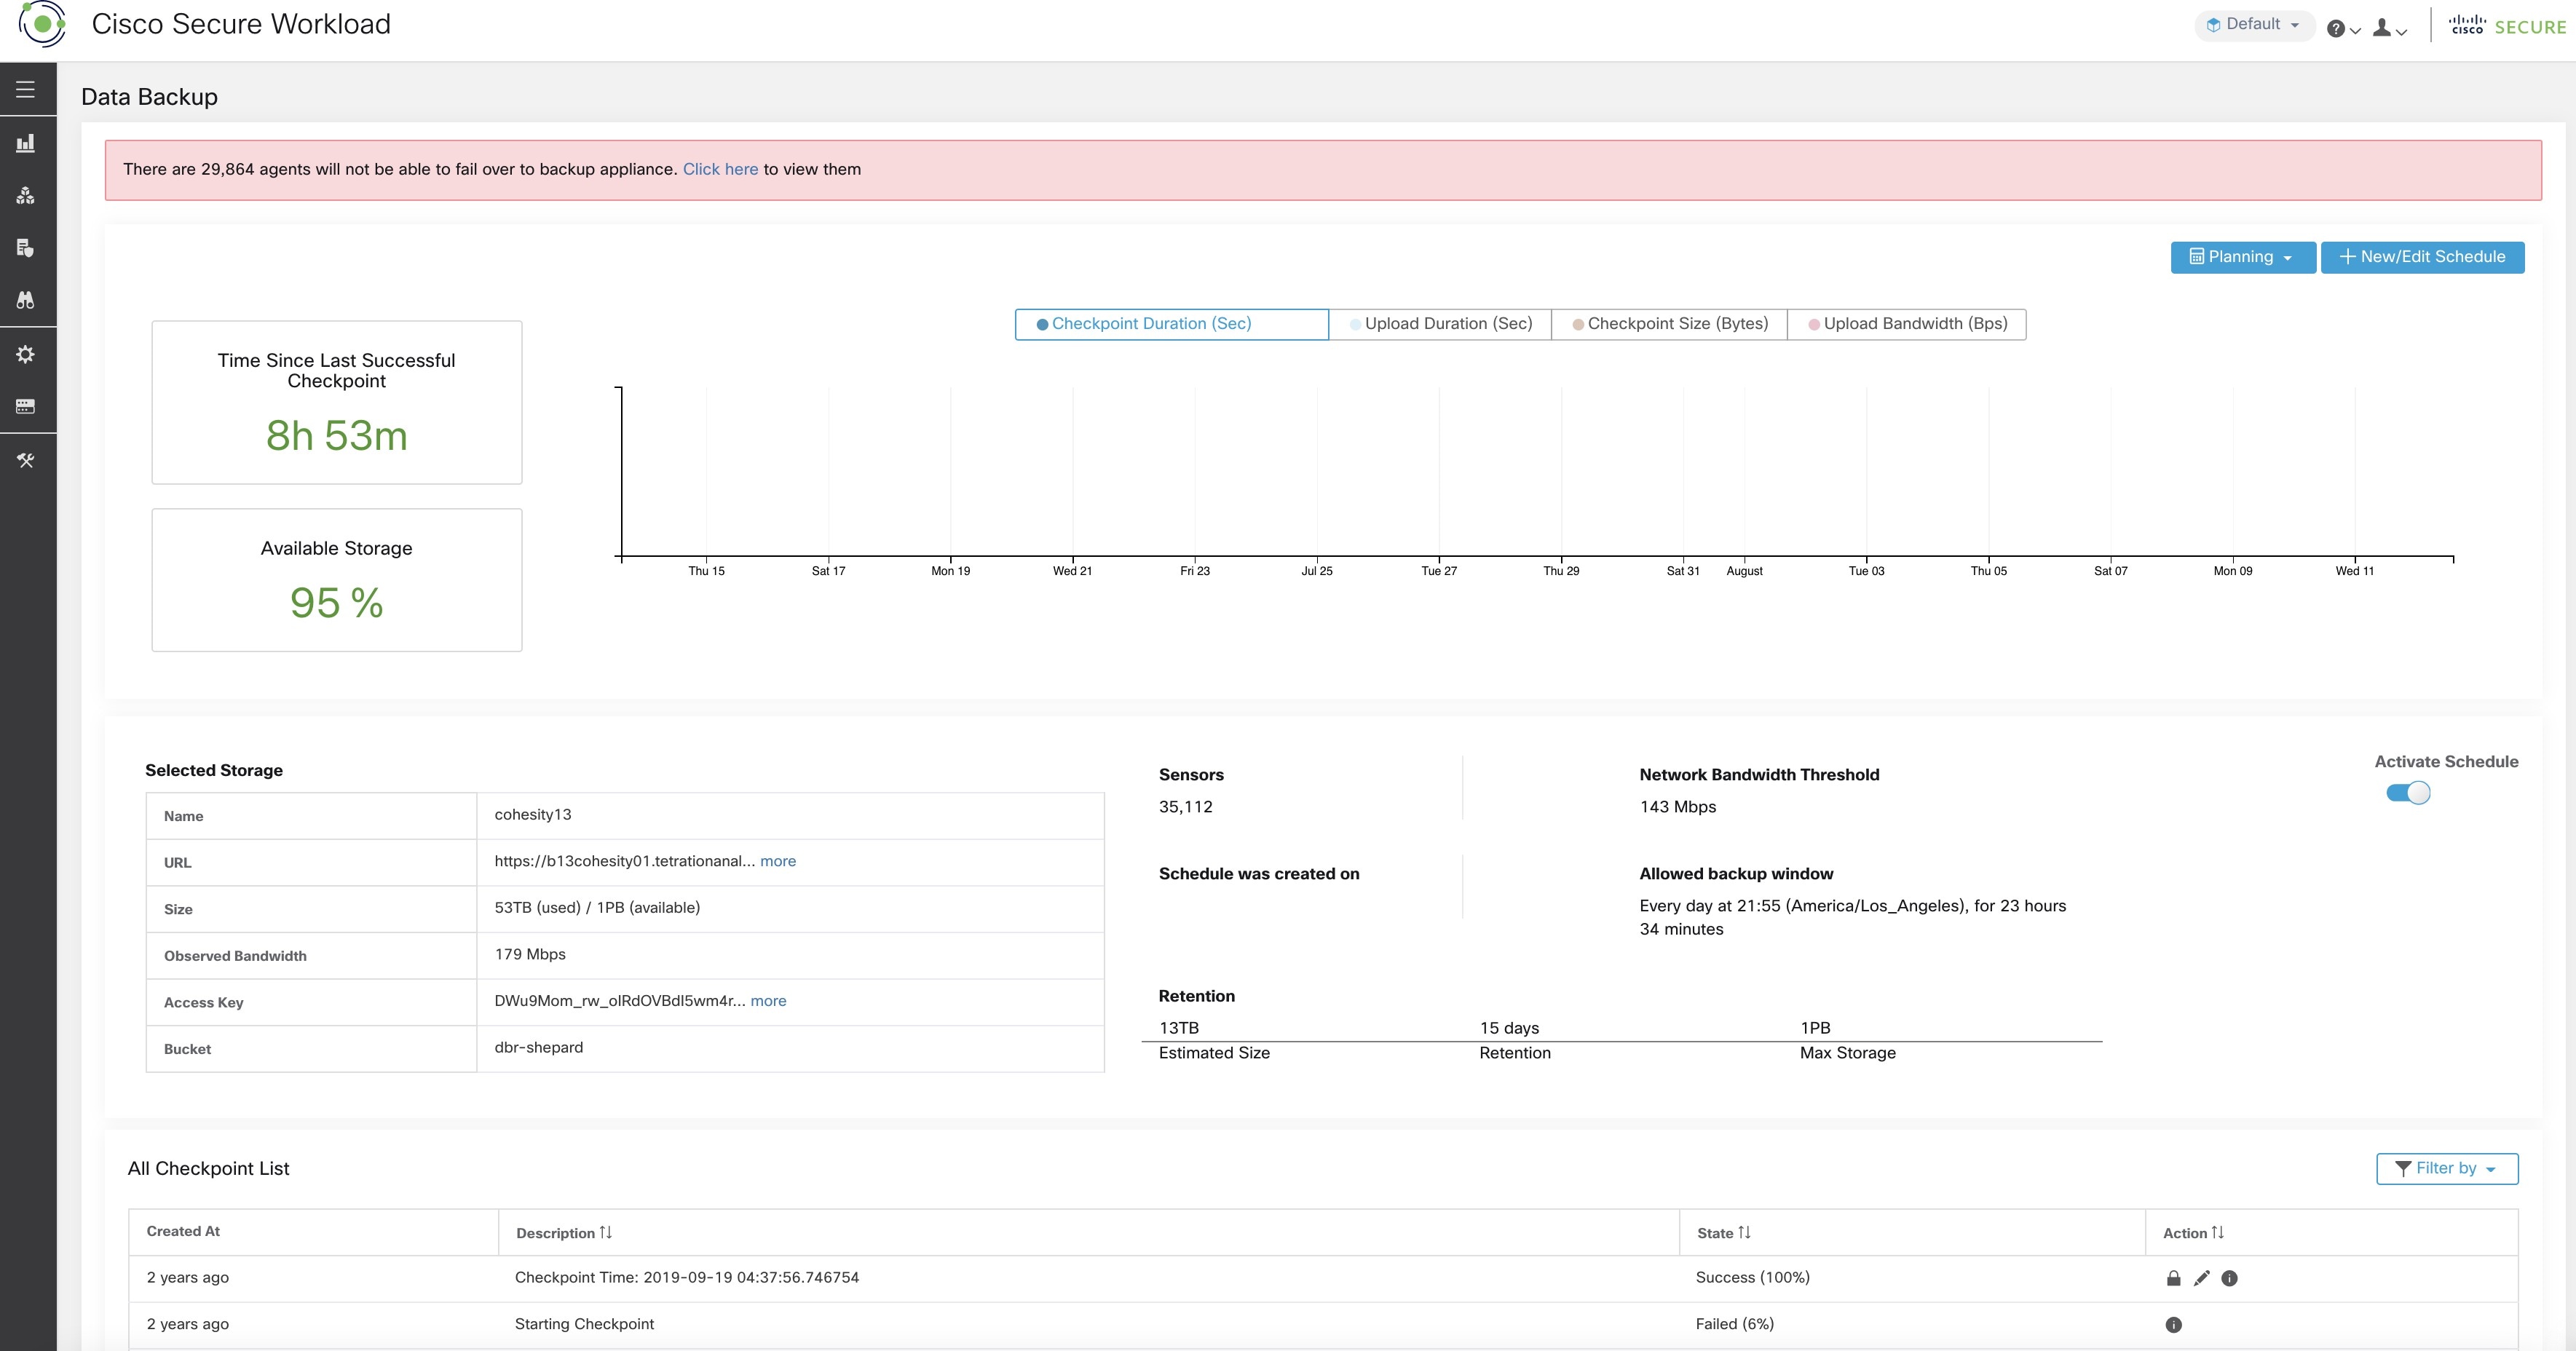
Time since last successful checkpoint should be less than 24 hours + the time it takes to checkpoint. For example, if the checkpoint + backup takes around 6 hours, then the time since last successful checkpoint should be less than 30 hours.
The following graphs provide additional information:
Checkpoint Duration: This graph shows the trendline for the amount of time the checkpoint takes.
Upload Duration: This graph shows the trendline for how long it takes to upload the checkpoint to the backup.
Checkpoint Size: This graph shows the trendline for the size of the checkpoint.
Upload Bandwidth: This graph shows the trendline for the upload bandwidth.
The table shows all the checkpoints. Checkpoint labels can be edited and the labels will be available while choosing a checkpoint to restore data on the standby cluster.
A checkpoint transitions through multiple states and these are the possible states:
Created/Pending: Checkpoint is just created and waiting to be copied
Running: Data is getting actively backed up to external storage
Success: Checkpoint is complete and is successful; can be used for data restore
Failed: Checkpoint is complete and has failed; cannot be used for data restore
Deleting/Deleted: An aged-out checkpoint is being deleted or is deleted
To change the schedule or the bucket, click on Edit Schedule. To complete the wizard, see the Configure Data Backup section.
To troubleshoot any errors during the creation of checkpoints, see Troubleshooting: Data Backup and Restore.
Backups can be deactivated by clicking the Deactivate Schedule button. It is recommended to deactivate the backup schedule before making changes to the schedule. Deactivate a schedule only when no checkpoint is in progress. Running a test or disabling the schedule while a checkpoint is in progress may cause the checkpoint in progress to fail and the upload to be in an undefined state.
Secure Workload cluster manages the lifecycle of objects in the bucket. You must not delete or add objects to the bucket. Doing so may lead to inconsistencies and corrupt successful checkpoints. In the configuration wizard, the maximum storage to be used must be specified. Secure Workload will ensure the usage of bucket will stay within the configured limit. There is a storage retention service that ages out objects and deletes them from the bucket. After the storage usage reaches a threshold (80% of the bucket capacity), computed based on the configured maximum storage and incoming data rate, the retention will try to delete un-preserved checkpoints to reduce the usage to below the threshold. The retention will also keep a minimum of two successful checkpoints at any time and all the preserved checkpoints, whichever is more. If retention cannot delete any checkpoints to make space, checkpoints will start failing.
As new checkpoints are created, old ones will age-out and are deleted. However, checkpoints can be preserved, preventing it from being deleted by retention. A preserved checkpoint will not be deleted. If there are multiple preserved checkpoints, at some point the storage will be insufficient for new objects and aged-out checkpoints cannot be deleted because they were preserved. As a best practice, preserve checkpoints on a need basis and update the Label for the checkpoint with the reason and validity as a reference. To preserve a checkpoint, click on the lock icon against the required checkpoint.
The data restore option is available under the Platform menu in the left navigation bar.
A cluster must be in the DBR standby mode to be restored using backed up data. Currently, a cluster can be set to standby mode only during initial setup.
Following combinations are allowed:
|
Primary Cluster SKU |
Standby Cluster SKU |
|---|---|
|
8RU-PROD |
8RU-PROD, 8RU-M5 |
|
8RU-M5 |
8RU-PROD, 8RU-M5 |
|
39RU-GEN1 |
39RU-GEN1, 39RU-M5 |
|
39RU-M5 |
39RU-GEN1, 39RU-M5 |
Note |
Contact Cisco Technical Assistance Center to initiate data restore. |
A cluster can be deployed in the Standby mode by configuring the recovery options in site information. While configuring site information during deployment, configure the restore details under the Recovery tab in the setup UI during deployment.
There are three modes to deploy a standby and for all the three modes, configure these settings:
Set the Standby Config to On. This configuration cannot be changed once set until the cluster is redeployed.
Configure primary cluster name and FQDNs. This configuration can be changed subsequently.
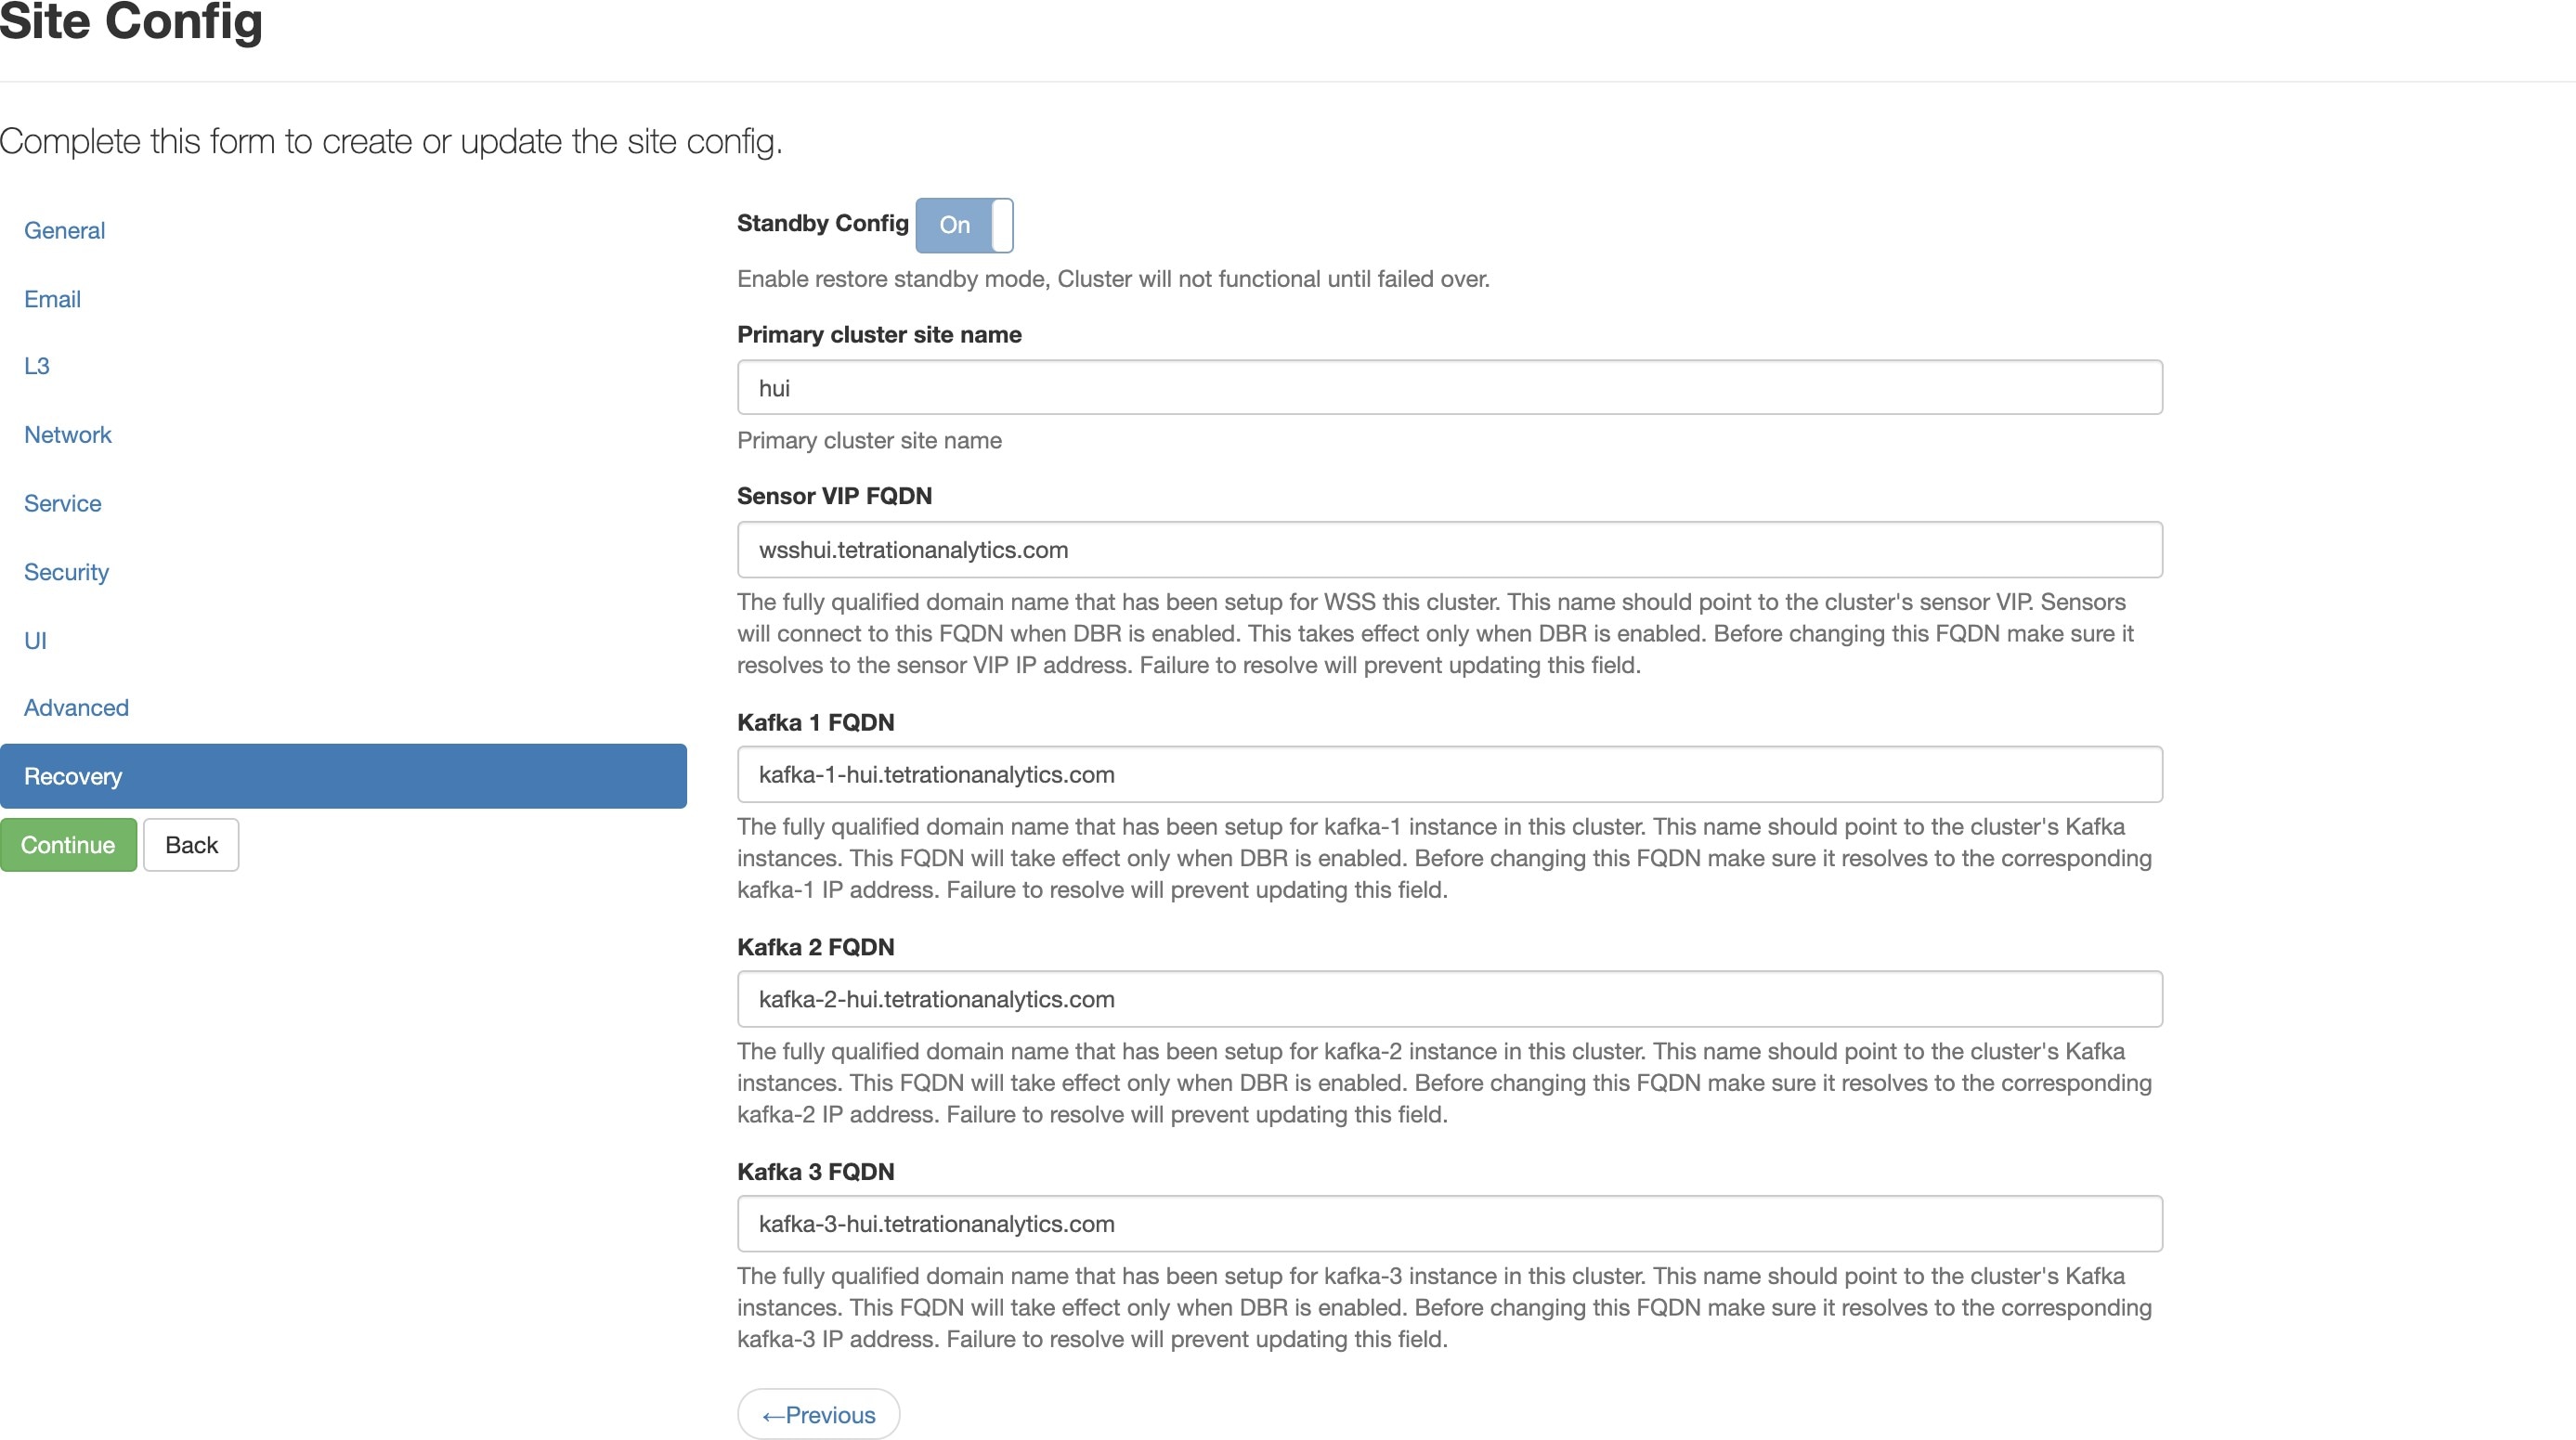
Rest of the deployment is same as a regular deployment of Secure Workload cluster.
A banner is displayed on the Secure Workload UI after the cluster enters the standby mode.
Primary cluster name and FQDNs can be reconfigured after the deployment to enable the standby cluster to track another cluster. This can be reconfigured at a later time before failover is triggered from the Cluster Configuration page.
Cold Standby: There is no standby cluster. However, the primary cluster backs the data to S3. During a disaster, a new cluster (or the same cluster as primary) needs to be provisioned, deployed in standby mode and restored.
Warm Standby: A standby cluster is operational and deployed in standby mode. It periodically fetches state from S3 cluster and places it in the ready state to be operational in case of a disaster. During a disaster, log in to this new cluster and trigger a failover.
Luke Warm Standby: Multiple primary clusters are backed by fewer standby clusters. The standby cluster is deployed in standby mode. Only after a disaster, the storage bucket information is configured, data is prefetched, and cluster is restored.
Before the cluster can be restored, it must prefetch data. The checkpoint data is prefetched from the same storage bucket that is used for backing up data. Credentials must be provided for the backup service to download from the storage. If a storage is not set up for prefetch, the Data Restore tab will launch the setup wizard.
Note |
Standby cluster interacts only with the S3 storage. When the backup on Primary cluster is updated to use a different storage or bucket, the storage on standby cluster must be updated. |
After the information is validated, storage is automatically configured for prefetch. The restore tab will display the prefetch status.
The status page displays the following details:
The upper left section has a graphic indicating readiness of various components for starting a restore. To check the data, hover over the components. The associated data is displayed in the upper right section.
Bucket: Displays the prefetch status. If the latest data is more than 45 minutes old, it shows up in red. Note that latest data being more than 45 minutes old is not a concern if the backup on the active takes more than 45 minutes for each checkpoint.
DNS: Displays the Kafka and WSS FQDN resolutions with respect to standby cluster IP addresses. During restore, if the FQDNs are not updated to standby cluster IP addresses, the agent cannot connect. After the FQDNs start resolving to the standby cluster, status will turn green.
Agents: Displays the number of software agents that have successfully switched over to the standby cluster. This is only relevant after a restore has been triggered.
The upper right section displays the information relevant to the chosen graphic in the left section. Clicking Restore Now will initiate the restore process.
The lower left section displays the prefetch storage settings that are in use.
The lower right section displays a graph of prefetch delays.
A data prefetch updates several necessary components to ensure a fast restore. If a data prefetch is unable to complete, the reason for failure is displayed on the status page.
Common errors that can cause prefetch failures:
S3 Access Error: In this case the data from the storage could not be successfully downloaded. This may happen due to invalid credentials, a change in the storage policies, or temporary network issues.
Incompatible Cluster Versions: Data can be restored to a cluster running the same version (including the same patch version) of Secure Workload as the primary cluster. This can likely happen during upgrades when only one of the cluster is upgraded. Or, during deploy when a different version is used for deploying. Deploying the clusters to a common version will resolve the issue.
Incompatible SKU Versions: Note down the allowed SKUs for standby clusters for the primary cluster. Only specific SKUs are allowed for restore of the primary cluster SKU.
A cluster restore can be triggered by clicking Restore Now in the upper right section of the Restore Status page. Before a restore action can be triggered, an acknowledgement is asked.
Cluster data is restored in two phases:
Mandatory Phase: The data needed to restart services is restored first. The time taken by mandatory phase depends on the configuration, number of software agents installed, amount of data backed up, and flow metadata. During the mandatory phase, the UI is not accessible. Working TA guest keys are required for any support during mandatory the phase, should such a need arise.
Lazy Phase: Cluster data (including flow data) is restored in the background and will not block cluster usage. The cluster UI is accessible and a banner with the completed percentage of restore is displayed. During this phase, the cluster is operational and data pipelines function normally and the flow searches are also available.
After the Mandatory Phase of the restore is complete and the UI is accessible, the changes in the cluster must be communicated to the software agents. In the DNS server used by the agents, the IP address associated with the cluster’s FQDN must be updated, and the DNS entry should point to the restored cluster. A DNS lookup is triggered by the agents when the connection to the primary cluster is broken. Based on the updated DNS entry, the agents will connect to the restored cluster.
This section describes the Recovery Time Objective (RTO) and Recovery Point Objective (RPO) for the data backup and restore solution.
A backup initiated on the primary cluster requires some time to complete depending on the amount of data being backed up and the backup configuration. The different modes of backup defines the RPO for the solution.
If scheduled, non-continuous backup is used and the backup is initiated once in a day. If a disaster occurs then the maximum time of lost data will be approximately 24 hours, plus time taken to copy the data to the backup storage. Therefore, the RPO is at least 24 hours.
If continuous mode backup is used then a new backup is initiated 15 minutes after the previous backup. Each backup consumes a certain amount of time to create and then a certain amount of time to upload the data to the backup storage. The first backup is a full backup and the subsequent backups are incremental backups, the incremental backups do not take much time. If a disaster occurs, the amount of the data lost will be the sum of the time taken to create the backup and the time taken to upload the backup to the storage. Typically the RPO in this case will be approximately a few minutes to an hour.
When restoring a cluster, mandatory data is first prefetched from the storage, then mandatory restore phase is triggered. The UI is not available during the mandatory restore phase. After the mandatory restore is complete, the UI is available for usage. The rest of the data is restored in the lazy restore phase. RTO in this case is the time taken until the UI is available for usage after mandatory phase is complete. RTO depends on the standby deployment mode.
Cold Standby Mode: In this mode, the cluster must be deployed first which takes approximately a few hours. The cluster must then be configured with the backup storage credentials. Since this is the first time the backup is uploaded into the standby cluster, there will be a lot of mandatory data that needs to be retrieved and processed. The time for prefetch is approximately tens of minutes (depending on the quantity of data backed up). The mandatory restore phase takes approximately 30 minutes to complete. Together this forms the RTO time of approximately a few hours, primarily due to the time taken to boot and deploy the cluster.
Luke Warm Standby Mode: In this mode, the cluster is already deployed but the backup storage is not configured. The cluster must be configured with the backup storage credentials. Since this is the first time the backup is uploaded into the standby cluster, there will be a lot of mandatory data that needs to be retrieved and processed. The time for prefetch is approximately tens of minutes (depending on the quantity of data backed up). The mandatory restore phase takes approximately 30 minutes to complete. Together this forms the RTO time of approximately an hour to two hours, depending on the amount of data backed up and time to pull the data from backup storage.
Warm Standby Mode: In this mode, the cluster is already deployed, the backup storage is configured, and prefetch is retrieving data from the storage. The cluster can now be restored, which will trigger the mandatory restore phase, which takes approximately 30 minutes to complete. This forms the RTO time of approximately 30 minutes. Note that there is some delay from when the backup is uploaded from the active to the storage to the time the backup is pulled by the standby. This is approximately a few minutes. If the latest backup from the active (prior to it experiencing a disaster event) has not been prefetched to the standby, you must wait for a few minutes for it to be retrieved.
When data backup and restore is enabled on the cluster, it is recommended to deactivate the schedule before starting the upgrade. See Deactivating Backup Schedule. This ensures that a successful backup exists before upgrade is started and that no new backup is being uploaded. A schedule must be deactivated when a checkpoint is not in progress, to avoid creating a failed checkpoint.
If the storage test is unsuccessful, identify the failure scenarios displayed on the right pane and ensure that:
S3 compliant storage URL is correct
The access and secret keys of the storage are correct
Bucket on the storage exists and correct access (read/write) permissions are granted
Proxy is configured if the storage needs to be accessed directly
The multi-part upload option is disabled if you are using Cohesity
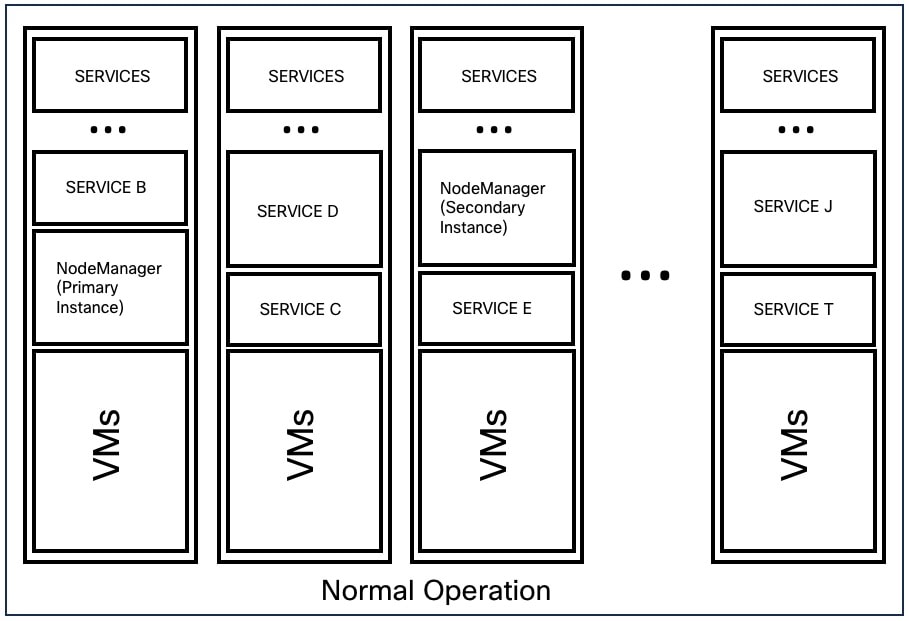
Secure Workload provides high availability when there is a probability of services, nodes, and VMs failing. High availability provides recovery methods by ensuring minimum downtime and minimal intervention by the site administrator.
In Secure Workload, services are distributed across the nodes in a cluster. Multiple instances of services run simultaneously across the nodes. A primary instance and one or more secondary instances are configured for high availability across multiple nodes. When the primary instance of a service fails, a secondary instance of the service renders as primary and becomes active immediately.
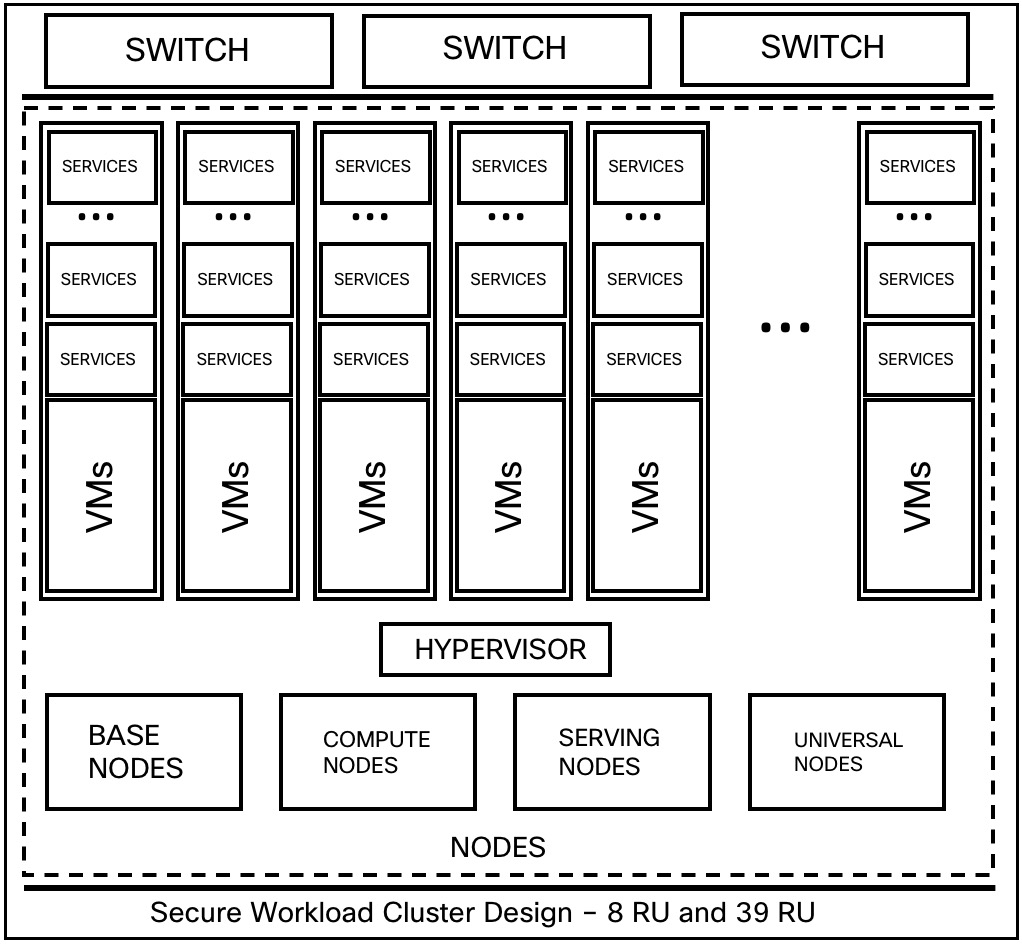
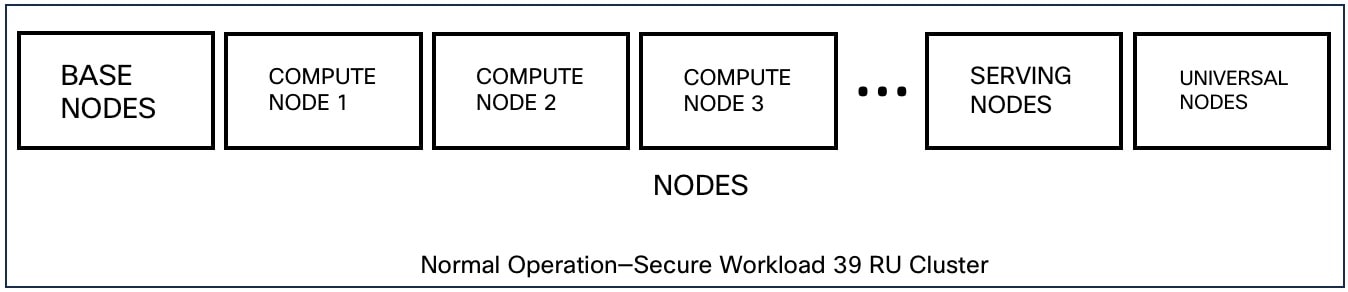
The key components of a Secure Workload cluster are:
Bare metal servers that host multiple VMs, which in turn, host many services.
Cisco UCS C-Series Rack Servers with Cisco Nexus 9300 Series switches that contribute to an integrated high-performance network.
Hardware-based appliance models in either a small or large form factor to support a specific number of workloads:
Small form factor deployment with six servers and two Cisco Nexus 9300 switches.
Large form factor deployment with 36 servers and three Cisco Nexus 9300 switches.
|
Attributes/ Form Factor |
8 RU |
39 RU |
|---|---|---|
|
Number of nodes |
6 |
36 |
|
Number of compute nodes |
— |
16 |
|
Number of base nodes |
— |
12 |
|
Number of serving nodes |
— |
8 |
|
Number of universal nodes |
6 |
— |
|
Number of VMs |
50 |
106 |
|
Number of collectors |
6 |
16 |
|
Number of network switches |
2 |
3 |
In both the form factors (8RU and 39RU) of a cluster, if a failed node is hosting a Hadoop NameNode VM, manual intervention is required to fail over to a secondary namenode VM.
Note |
The failover is not automatic in Secure Workload Release 3.8.x and earlier. |
For a 2 VM or 3 VM service, such as orchestrators, Redis, MongoDB, Elasticsearch, enforcementpolicystore, AppServer, ZooKeeper, TSDB, Grafana, and so on, only a single VM failure is supported; a second VM failure renders the service inactive.
There is no impact to the cluster operation at any point in time.
There is no single point of failure. If any of the nodes or VMs within a cluster fail, it does not result in the failure of the entire cluster.
There is minimal downtime in recovery from failure because of services, nodes, or VMs.
There is no impact on the connections that are maintained by software agents to a Secure Workload cluster. The agents communicate with all the available collectors in the cluster. If a collector or VM fails, the software agents’ connections to the other instances of the collectors ensure that the flow of data is not interrupted and there is no loss of functionality.
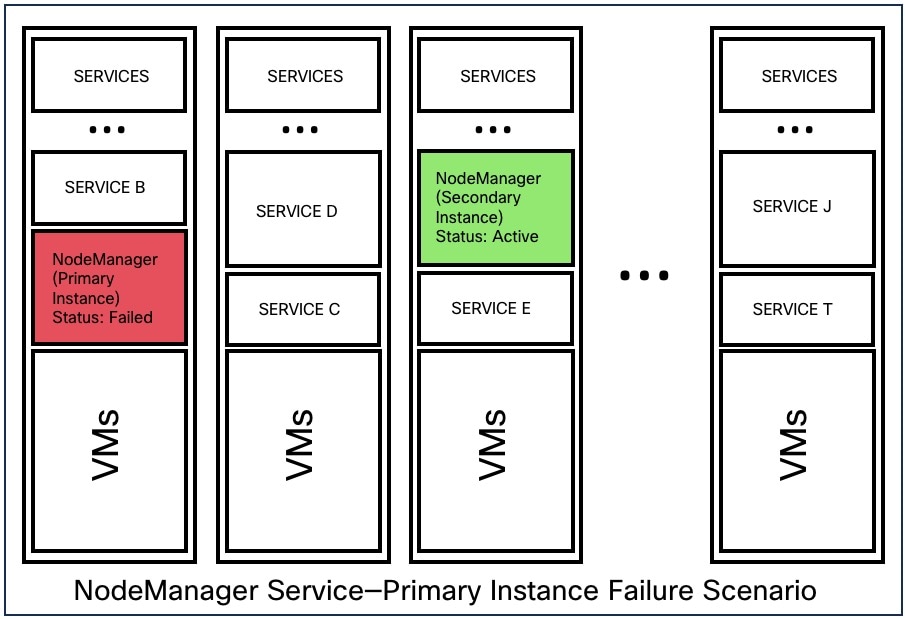
The cluster services communicate with external orchestrators. When the primary instance of a service fails, the secondary instances take over to ensure the communication with external orchestrators is not lost.
High availability supports the following failure scenarios:
Services Failure
VM Failure
Node Failure
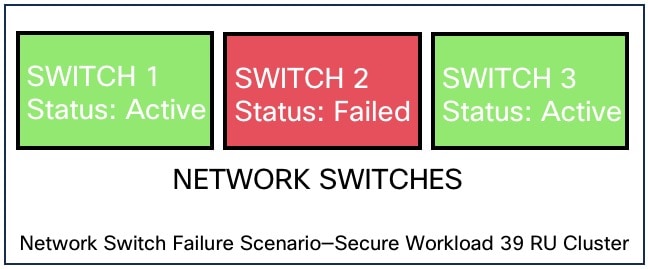
Network Switch Failure
When a service fails on a node, another instance of that particular service picks up the functions of the failed service and continues to run.
|
Impact |
No visible impact. |
|
Recovery |
|
When one of the VMs fails, secondary VMs are available. The services on the secondary VMs pick up the services that the failed VM was running. Meanwhile, Secure Workload restarts the failed VM to recover it. For example, as illustrated in the Figure: Failure Scenario of a VM, when a VM, in this instance, VM1, fails, the services running on it also fails. The secondary VMs continue to be operational and the secondary instances pick up the services that the failed VM was running.
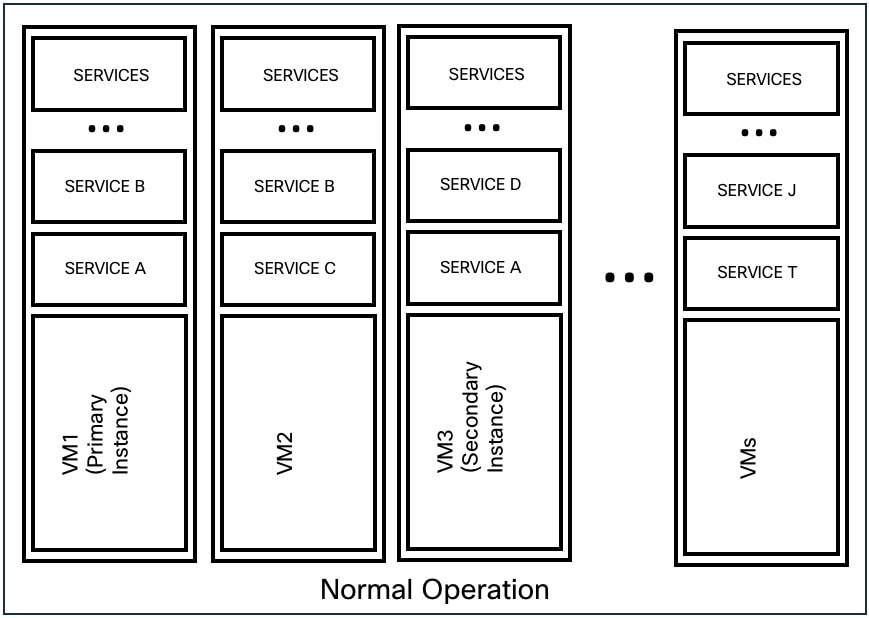
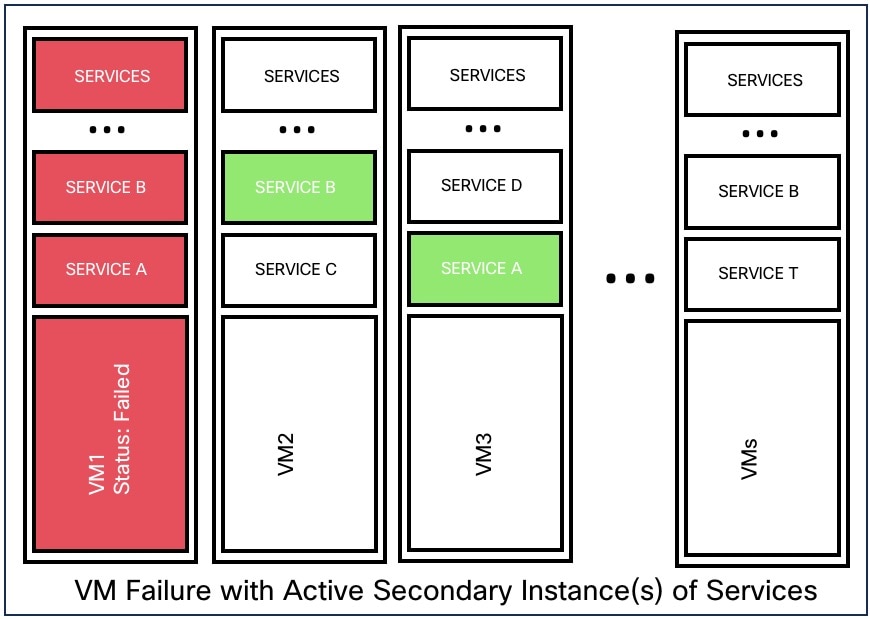
For services provided by symmetric VMs, such as collectordatamovers, datanode, nodemanager, and druidHistoricalBroker VMs, multiple VMs can fail but the applications will continue to function at reduced capacity.
|
Service Type |
Total VMs |
Number of VM Failures Supported |
|---|---|---|
|
Datanode |
6 |
4 |
|
DruidHistorical |
4 |
2 |
|
CollectorDataMover |
6 |
5 |
|
NodeManager |
6 |
4 |
|
UI/ AppServer |
2 |
1 |
Note |
The nonsymmetric VM types tolerate only one VM failure before the corresponding services are rendered unavailable. |
|
Impact |
No visible impact. |
|
Recovery |
|
|
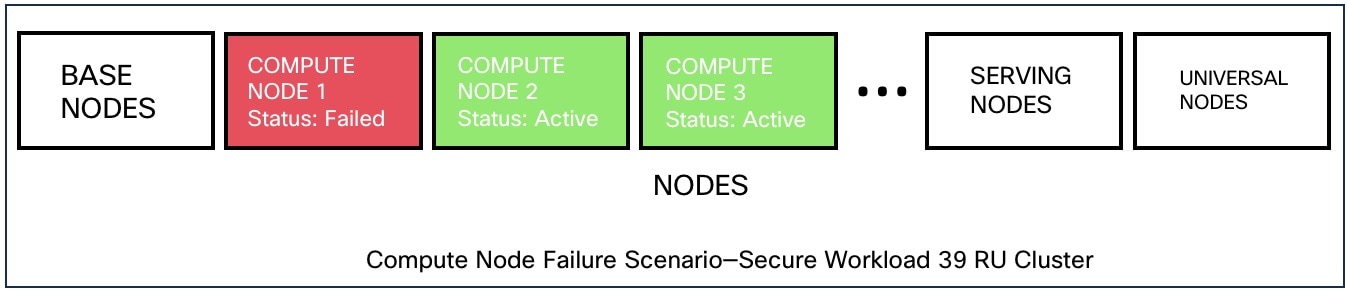
Node Failures |
8 RU |
39 RU |
|---|---|---|
|
Number of node failures that are tolerated for high availability |
1 |
1* |
* In 39 RU clusters, single node failure is always tolerated. A second node failure might be allowed as long as the two failed nodes do not host VMs for a 2 VM or 3 VM service, such as orchestrators, Redis, MongoDB, Elasticsearch, enforcementpolicystore, AppServer, ZooKeeper, TSDB, Grafana, and so on. In general, the second node failure results in a critical service becoming unavailable because of two VMs being affected.
 Caution |
We recommend that you immediately restore the failed node because the failure of a second node will most likely result in an outage. |
|
Impact |
No impact in the functionality of the cluster. However, contact Cisco Technical Assistance Center to replace the failed node immediately. Failure of a second node will most likely result in an outage. |
|
Recovery |
|
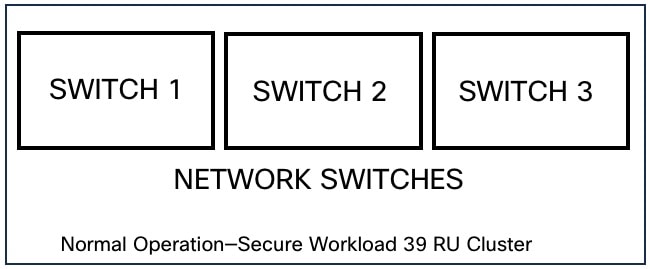
The switches in Secure Workload always remain active. In the 8RU form-factor deployment, there is no impact if a switch fails. In the 39RU form-factor deployment, the clusters experience half the input capacity if a switch fails.
Note |
The switches in the Secure Workload cluster do not have the recommended port density to support the VPC configuration for public networks. |
|
Form Factor |
8 RU |
39 RU |
||||
|---|---|---|---|---|---|---|
|
Number of switch failures that are tolerated for high availability |
1
|
1
|
|
Impact |
|
|
Recovery |
|
The Virtual Machine page under the Troubleshoot menu displays all virtual machines that are part of the Cisco Secure Workload cluster. It displays their deployment status during cluster bring up or upgrade (if any) and also public IPs. Note that all VMs in the cluster are not part of a public network therefore they may not have a public IP.
To access upgrade options, choose in the left navigation bar.
There are two types of upgrade. This section describes the full upgrade process. During this upgrade all VMs in the cluster except for Orchestrator-VMs are shut down, new VMs are deployed, and the services are re-provisioned. All the data within the cluster are persisted during this upgrade. Except a downtime of around 2 hours during this upgrade.
To initiate an upgrade, choose in the left navigation bar. You can upgrade, patch upgrade, shutdown, or reboot the cluster.
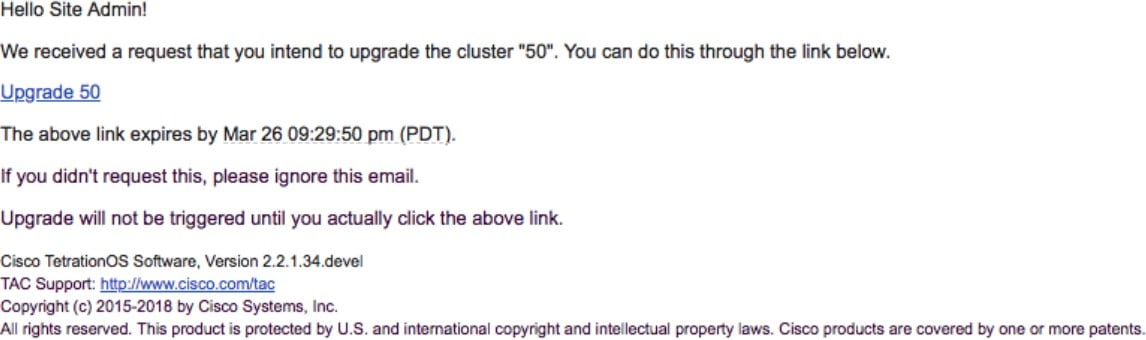
To initiate a full upgrade, click Send Upgrade Link. During the full upgrade process, the VMs are powered off, except the orchestrator VMs, and upgrade them and redeploy them. This results in 2+ hours of cluster downtime. Patch upgrade minimizes the downtime, but just updating the services that must be patched and will not result in VM restarts. The downtime is usually in the order of few minutes. To initiate Patch Upgrade, click Send Patch Upgrade Link. Use Send Reboot Link to initiate cluster reboot after a power down. Clicking on either of these links generate an email with a link in it and will send it to the user who initiated the upgrade.
Before sending the email, orchestrator runs several verification checks to make sure the cluster is upgradable. The checks include:
Checks to see there are no decommissioned nodes.
Checks each bare metal to make sure there are no hardware failures. This covers:
Drive failure
Drive predicted Failure.
Drive missing.
StorCLI failures
MCE log failures
Checks to ensure we have all the BMs in commissioned state. Nothing fewer than 36 servers for 39RU and 6 for 8RU.
If there are any of these failures, an upgrade link will not be sent and you see 500 error with information like HW failure, or missing host and check orchestrator logs for more info. In this scenario, use explore to tail -100 on /local/logs/tetration/orchestrator/orchestrator.log in the host orchestrator.service.consul. This provides detailed information about which one of the 3 checks caused the failure. This usually requires fixing the hardware and recommissioning the node. After that is done we can restart upgrade by clicking on “Send Upgrade Link”.
Click on the link in the email will connect to the setup UI in the cluster. Setup UI is a operations UI that will be used for deploy/upgrade of the cluster. The initial page will show the list of RPMs that are currently installed in the cluster. This is also the upload page to upload all the RPMs
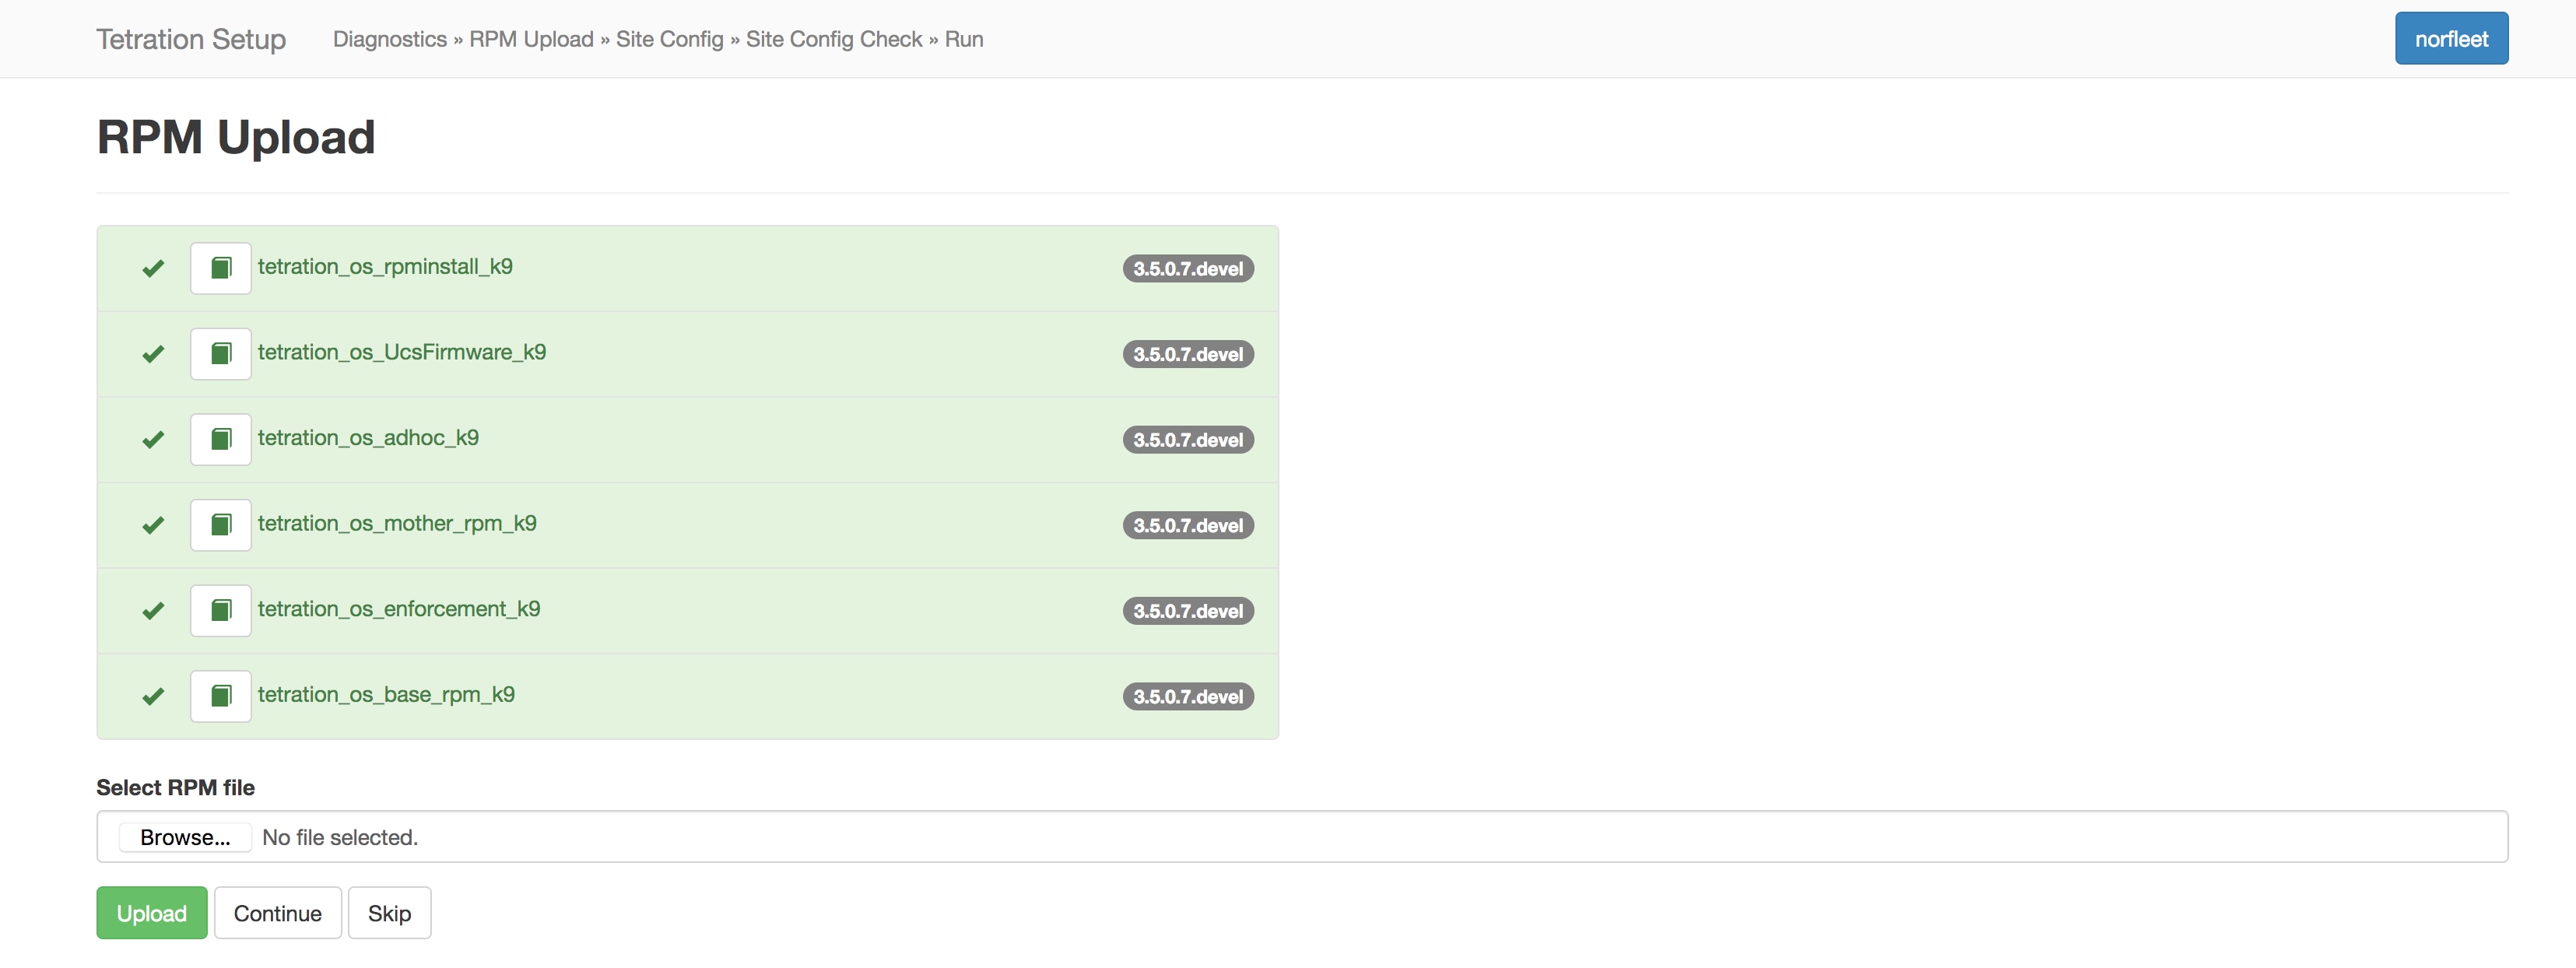
Upload the RPMs in the order that is shown on setup UI. The order is
tetration_os_rpminstall_k9
tetration_os_UcsFirmware_k9
tetration_os_adhoc_k9
tetration_os_mother_rpm_k9
tetration_os_enforcement_k9
tetration_os_base_rpm_k9
Note |
For Secure Workload Virtual clusters deployed on vSphere, be sure to also upgrade the tetra- tion_os_ova_k9 RPM and do not upload the tetration_os_base_rpm_k9. |
Uploading any other order will result in upload failure. Until all the RPMs are uploaded in the correct order Continue button will be disabled.
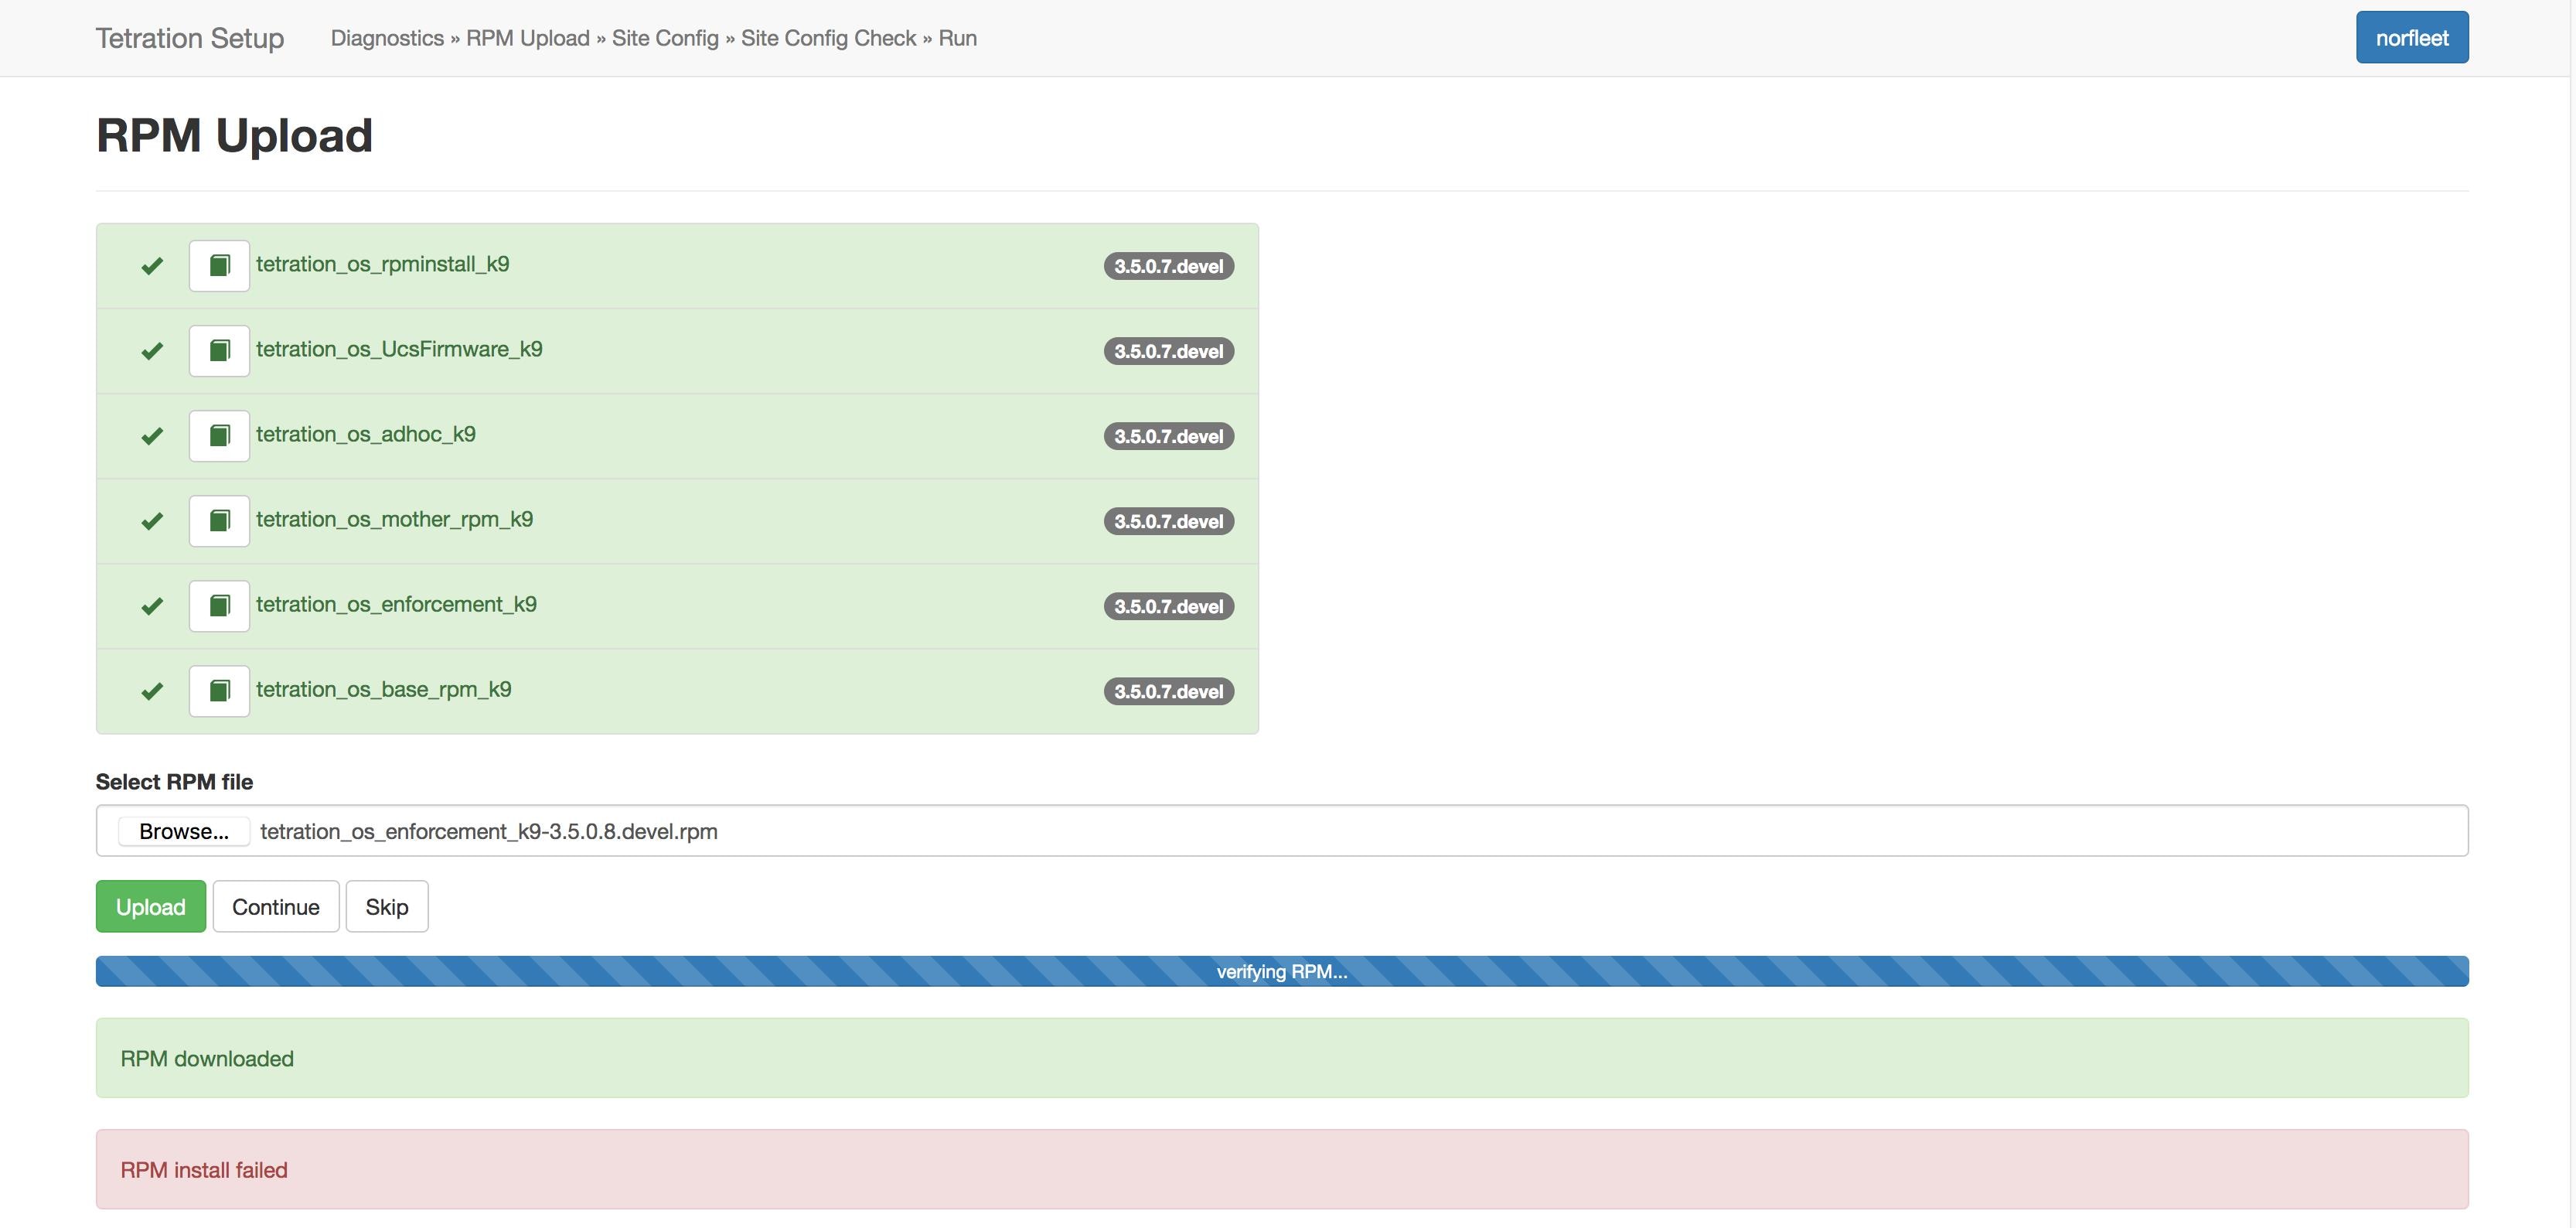
Logs for each upload can be seen by clicking on the Log symbol on the left of every RPM. Also uploads that failed will be marked RED in color.
The next step is to update the site information. Not all site information fields are updateable. Only the following fields can be updated:
SSH public Key
Sentinel Alert Email (for Bosun)
CIMC Internal Network
CIMC Internal Network Gateway
External Network
Note |
Do not change the existing external network, you can add additional networks by appending to the existing ones. Changing or Removing existing network will make the cluster unusable. |
DNS Resolvers
DNS Domain
NTP Servers
SMTP Server
SMTP Port
SMTP Username (Optional)
SMTP Password (Optional)
Syslog Server (Optional)
Syslog Port (Optional)
Syslog Severity (Optional)
Note |
|
Rest of the fields are not updatable. If there are no changes, click on Continue to trigger the Pre-Upgrade Checks, else update the fields and then click on Continue.
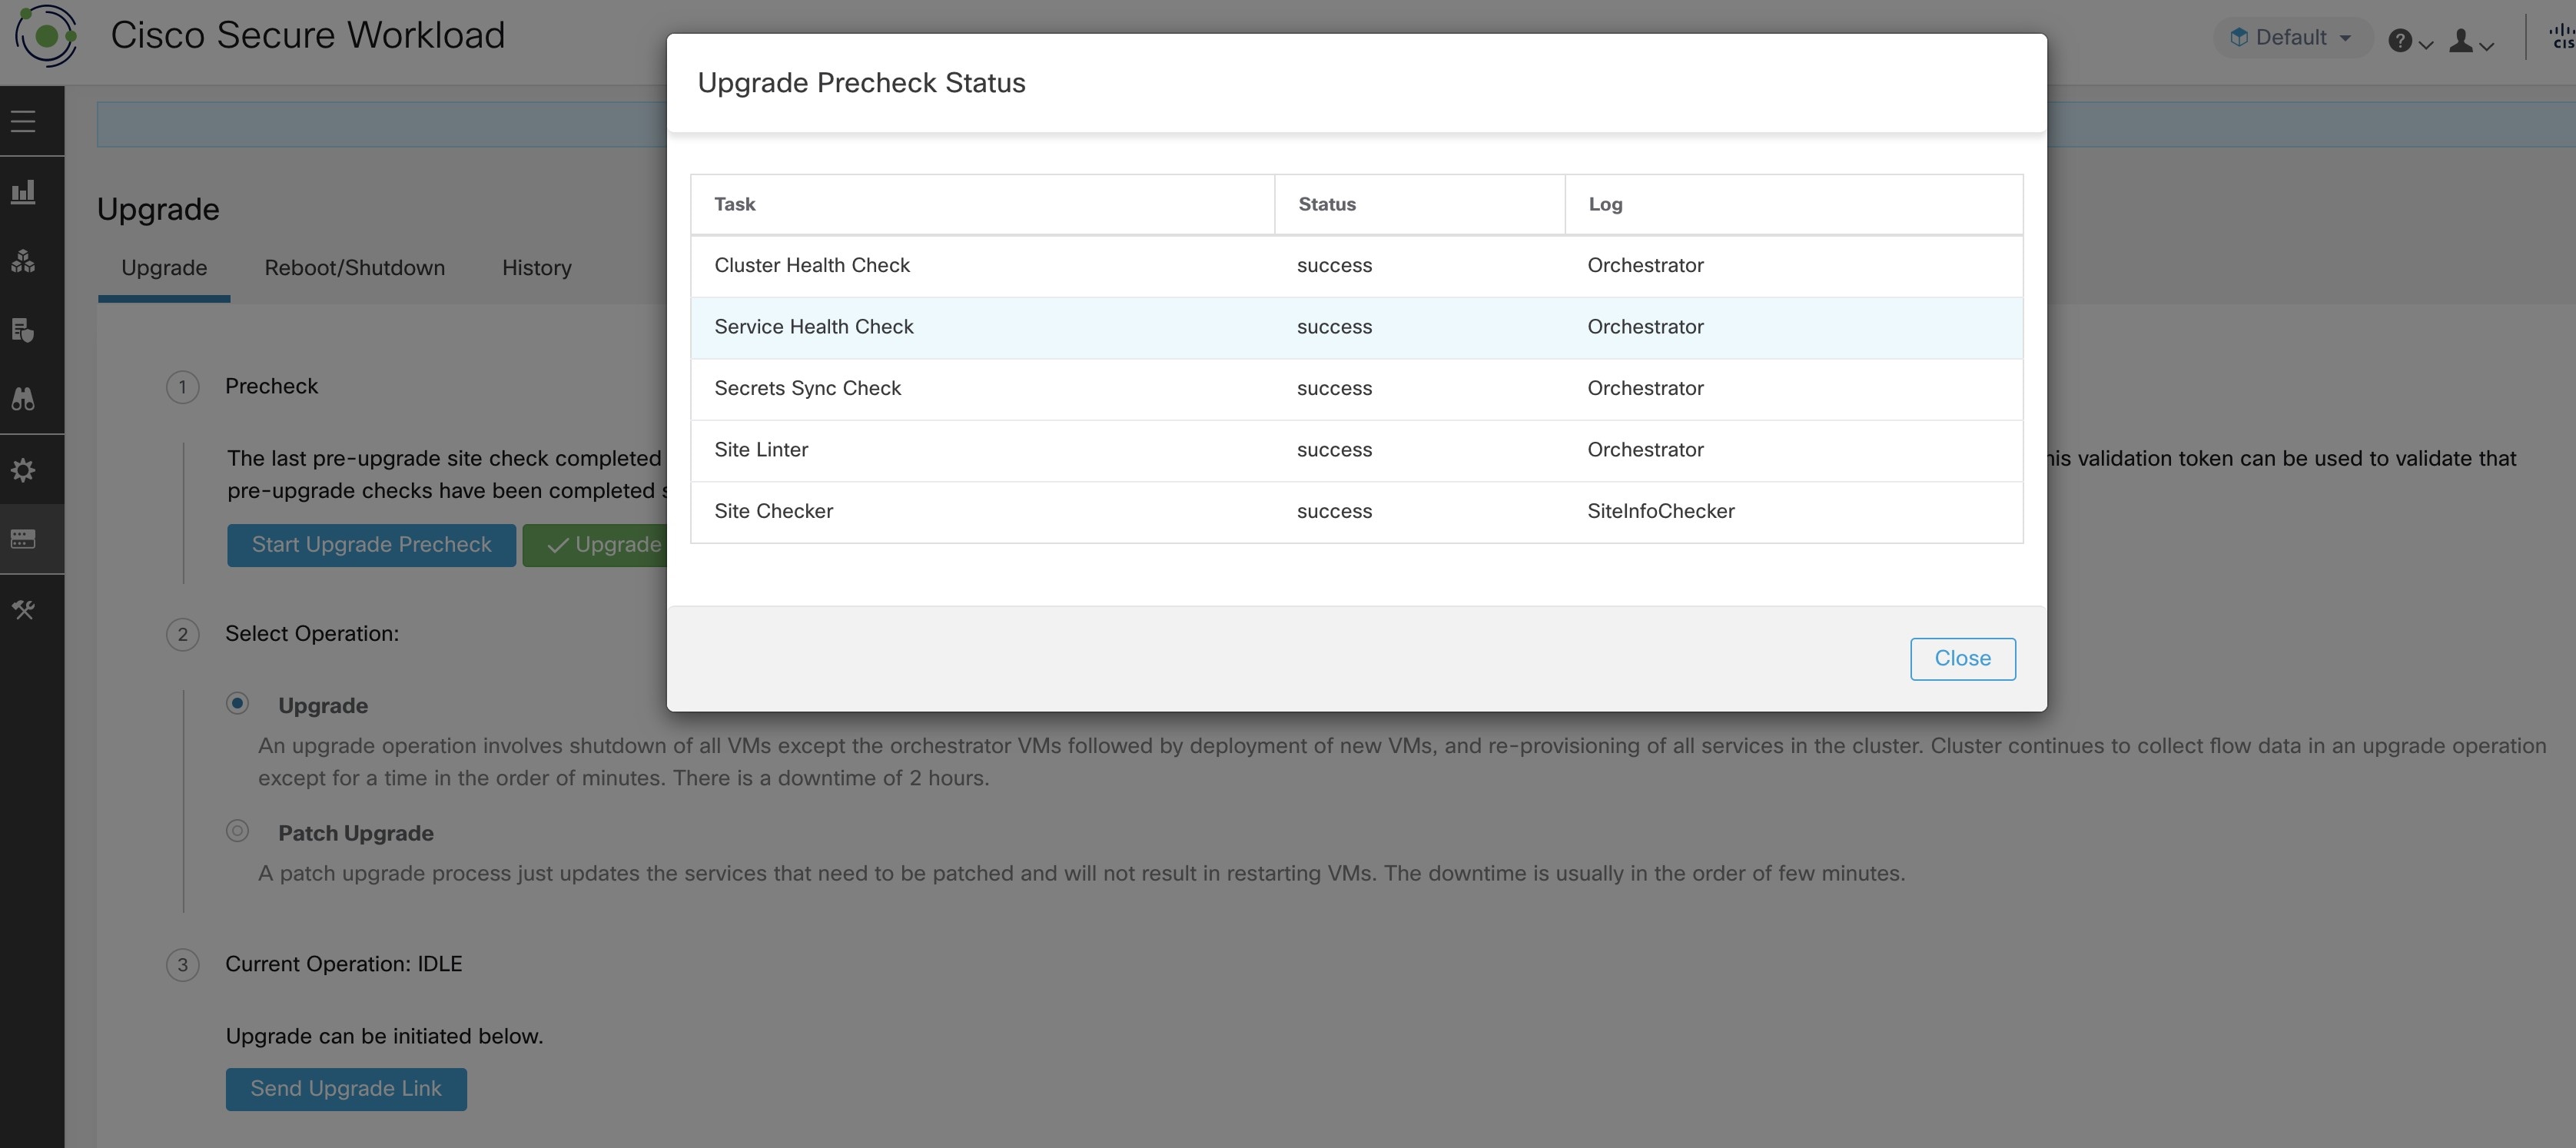
Before we start upgrades we do few checks on the cluster and ensure things are in order before we start upgrading:
RPM version checks - checks to ensure all the RPMs are uploaded and the version is correct. It doesn’t check if the order was correct, just checks if it was uploaded. Note Order checks are done as a part of upload itself.
Site Linter - Does Site Info Linting
Switch Config - Configures the Leafs/Spine switches
Site Checker - Does DNS, NTP and SMTP server checks. Sends an email at the end with a token, the email is sent to the primary site admin account. If any of the services - DNS, NTP or SMTP is not usable, this step will fail.
Token Validation - Enter the token sent in the email and hit Continue.
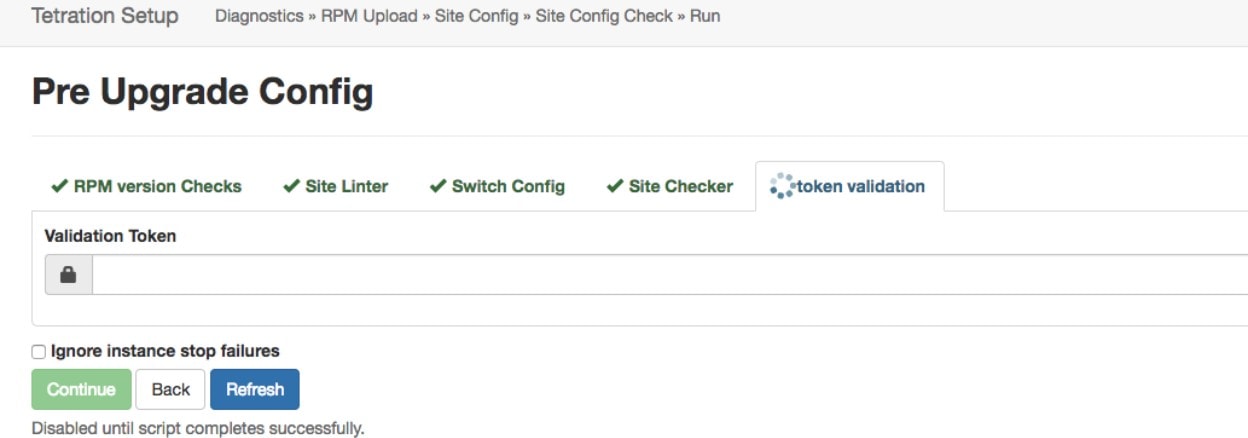
After you complete the pre-upgrade step, and enter the token received in the 'verify token email', click Continue to start the upgrade. Avoid checking the option 'Ignore Stop Failures'. This is a recovery option for upgrade failures when certain services do not shut down. Using this option will shut down the VMs that can create failures when the services come up.
Note |
Use this option under supervision. |
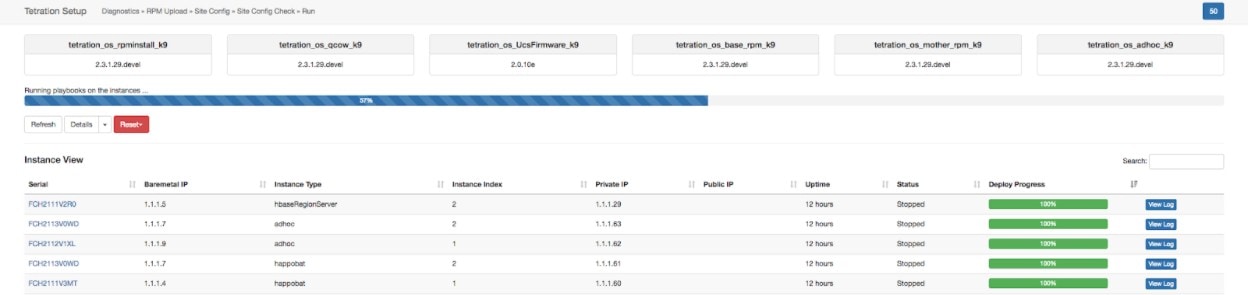
On clicking on “Continue” - Upgrade will start.
|
Step 1 |
On the top right clicking on the cluster name will show the site information used. |
|
Step 2 |
Below that will have all tetration_os RPMs and their versions. |
|
Step 3 |
The global upgrade bar will show the upgrade progress. It will be blue in color while things are in progress, green when done and red when it fails. Right above the progress bar will show the current status of upgrade. |
|
Step 4 |
There are 3 buttons:
|
|
Step 5 |
On the instance view, every individual VMs deploy status is tracked. The columns include:
|
There are two type of logs:
VM deployment logs - these logs can be seen by clicking on “View Log” button.
Orchestration Logs. These can be seen by clicking on the arrow next to the details button. It will show up:
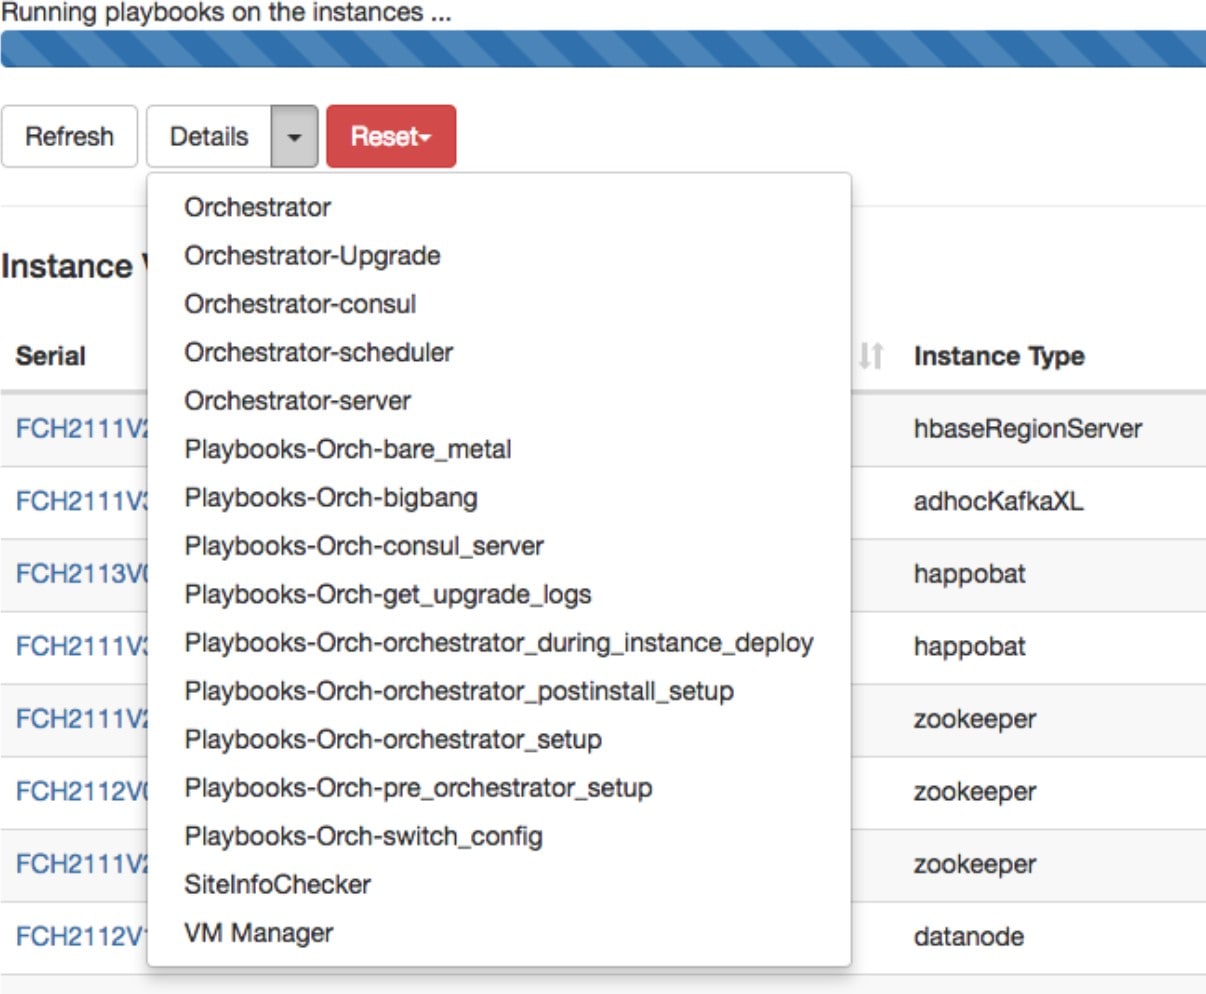
Each of the links will point to the logs.
|
Step 1 |
Orchestrator - Orchestrator log - this is the first place to track progress. Any failures will point to another log to look at. |
|
Step 2 |
Orchestrator-Upgrade - NOP for 2.3 |
|
Step 3 |
Orchestrator-consul - consul logs that runs on primary orchestrator |
|
Step 4 |
Orchestrator-Scheduler - VM scheduler logs - which VM got placed on which baremetal and the scheduling log. |
|
Step 5 |
Orchestrator-server - HTTP server logs from orchestrator |
|
Step 6 |
Playbooks-* - all the playbook logs that run on orchestrator. |
Occasionally, after scheduling an upgrade and while initiating an upgrade, there might be a hardware failure or cluster is not ready to be upgraded. This might require to be fixed before proceeding with upgrades. Instead of waiting until an upgrade window, Pre-Upgrade checks can be initiated any time. These checks can be run any number of times and any time except when an upgrade/patch/reboot is initiated. To run Pre-Upgrade Checks any time, go to the Upgrade Page.
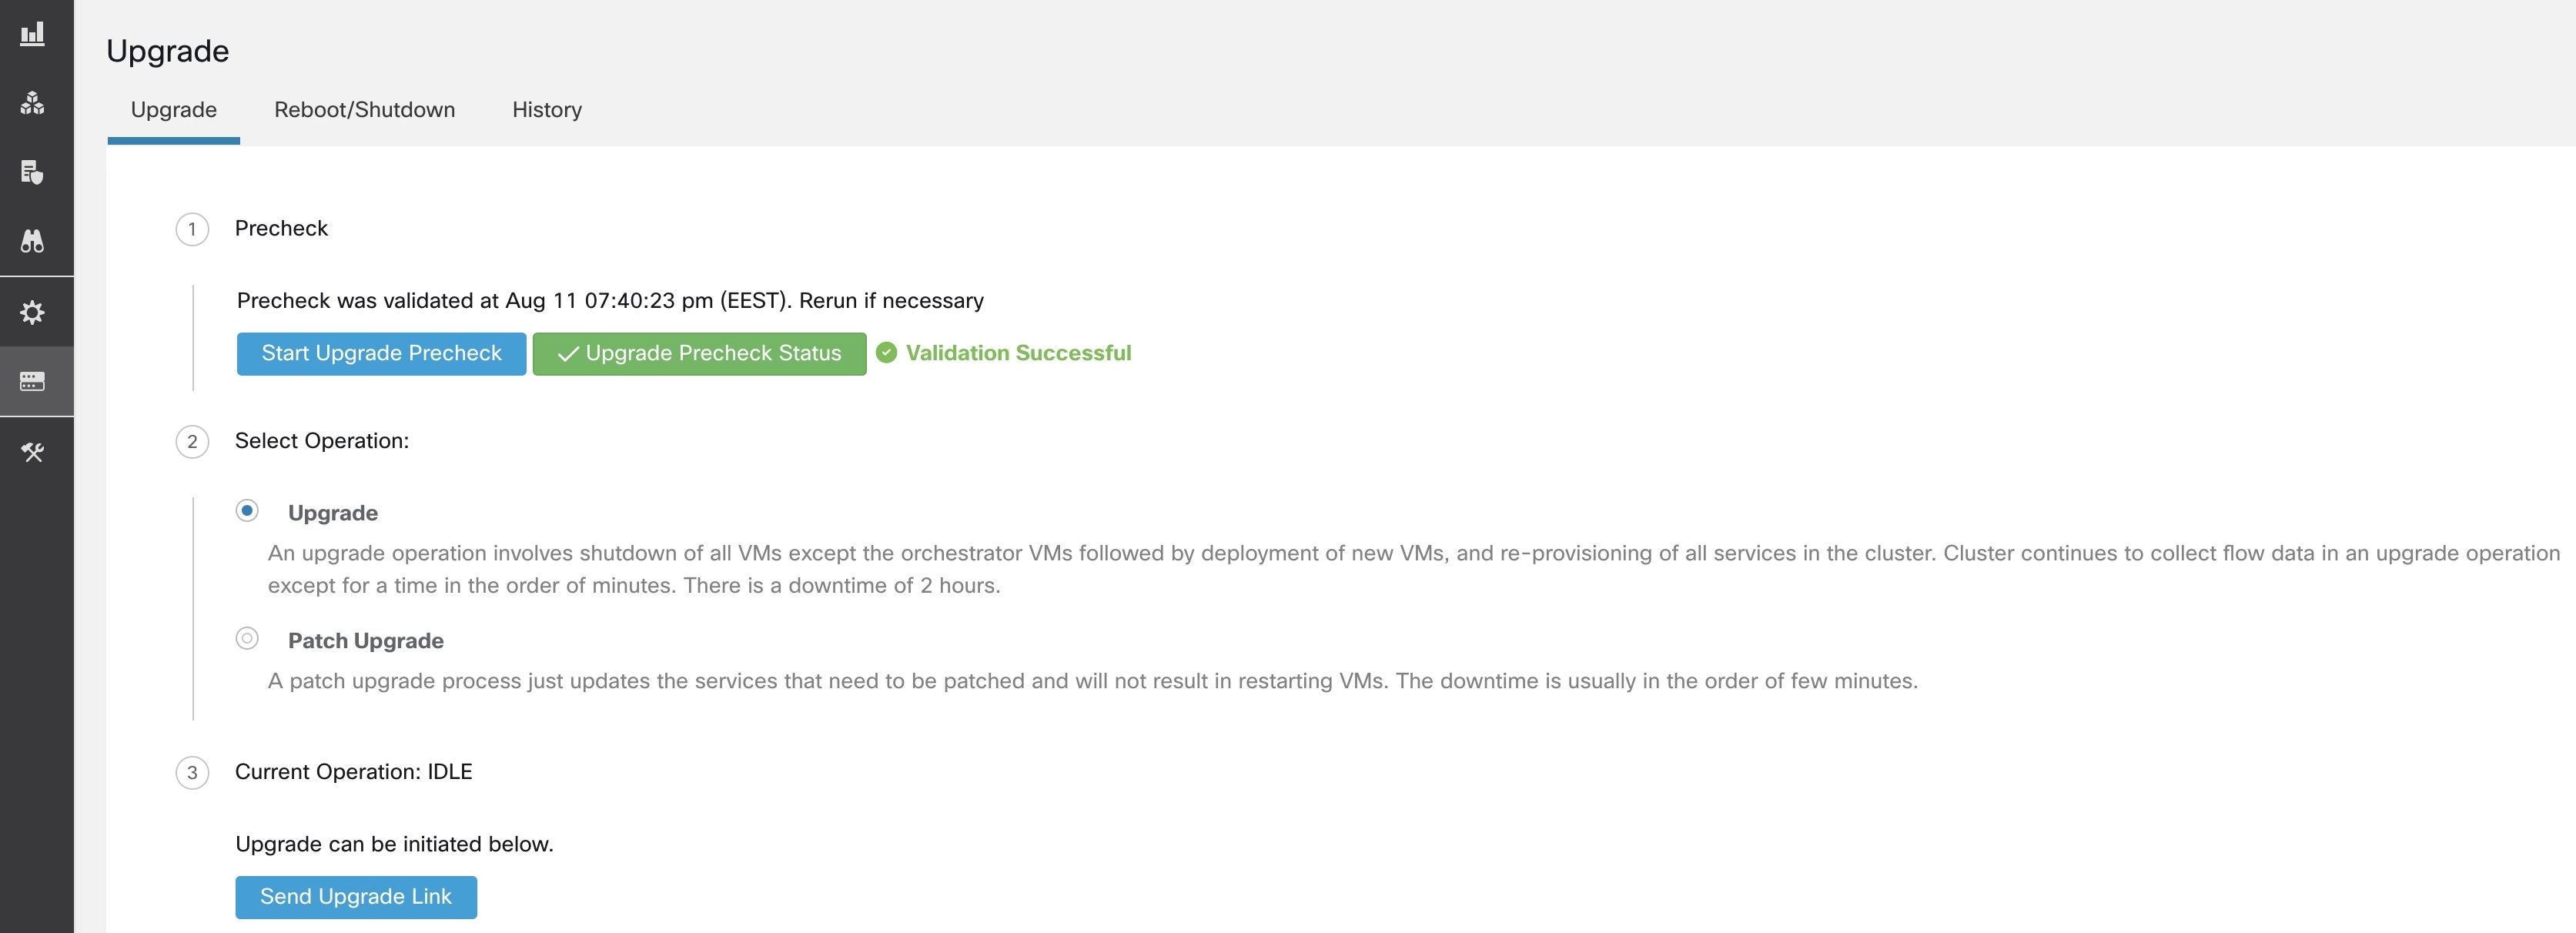
Click on the Start Upgrade Precheck. This will initiate the pre-upgrade checks and will transition to running state:
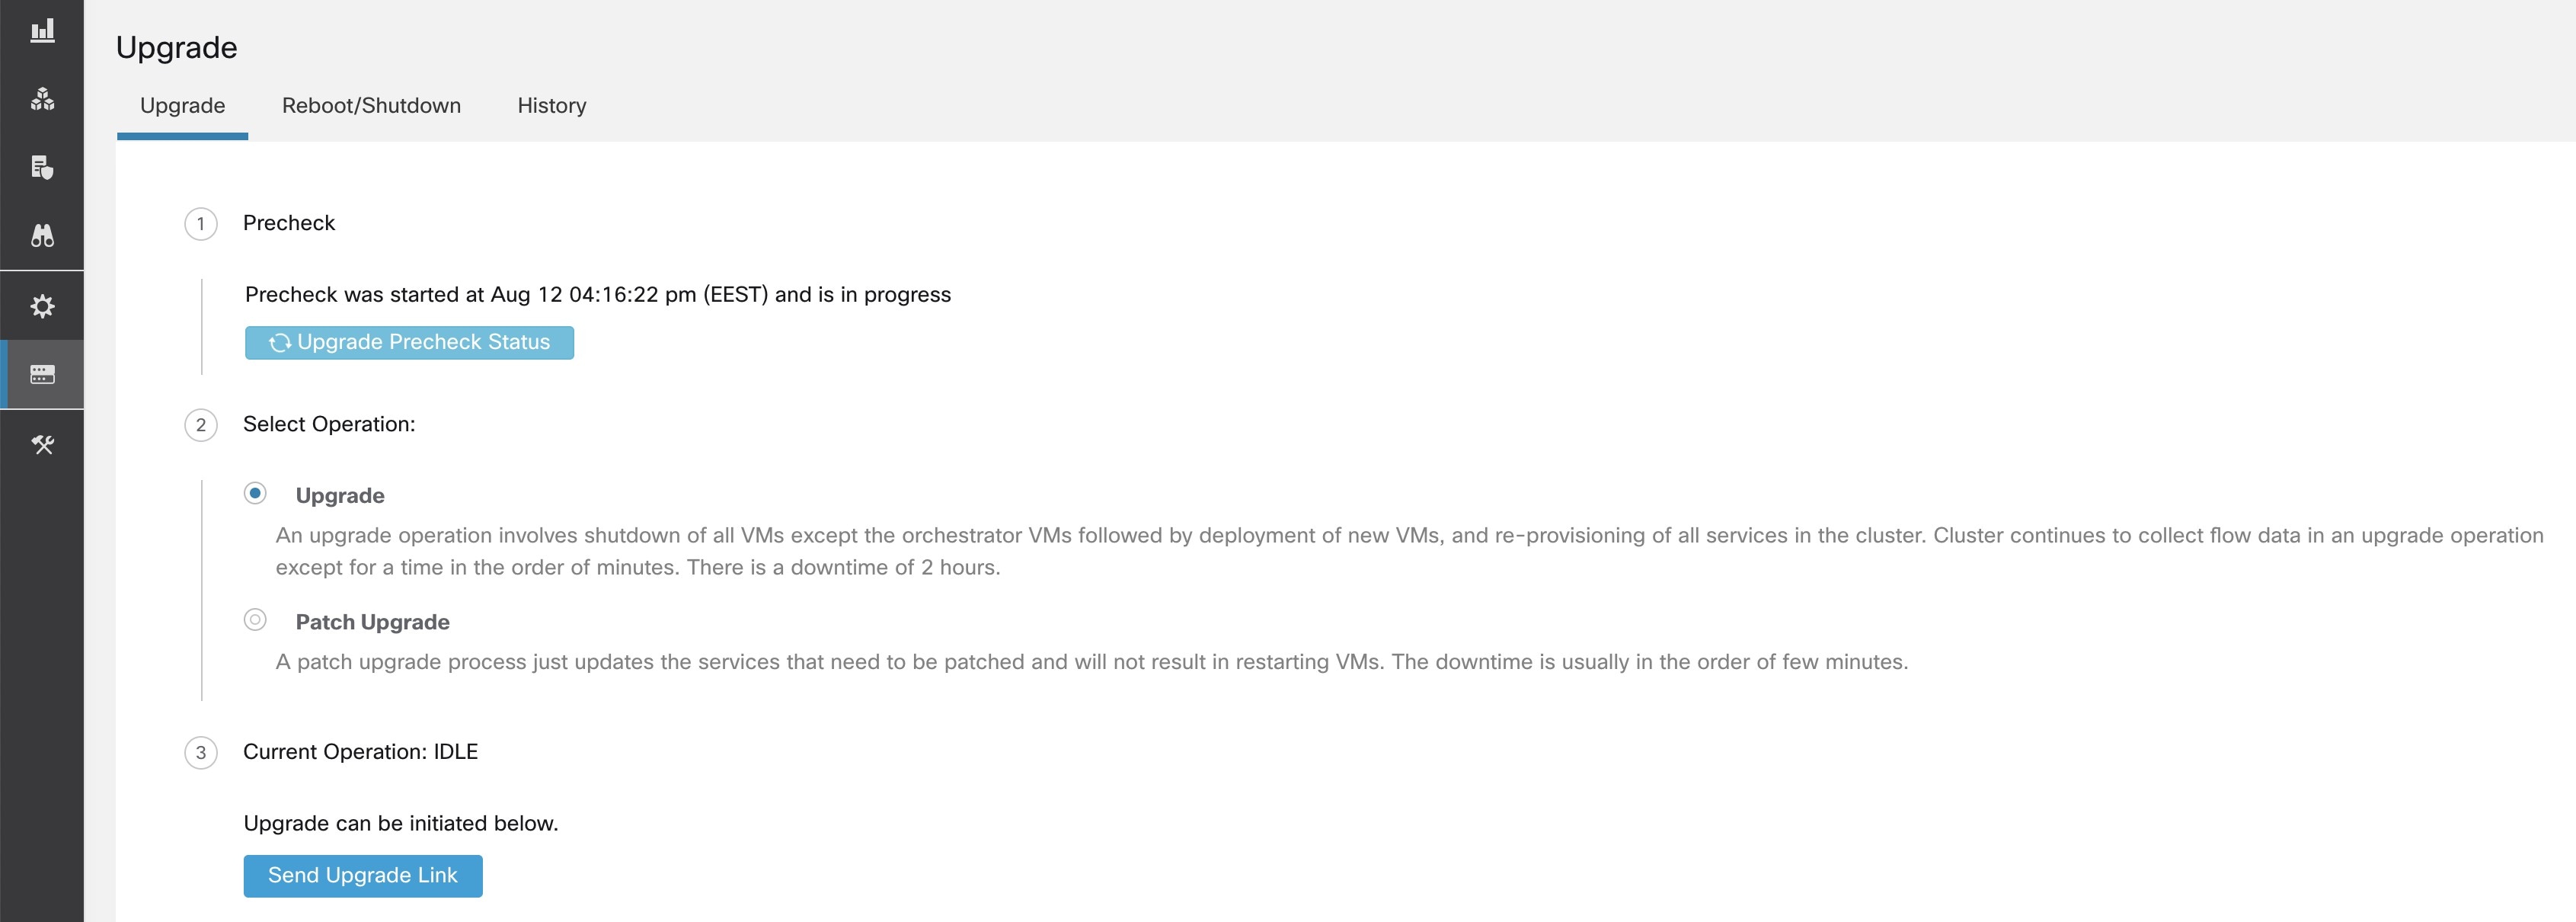
During this time orchestrator runs all the pre-upgrade checks. Once all the checks pass, an email will be sent to the user who initiated the check with an email token. Enter the token to complete the pre-upgrade checks.
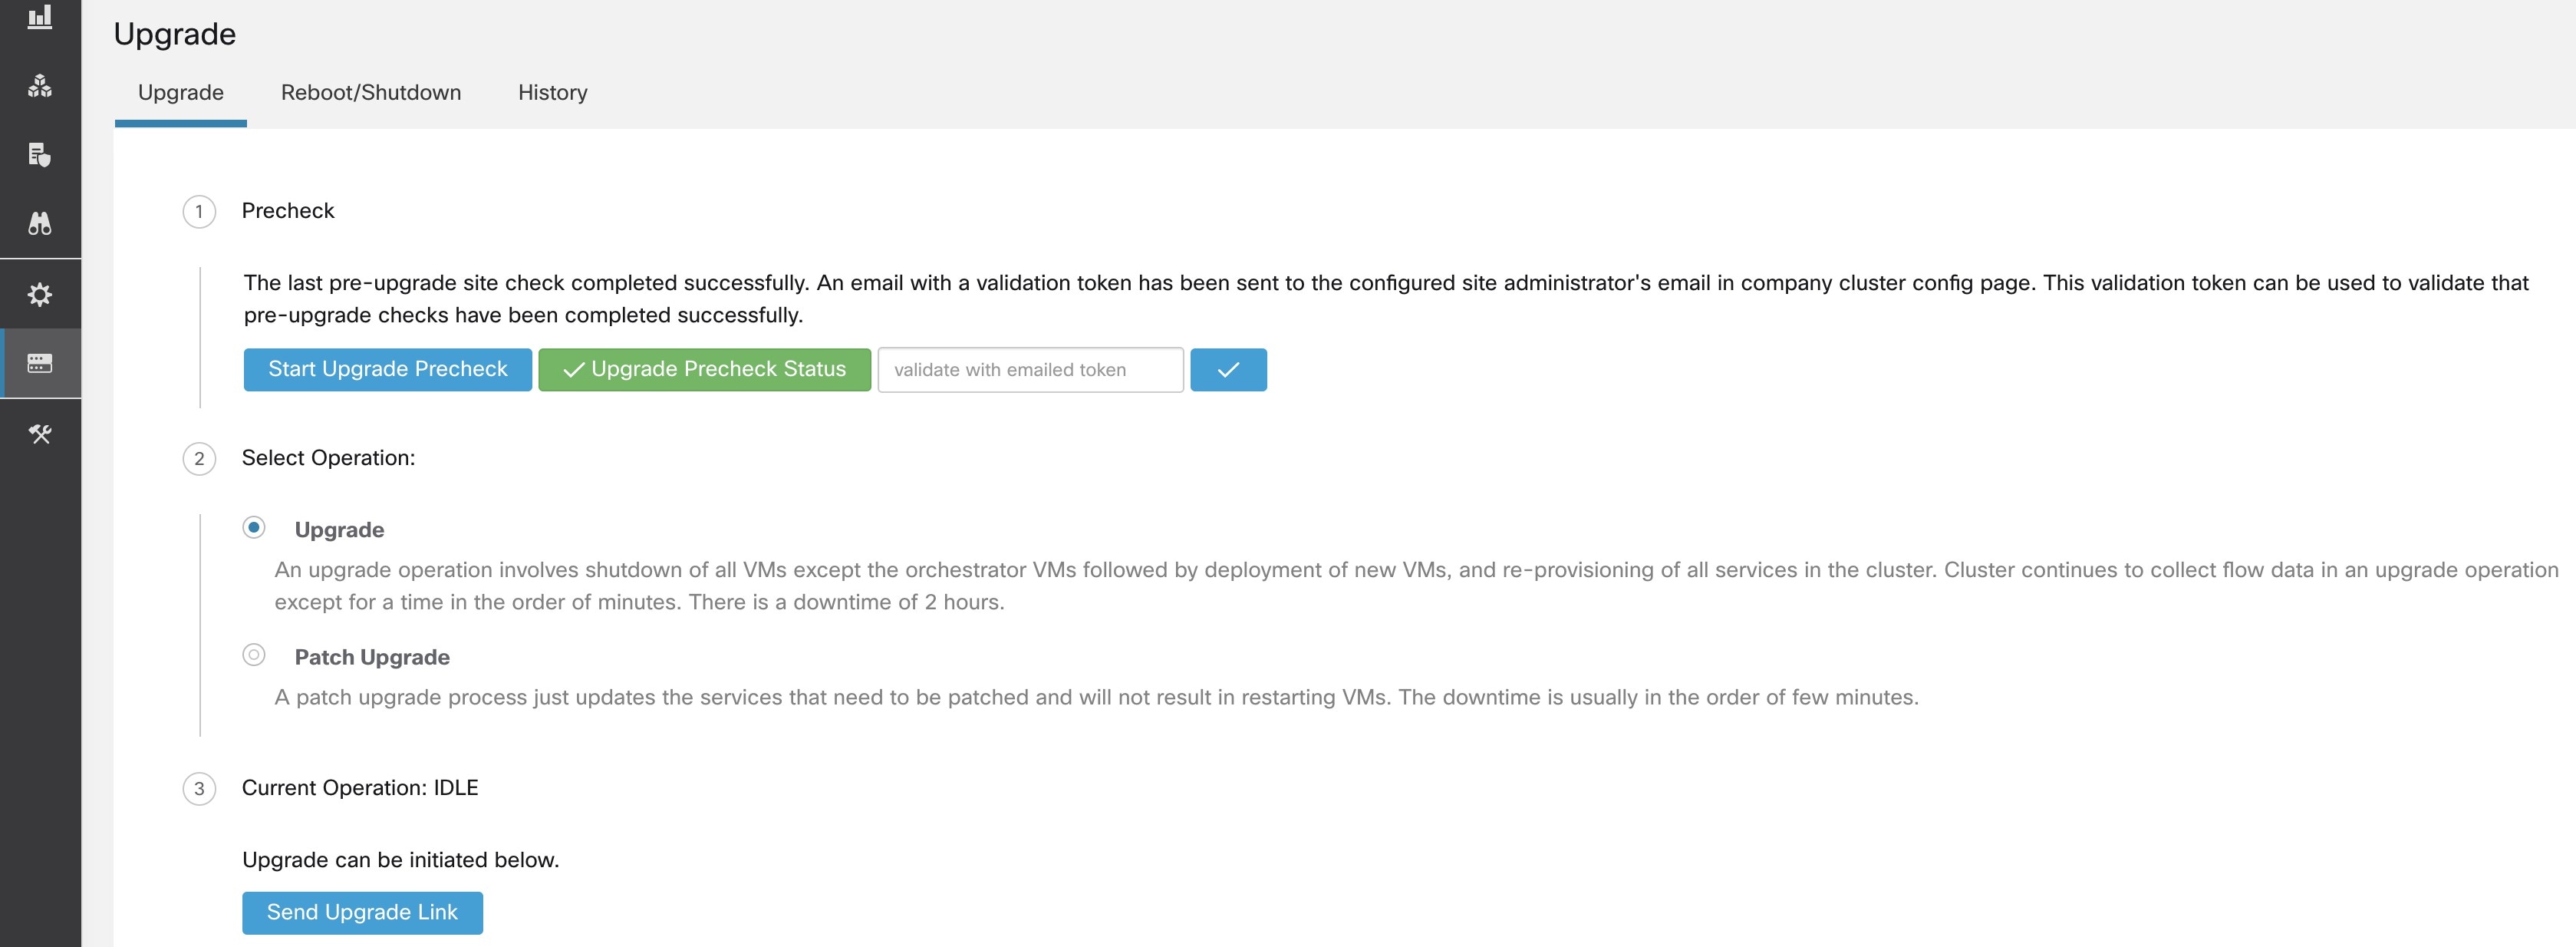
If there are any failures during pre-upgrade checks it will transition to failed state and will show which task failed. Any time the status can be checked and will show up in a new dialog box.
If DBR is enabled on the cluster, also see Upgrades (with DBR).
Users with Customer Support role can access the snapshot tool by selecting from the navigation bar at the left side of the window.
The Snapshot tool can be used to create a Classic Snapshot or a Cisco Integrated Management Controller (CIMC) technical support bundles. Clicking on the Create Snapshot button on the Snapshot file list page loads a page to choose a Classic Snapshot or a CIMC Snapshot (technical support bundle). The option to choose a CIMC Snapshot is disabled on Secure Workload Software Only (ESXi) and Secure Workload SaaS.
Clicking on the Classic Snapshot button loads the Snapshot tool runner user interface:
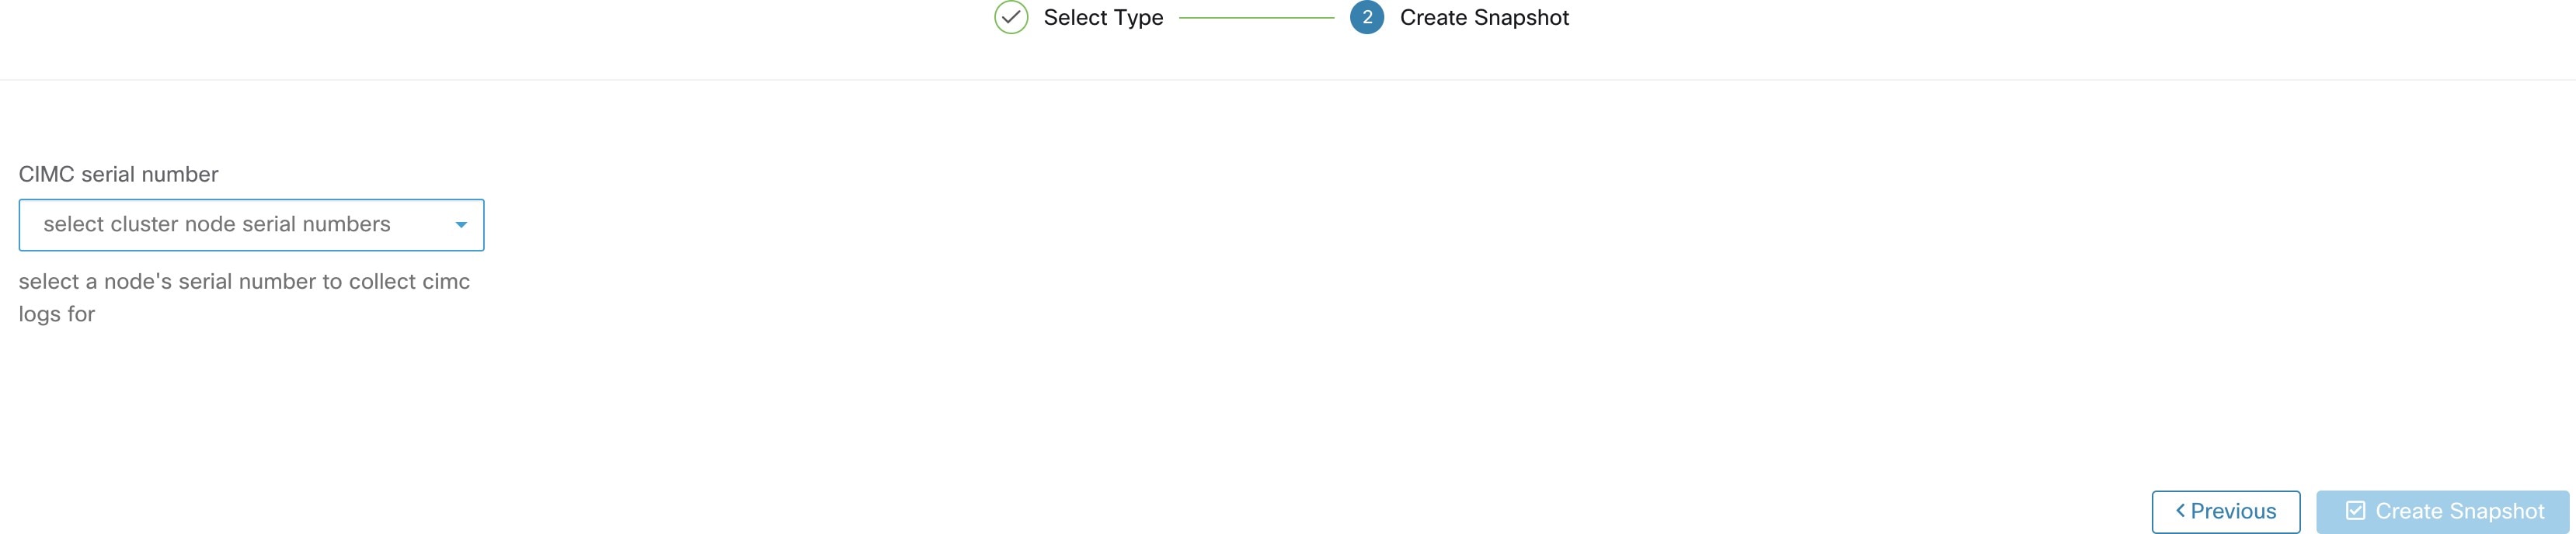
Clicking on the CIMC Snapshot button loads the CIMC Technical Support tool runner user interface:
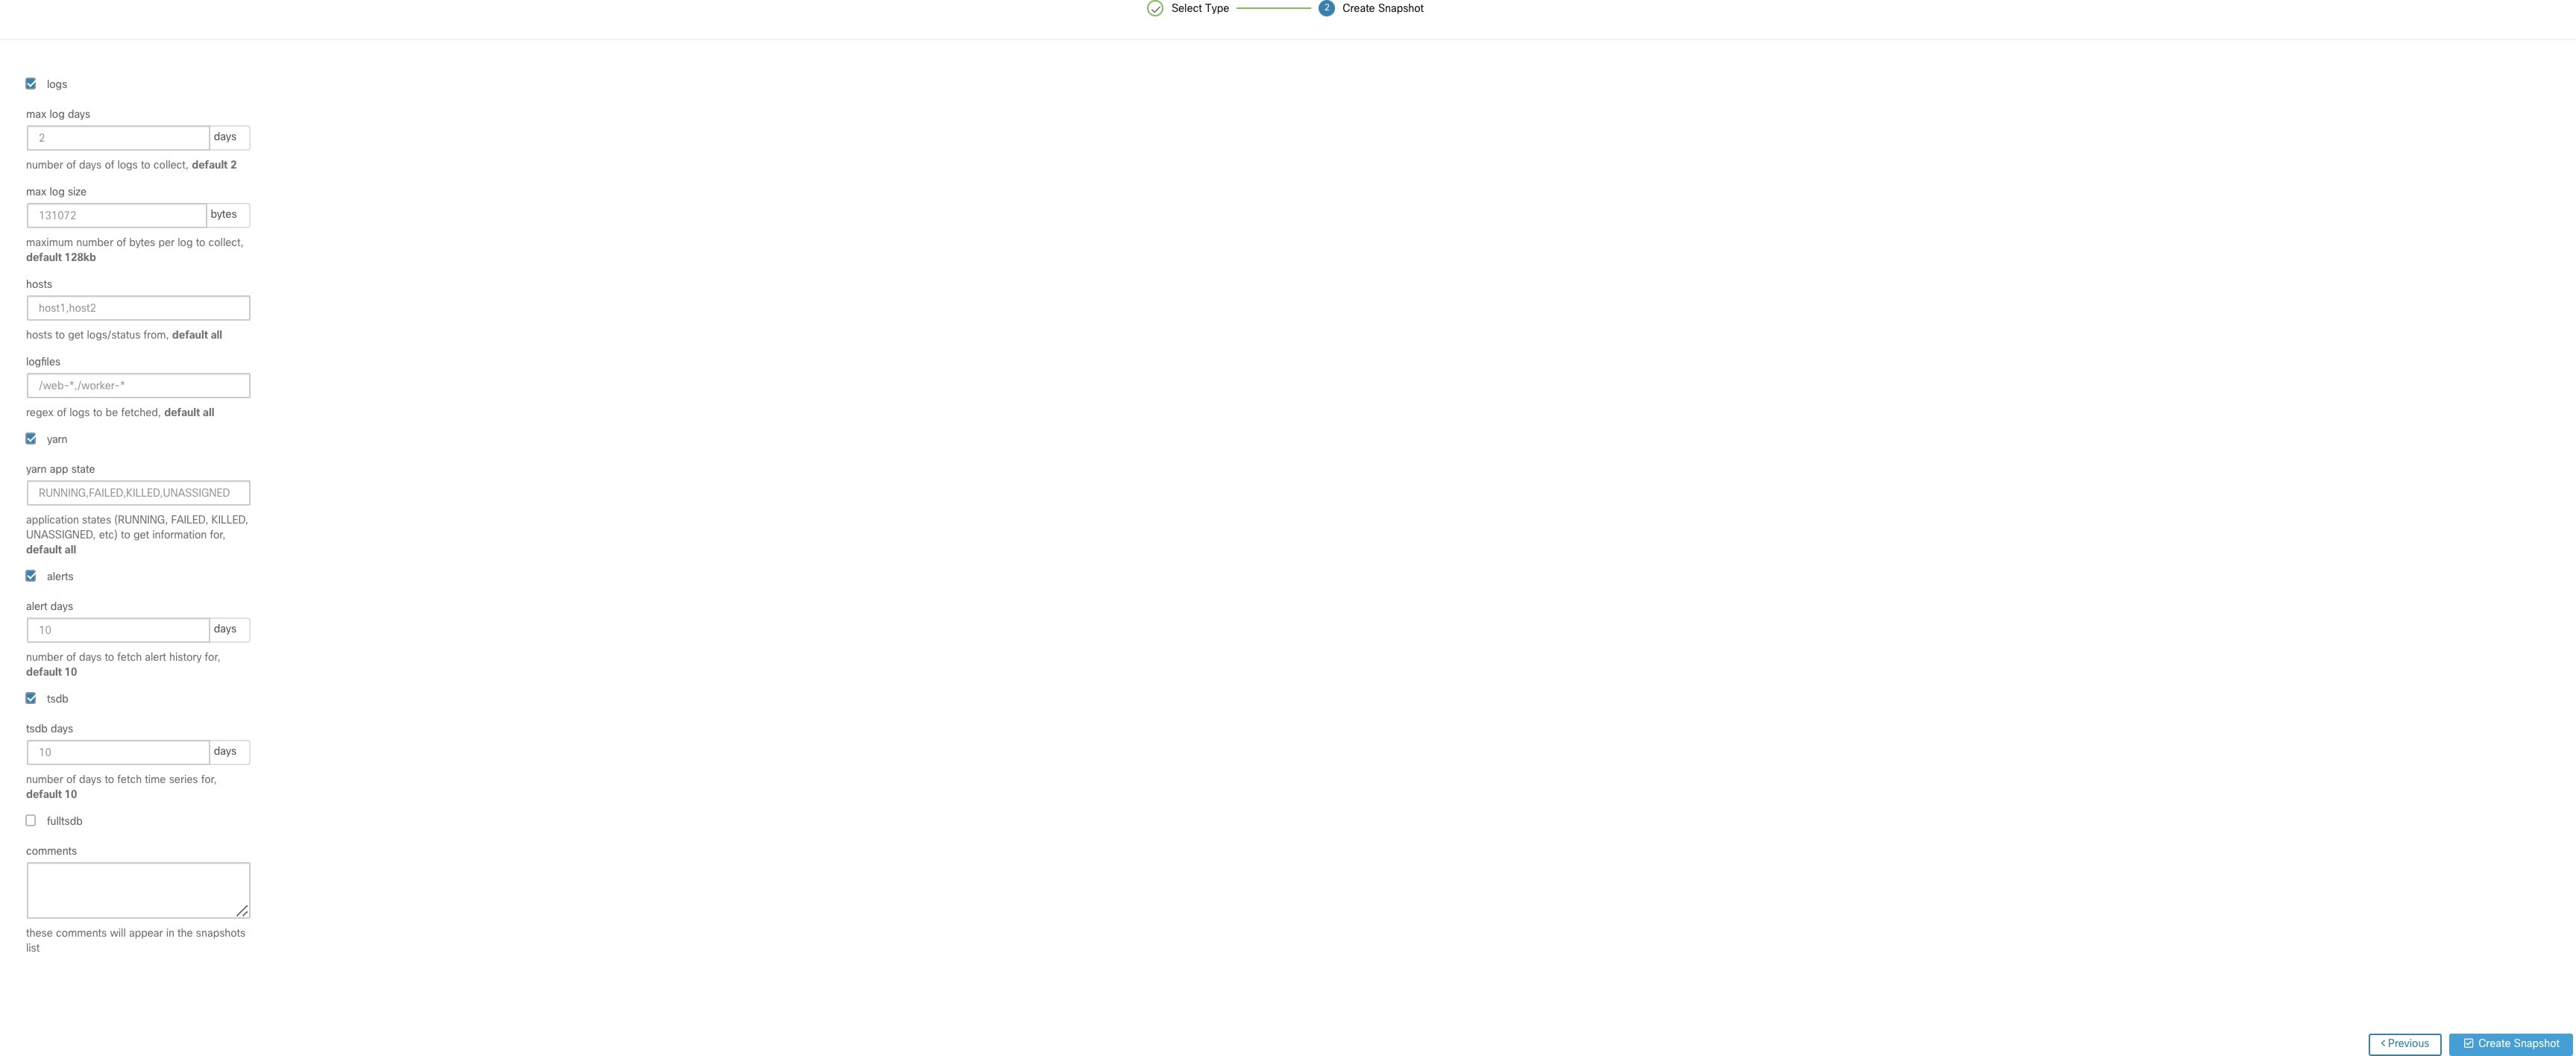
Selecting Create Snapshot with the default options, the Snapshot tool collects:
Logs
State of Hadoop/YARN application and logs
Alert history
Numerous TSDB statistics
It is possible to override the defaults and specify certain options.
logs options
max log days - number of days of logs to collect, default 2.
max log size - maximum number of bytes per log to collect, default 128kb.
hosts - hosts to get logs/status from, default all.
logfiles - regex of logs to be fetched, default all.
yarn options
yarn app state - application states (RUNNING, FAILED, KILLED, UNASSIGNED, etc) to get information for, default all.
alerts options
alert days - the number of days worth of alert data to collect.
tsdb options
tsdb days - the number of days worth of tsdb data to collect, increasing this can create very large Snapshots.
fulltsdb options
fulltsdb - a JSON object that can be used to specify startTime, endTime fullDumpPath, localDumpFile and nameFilterIncludeRegex to limit which metrics are collected.
comments - can be added to describe why or who is collecting the snapshot.
After selecting Create Snapshot, a progress bar for the snapshot is displayed at the top of the Snapshot file list page. When the snapshot completes, it can be downloaded using the Download button on the Snapshots file list page. Only one snapshot can be collected at a time.
On the CIMC Snapshot (technical support bundle) page, select the serial number of the node the CIMC Technical Support Bundle should be created for and click the Create Snapshot button. A progres bar for the CIMC Technical Support Bundle collection will appear in the Snapshot file list page and the comments section will reflect that the CIMC Technical Support Bundle collection has been triggered. Once the CIMC Technical Support Bundle collection is complete, the file can be downloaded from the Snapshot file list page.
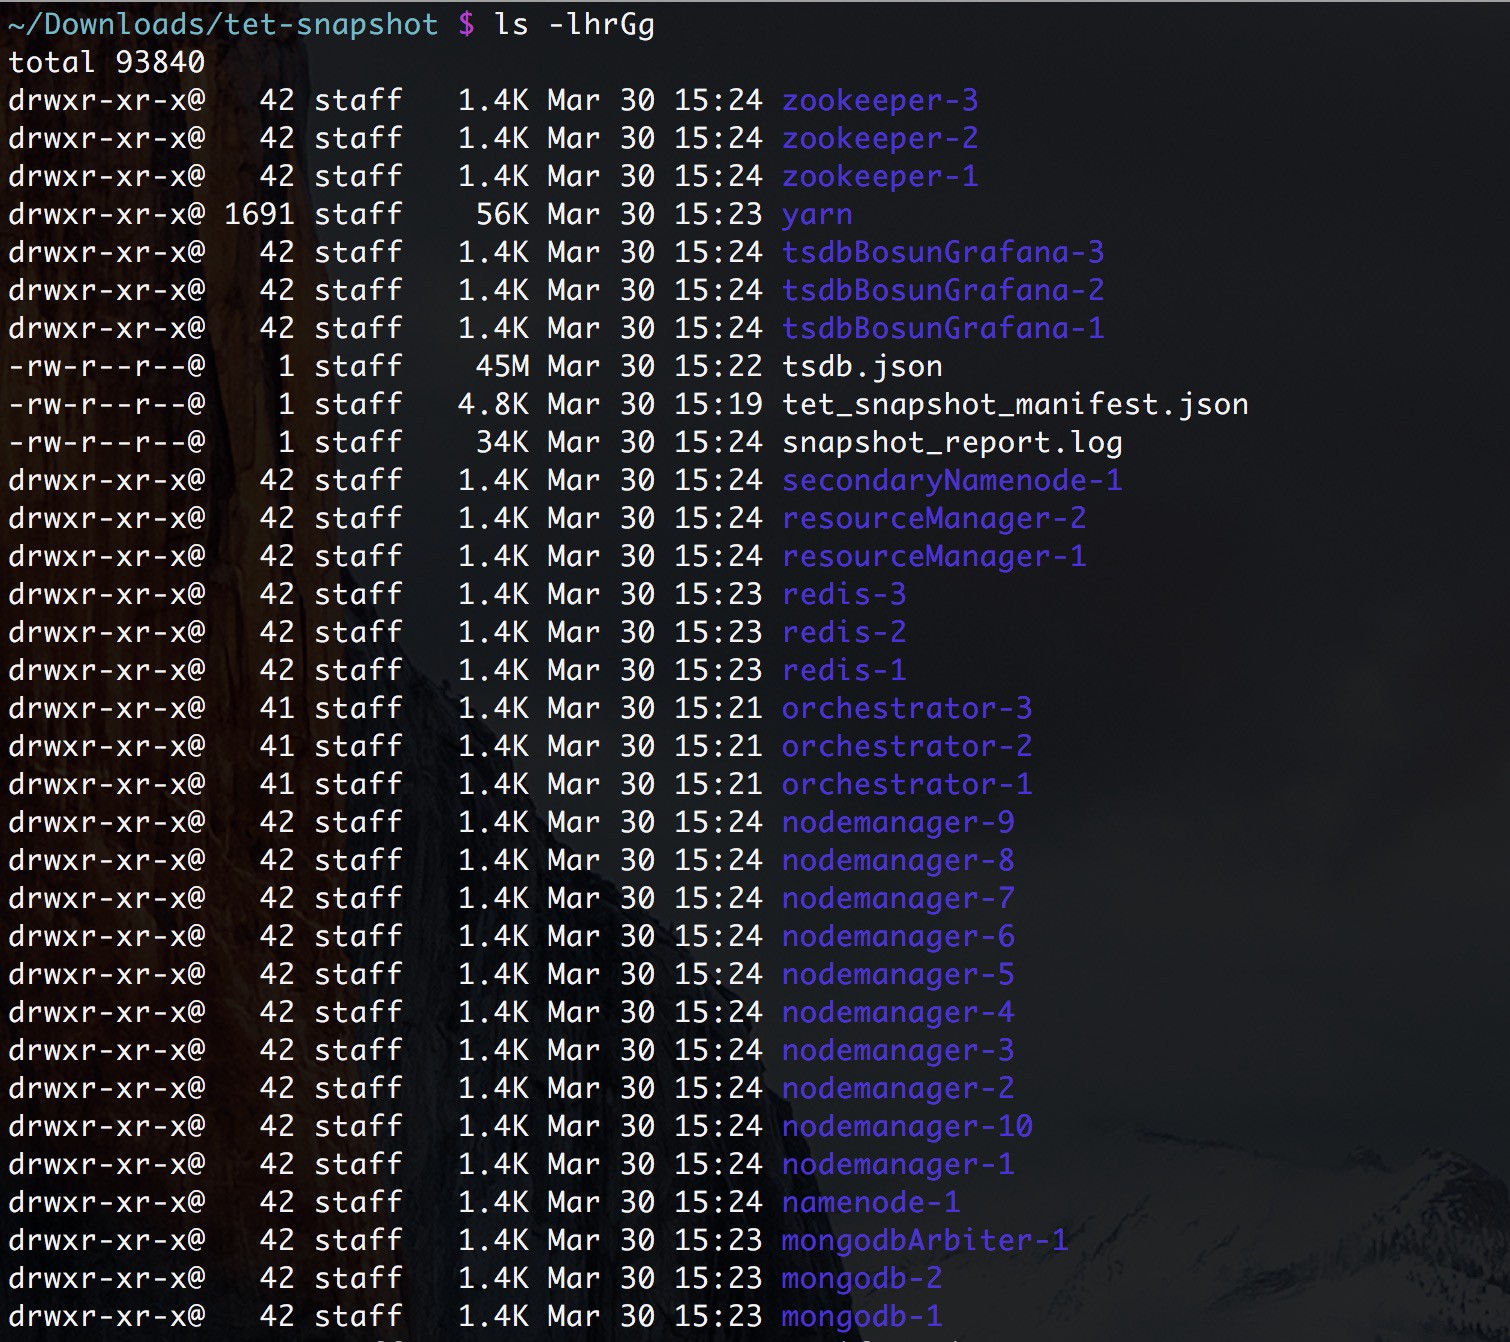
Untarring a snapshot creates a ./clustername_snapshot directory that contains the logs for each machine. The logs are saved as text files that contain the data from several directories from the machines. The Snapshot also saves all the Hadoop/TSDB data that was captured in JSON format.
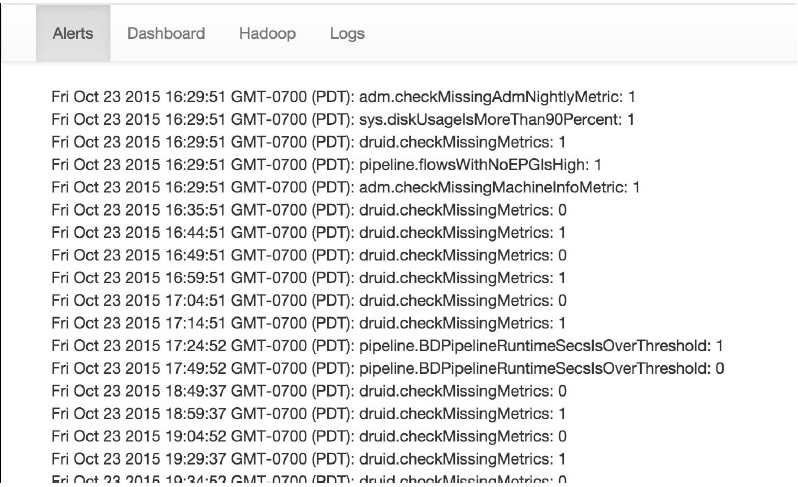
When opening the packaged index.html in a browser, there are tabs for:
Terse list of alert state changes.
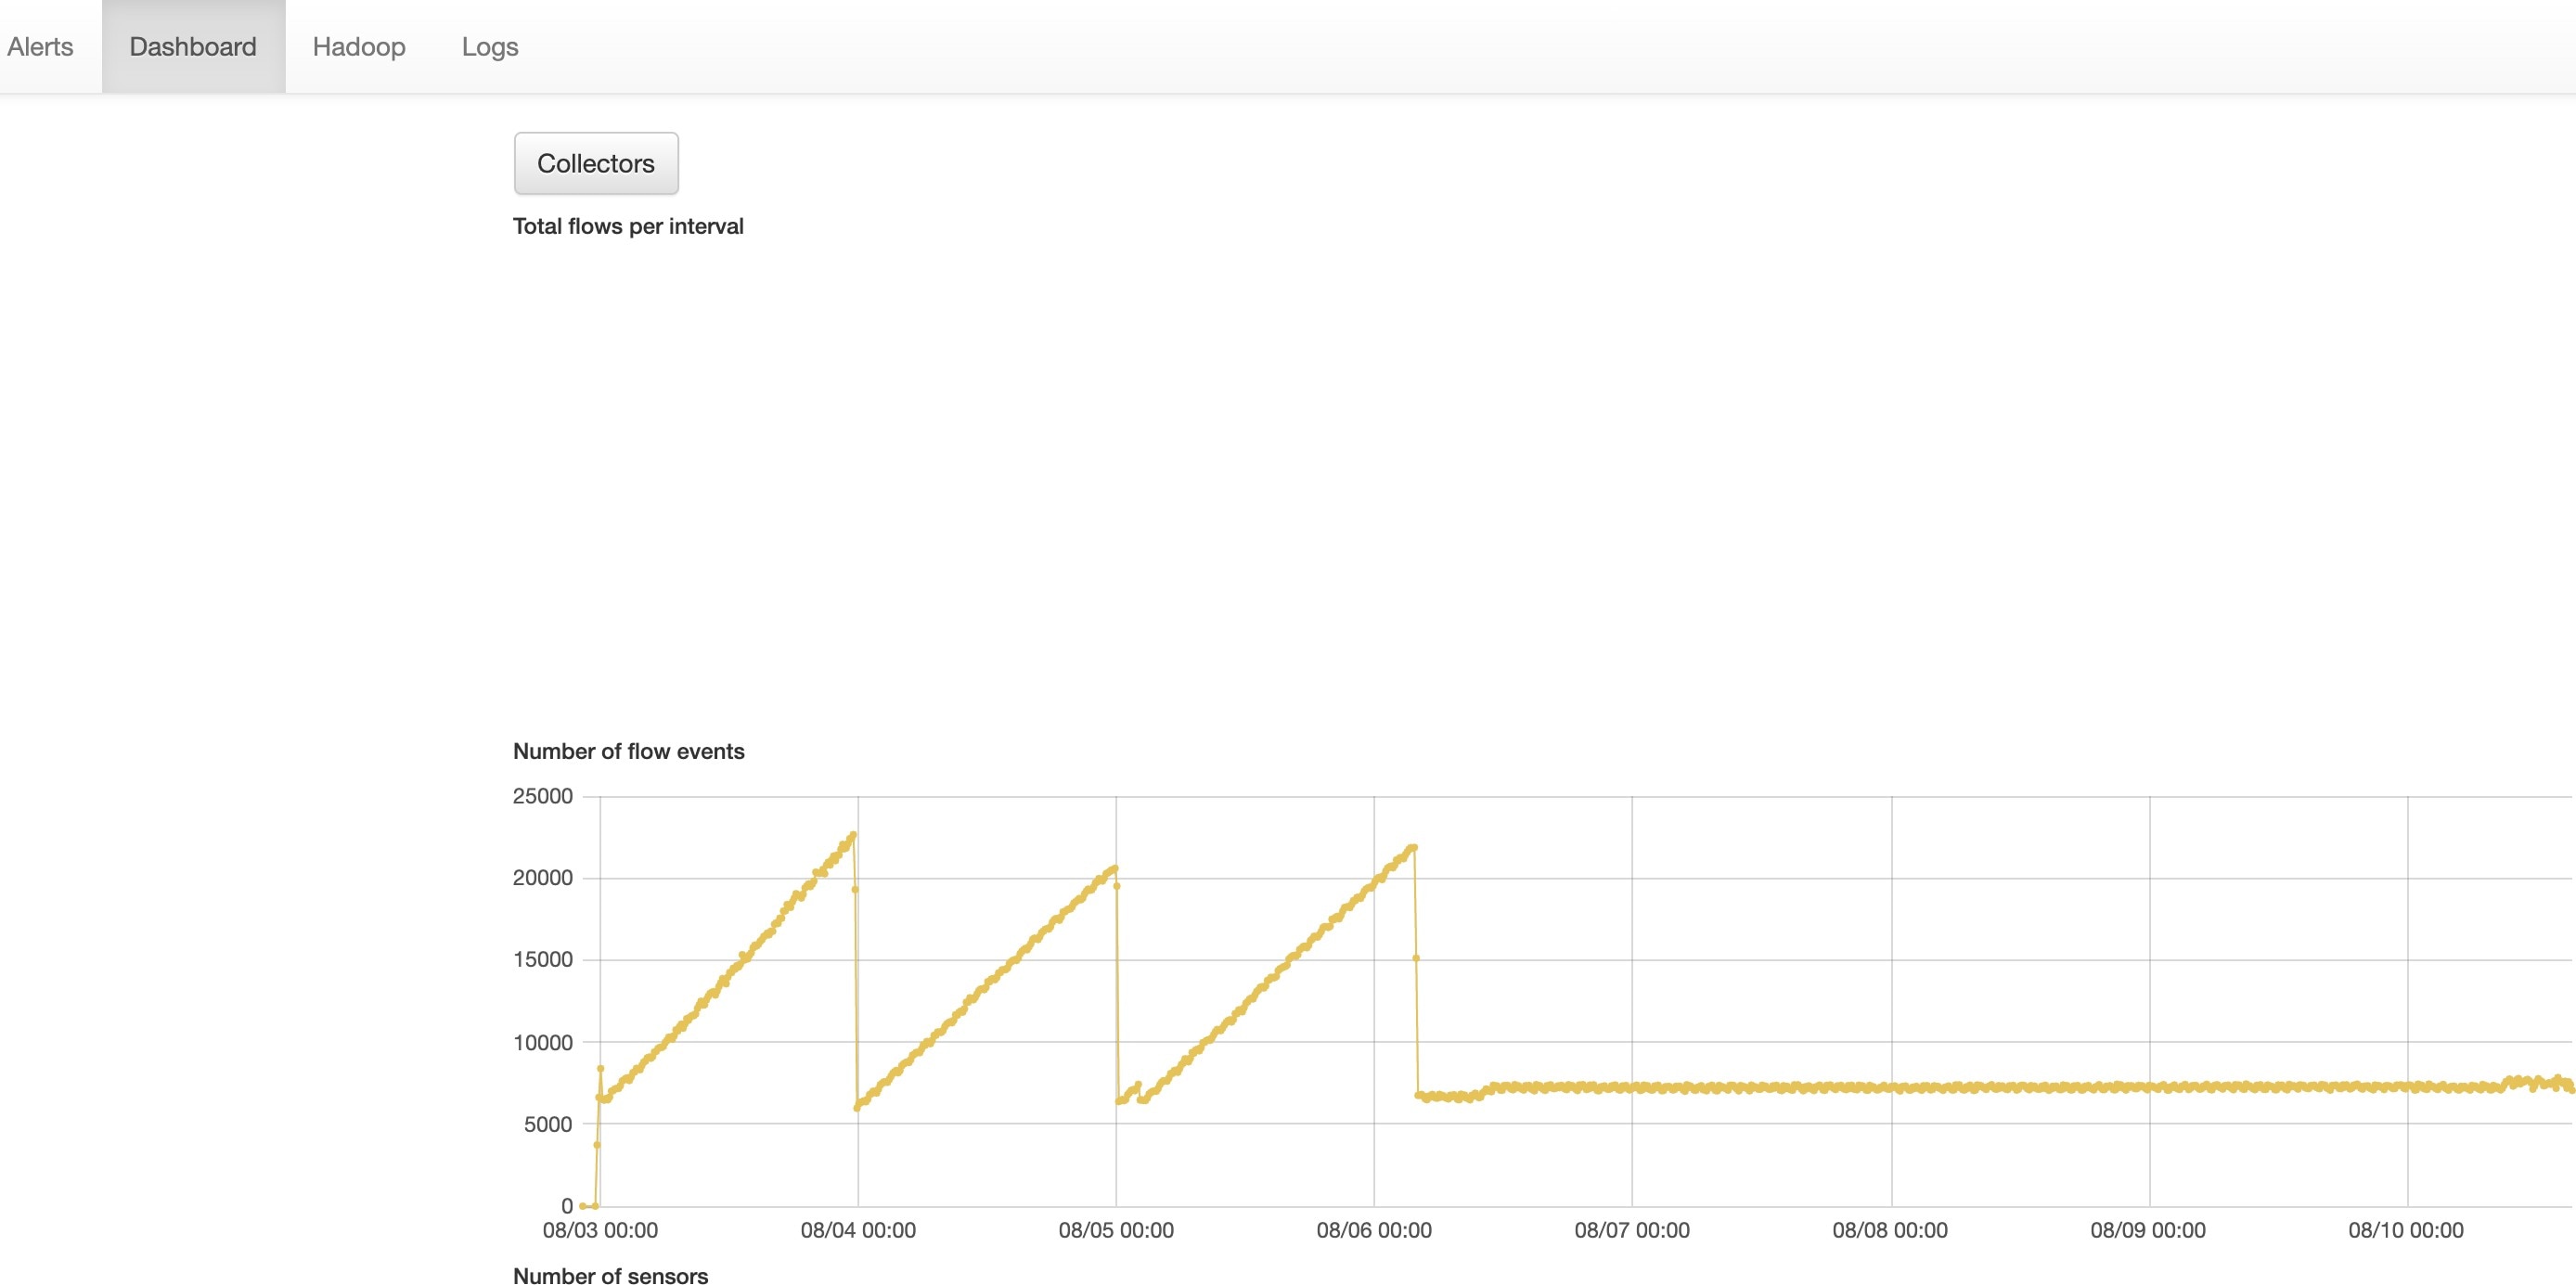
Reproduction of grafana dashboards.
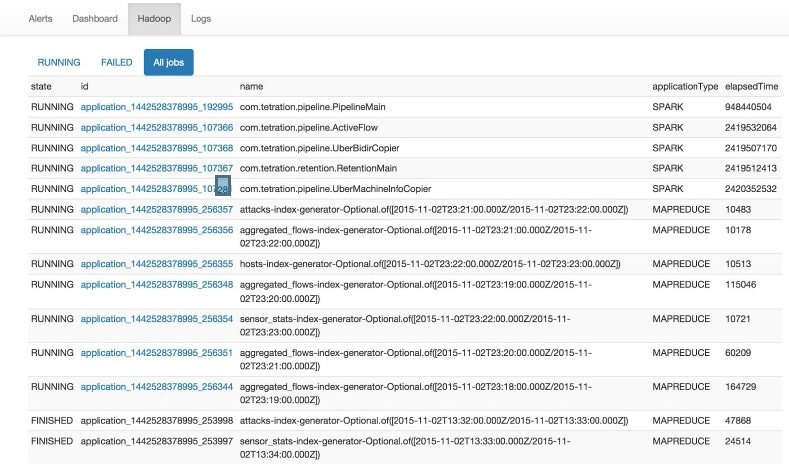
Reproduction of the Hadoop Resource Manager front end that contains jobs and their state. Selecting a job displays the logs for the job.
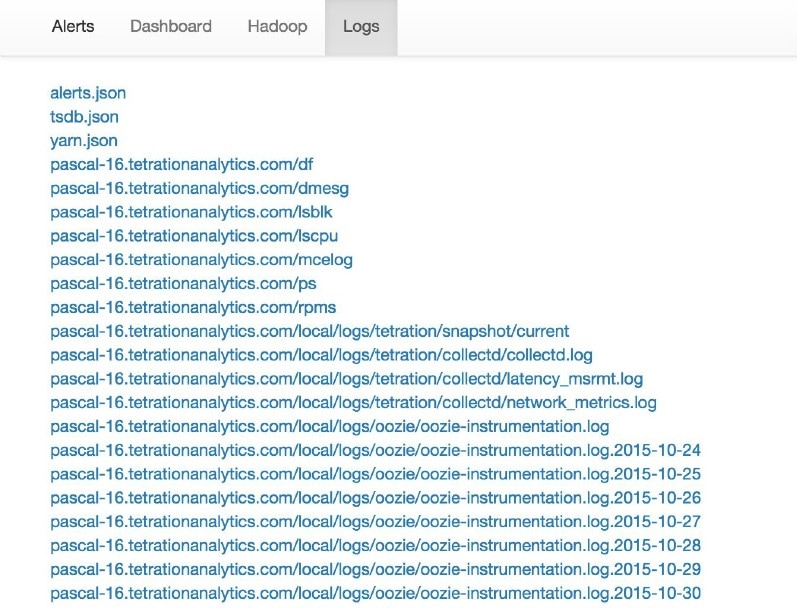
List of all logs collected.
The snapshot service can be used to run service commands, but it requires Customer Support privileges.
Using the Explore tool (), you can hit arbitrary URIs within the cluster:

The Explore tool only appears for users with Customer Support privileges.
The snapshot service runs on port 15151 of every node. It listens only on the internal network (not exposed externally) and has POST endpoints for various commands.
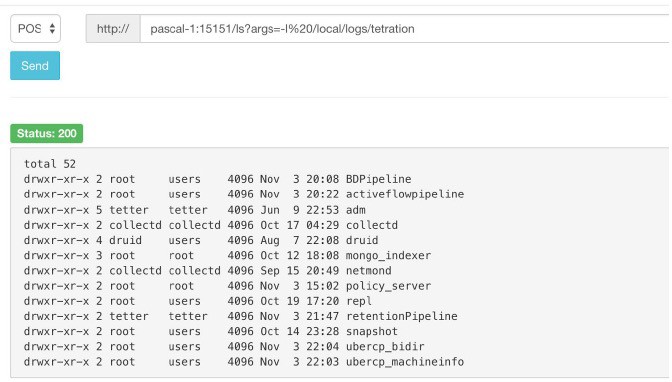
The URI you must hit is POST http://<hostname>:15151/<cmd>?args=<args>, where args are space separated and URI encoded. It does not run your command with a shell. This would avoid allowing anything to be run.
Endpoints of a snapshot are defined for:
snapshot 0.2.5
̶Is
̶ svstatus, svrestart - runs sv status, sv restart Example:1.1.11.15:15151/svrestart?args=snapshot
̶ hadoopls runs hadoop fs -ls <args>
̶ hadoopdu - runs hadoop fs -du <args>
̶ ps Example: 1.1.11.31:15151/ps?args=eafux
̶ du
̶ ambari - runs ambari_service.py
̶ monit
̶ MegaCli64 (/usr/bin/MegaCli64)
̶ service
̶ hadoopfsck - runs hadoop -fsck
snapshot 0.2.6
̶ makecurrent - runs make -C /local/deploy-ansible current
̶ netstat
snapshot 0.2.7 (run as uid “nobody”)
̶ cat
̶ head
̶ tail
̶ grep
̶ ip -6 neighbor
̶ ip address
̶ ip neighbor
There is another endopint, POST /runsigned, which will run shell scripts signed by Secure Workload. It runs gpg -d on the POSTed data. If it can be verified against a signature, it will run the encrypted text under a shell. This means importing a public key on each server as part of the ansible setup and the need to keep the private key secure.
Users with Customer Support privileges can use Run Book by selecting from the navigation bar at the left side of the window. Select POST from the drop-down menu. (Otherwise you will receive Page Not Found errors when running commands.)
Using the snapshot REST endpoint to restart services:
druid: 1.1.11.17:15151/service?args=supervisord%20restart
̶ druid hosts are all IPs .17 through .24; .17, .18 are coordinators, .19 is the indexer, and .20-.24 are brokers
hadoop pipeline launchers:
̶ 1.1.11.25:15151/svrestart?args=activeflowpipeline
̶ 1.1.11.25:15151/svrestart?args=adm
̶ 1.1.11.25:15151/svrestart?args=batchmover_bidir
̶ 1.1.11.25:15151/svrestart?args=batchmover_machineinfo
̶ 1.1.11.25:15151/svrestart?args=BDPipeline
̶ 1.1.11.25:15151/svrestart?args=mongo_indexer
̶ 1.1.11.25:15151/svrestart?args=retentionPipeline
policy engine
̶ 1.1.11.25:15151/svrestart?args=policy_server
wss
̶ 1.1.11.47:15151/svrestart?args=wss
To run any endpoint, you will need to go to the page from the navigation bar at the left side of the window.
You can also view each endpoint overview in the explore page by running a POST command on any host as <end- point>?usage=true.
For example: makecurrent?usage=true
|
Endpoint |
Description |
|---|---|
|
bm_details |
|
|
endpoints |
|
|
members |
|
|
port2cimc |
|
|
status |
|
|
vm_info |
|
|
Endpoint |
Description |
|---|---|
|
bm_shutdown_or_reboot |
|
|
cat |
|
|
cimc_password_random |
|
|
cleancmdlogs |
|
|
clear_sel |
|
|
cluster_fw_upgrade |
|
|
cluster_fw_upgrade_status |
|
|
cluster_powerdown |
|
|
collector_status |
|
|
consul_kv_export |
|
|
consul_kv_recurse |
|
|
df |
|
|
dig |
|
|
dmesg |
|
|
dmidecode |
|
|
druid_coordinator_v1 |
|
|
du |
|
|
dusorted |
|
|
externalize_change_tunnel |
|
|
externalize_mgmt |
|
|
externalize_mgmt_read_only_password |
|
|
fsck |
|
|
get_cimc_techsupport |
|
|
syslog_endpoints |
|
|
grep |
|
|
hadoopbalancer |
|
|
hadoopdu |
|
|
hadoopfsck |
|
|
hadoopls |
|
|
hbasehbck |
|
|
hdfs_safe_state_recover |
|
|
initctl |
|
|
head |
|
|
internal_haproxy_status |
|
|
ip |
|
|
ipmifru |
|
|
ipmilan |
|
|
ipmisel |
|
|
ipmisensorlist |
|
|
jstack |
|
|
ls |
|
|
lshw |
|
|
lsof |
|
|
lvdisplay |
|
|
lvs |
|
|
lvscan |
|
|
makecurrent |
|
|
mongo_rs_status |
|
|
mongo_stats |
|
|
mongodump |
|
|
monit |
|
|
namenode_jmx |
|
|
ndisc6 |
|
|
netstat |
|
|
ntpq |
|
|
orch_reset |
|
|
orch_stop |
|
|
ping |
|
|
ping6 |
|
|
ps |
|
|
pv |
|
|
pvs |
|
|
pvdisplay |
|
|
rdisc6 |
|
|
rebootnode |
|
|
recover_rpmdb |
|
|
recoverhbase |
|
|
recovervm |
|
|
restartservices |
|
|
runsigned |
|
|
service |
|
|
smartctl |
|
|
storcli |
|
|
sudocat |
|
|
sudogrep |
|
|
sudohead |
|
|
sudols |
/var/log or /local/logs |
|
sudotail |
/var/log or /local/logs |
|
sudozgrep |
|
|
sudozcat |
|
|
svrestart |
|
|
svstatus |
|
|
switchinfo |
|
|
switch_namenode |
|
|
switch_secondarynamenode |
|
|
switch_yarn |
|
|
tail |
|
|
toggle_chassis_locator |
|
|
tnp_agent_logs |
|
|
tnp_datastream |
|
|
ui_haproxy_status |
|
|
uptime |
|
|
userapps_kill |
|
|
vgdisplay |
|
|
vgs |
|
|
vmfs |
|
|
vminfo |
|
|
vmlist |
|
|
vmreboot |
|
|
vmshutdown |
|
|
vmstart |
|
|
vmstop |
|
|
yarnkill |
|
|
yarnlogs |
|
|
zcat |
|
|
zgrep |
|
Server maintenance involves replacement of any faulty server component like Hard Disk, Memory or replacement of the entire server itself.
Note |
If there are multiple servers on the cluster that need maintenance then do server maintenance on them one at a time. Decommissioning multiple servers at the same time can lead to loss of data. |
The Cluster Status page (accessed from the Troubleshoot menu in the left navigation bar) is used to perform all the steps involved in server maintenance. It can be accessed by all users but the actions can be carried out by Customer Support users only. It shows the status of all the physical servers in Cisco Secure Workload rack.
Steps involved in server or component replacement
Determine the server that requires maintenance : This can be done using the server Serial number or the Switchport the server is connected to , from the Cluster Status page. Note the CIMC IP of the server to be replaced. it would be shown in the server box on the Cluster Status page
Check for actions for special VMs : From the server box find out the VMs or instances present on the server and check if any special actions need to be carried out for those VMs. The next section lists out Actions for VMs during server maintenance.
Decommission the server : Once any pre-decommission actions are performed, use the Cluster Status page to decommission the server. Even if the server has failed and appears Inactive on the page , we still have to perform all the server maintenance steps. Decommission steps can be performed even if the server is powered off
Perform server maintenance : After the node is marked Decommissioned on the Cluster Status page perform any post decommission special actions for the VMs. Any component or server replacement can be carried out now. If the entire server is replaced, then change the CIMC IP of the new server to be same as that of the replaced server. The CIMC IP for each server is available on the Cluster Status page
Reimage after component replacement : Reimage the server after the component replacement using the Clus- ter Status page. Reimage takes about 30 mins and requires cimc access to servers. The Server is marked NEW after reimage is completed.
Replacing entire server : If the entire server is replaced, then the server would appear in NEW state on the Cluster Status page. The s/w version for the server can be seen on the same page. If the s/w version is different from the s/w version of the cluster then reimage the server.
Commission the server : After the server is marked NEW we can kick of the commissioning of the node from the Cluster Status page. This step will provision the VMs on the server. Commissioning of a server takes about 45 mins. The server will be marked Commissioned after commissioning completes.
Actions for VMs during server maintenance
Some of the VMs require special actions during the server maintenance procedure. These actions could be pre- decommission, post-decommission or post-commission.
Orchestrator primary : This is a pre-decommission action. If the server undergoing maintenance has primary orchestrator on it, then POST orch_stop command to orchestrator.service.consul from explore page before doing decommission. This will switch the primary orchestrator.
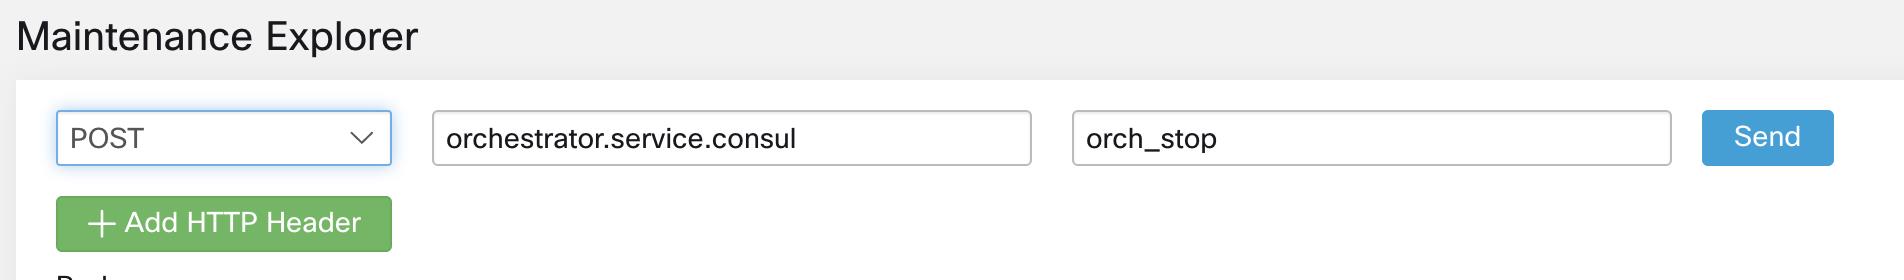
If you try to decommission a server with primary orchestrator, you will see the following error

To determine the orchestrator primary run the explore command “primaryorchestrator” on any host.
Namenode : If the server undergoing maintenance has namenode VM on it, then POST switch_namenode on orchestrator.service.consul from explore page after decommission and then POST switch_namenode on orches- trator.service.consul after commission. This is both post-decommission and post-commission action.
Secondary namenode : If the server undergoing maintenance has secondarynamenode VM on it, then POST switch_secondarynamenode on orchestrator.service.consul from explore page after decommission and then POST switch_secondarynamenode on orchestrator.service.consul after commission. This is both post- decommission and post-commission action.
Resource manager primary : If the server undergoing maintenance has resourcemanager primary on it, then POST switch_yarn on orchestrator.service.consul from explore page. This is both post-decommission and post- commission action.
Datanode : The cluster tolerates only one Datanode failure at a time. If multiple servers having Datanode VMs need servicing, then do server maintenance on them one at a time. After each server maintenance wait for the chart under Monitoring | hawkeye | hdfs-monitoring | Block Sanity Info, Missing blocks and Under replicated counts to be 0.
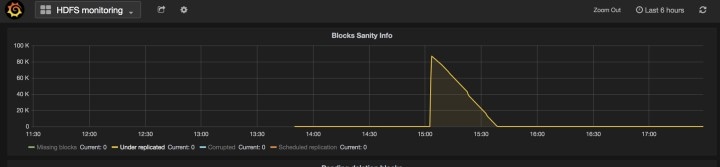
Troubleshooting server maintenance
Logs : All the server maintenance logs are part of the orchestrator log. The location is /local/logs/tetration/orchestrator/orchestrator.log on orchestrator.service.consul.
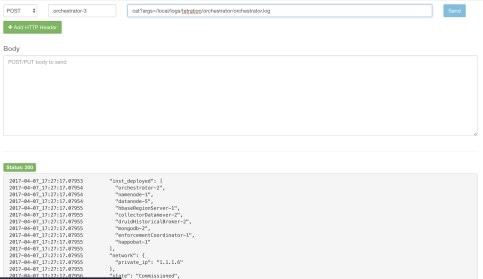
Decommission :
This step deletes the VMs/instances on the server.
It then deletes the entry of these instances in backend consul tables.
This step takes about 5 mins.
The server will be marked Decommissioned once the step completes.
Note |
Decommissioned does not mean the server is powered off. Decommissioning only deletes the Secure Workload content on the server. |
If the server is powered off it will be marked Inactive. We can still run Decommission on this server from the cluster status page. But the VMs deletion step will not run since the server is powered off. Make sure this server does not join back the cluster in decommissioned state. It needs to be reimaged and added back to the cluster.
Reimage :
This step installs the Secure Workload base OS or Hypervisor OS on the server.
It also formats the hard drives and installs few Secure Workload libraries on the server.
Reimage runs a script called mjolnir to initiate the server imaging. mjolnir run takes about 5 mins after which the actual imaging begins. Imaging takes about 30 mins. The logs during imaging can be seen only on the console of the server being reimaged. The user can use ta_dev key to check for additional info regarding the reimage, like /var/log/nginx logs during pxe boot up, /var/log/messages to check for dhcp ip and pxe boot configs.
Reimage requires CIMC connectivity from the orchestrator. The easiest way to check for cimc con- nectivity is to use explore page and POST ping?args=<cimc ip> from orchestrator.service.consul. Remember to change the CIMC IP incase the server is replaced and set the cimc password to the default password
Also cimc network should have been set in site info when the cluster is deployed so that the switches get configured with the correct routes. In case the cluster cimc connectivity is not set correctly you will see the following result in the orchestrator logs.
Commission:
Commissioning schedules the VMs on the server and runs playbooks in the VMs to install Secure Workload software
it takes about 45 mins for commissioning to finish.
The workflow is similar to deploy or upgrade.
The Logs will indicate any failures during commissioning
The server on the cluster status page will be marked initialized during commissioning and marked commissioned only after the step completes
If a hardware failure is detected upon restart of a cluster after power shutdown, currently the cluster gets stuck in a state where we can neither run Reboot workflow to get services stable nor run Commission workflow as down services result in commissioning failure. This feature is expected to help in such scenarios by allowing user to reboot (upgrade) with a bad hardware, after which regular RMA process for the failed baremetal can be performed.
User is expected to use a post to explore endpoint with serial of the baremetal to be excluded.
Action: POST
Host: orchestrator.service.consul
Endpoint: exclude_bms?method=POST
Body: {“baremetal”: [“BMSERIAL”]}
Orchestrator performs few checks to determine if the exclusion is feasible. In which case, it will setup few consul keys and return success message indicating which baremetal and VMs will be excluded in the next reboot/upgrade workflow. If the baremetals include certain vms, they can’t be excluded as described in the Limitation section below, the explore endpoint will reply back with the message indicating why the exclusion is not possible. After successful post on the explore endpoint, user can initiate reboot/upgrade through main UI and proceed with reboot as usual. At the end of the upgrade, we remove the exclude bm list. If there is a need to run upgrade/reboot again with exclude BMs, users are expected to post to the bmexclude explore endpoint again.
Limitations We don’t allow following VMs to be excluded currently. 1. namenode 2. secondaryNamenode 3. mon- godb 4. mongodbArbiter
Disk Maintenance involves replacement of any faulty hard disks from one or more servers. Orchestrator monitors the health of the disks as reported by bmmgr on every server in the cluster. If there are any faulty disks that are detected, it is indicated on a banner on the Cluster Status page (available from the Troubleshoot menu in the left navigation bar). The banner displays the number of disks that are in UNHEALTHY state. Clicking on here on the banner takes you to the disk replacement wizard where all the steps for the disk maintenance is performed. Like the Cluster Status page, the disk replacement page can be accessed by all users but the actions can be carried out by Customer Support users only.
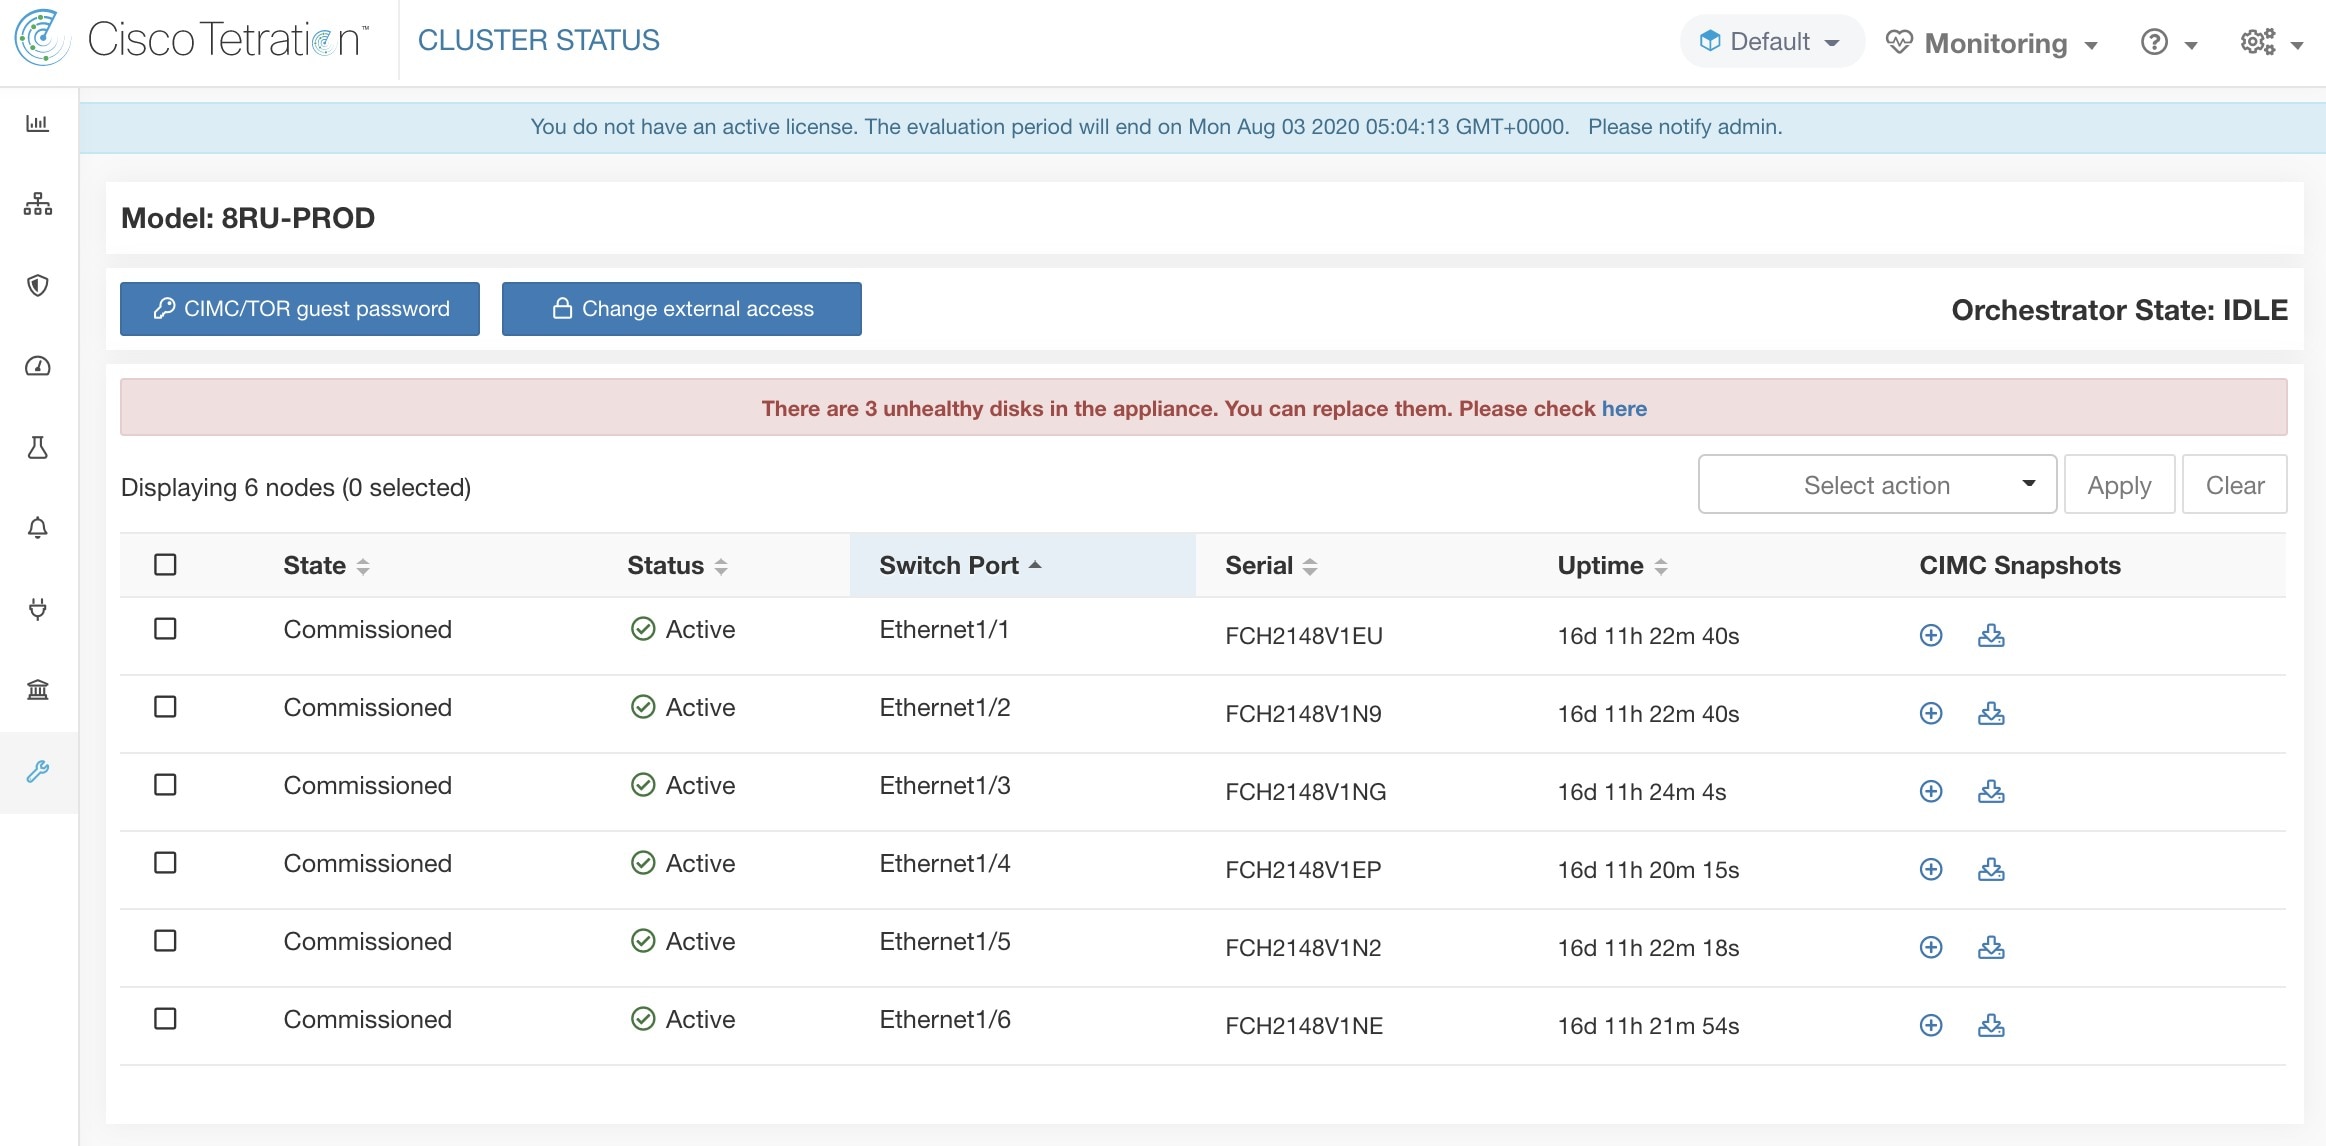
Before you start the replacement process, keep the replacement disks available.
The landing page of Disk Replacement Wizard shows the details of the failed disks. These details include the size, the type, the make and the model for every disk that needs replacement. It also shows the slot ID and lists all the VMs that use each of these disks.
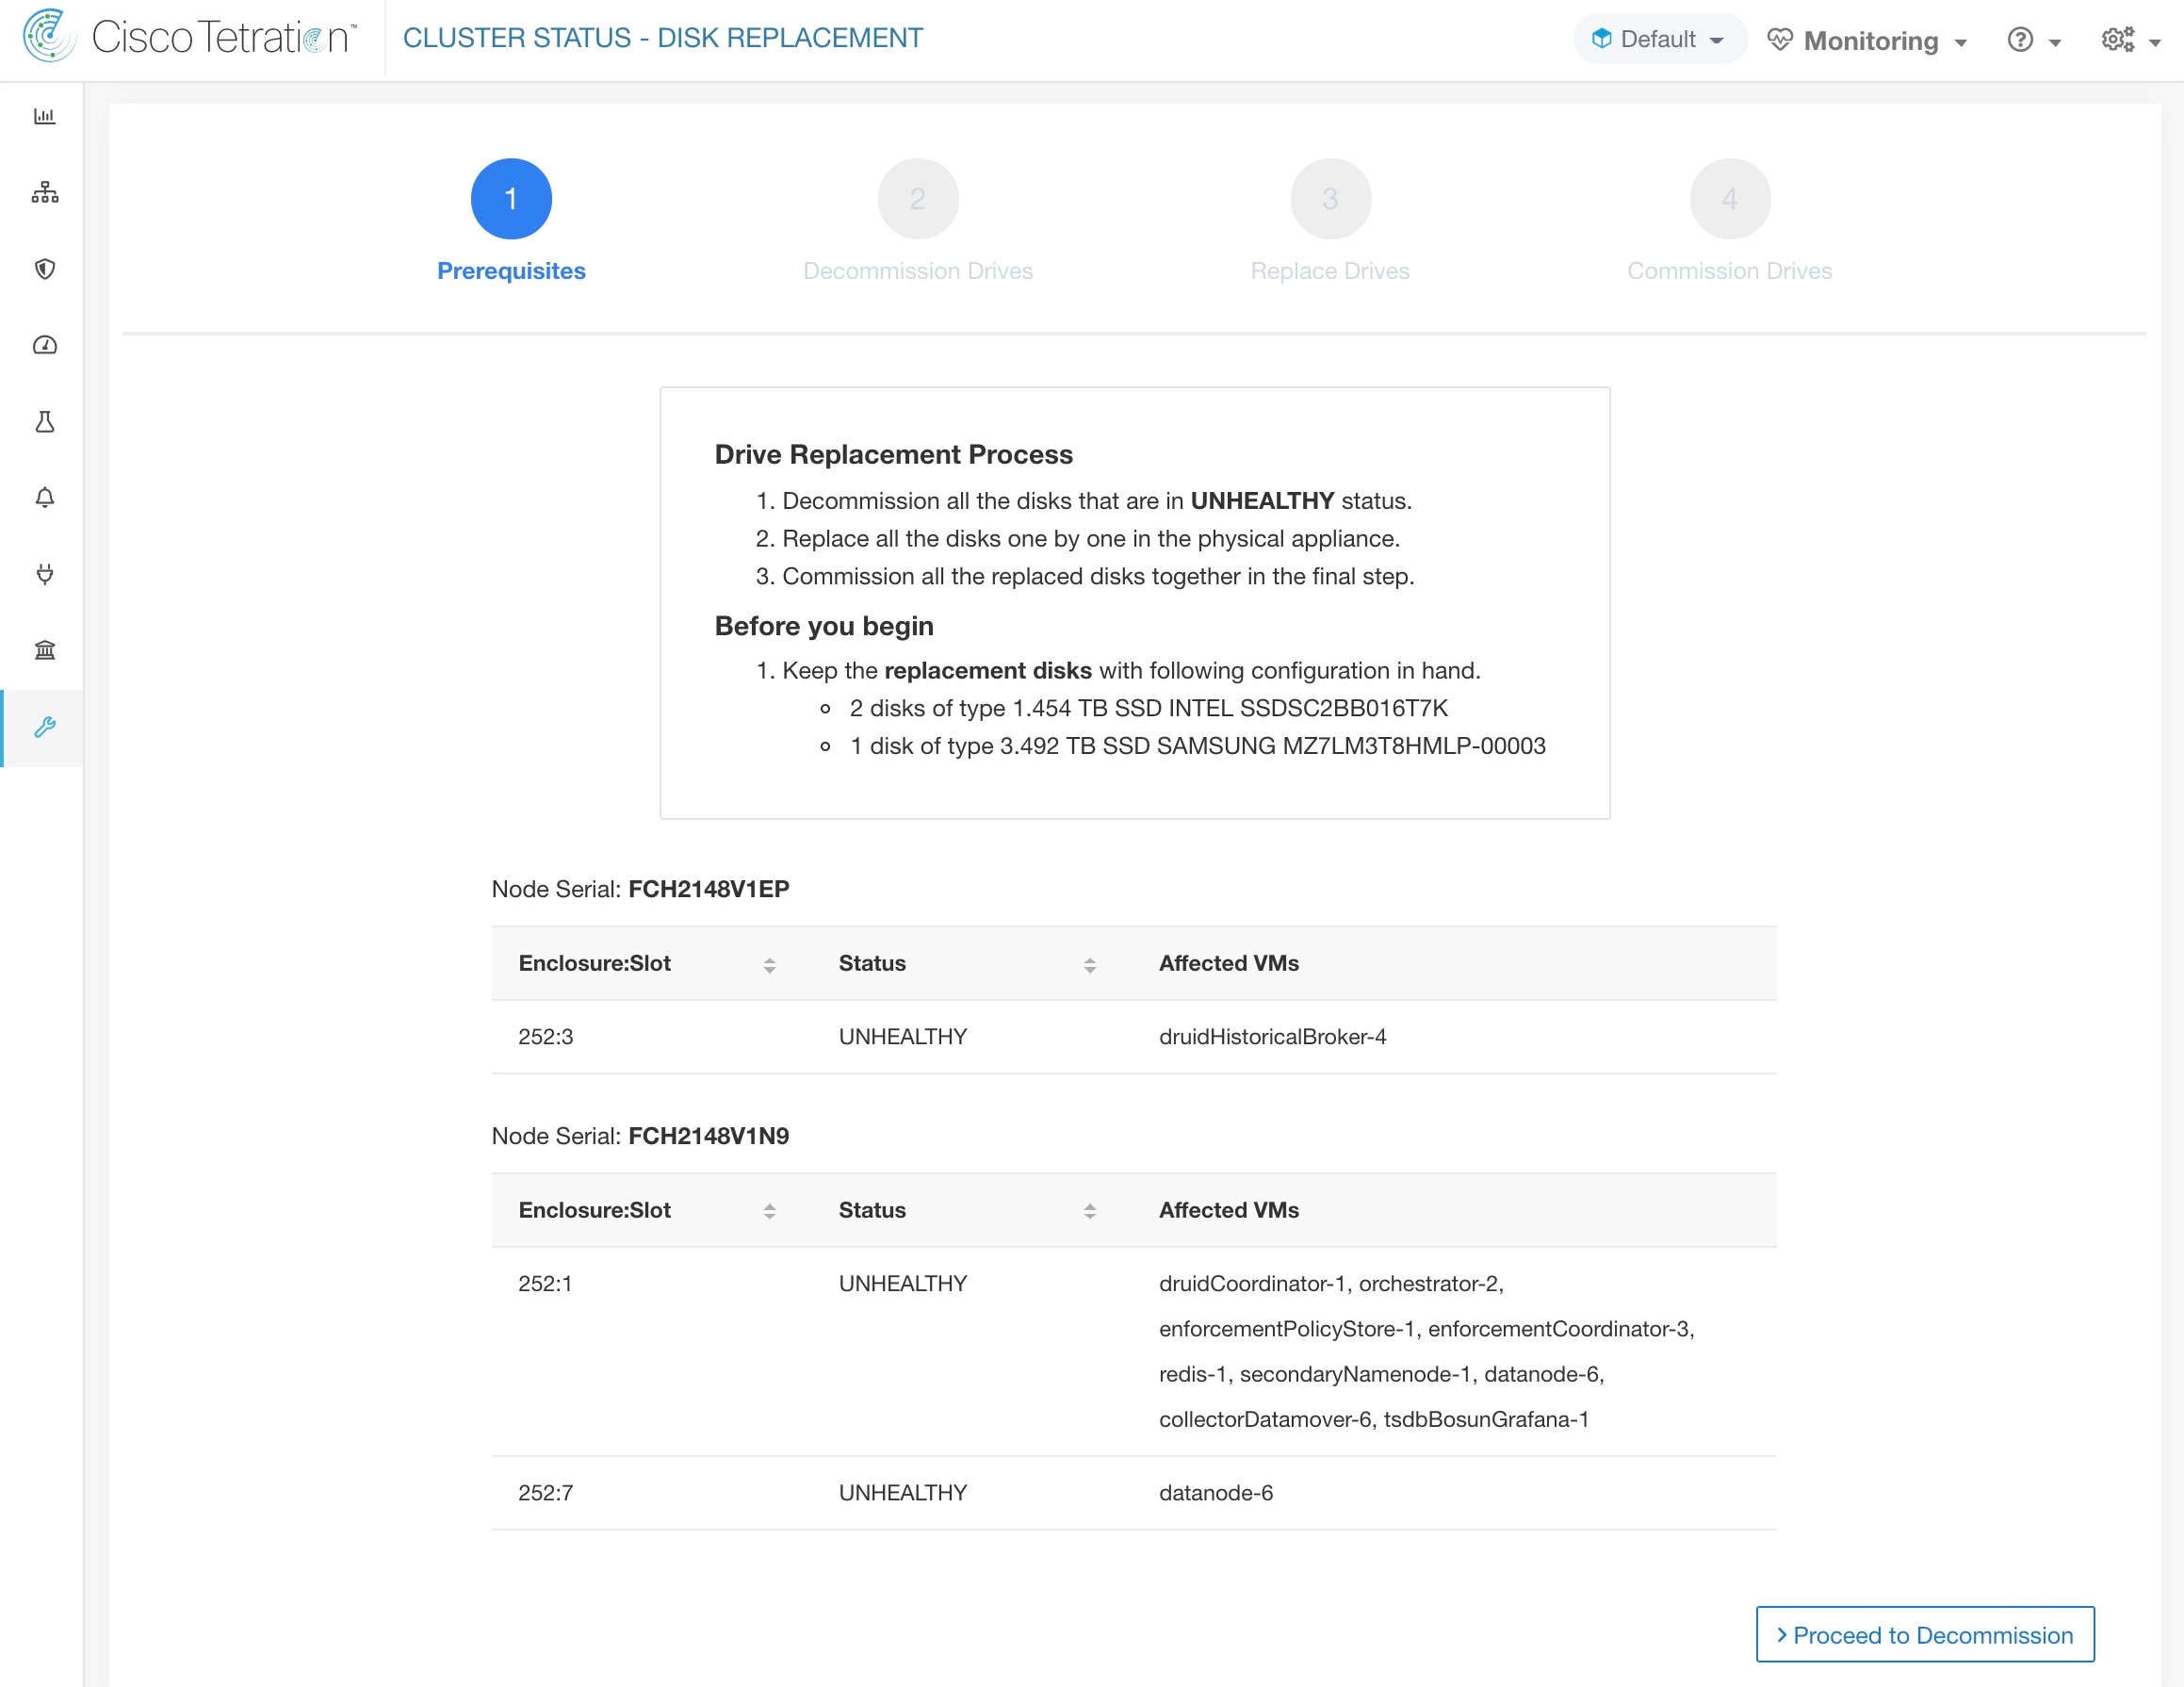
In the cluster, Hard Disks can have six states. HEALTHY, UNHEALTHY, UNUSED, REPLACED, NEW, and INITIALIZED. Upon deployment or upgrade, the status of every disk in the cluster is HEALTHY. Based of various error detections the status of one or more disks can become UNHEALTHY.
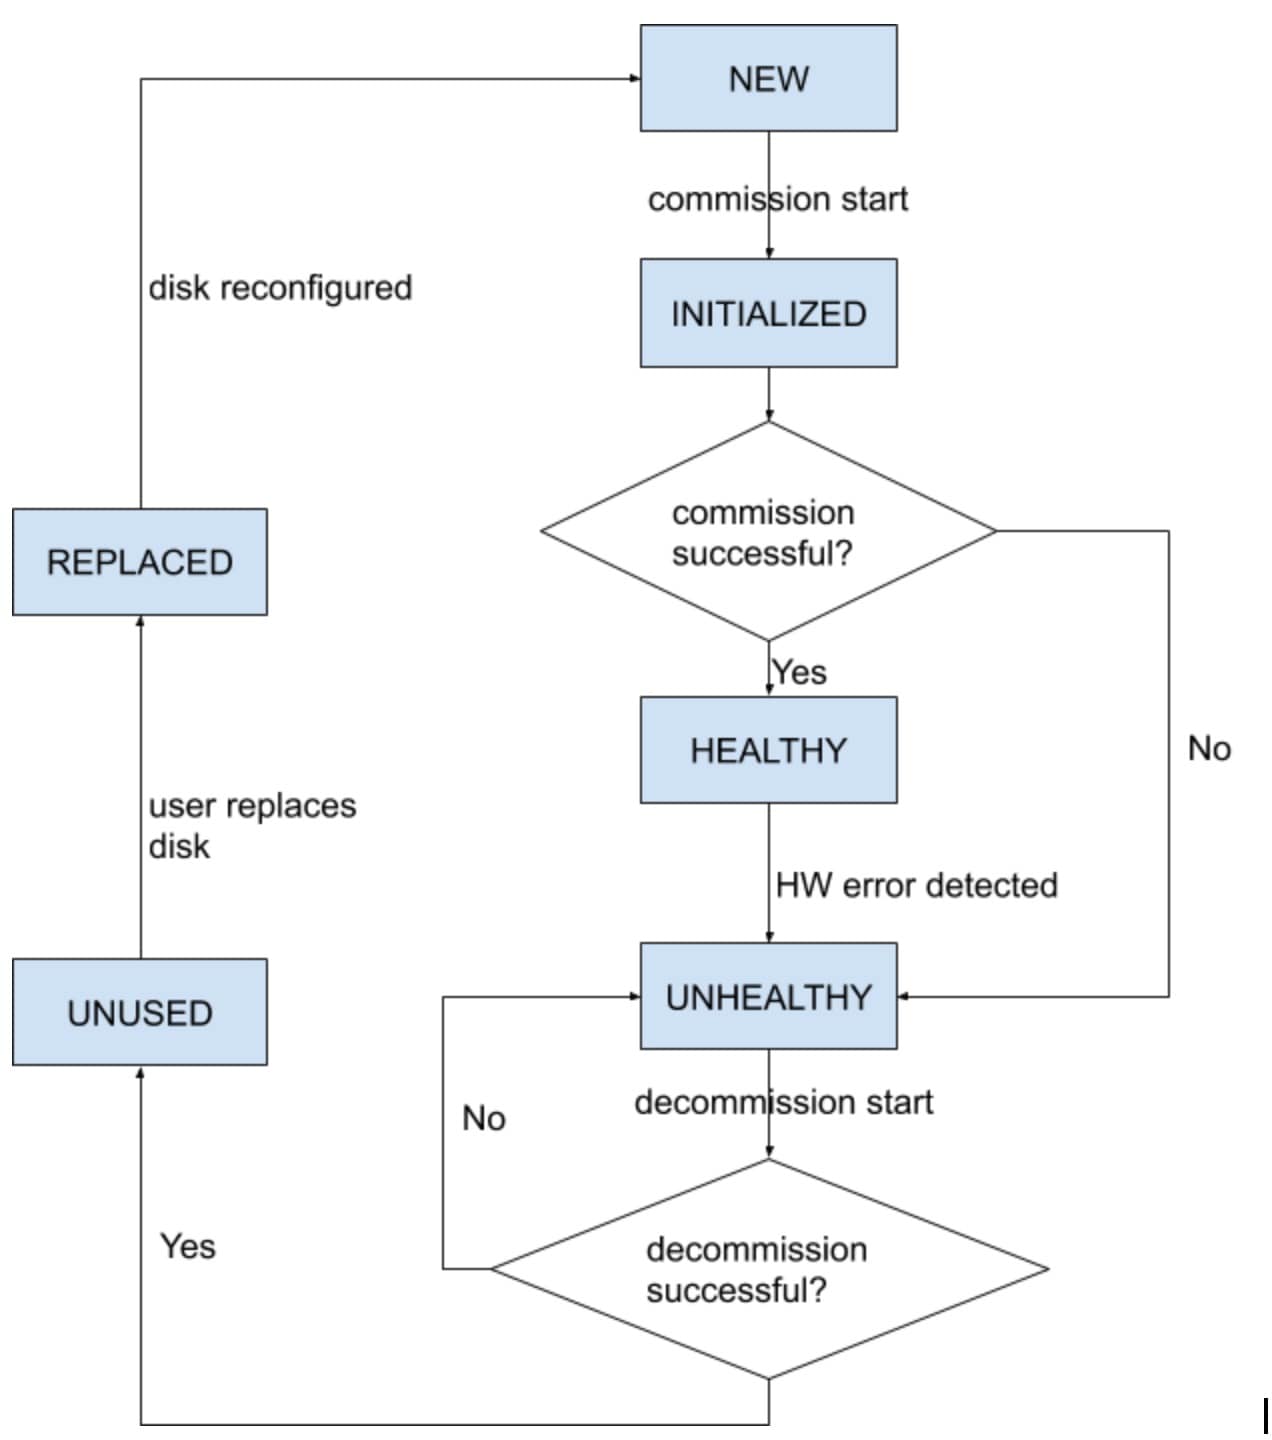
The first step of the disk replacement process is decommission where all the VMs that use these disks are removed from the cluster. The status of disks that are decommissioned become UNUSED. After decommission, the replacement disks should be inserted in their appropriate slots. Users confirm that the disks are replaced, which will be the backend’s signal to reconfigure the newly added disks. This will change the status to REPLACED and after the next hardware scan these replaced disks’ status will change to NEW. This transition can take 2–3 minutes.
Once all the disks have been replaced and reconfigured, you can deploy all the VMs that were removed as part of the decommission process. The start of commission changes the disk status to INITIALIZED. A successful commission makes all disks’ status HEALTHY. A failure in this step makes the status UNHEALTHY again so that we start the recovery from decommission again.
Before any of the decommission or commission step can take place, a requirement precheck must be performed. Backend performs various checks all of which must pass before user can proceed with the decommission or commission step. Any failed checks will be reported on the disk replacement wizard with the failure detail and suggested corrective action, which must be taken before the needed step can proceed.
Example of such pre check are: namenode and secondaryNamenode cannot be decommissioned together. only one datanode can be decommissioned at one time. namenode is healthy before commissioning.
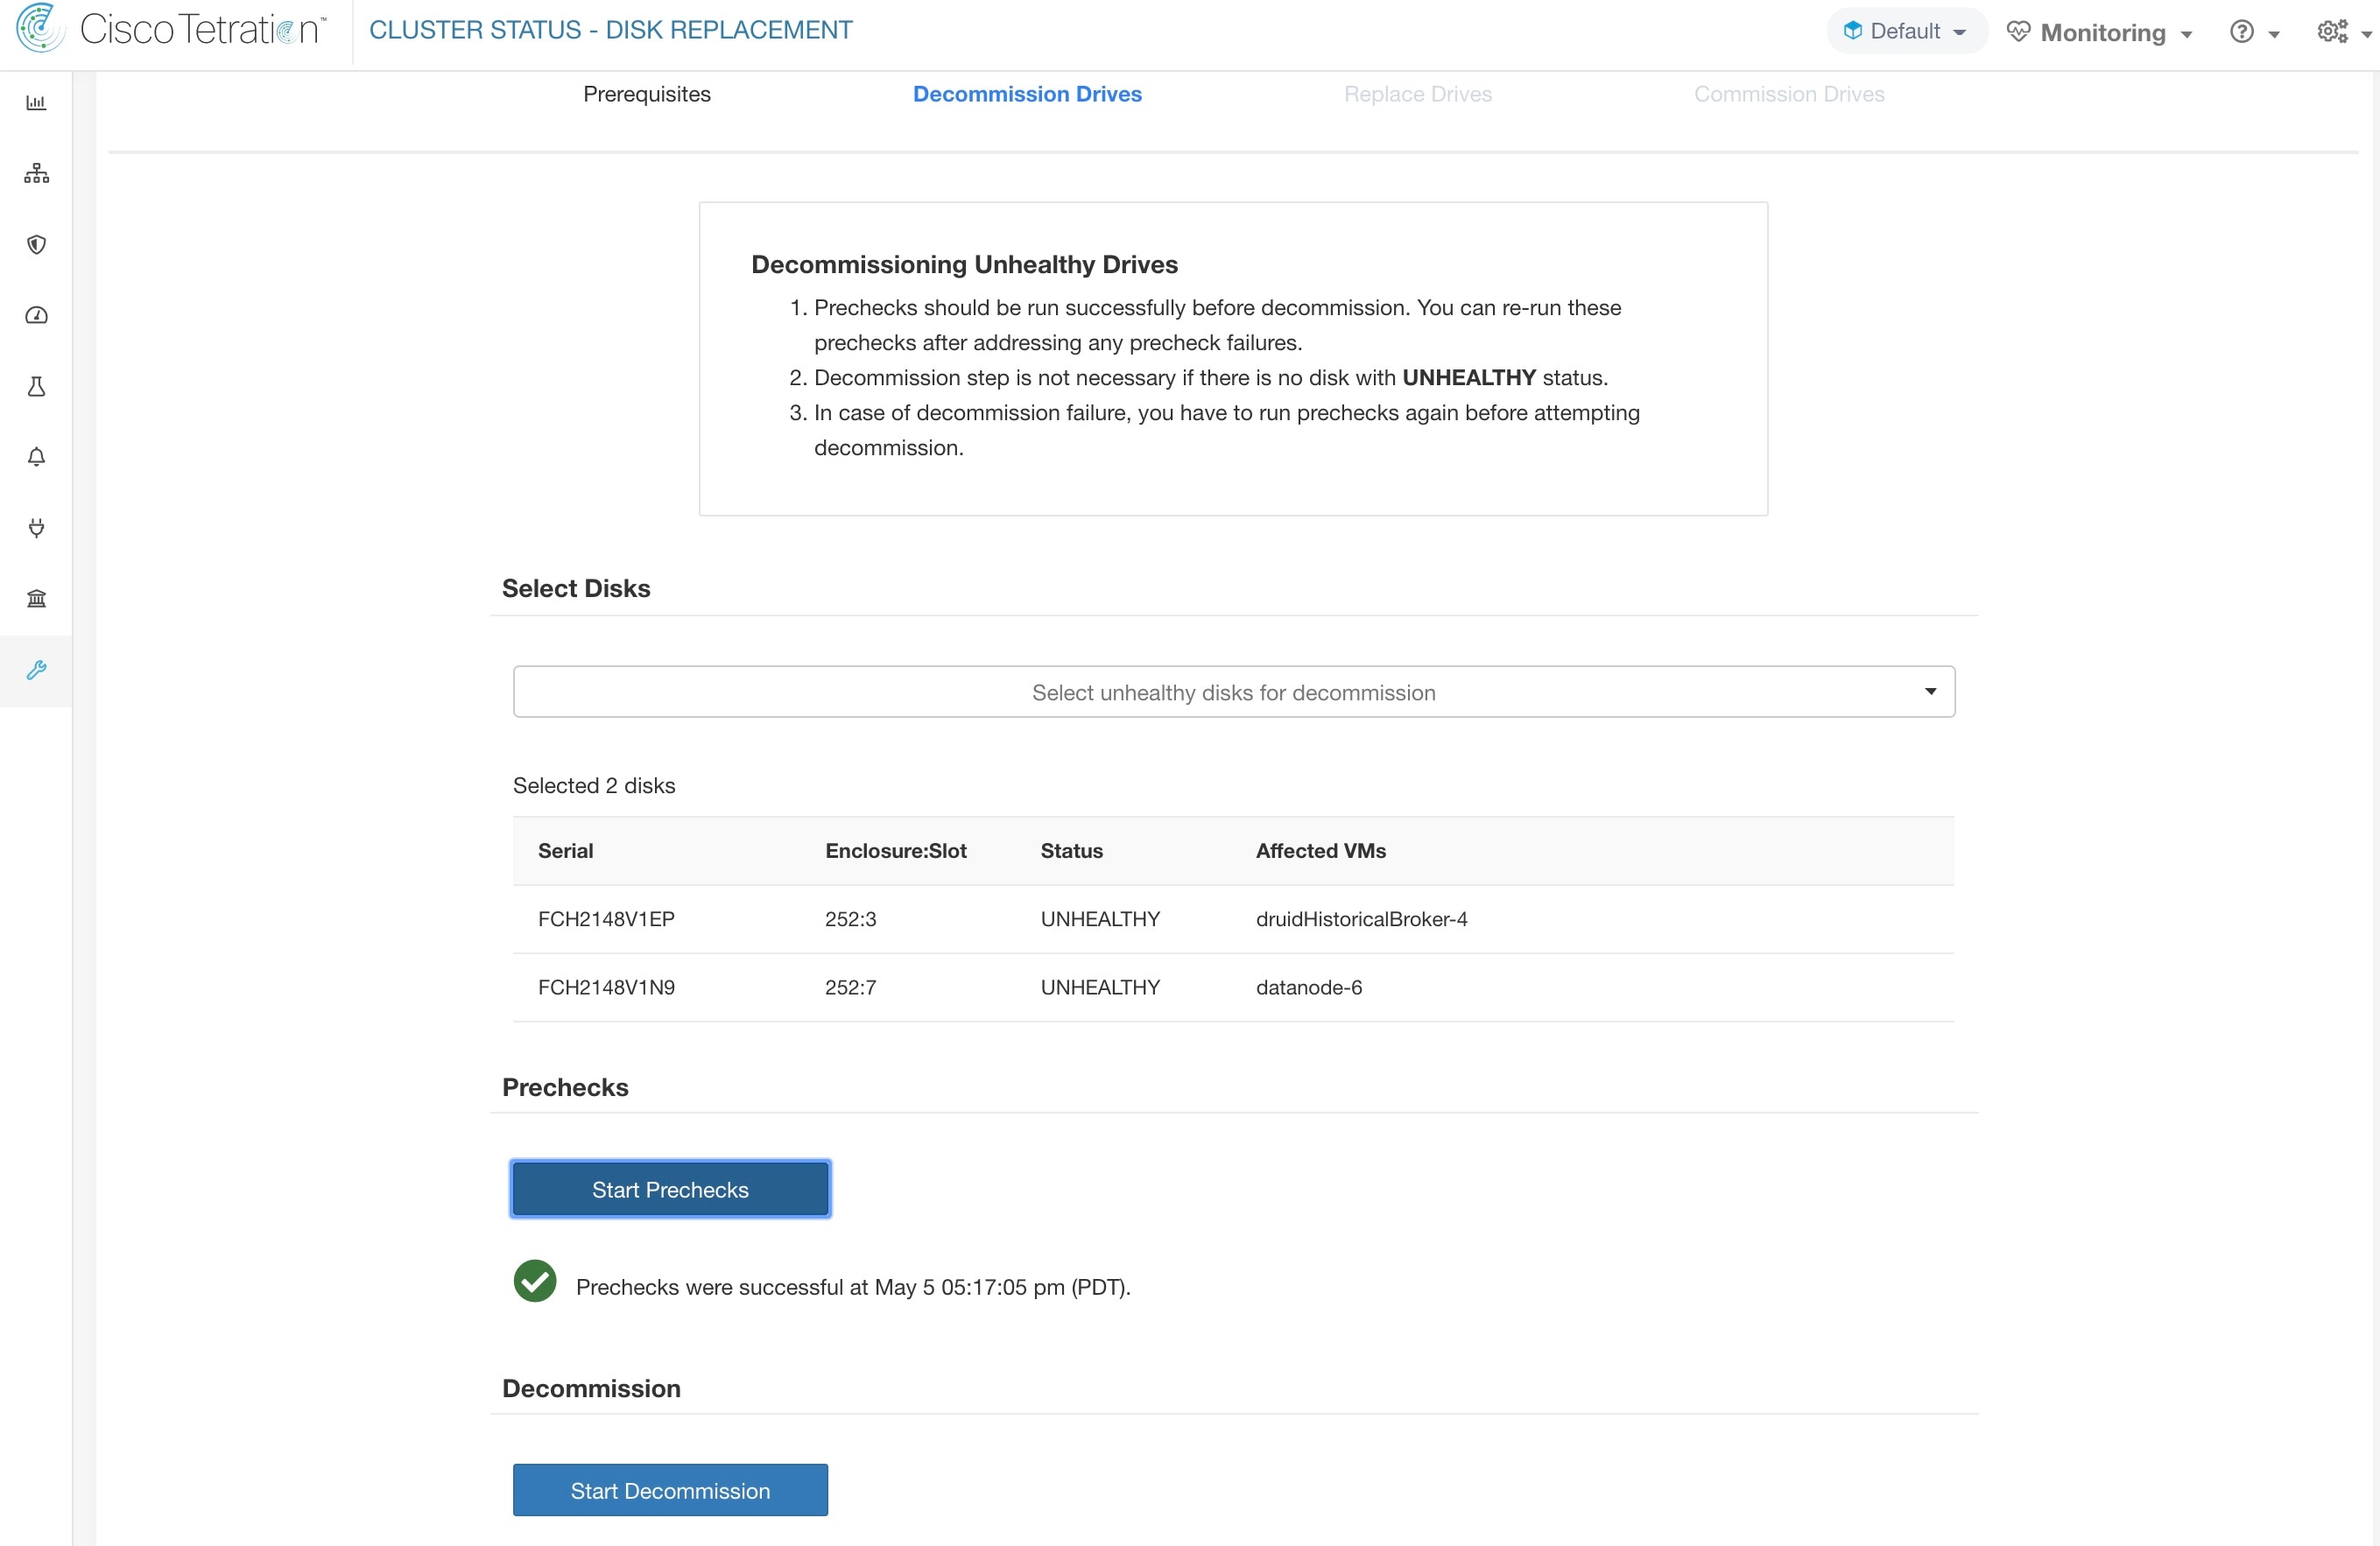
User can select any set of failed disks to be decommissioned together and start the decommission precheck. Changing the set of failed disk requires a rerun of the precheck. Same prechecks are checked again before the task (decommission/commission) starts to ensure that there are no new precheck failure between last precheck run and the start of the decommission task.
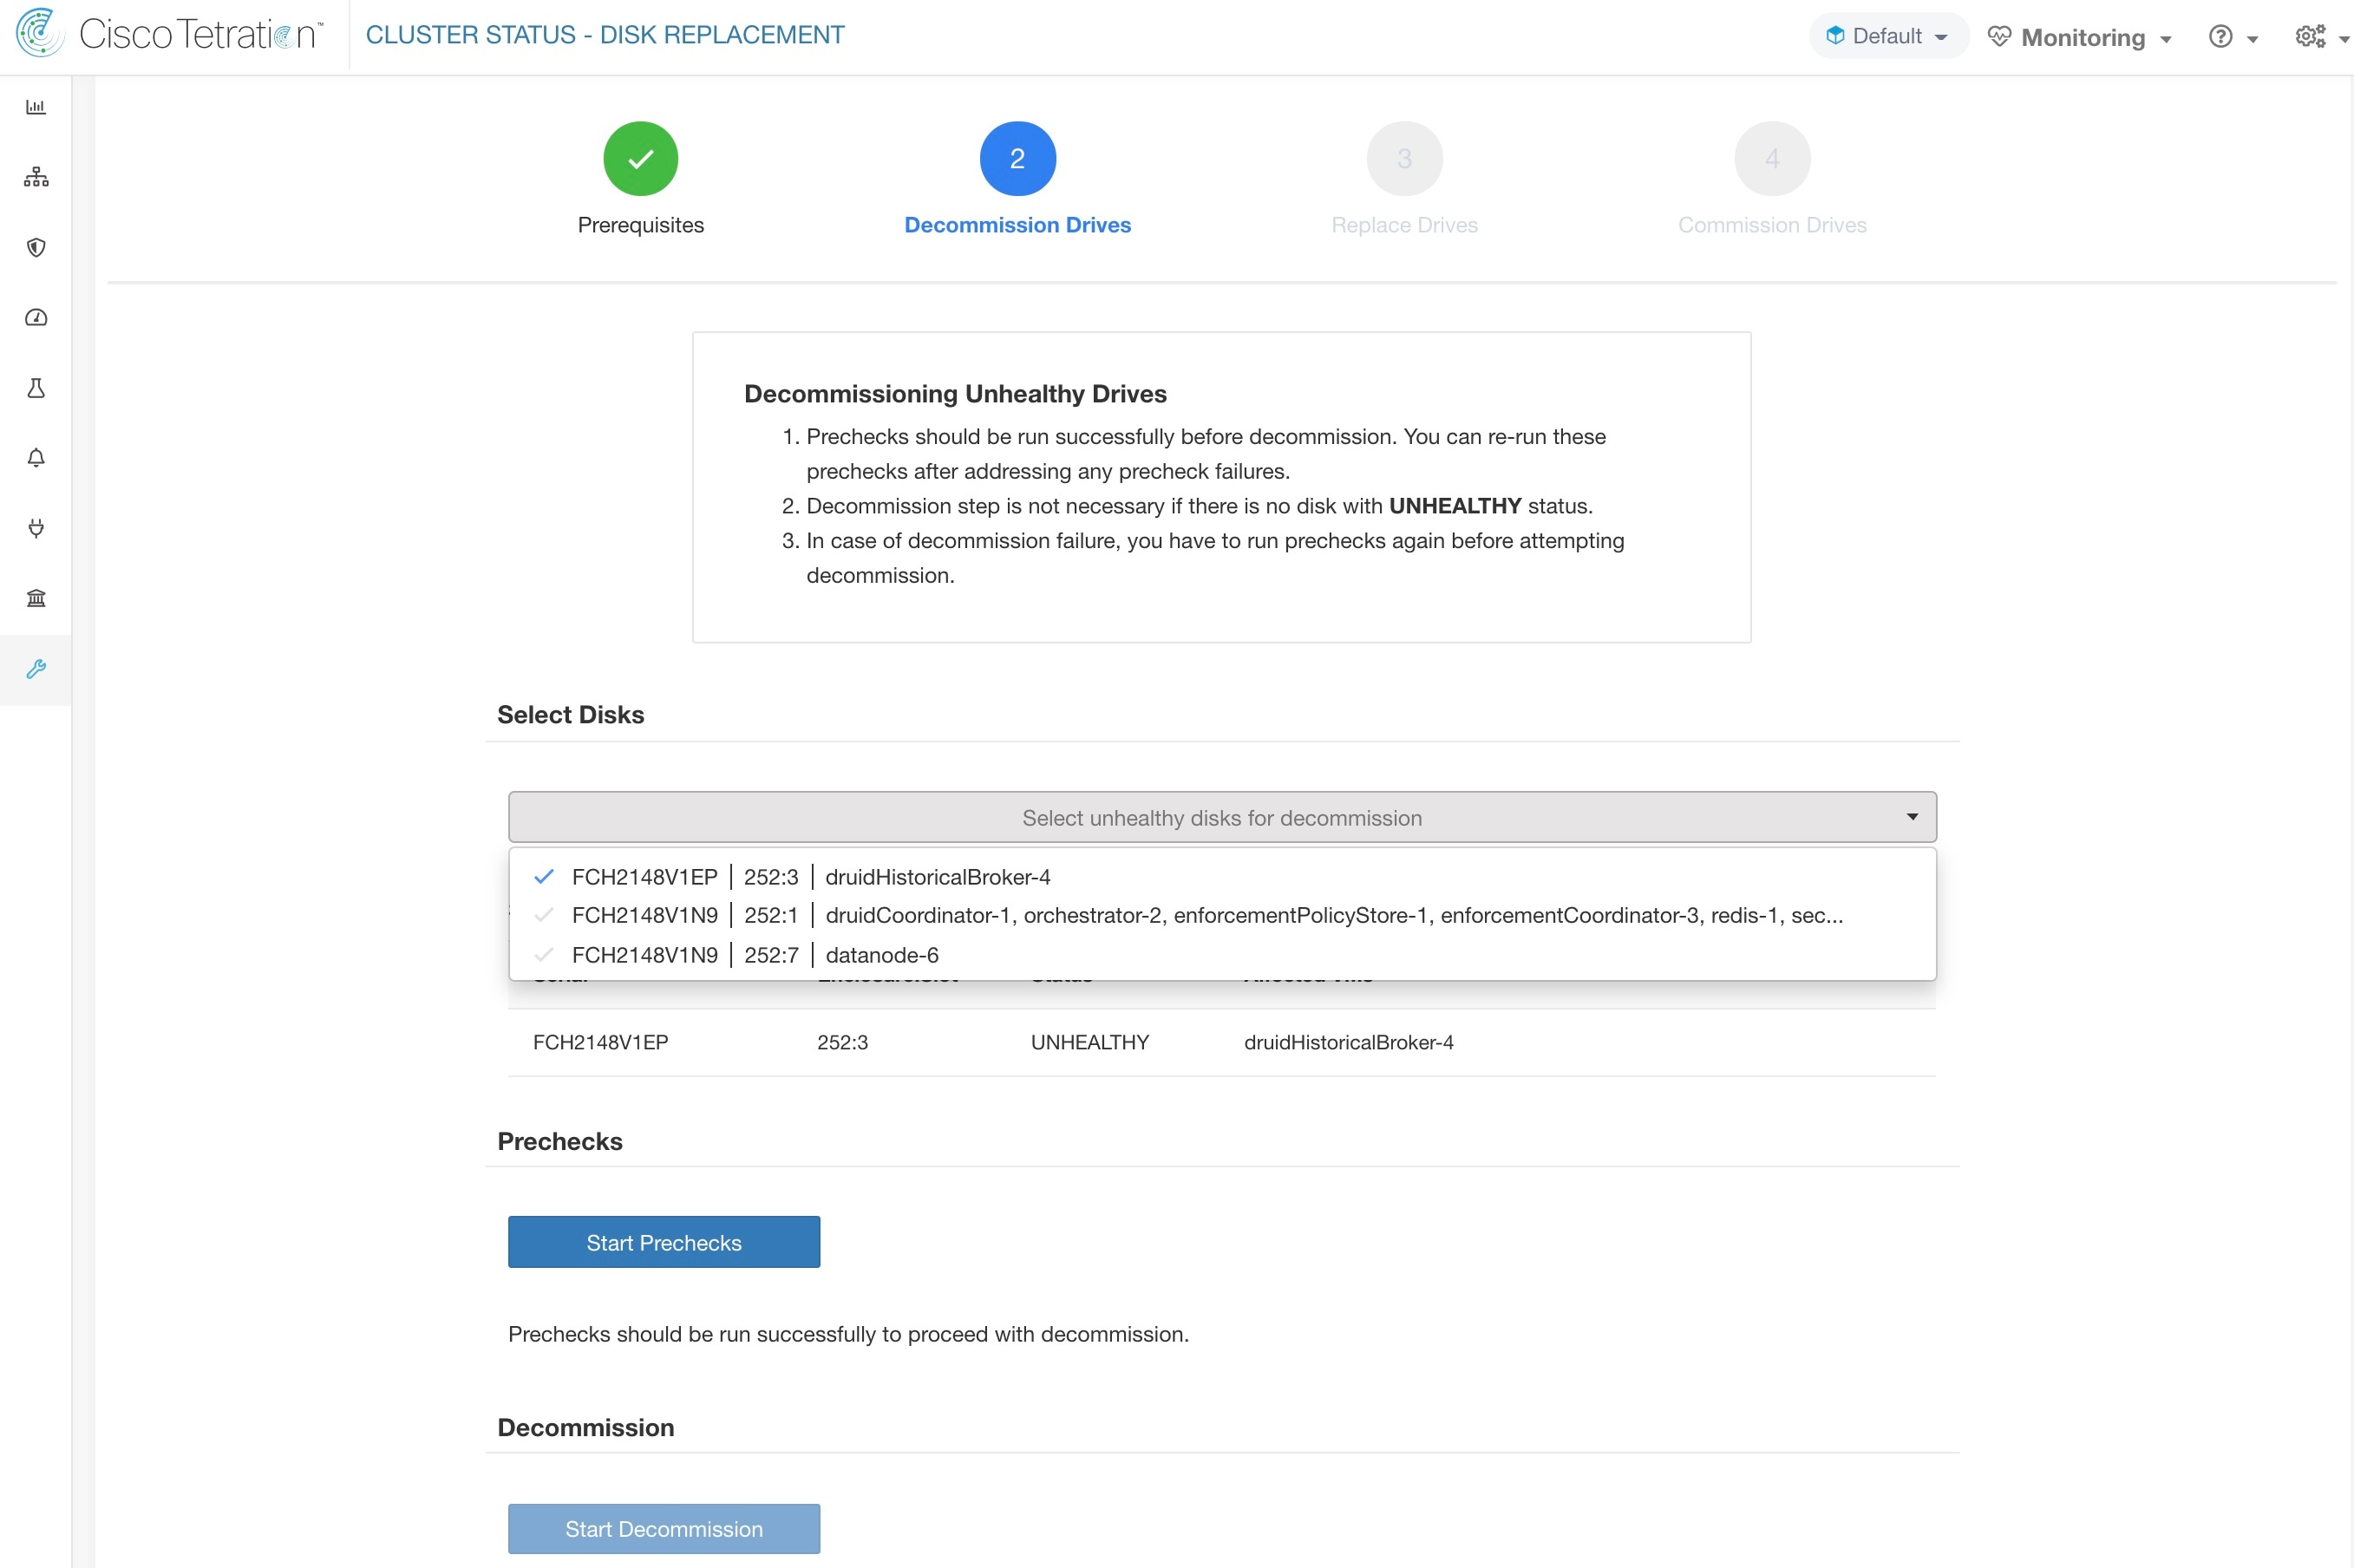
Upon any failed precheck, a detailed message can be seen by clicking on the failure message and a suggested action will be shown in a pop-over when pointer hovers over the red cross button.
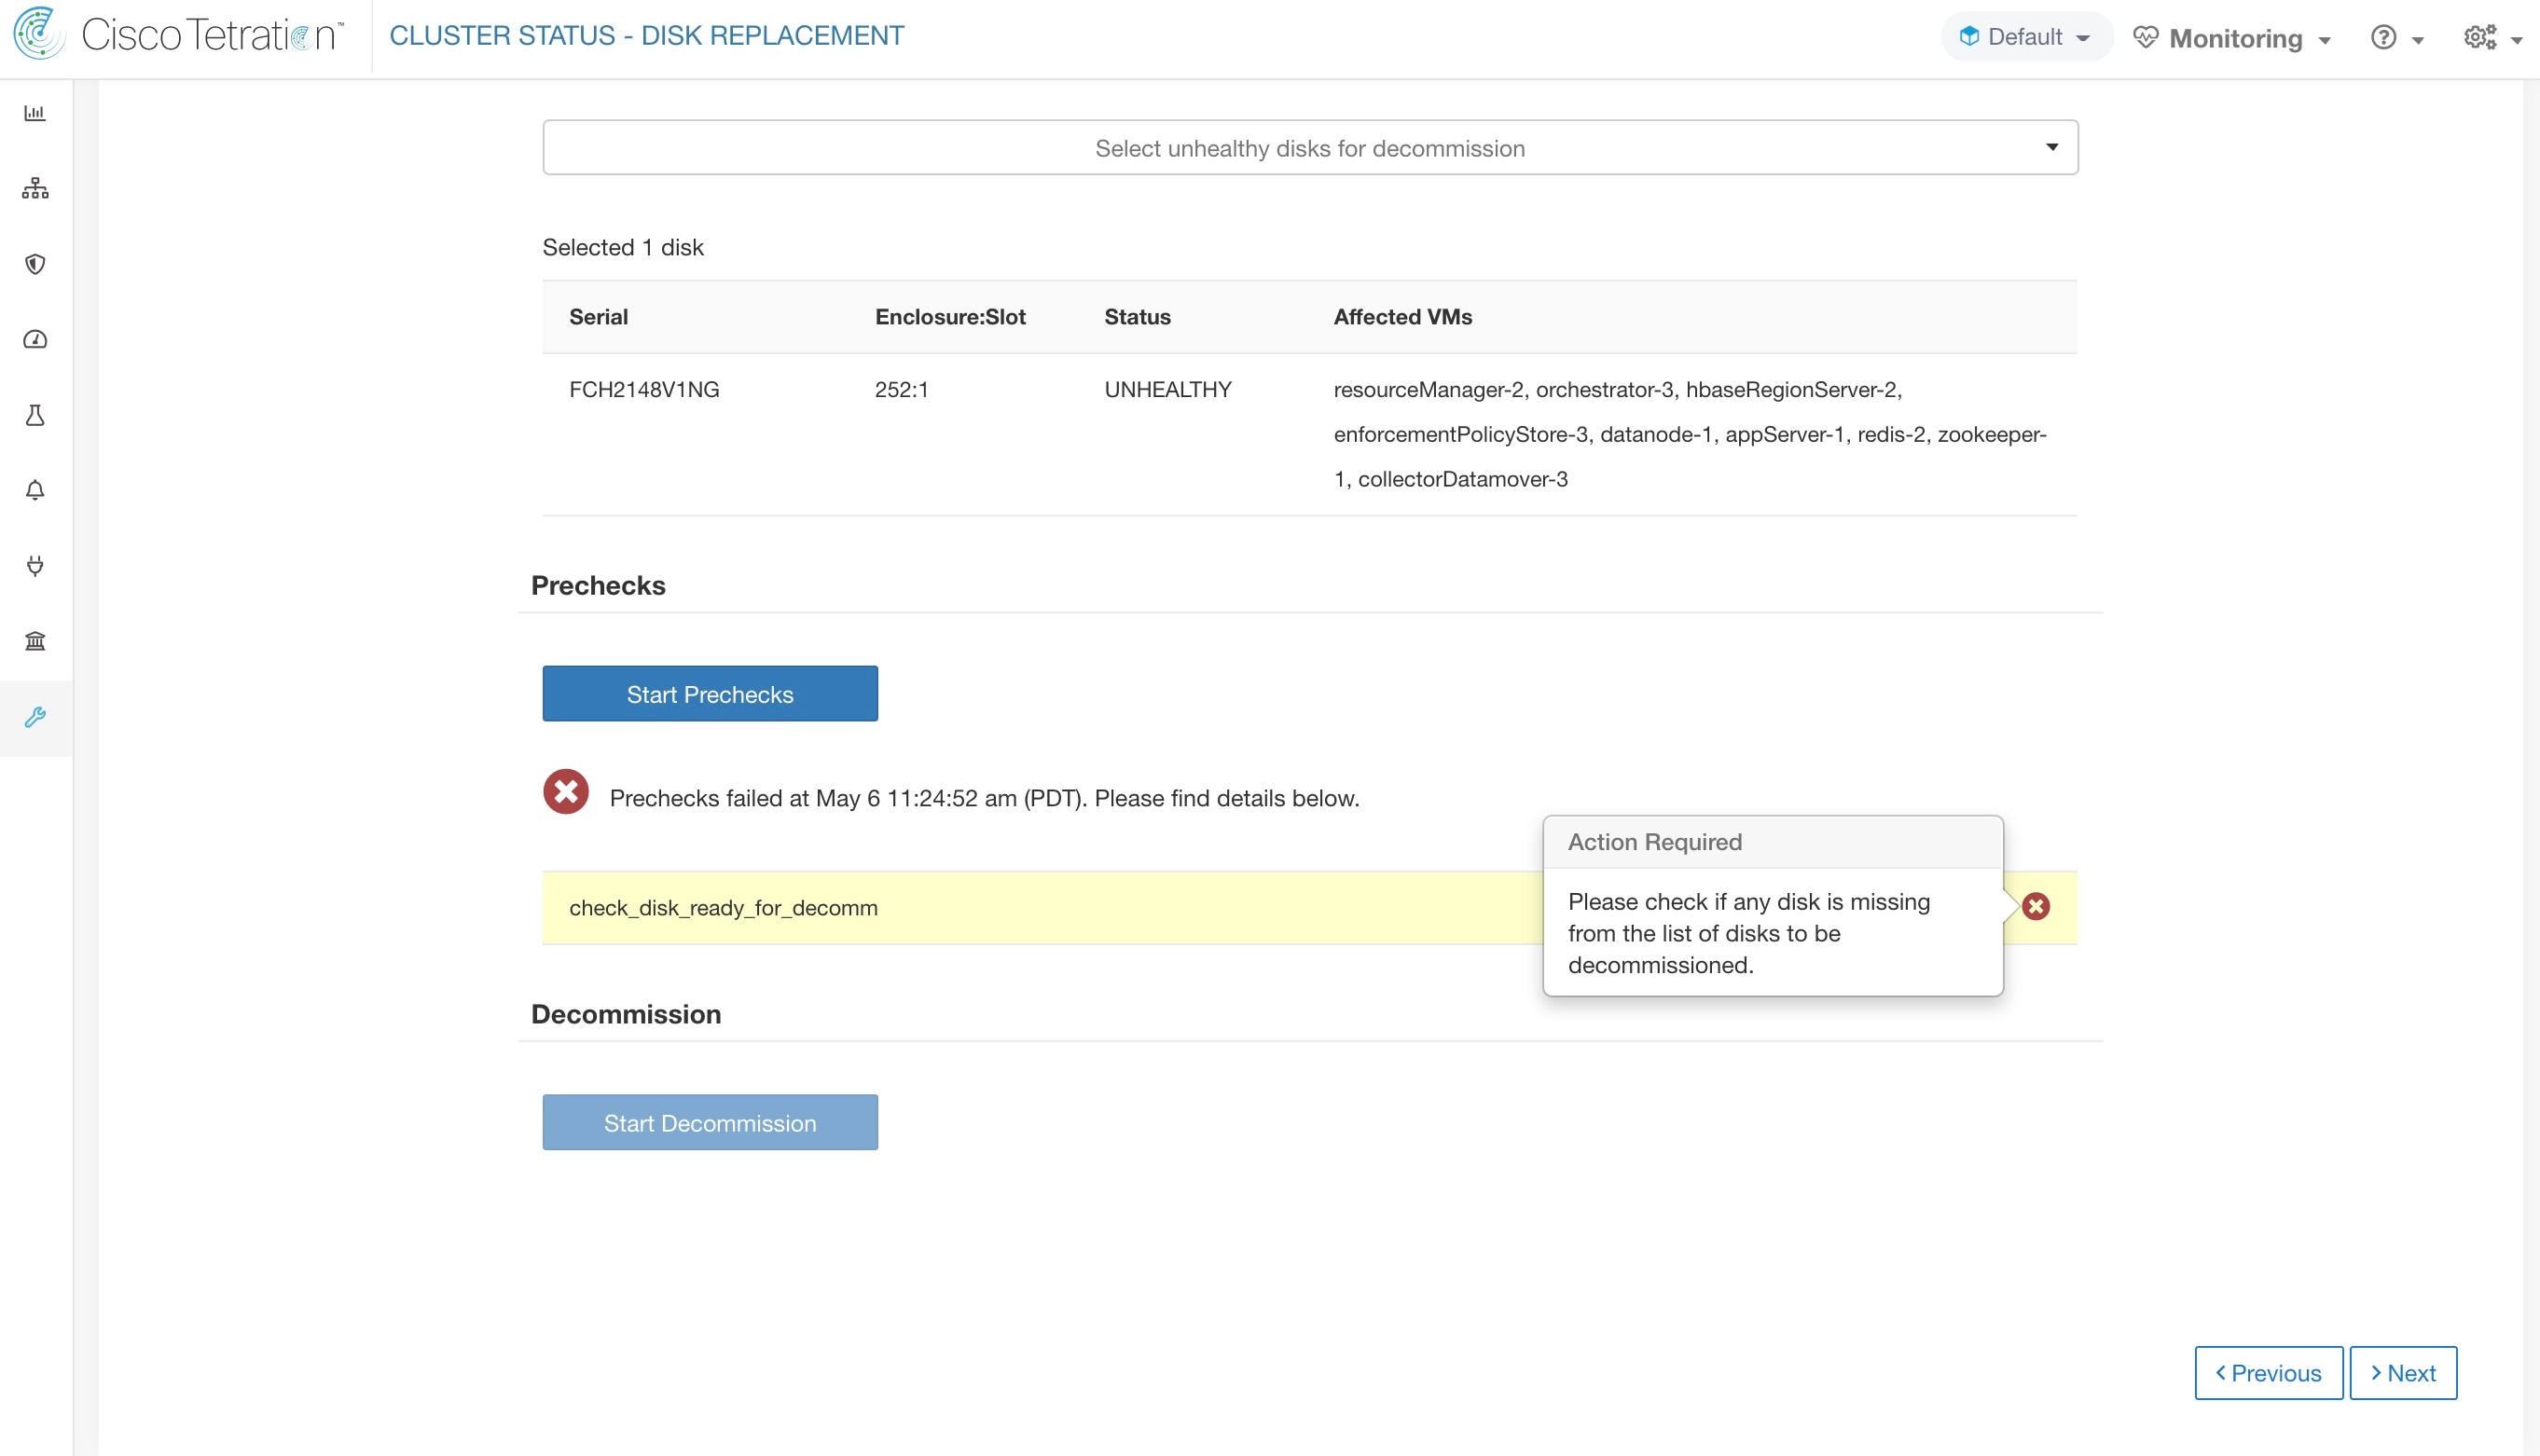
Once the prechecks passes, user can proceed to decommission disk. The progress of decommission will be shown on the disk replacement wizard. Once progress of decommission reaches 100%, all the decommissioned disk status changes to UNUSED.
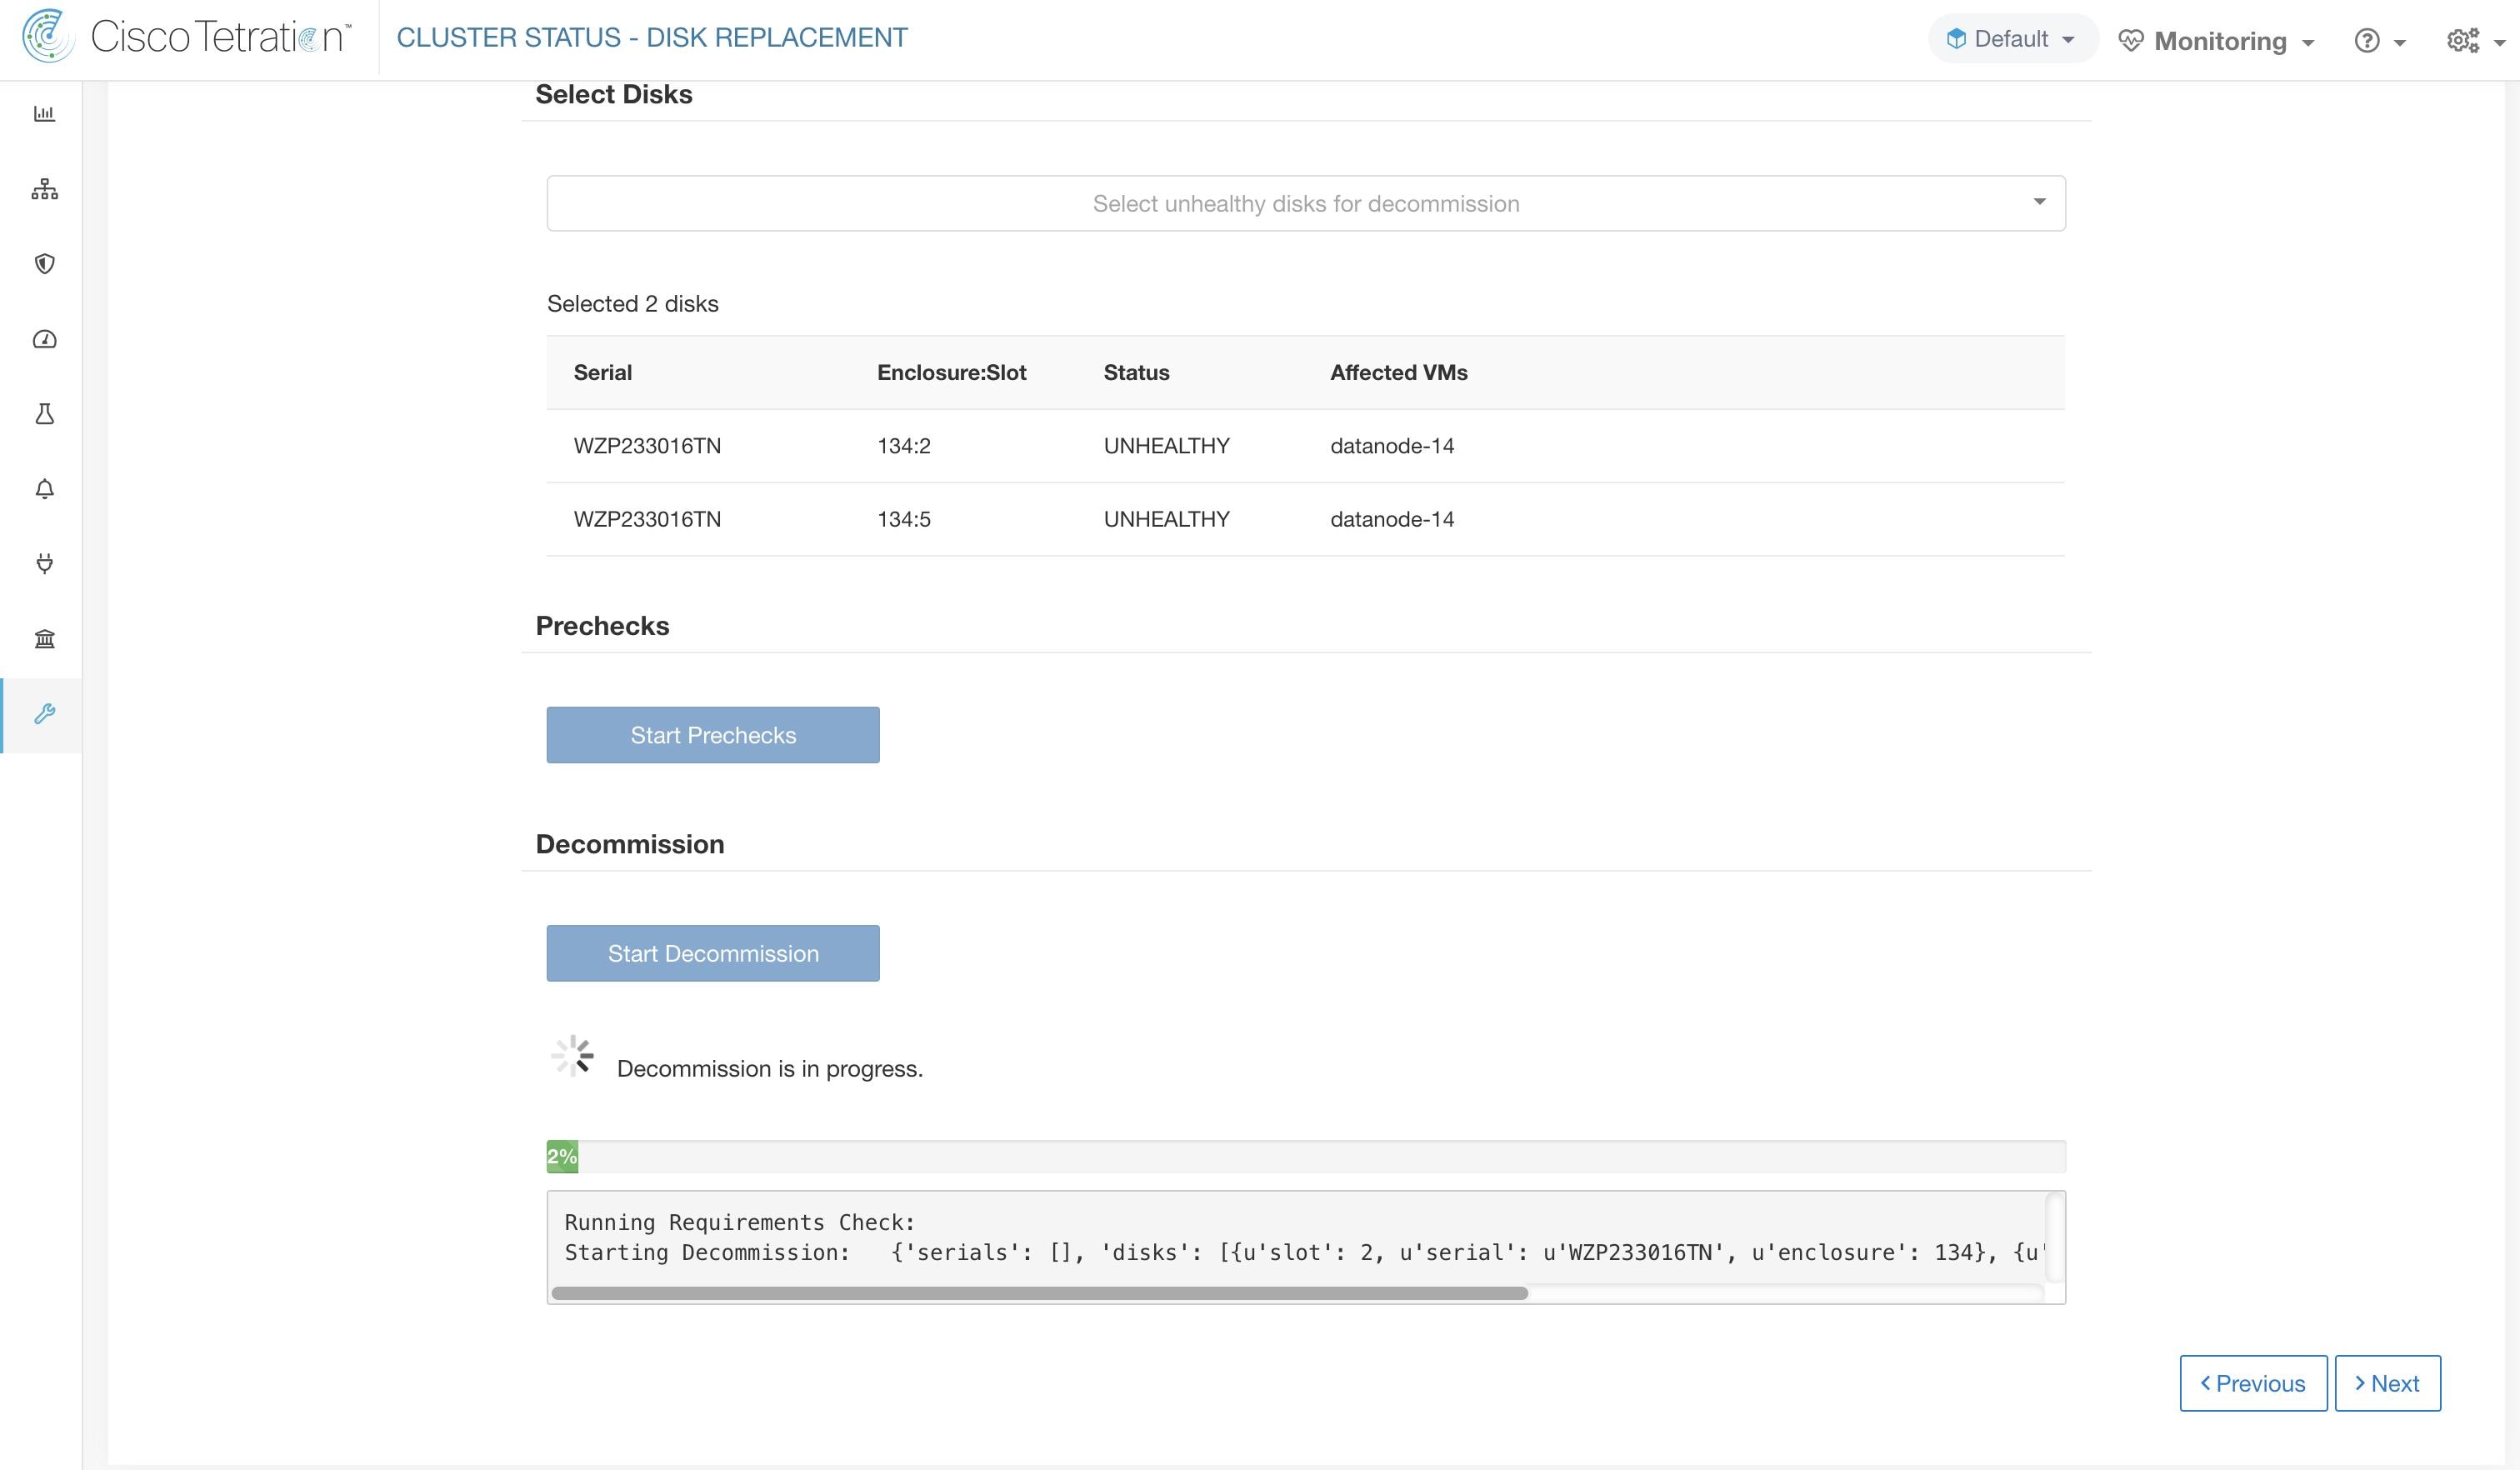
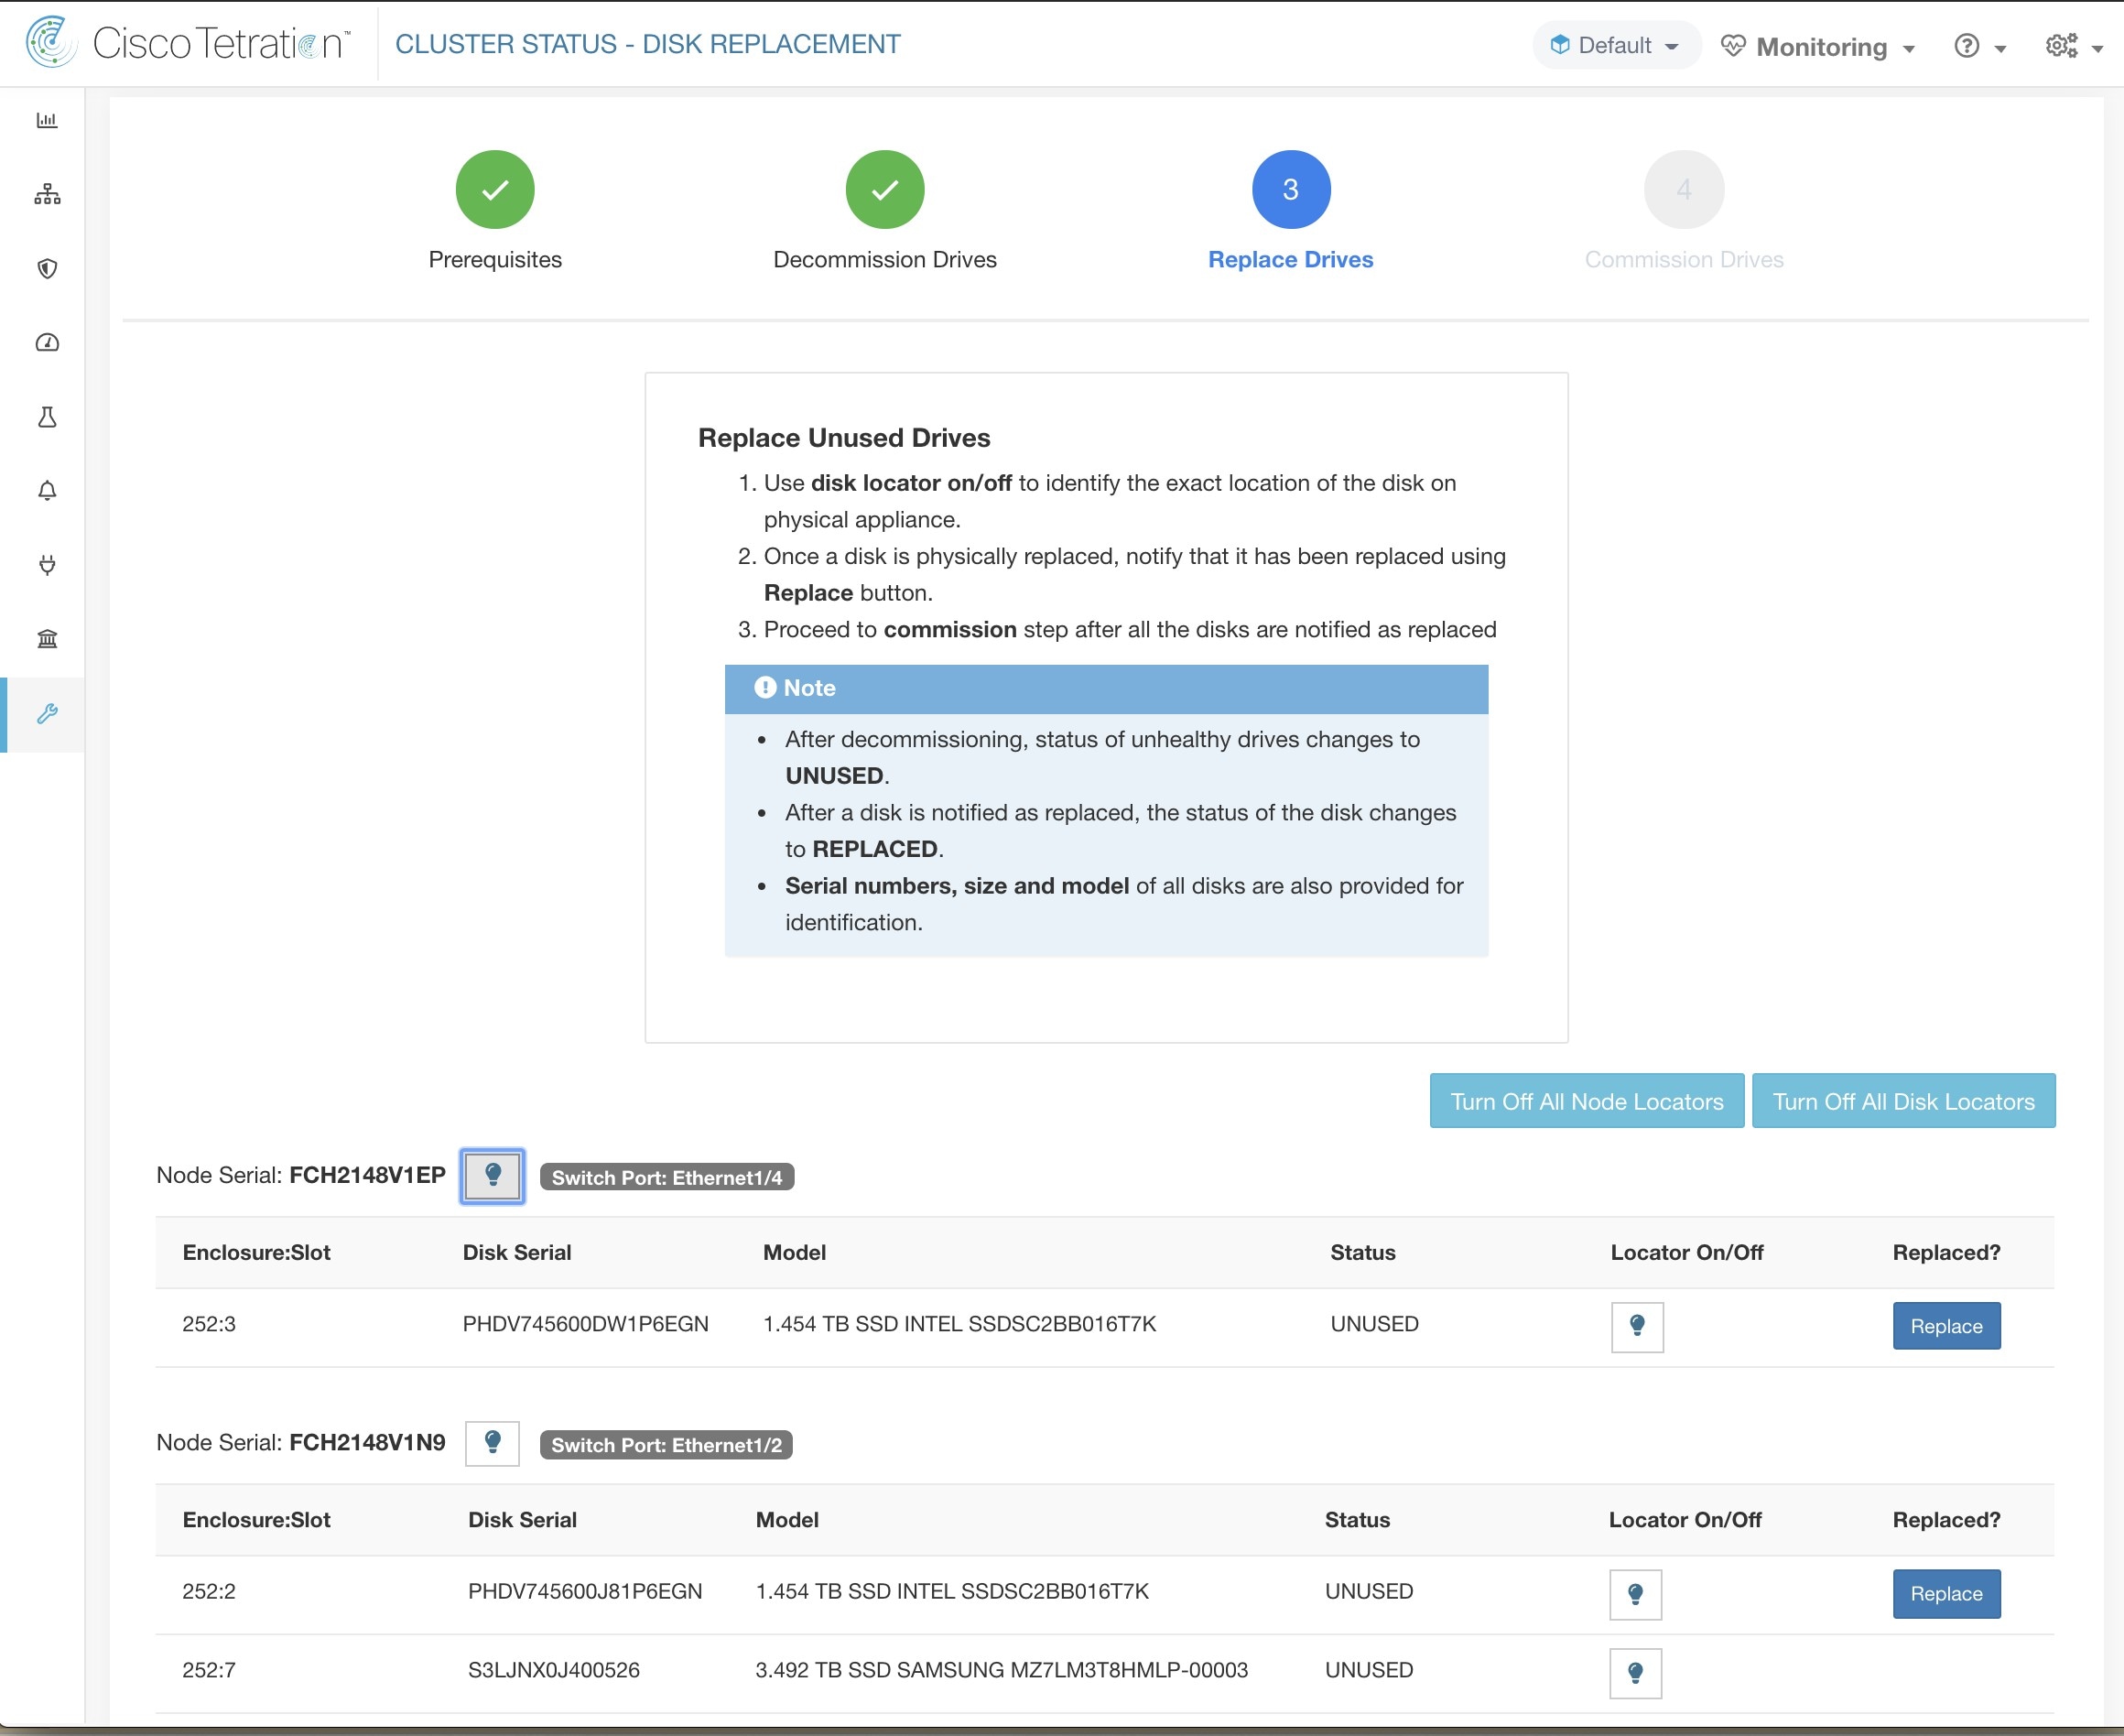
After disk decommission, user is expected to physically replace the disks. To help in this process, we have added disk and server locator LED access on the replace page. There are buttons to switch off all the server and disks locator LEDs to take care any other process that might have left the locators on.
Disks can be physically replaced in any order but they must be reconfigured in smallest to largest slot numbers for a given server. This order is enforced through both UI and the backend. UI has replace button active for disk with the lowest slot number with status UNUSED.
When all the disks are replaced, we proceed to commission. Like decommission, we must run a set of prechecks before we can continue to commission.
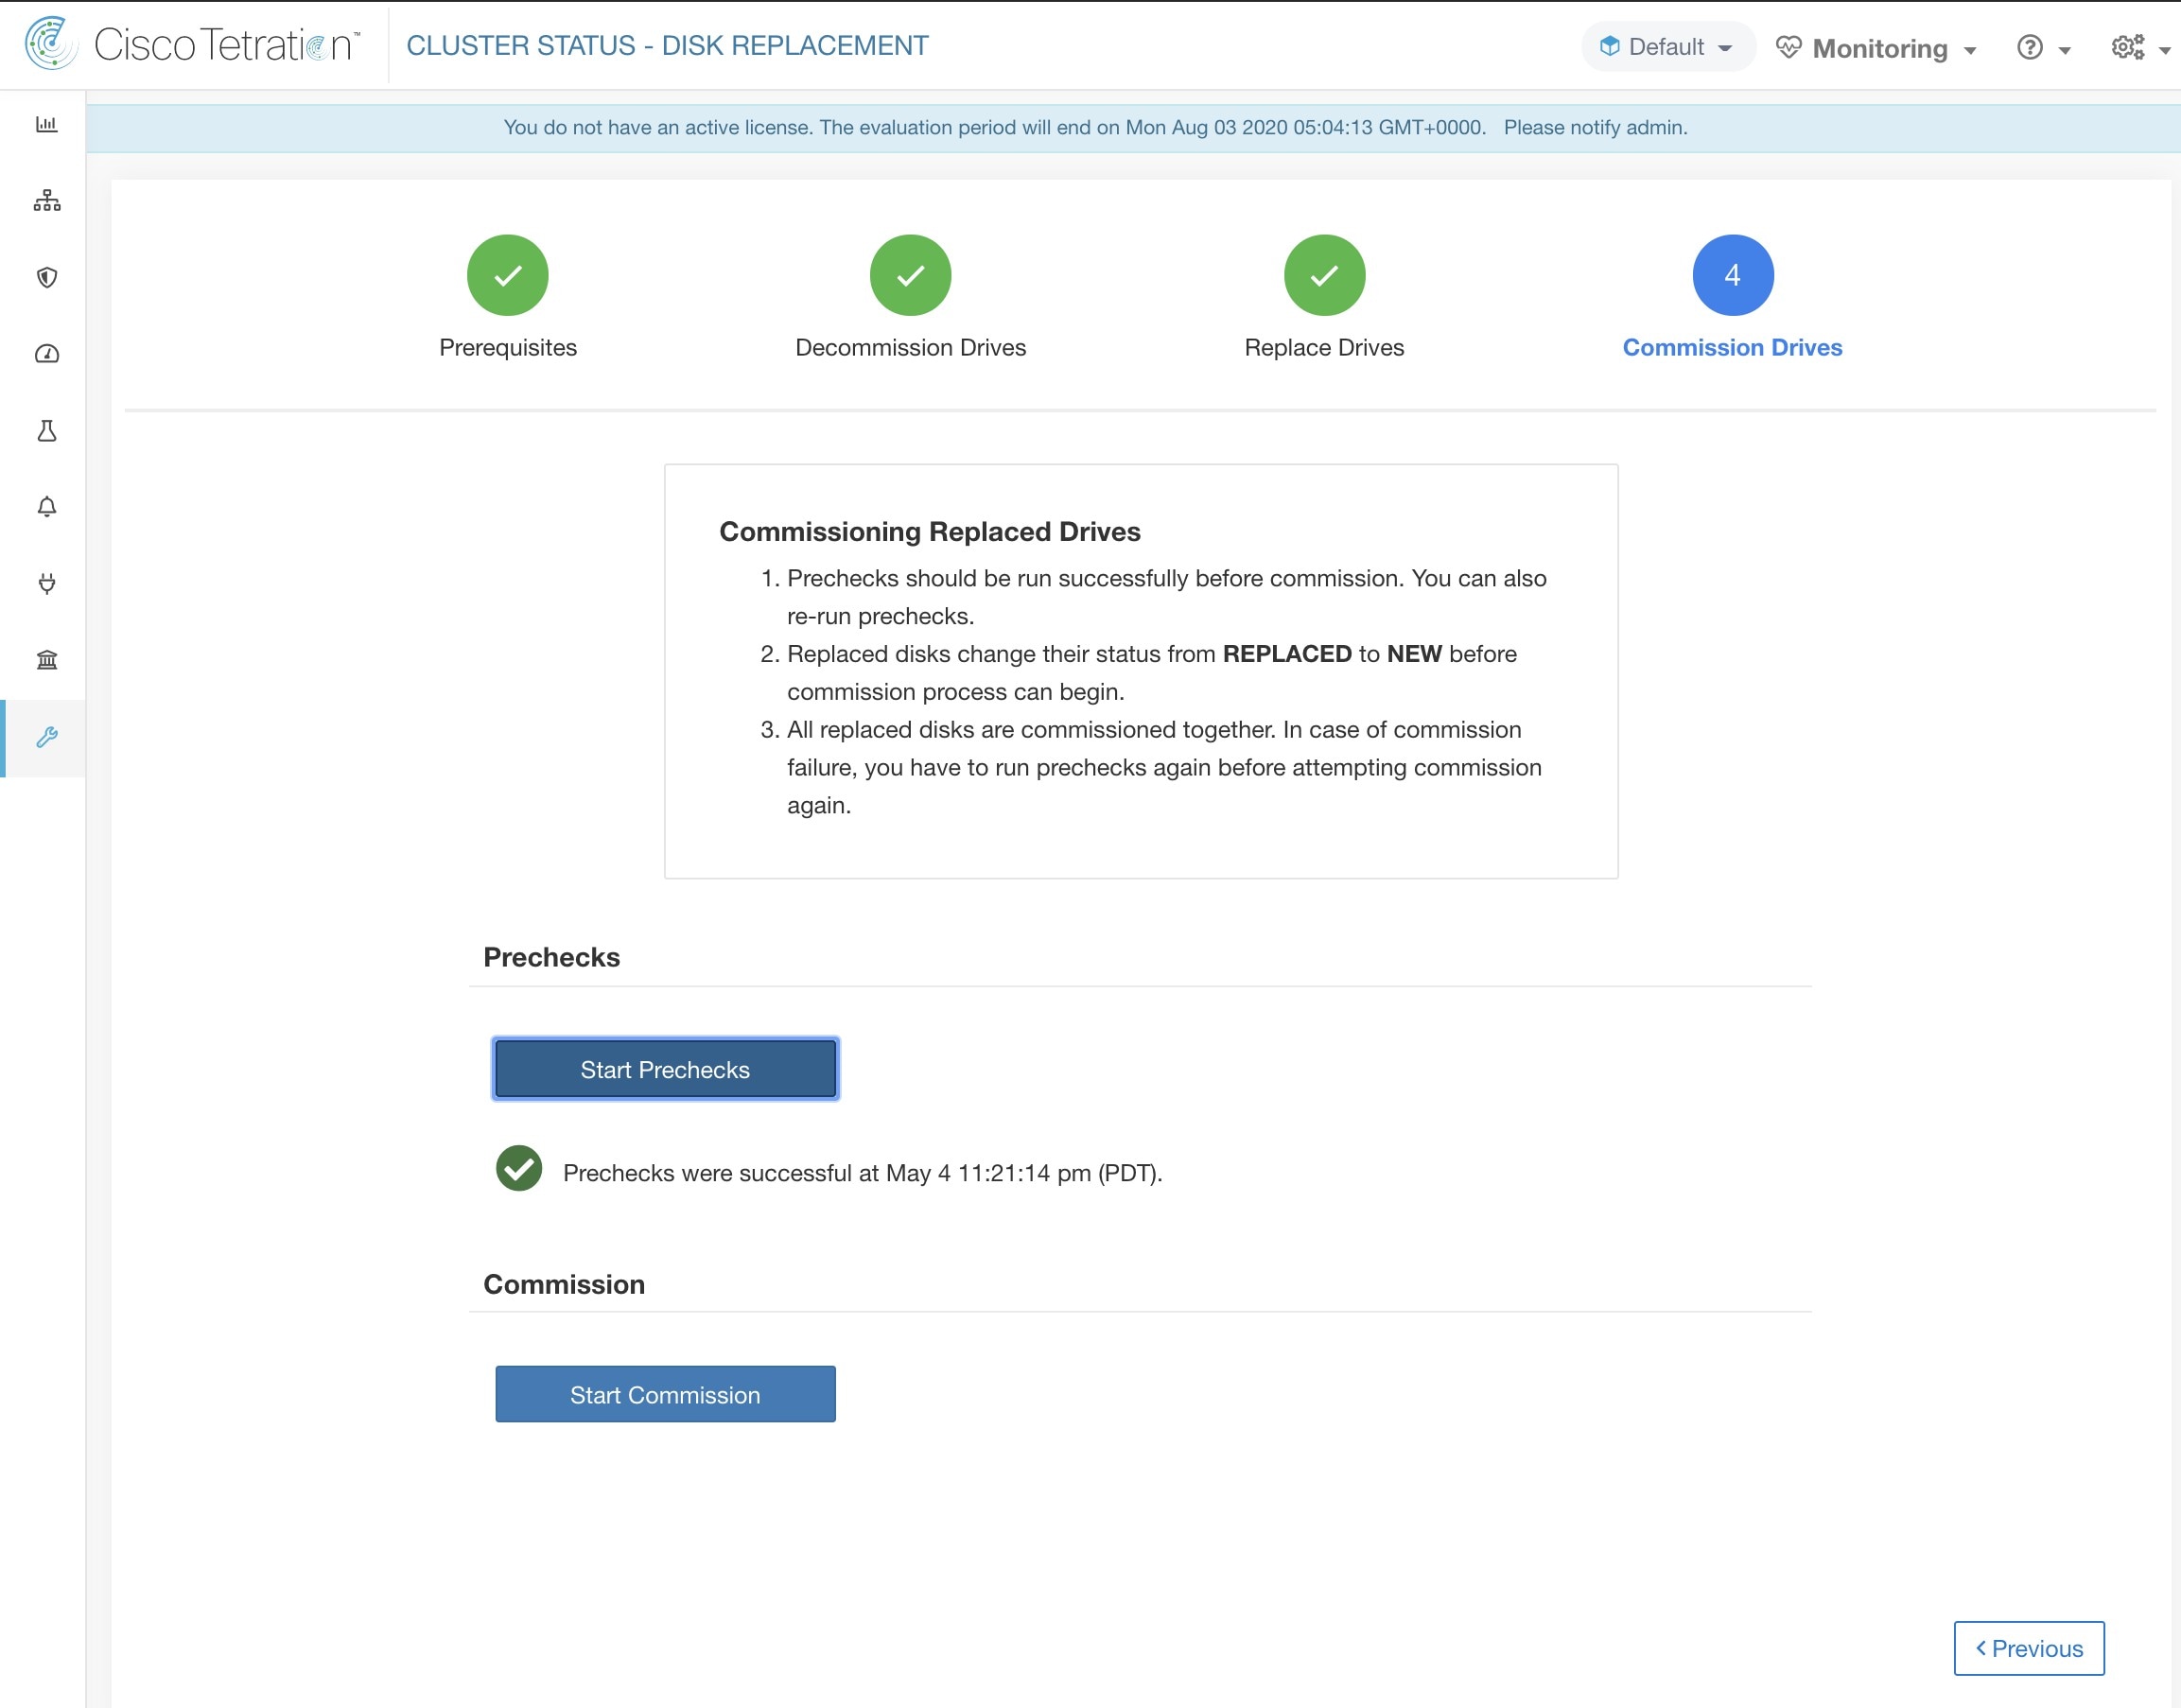
Progress of commission is monitored on the disk commission page. At the end successful commission, the status all disks change to HEALTHY.
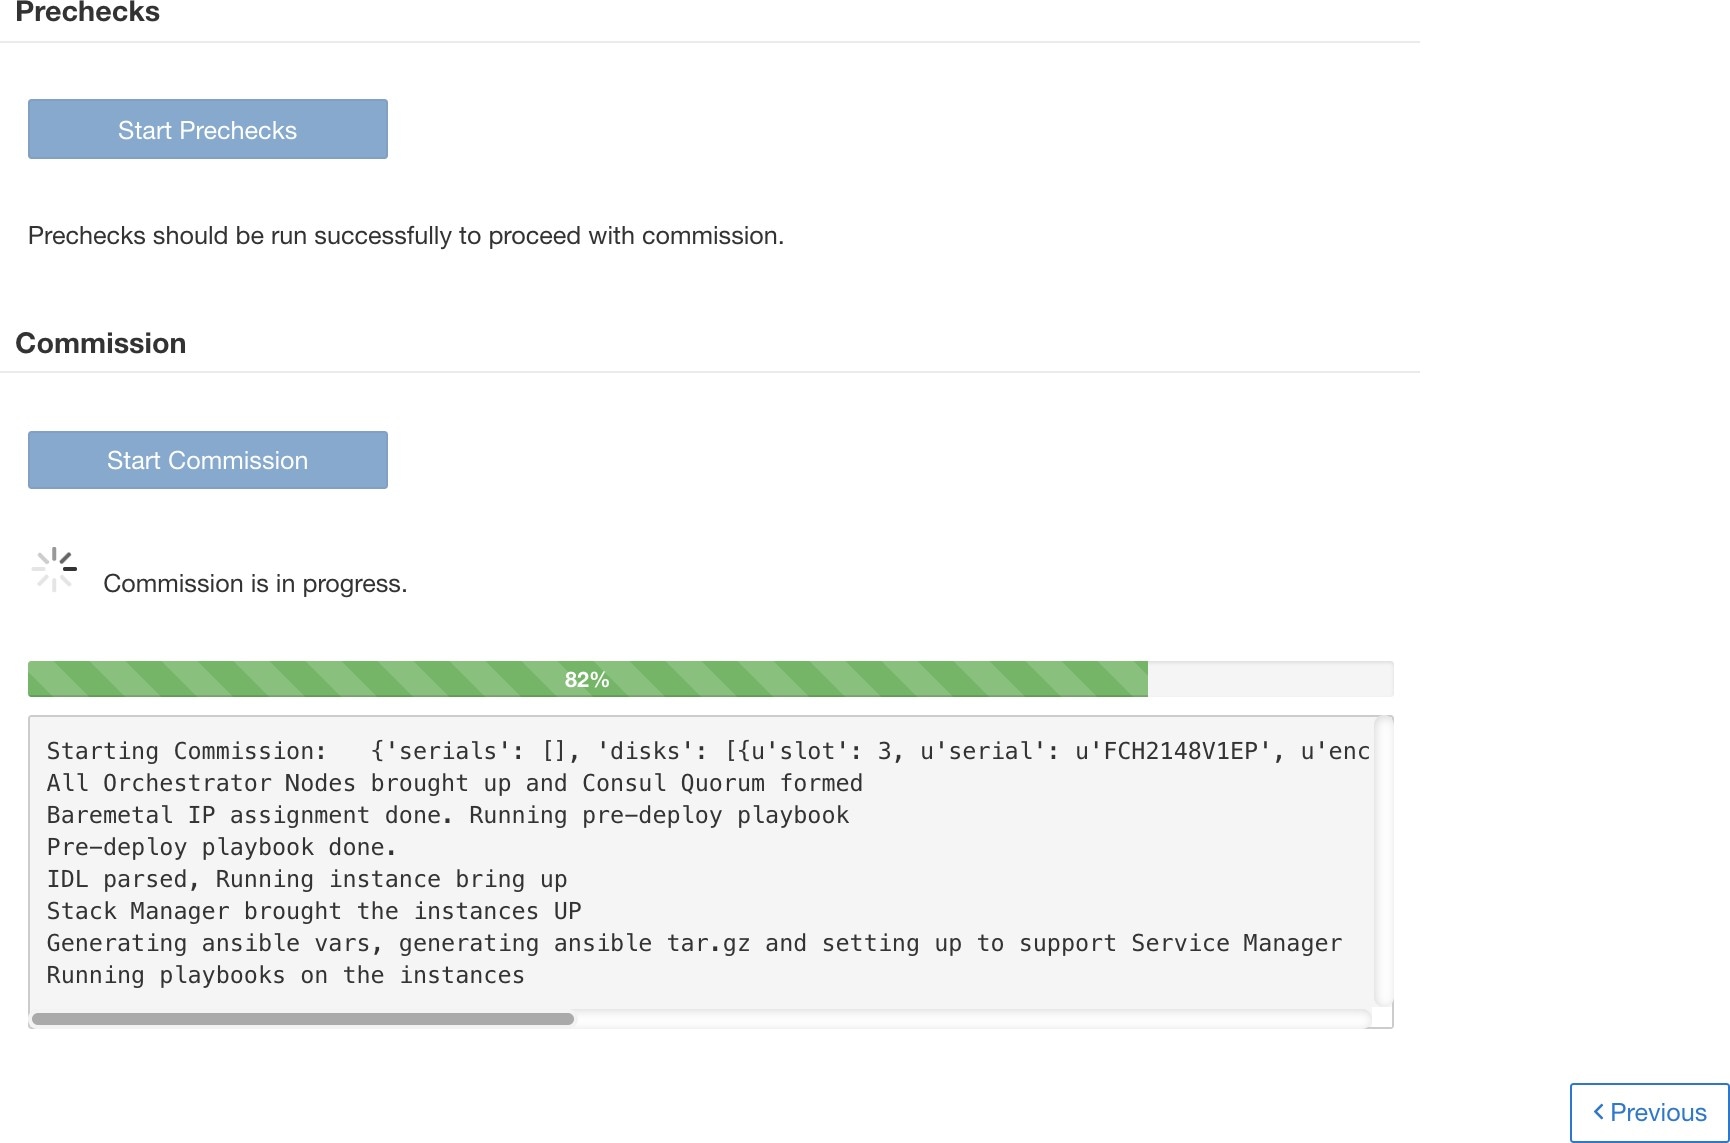
Recovery from failure during commission
A failure after VMs have been redeployed, can be recovered via resume. In such failures, a Resume Commission button appears on the disk commission page, which can be clicked to continue commission by restarting the post deploy playbooks.
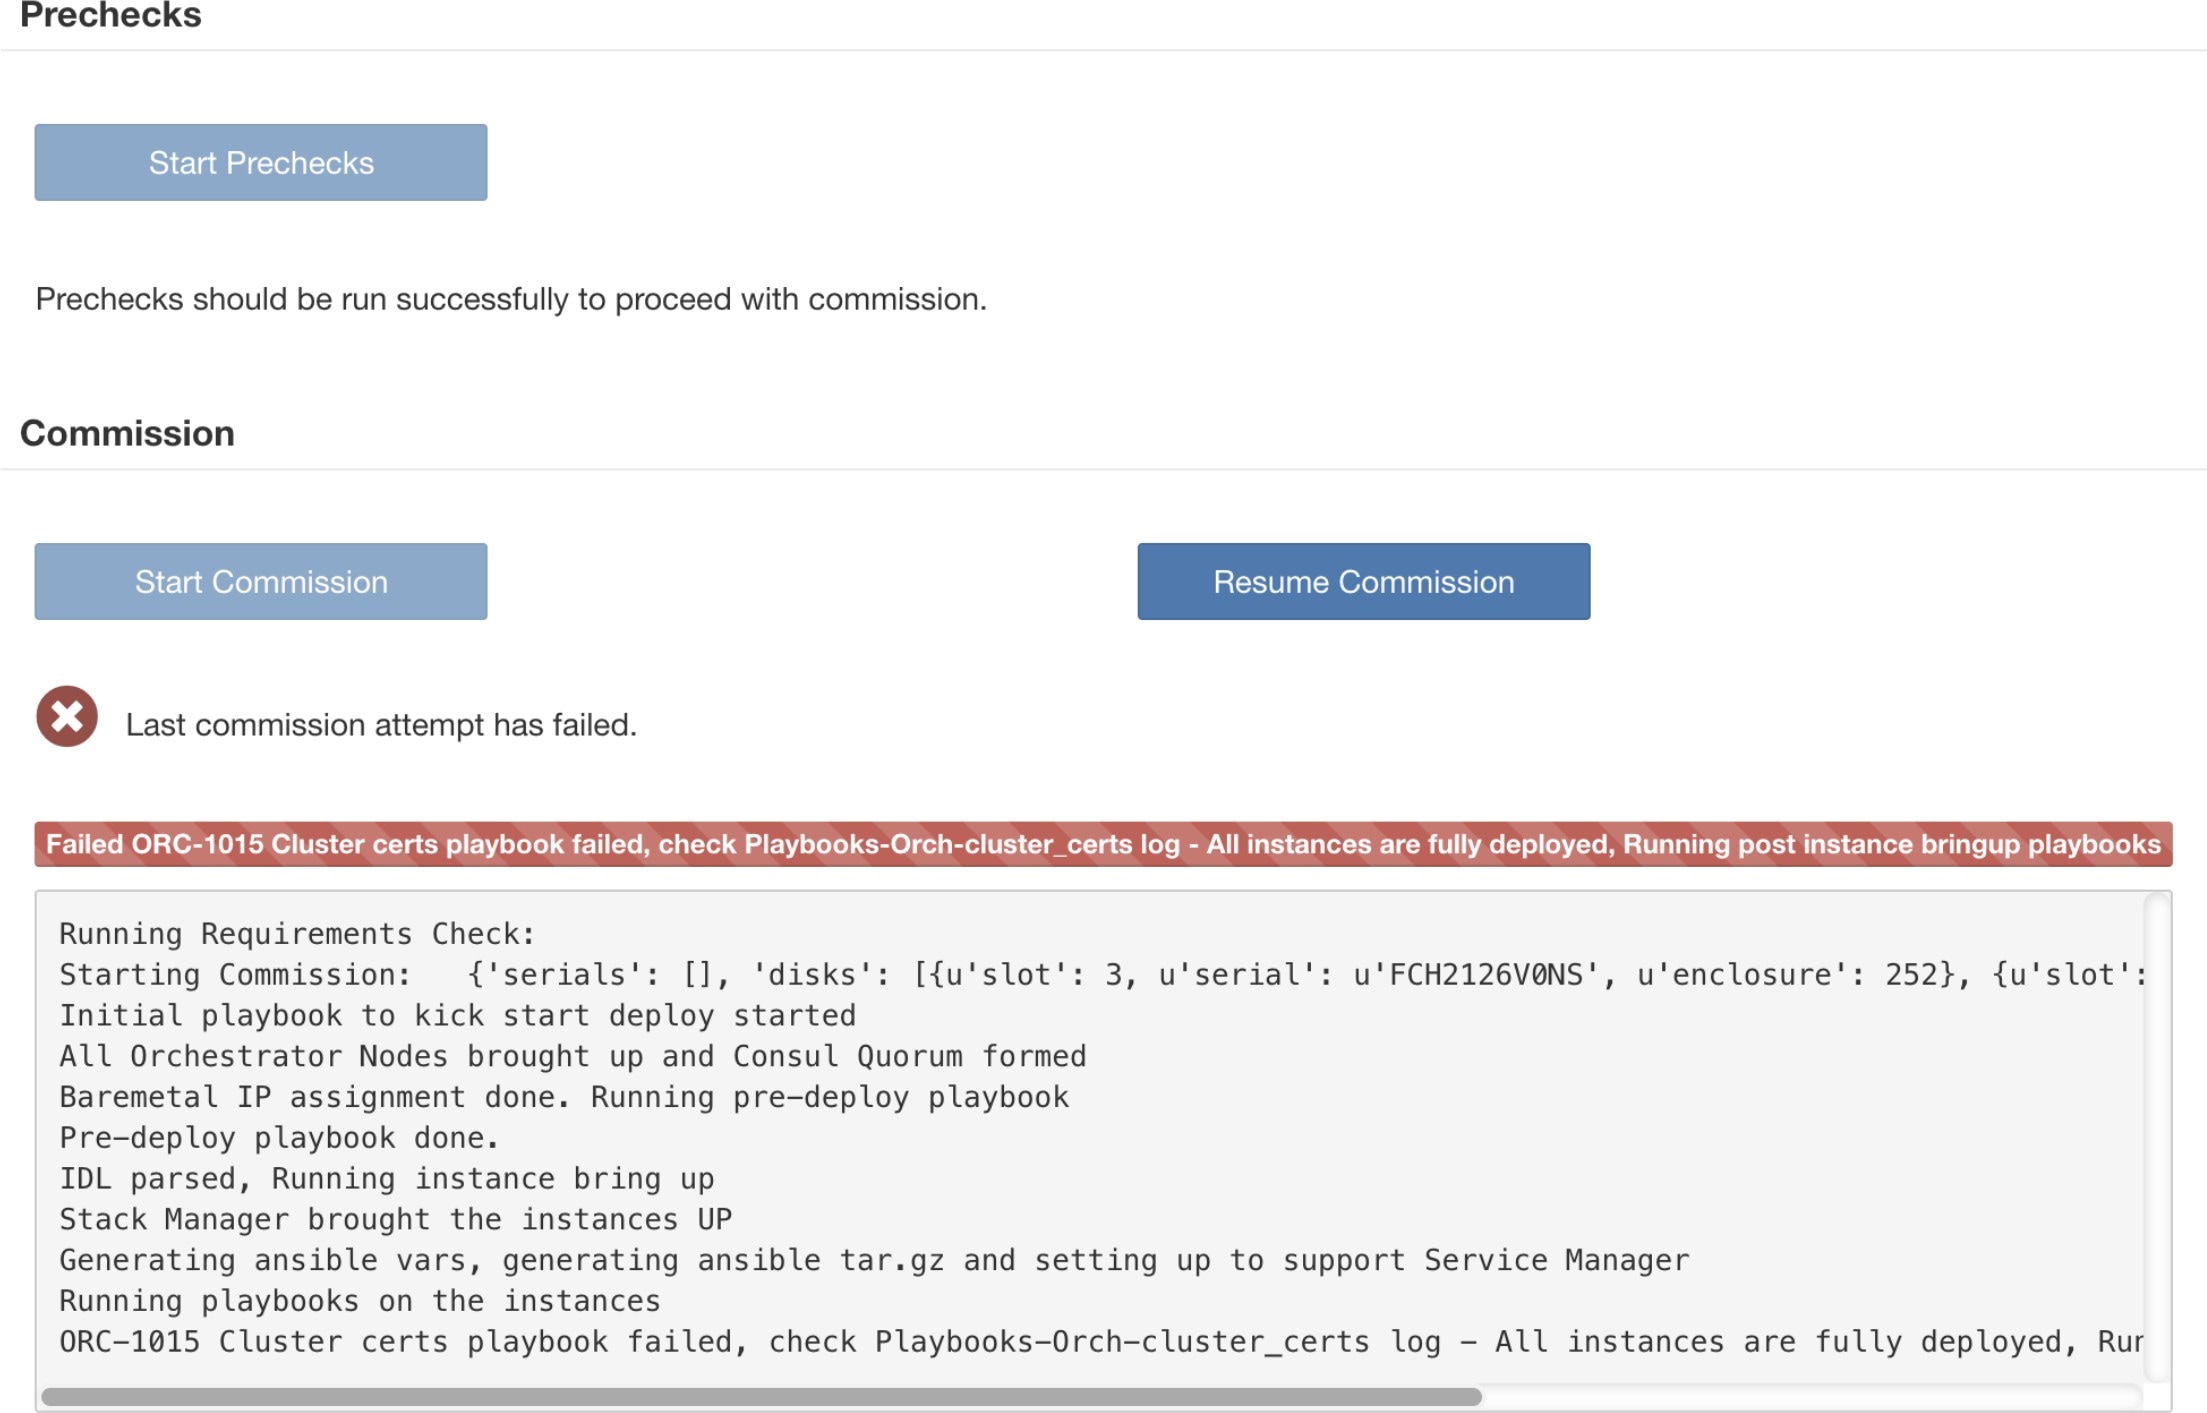
In case of any failure before the VMs have been redeployed, the disks that were being commissioned will have their status changed to UNHEALTHY. That will require us to restart the replacement process from the decommission of UNHEALTHY disks.
Additional disk failures during commission
In case of any other disks than the ones that are being replaced fails while disk commission is in progress, notice of this failure will be displayed on the disk replacement wizard after the ongoing commission process finishes, either in success or failure.
In cases of resumable failures, user will have two options in what next steps to take.
They can try to resume and complete current commission and perform the disk replacement process for the new failures later.
Alternatively, they can start decommission of newly failed disk and perform commission of all the disks together.
This second path will be the only path availble in cases of non-resumable failures. If the post deploy failure is caused due to the newly failed disks, the second path will again be only way forward, even though we will have resume button available.
Logs
All the disk commission/decommsion logs are part of orchestrator logs. Starting debug point should be /lo- cal/logs/tetration/orchestrator/orchestrator.log on orchestrator.service.consul.
Details of any failure during disk replace/reconfigure action can be found on the bmmgr log on the server in consideration. The log location on the server would be /local/logs/tetration/bmmgr/bmmgr.log
Limitations
Disk containing server’s root volumes can’t be replaced using this procedure. Such disk failure must be corrected using server maintainence process.
Disk commissioning can happen only when all servers are active and in commissioned state. See special handling section below to that describes how to proceed in the cases where a combination of disk and server replacement is needed.
Disk and Server Replacement together
In the case of failure scenarios where a disk and a server needs to be commissioned together, user is expected to decommission and replace all the disks that can be decommissioned. Commission of those disk would be prevented by the precheck that ensure that
All non healthy disks have the status of NEW
All servers are in the Commissioned state with status Active
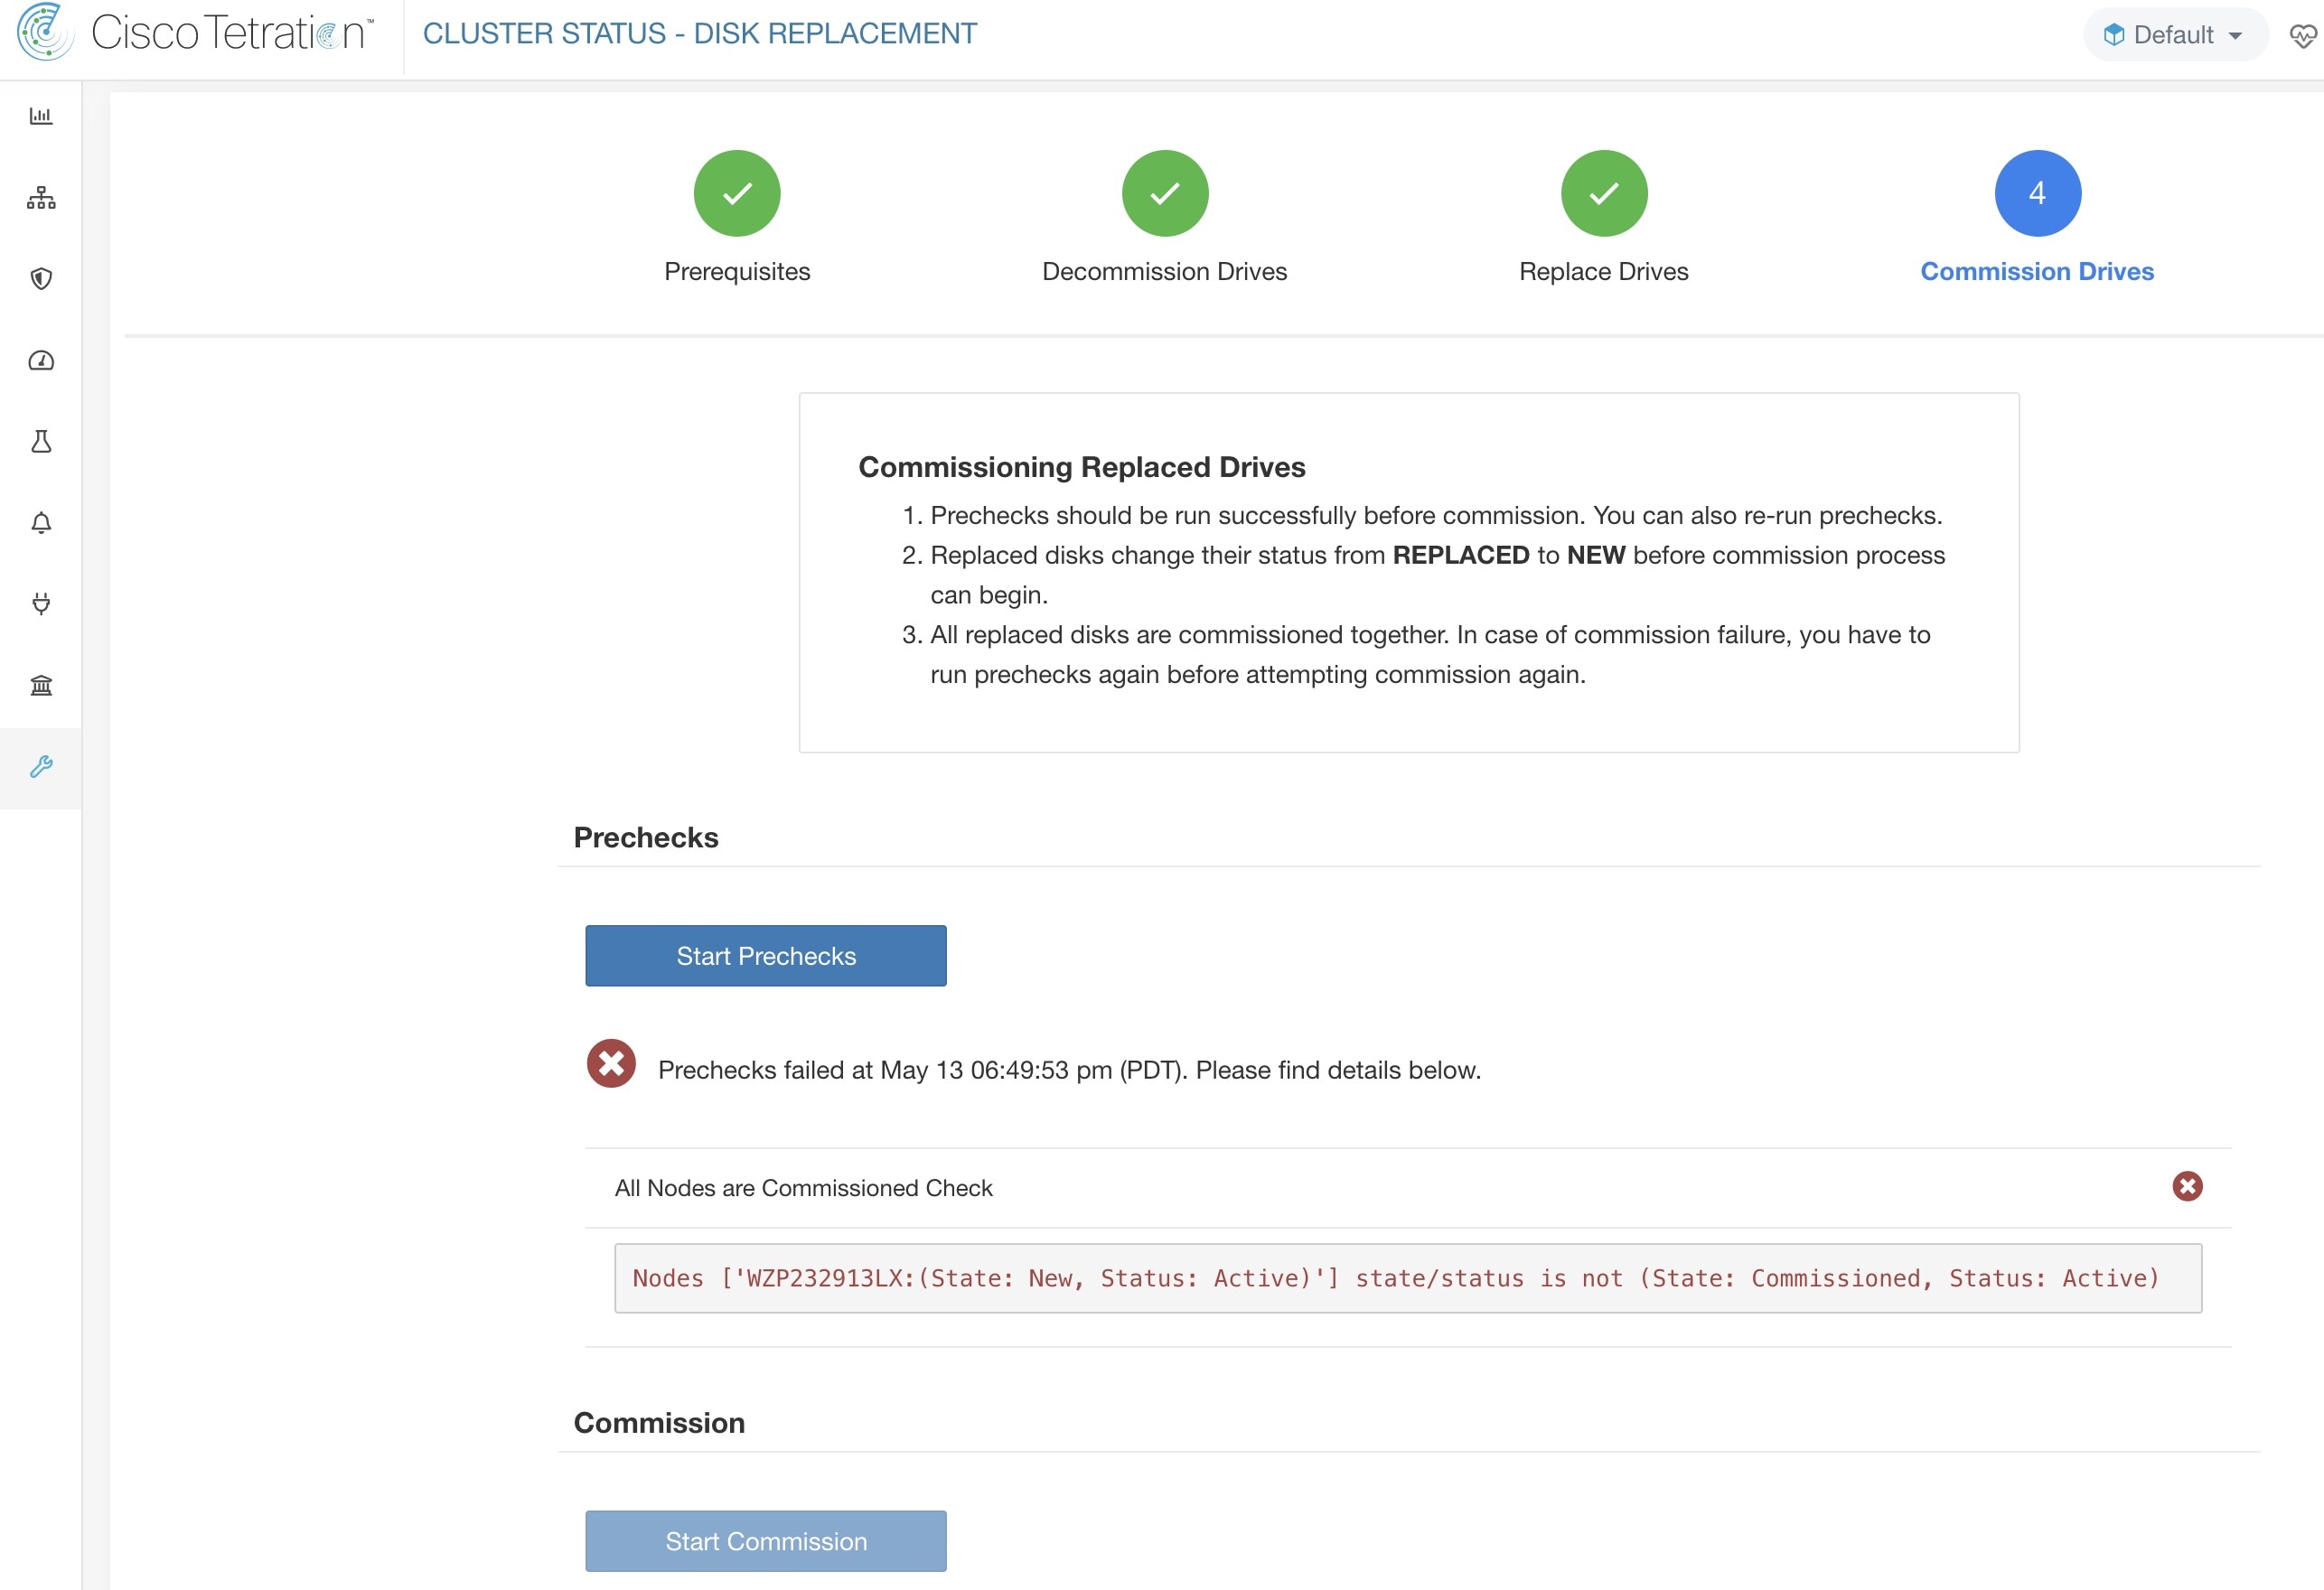
Once all the UNHEALTHY disks are in the NEW state, the faulty server is expected to be decommis- sion/reimaged/commission back using the server maintainence procedure.
Now server commission will be prevented if there are any disk without status HEALTHY or NEW. A successful server commission will also make the status of all disks HEALTHY.
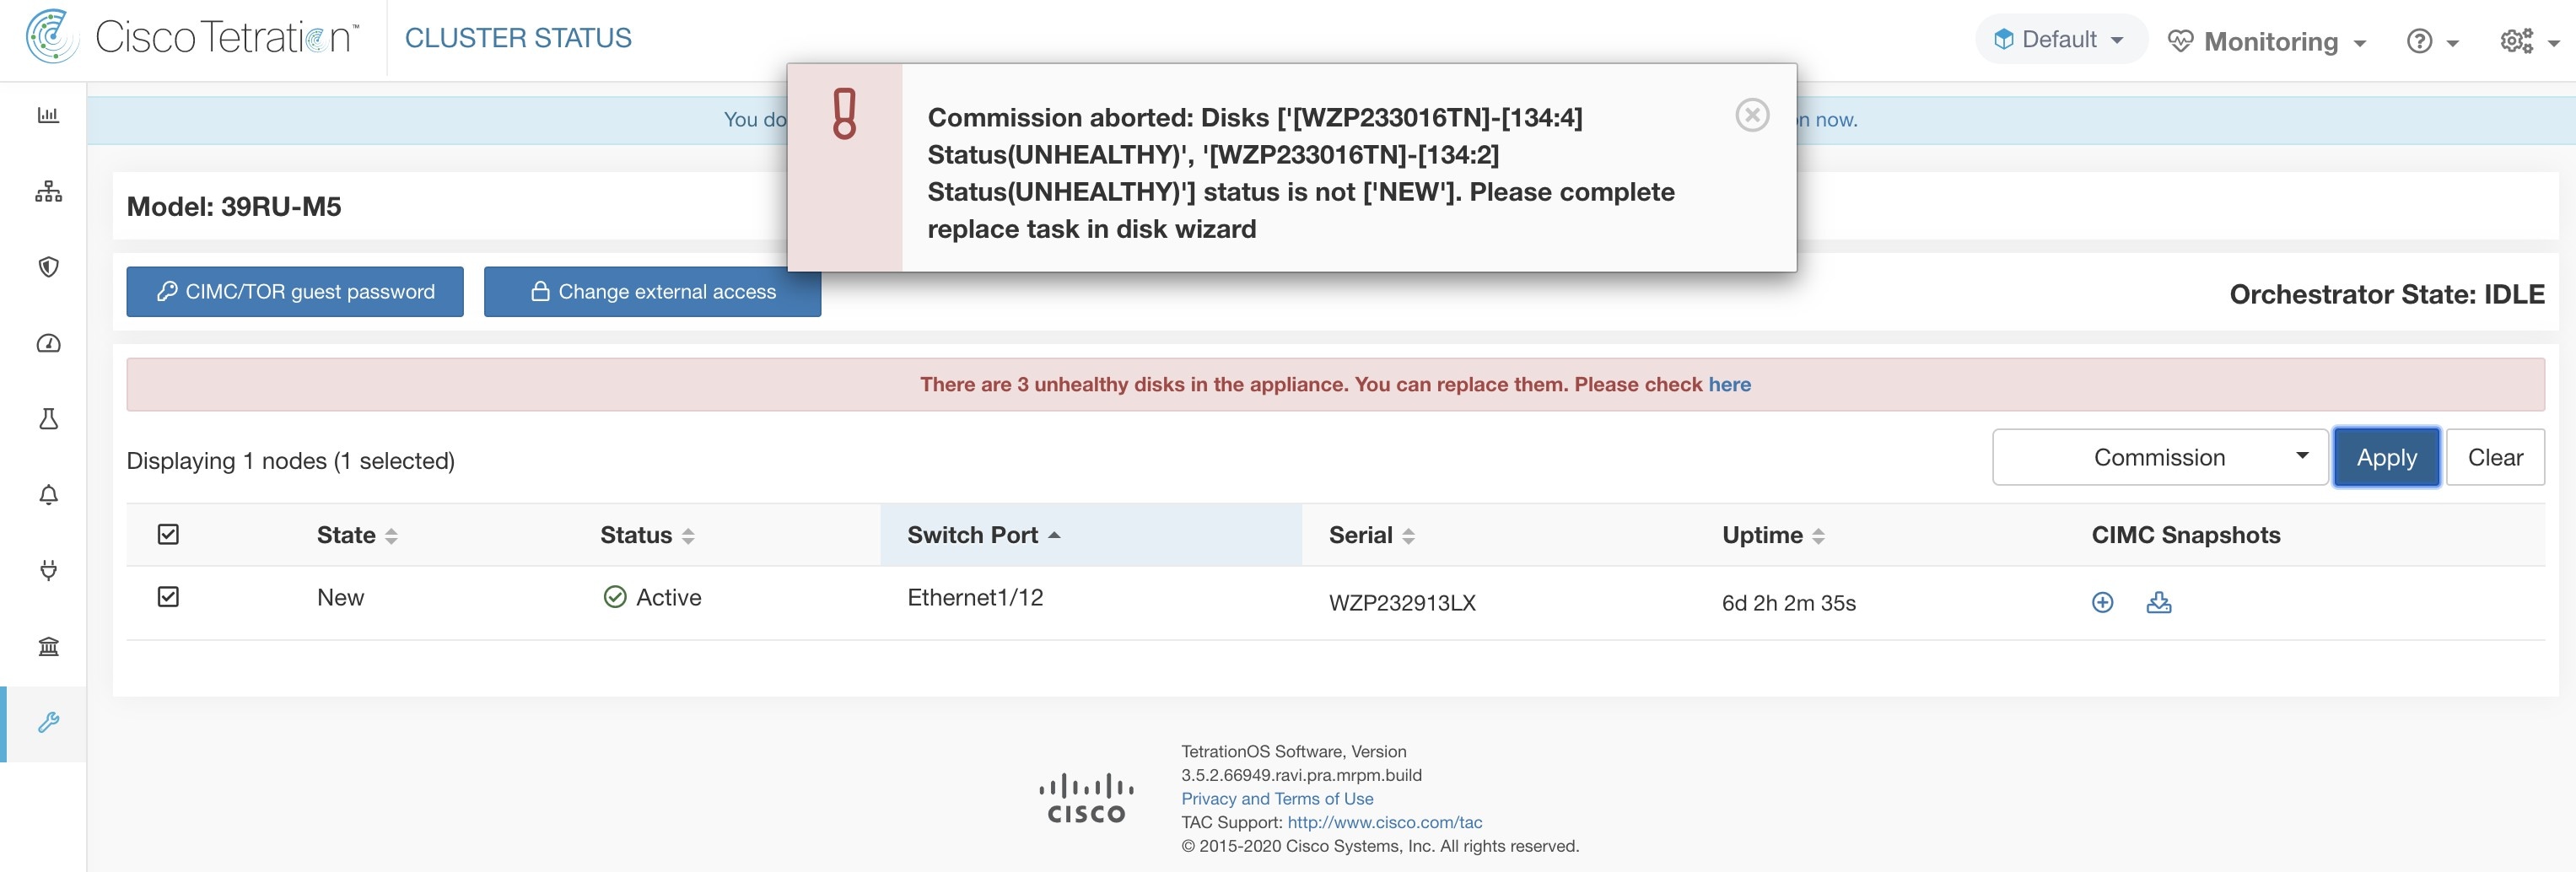
In this section, we discuss the maintenance operations that affect the entire cluster.
Cluster Shutdown
Cluster Reboot
Cluster shutdown stops all running Secure Workload processes, and powers down all individual nodes. Follow the steps below for executing the shutdown.
|
Step 1 |
In the navigation bar on the left side of the window, click . |
|
Step 2 |
Click the Reboot/Shutdown tab. |
|
Step 3 |
Select the Shutdown radio button and click Send Shutdown Link. This sends the shutdown link in an email as shown below. The shutdown link is delivered to the email address of the user requesting the link. 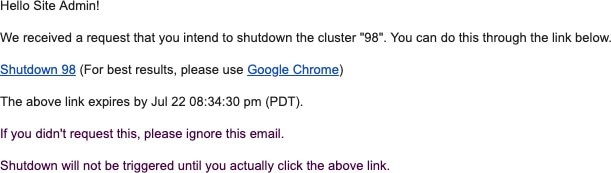
|
|
Step 4 |
Click the red Shutdown button on the Cluster Shutdown page to initiate the shutdown. Important!! You cannot cancel the shutdown after clicking this button. |
Once the shutdown starts, the page shows a progress bar tracking the progress of the shutdown.
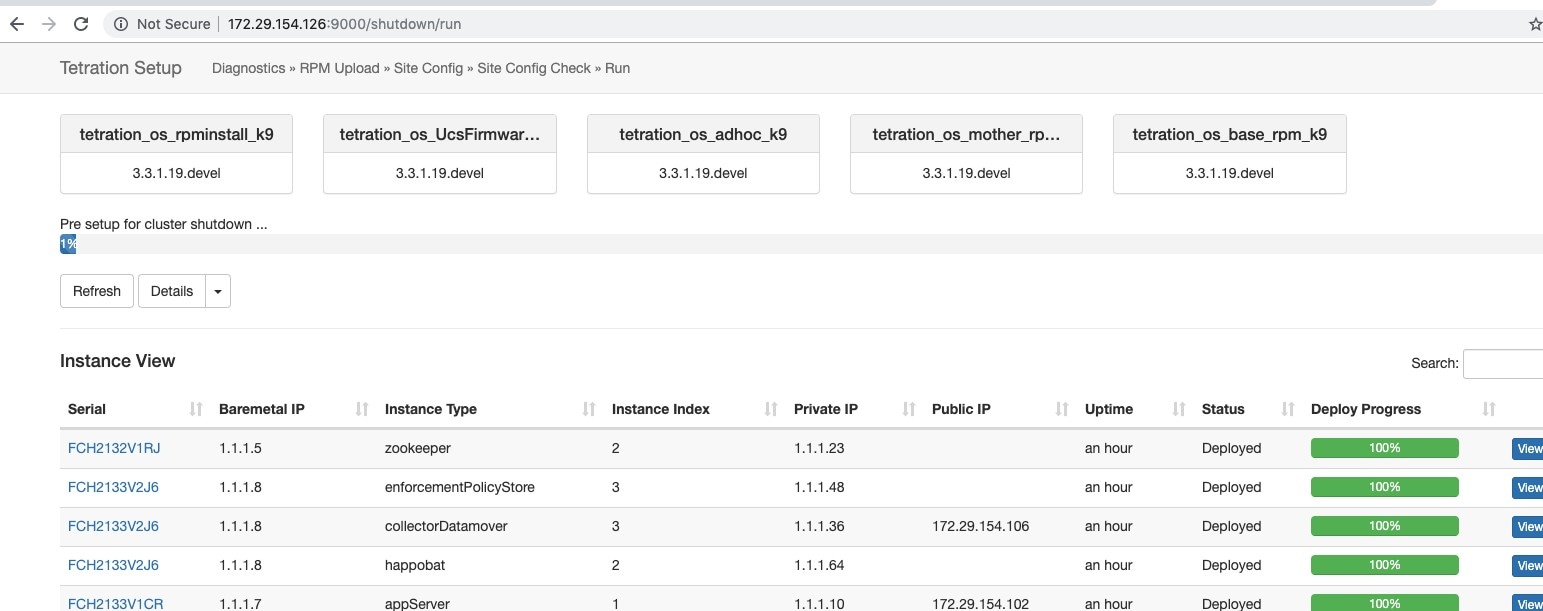
If an error occurs in the initial shutdown pre-checks, progress bar will turn red and a resume button will show up which can be clicked to restart shutdown after fixing the errors.
After pre-checks are complete, VMs are stopped. As the VMs progressively stop, their progress is shown in the lower portion of the page. This page is similar to the VM stop under upgrades - for more information, see the upgrades section on each field being displayed. Note that stopping of VMs can take up to 30 minutes.
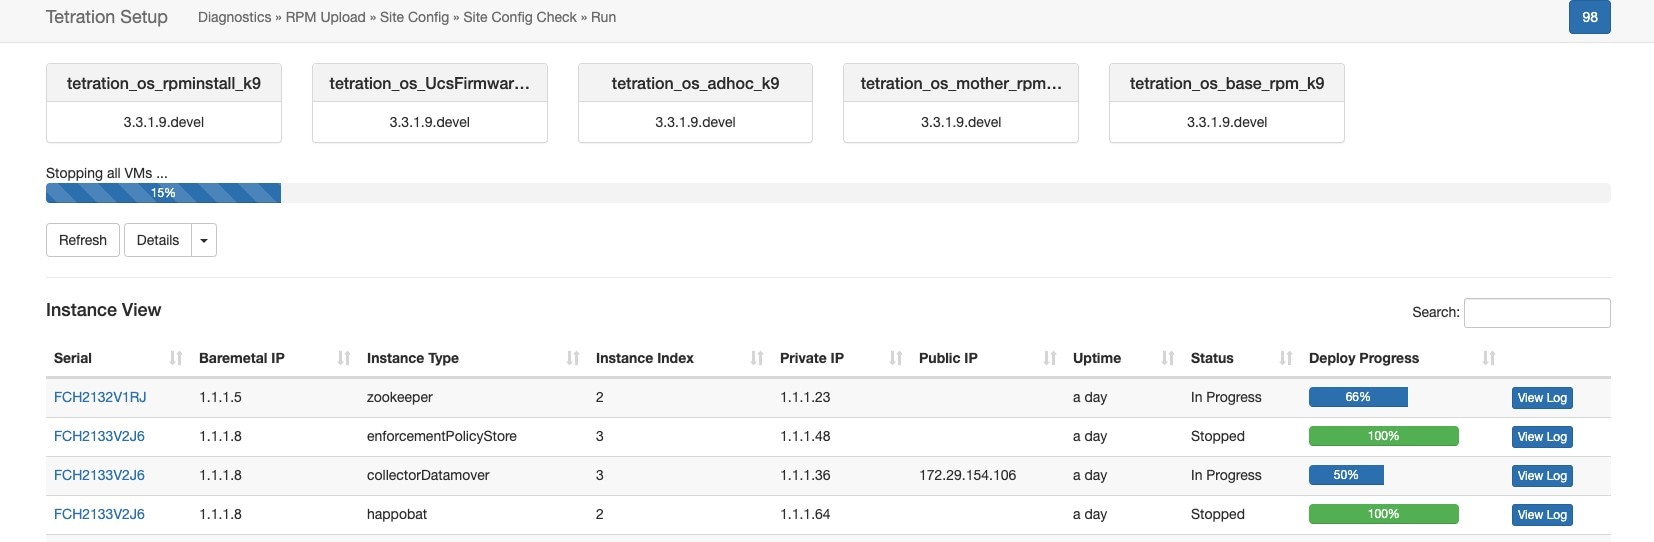
Eventually, as the cluster is completely ready to be shutdown, the progress bar will go to a 100% and indicate the time after which it is safe to power off the cluster. This is highlighted in the screenshot below.
Note |
Do not power off the cluster until AFTER the time displayed on the progress bar. |
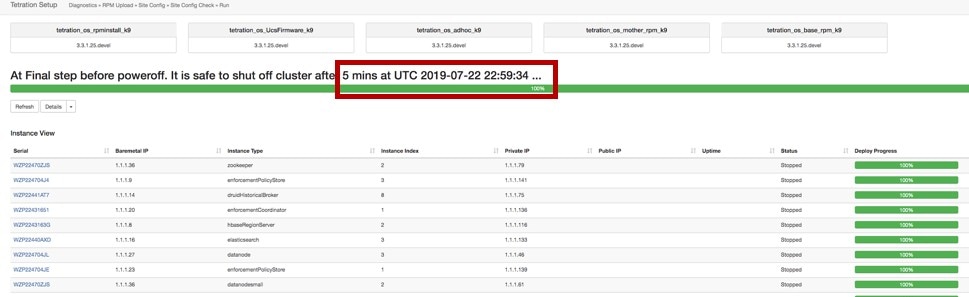
To recover the cluster after shutdown, power on the bare metals. When all the individual bare metals are up, the UI will become accessible again. After logging into the cluster, cluster reboot MUST be initiated to make the cluster fully operational again.
Note |
You must reboot the cluster after a shutdown to make it fully operational again. |
|
Step 1 |
In the navigation bar on the left side of the window, click . |
|
Step 2 |
Click the Reboot/Shutdown tab. |
|
Step 3 |
Select the Reboot radio button and click Send Reboot Link. The reboot link is delivered to the email address of the user requesting the link. Secure Workload services reboot performs a restricted upgrade operation. After clicking the reboot link in the email, the user is taken to the setup UI where the reboot can be initiated. From here on, the progress is same as upgrades. For more information, see upgrade section. |
To view the previously run cluster maintainenance jobs:
Navigate to , and then click the History tab.
The cluster operation column lists the cluster tasks such as deploy, upgrade, reboot, or shutdown.
To download logs of the cluster jobs, click Download Logs.
Data Taps
Managed Data Taps
Note |
Cisco Secure Workload Currently supports writing to Kafka Brokers 0.9.x, 0.10.x, 1.0.x and 1.1.x for Datataps |
To push any alerts out from Secure Workload cluster, user needs to use a configured data taps. Data Tap Admin users are the only ones who can configure and activate new/existing data taps. Users can only view data taps that belong to their Tenant.
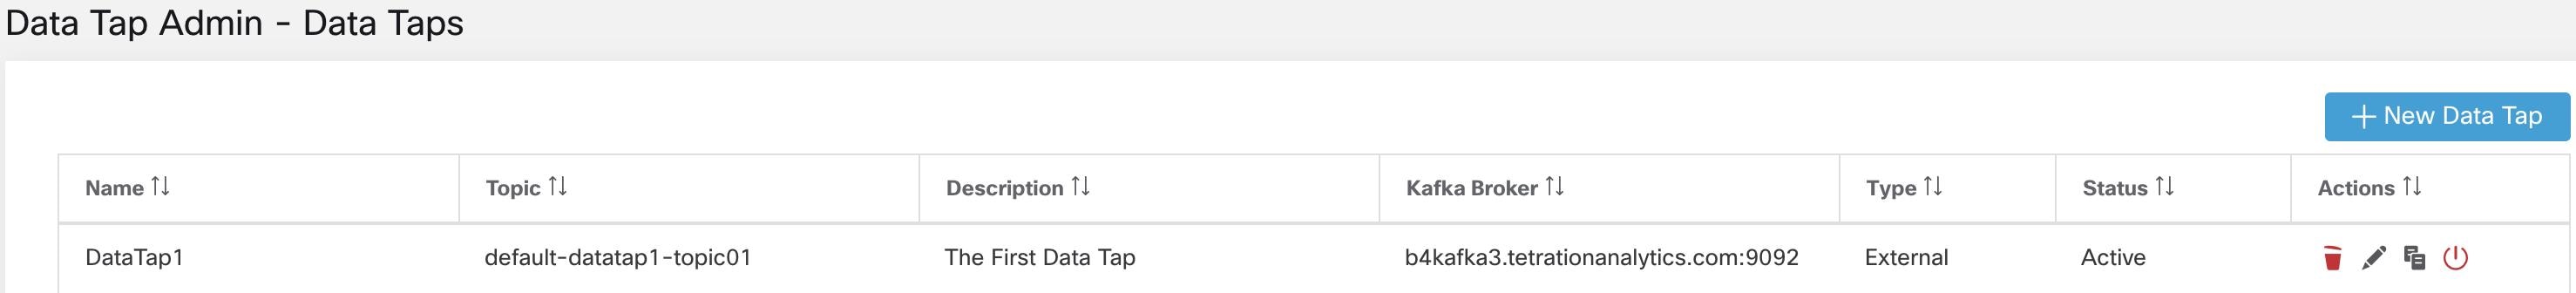
To manage data taps, click in the navigation bar at the left side of the window.
Recommended Kafka Config
While configuring Kafka cluster, Secure Workload recommends to use the ports from 9092, 9093 or 9094 since, these are the ports Secure Workload opens for outgoing traffic for Kafka. b t2=b t2=The following are the recommended settings for Kafka Brokers:
	 broker.id=<incremental number based on the size of the cluster>
	 auto.create.topics.enable=true
	 delete.topic.enable=true
	 listeners=PLAINTEXT://:9092
	 port=9092
	 default.replication.factor=2
	 host.name=<your_host_name>
	 advertised.host.name=<your_adversited_hostname>
	 num.network.threads=12
	 num.io.threads=12
	 socket.send.buffer.bytes=102400
	 socket.receive.buffer.bytes=102400
	 socket.request.max.bytes=104857600
	 log.dirs=<directory where logs can be written, ensure that there is sufficient space to hold the kafka journal logs>
	 num.partitions=72
	 num.recovery.threads.per.data.dir=1
	 log.retention.hours=24
	 log.segment.bytes=1073741824
	 log.retention.check.interval.ms=300000
	 log.cleaner.enable=false
	 zookeeper.connect=<address of zookeeper ensemble>
	 zookeeper.connection.timeout.ms=18000
Data Tap Admin Section
Data Tap Admins can navigate to page to view and configure all available data taps. The data taps are configured per Tenant.
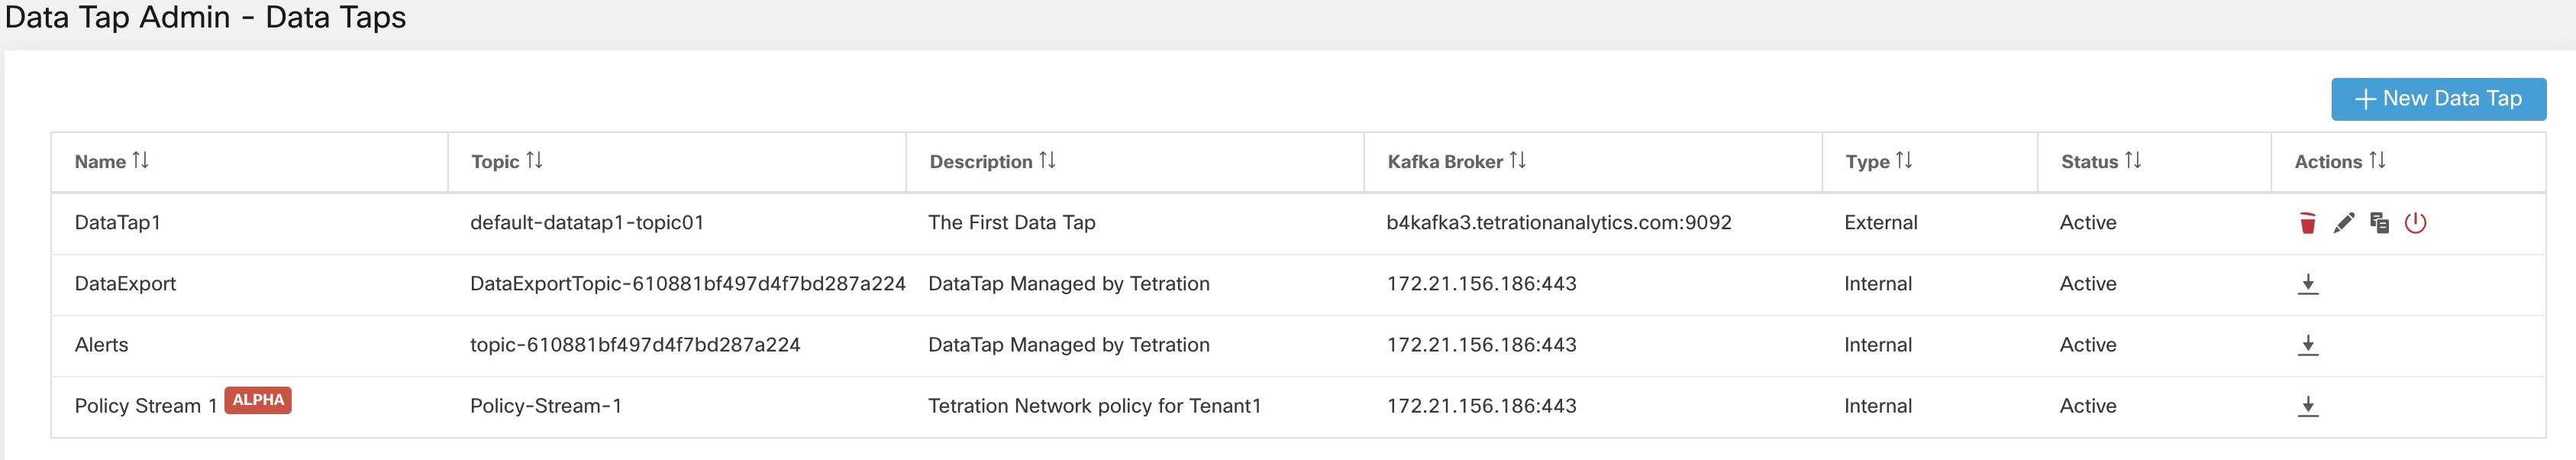
Adding New Data Tap
Data Tap Admins can click on the  to add new data tap
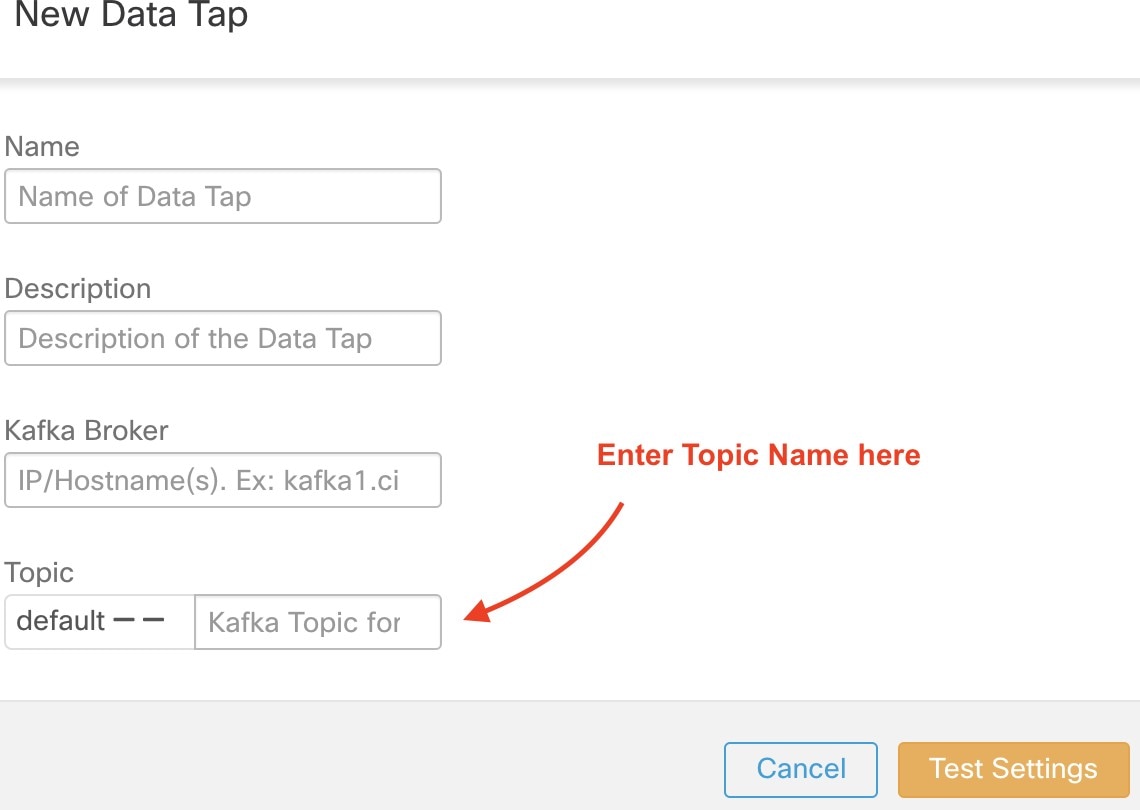
Note |
Changing any Data Tap values will require settings to be validated. |
Deactivating a Data Tap
To temporarily prevent messages from leaving Secure Workload a Data Tap Admin can deactivate a data tap. Any messages to that data tap will not be sent. The data tap can reactivated at any time.
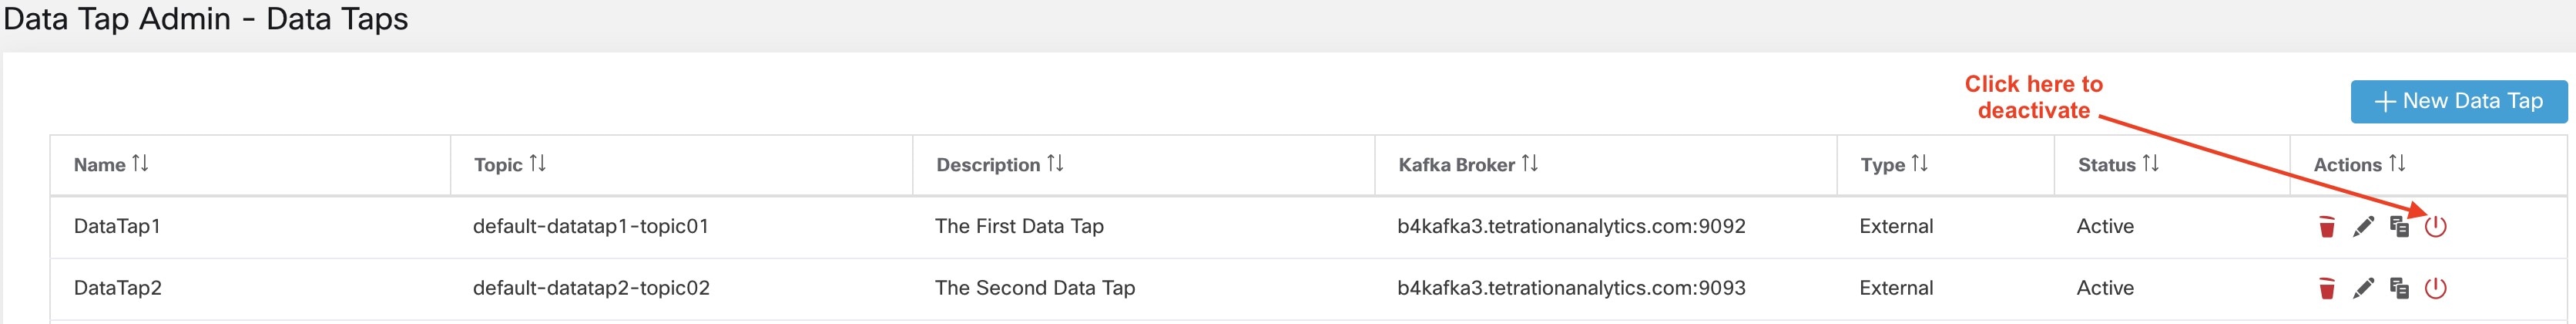
Deleting a Data Tap
Deleting a datatap will delete any Secure Workload Apps instances that depend on that app. For example, if a user has specified that Compliance alerts should be sent to DataTap A (in the alerts Secure Workload app), and an admin deletes DataTap A, then the Alerts app will no longer list DataTap A as an alert output.
Managed Data Taps (MDT) are Data Taps hosted within the Secure Workload cluster. It is completely secure in terms of authentication, encryption and authorization. To send and receive messages from MDTs, clients needs to be authenticated, and data sent over the wire is encrypted, and only authorized users can read/write messages from/to Secure Workload MDT. Secure Workload provides Client certificates to be downloaded from the UI. Secure Workload uses Apache Kafka 1.1.0 as the messages broker, and, recommends clients to use secure clients compatible with the same version.
MDTs are automatically created upon the creation of root scope. Every root scope has an Alerts MDT created. To pull any alerts out from the Secure Workload cluster, user needs to use the Alerts MDT. Data Tap Admin users are the only ones who can download the certificates. Users can only view MDT that belong to their root scope.
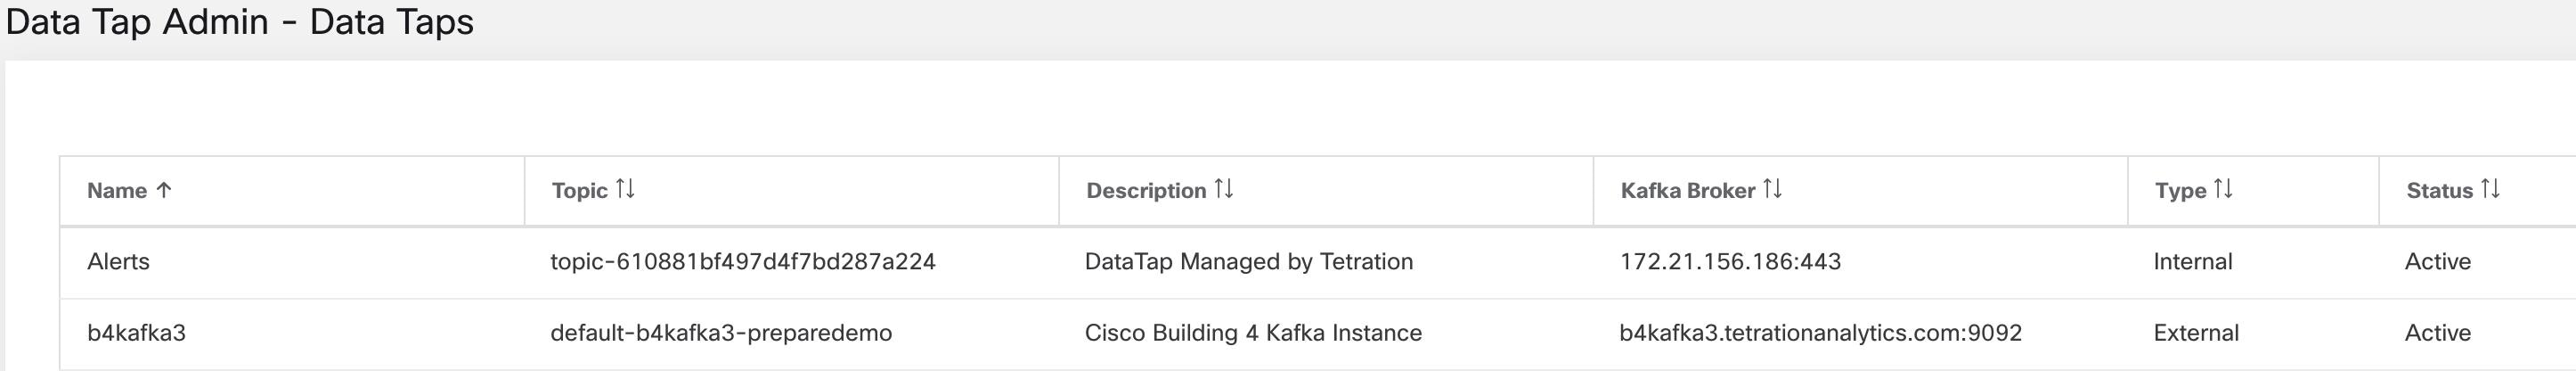
All Secure Workload App alerts are sent to MDT by default, but can be changed to other Data Taps. There are two choices for downloading the certs:
JKS (Jave Keystore format). JKS format works well with Java Client
Certs. Regular certs are easier to use with Go Clients.
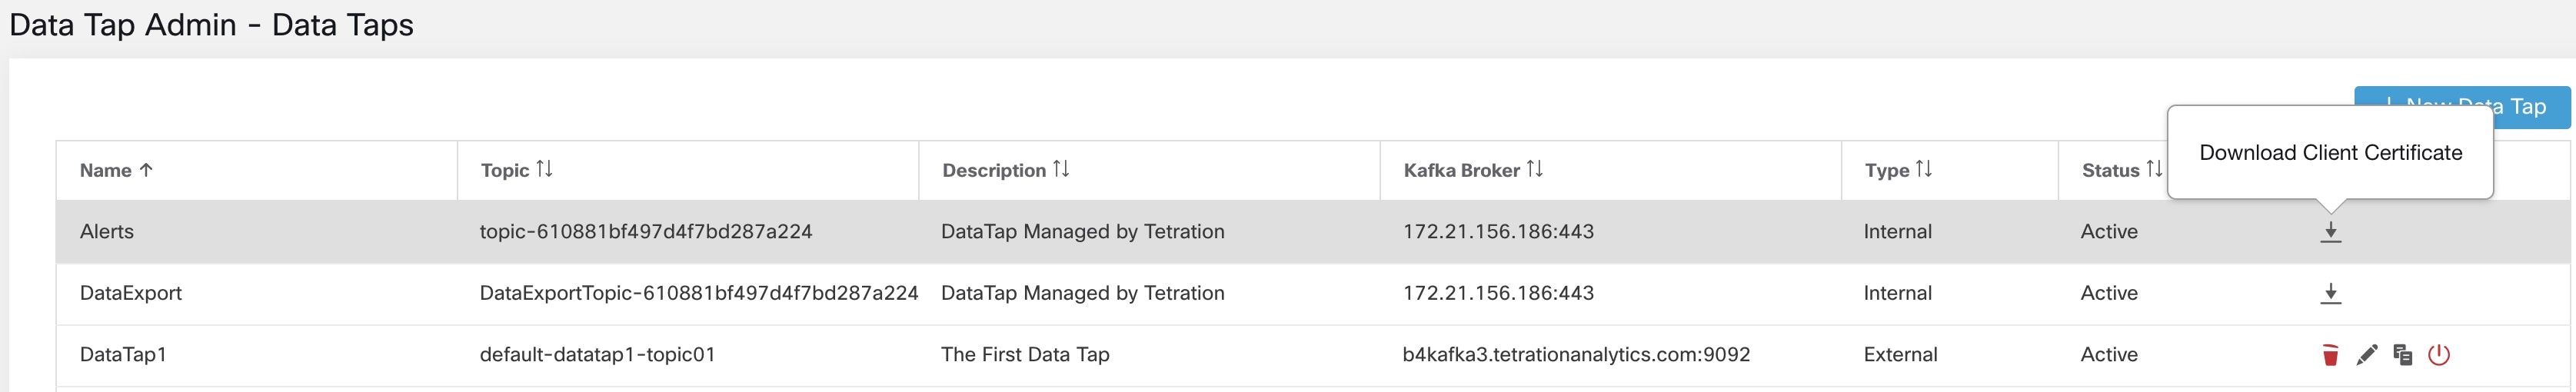
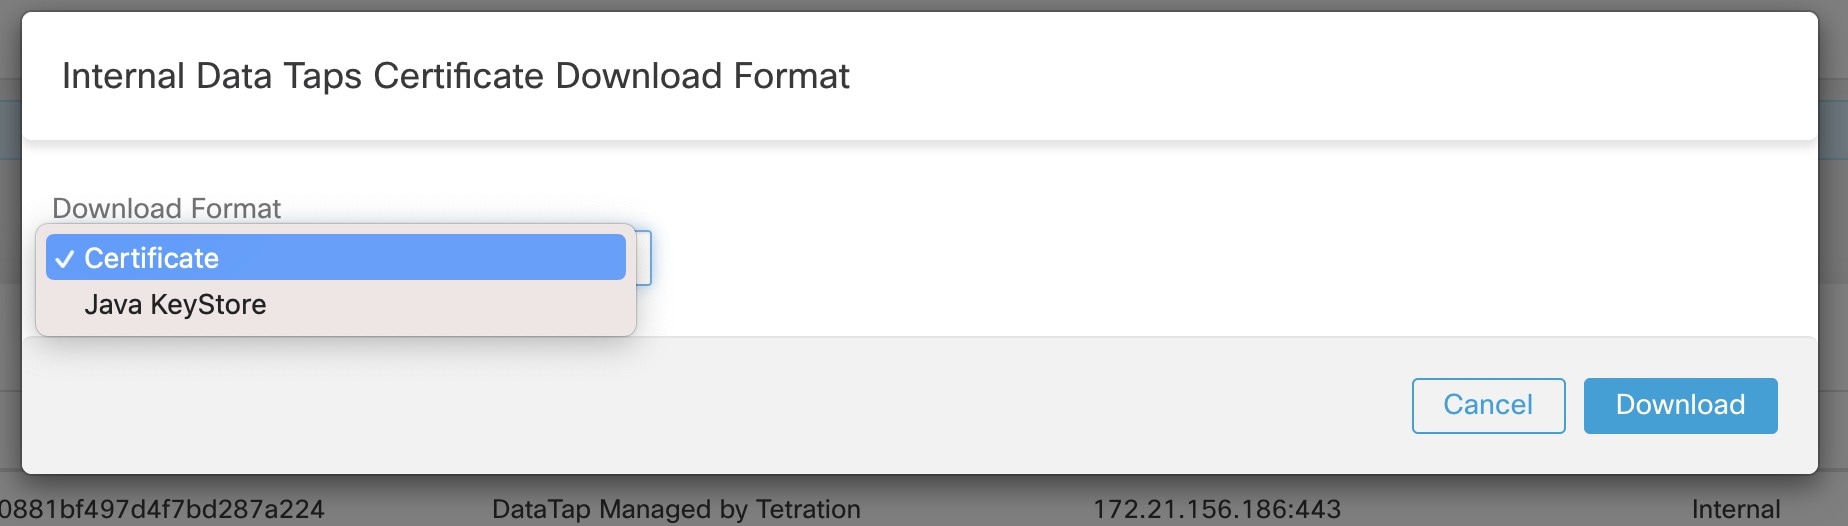
Upon downloading the Alerts.jks.tar.gz, user you should see the following files that contain information to connect to Secure Workload MDT to receive messages:
kafkaBrokerIps.txt - This file contains the IP address string, that kafka client should use to connect to Secure Workload MDT.
topic.txt - This file contains the topic this client can read the messages from. Topics are of the format topic<root_scope_id>. This root_scope_id can be used later while setting up other properties in Java Client
keystore.jks - Keystore the Kafka Client should use in the connection settings shown below.
truststore.jks - Truststore the Kafka Client shoud use in the connection settings shown below.
passphrase.txt - This file contains the password to be used for #3 and #4.
Following the Kafka settings should be used while setting up Consumer.properties (Java client) that uses the keystore and truststore:
   security.protocol=SSL
   ssl.truststore.location=<location_of_truststore_downloaded>
   ssl.truststore.password=<passphrase_mentioned_in_passphrase.txt>
   ssl.keystore.location=<location_of_truststore_downloaded>
   ssl.keystore.password=<passphrase_mentioned_in_passphrase.txt>
   ssl.key.password=<passphrase_mentioned_in_passphrase.txt>
Following set of Properties should be used while setting up the Kafka Consumer in Java code:
    Properties props = new Properties();
    props.put("bootstrap.servers", brokerList);
    props.put("group.id", ConsumerGroup-<root_scope_id>);  // root_scope_id is same as mentioned above
    props.put("key.deserializer",   "org.apache.kafka.common.serialization.StringDeserializer");
    props.put("value.deserializer", "org.apache.kafka.common.serialization.StringDeserializer");
    props.put("enable.auto.commit", "true");
    props.put("auto.commit.interval.ms", "1000");
    props.put("session.timeout.ms", "30000");
    props.put("security.protocol", "SSL");
    props.put("ssl.truststore.location", "<filepath_to_truststore.jks>");
    props.put("ssl.truststore.password", passphrase);
    props.put("ssl.keystore.location", <filepath_to_keystore.jks>);
    props.put("ssl.keystore.password", passphrase);
    props.put("ssl.key.password", passphrase);
    props.put("zookeeper.session.timeout.ms", "500");
    props.put("zookeeper.sync.time.ms", "250");
    props.put("auto.offset.reset", "earliest");
If end user wants to use Certificates, they can use Go clients using Sarama Kafka library to connect to Secure Workload MDT. Upon downloading Alerts.cert.tar.gz, user should see the following files:
kafkaBrokerIps.txt - This file contains the IP address string that Kafka Client should use to connect to Secure Workload MDT
topic - This file contains the topic this client can read the messages from. Topics are of the format topic<root_scope_id>. This root_scope_id can be used later while setting up other properties in Java Client.
KafkaConsumerCA.cert - This file contain the KafkaConsumer certificate.
KafkaConsumerPrivateKey.key - This file contains the Private Key for the Kafka Consumer.
KafkaCA.cert - This file should be used in the root CA certs listing in the Go client.
See the following example of Go Client to connect to Secure Workload MDT. (Attach the Sample Go Code) Sample Go Client to consume alerts from MDT
 Feedback