Administration Portal
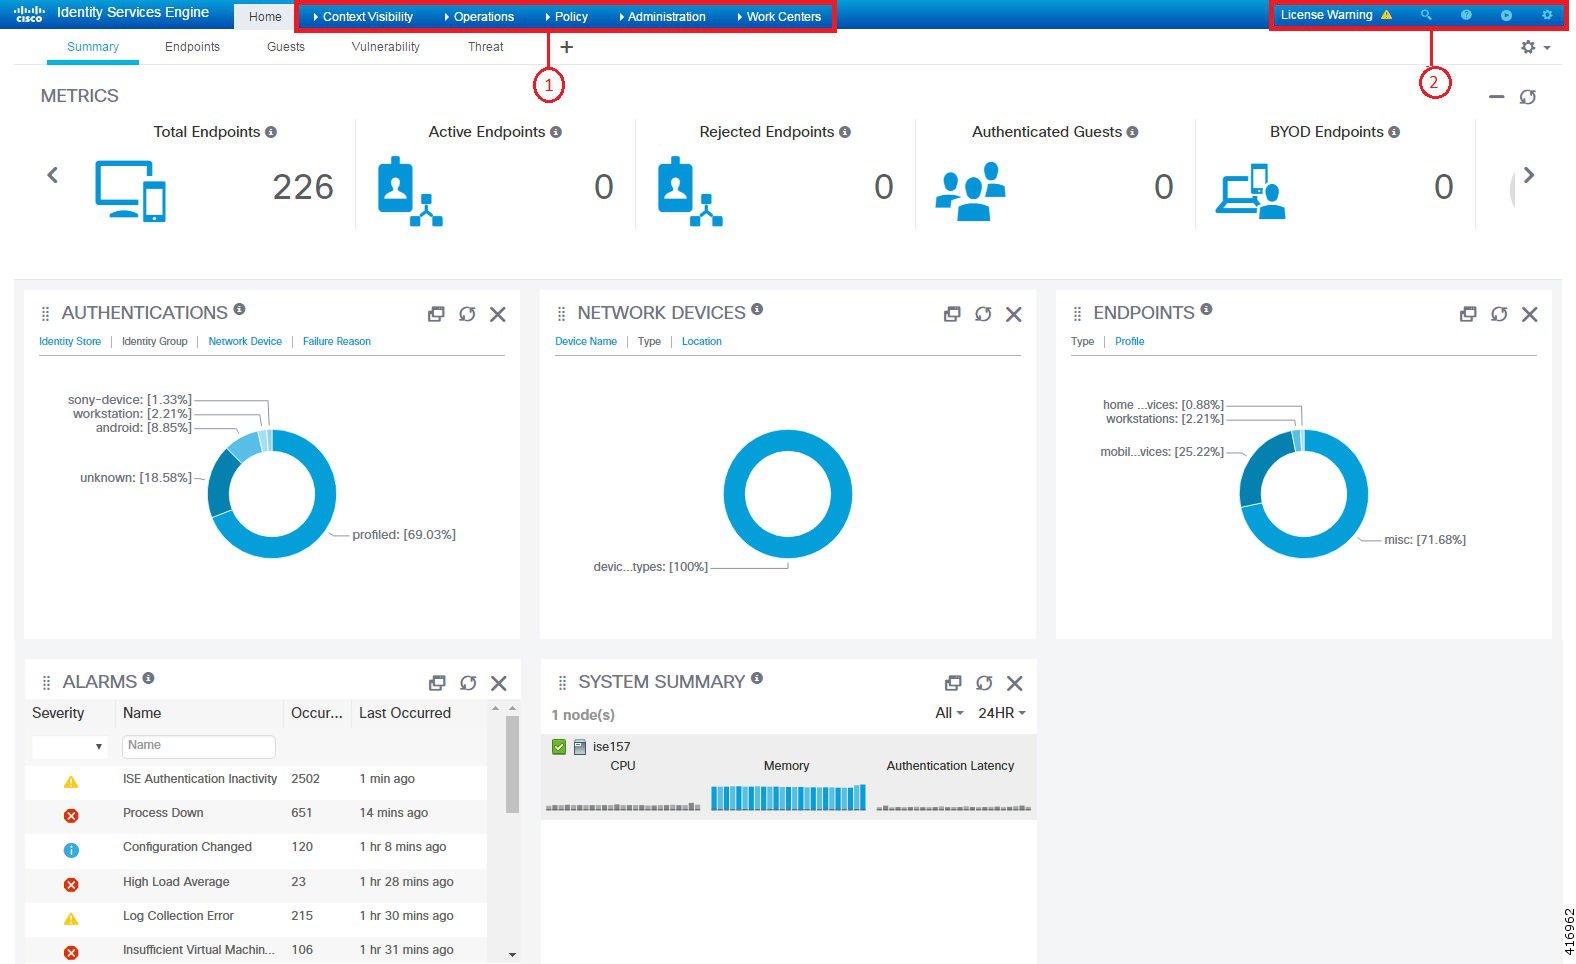
The administration portal provides access to Cisco ISE configuration and reporting. The following figure shows the main elements of the menu bar of the administration portal.
|
1 |
Menu Drop-downs |
|
|
2 |
Top-Right Menu Icons |
|
Cisco ISE Home Dashboards
The Cisco ISE Home dashboard displays live consolidated and correlated statistical data that is essential for effective monitoring and troubleshooting. Dashboard elements typically display activity over 24 hours. The following figure is an example of the information available in a Cisco ISE dashboard. You can view the Cisco ISE dashboard data only in the primary Policy Administration node (PAN) portal.
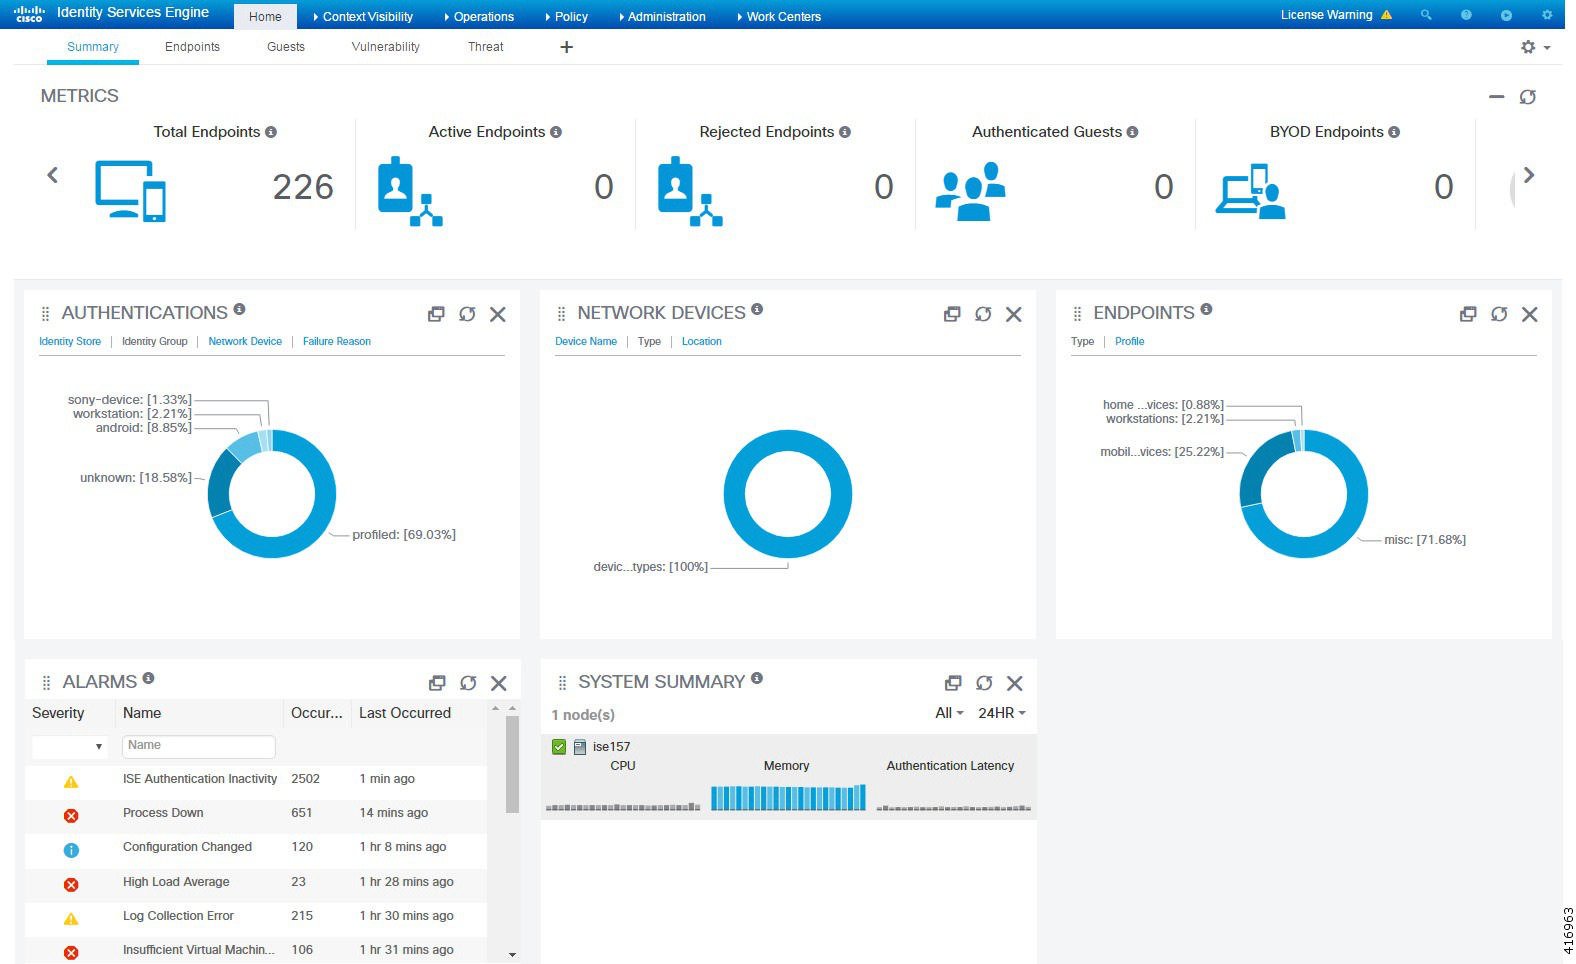
The home page has five default dashboards that show a view of your Cisco ISE data. Each of these dashboards has several predefined dashlets.
-
Summary: This dashboard contains a linear metrics dashlet, pie chart dashlets, and list dashlets. The metrics dashlet is not configurable. By default this dashboard contains the dashlets,Status Endpoints, Endpoint Categories, and Network Devices.
-
Endpoints: By default, this dashboard contains the dashlets Status, Endpoints, Endpoint Categories, and Network Devices.
-
Guests: This dashboard contains dashlets that provide information on guest user type, log in failures, and location of acitivity.
-
Vulnerability: This dashboard displays the information that vulnerability servers report to Cisco ISE.
-
Threat: This dashboard displays the information threat servers report to Cisco ISE.
Configuring Home Dashboards
You can customize a home page dashboard by clicking the Gear icon in the upper right corner of the page:
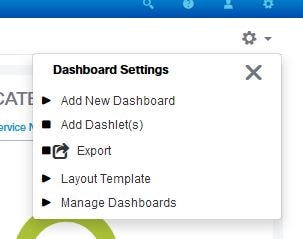
The following options are displayed in the drop-down list:
-
Add New Dashboard allows you to add a new dashboard. Enter a value in the field that is displayed and click Apply.
-
Add Dashlet(s) displays a dialog box with a list of dashlets available. Click Add or Remove next to the dashlet name to add or remove a dashlet from the dashboard.
-
Export saves the selected home page view to a PDF.
-
Layout Template configures the number of columns that are displayed in this view.
-
Manage Dashboards contains two options:
-
Mark As Default Dashboard: Choose this option to make the current dashboard the default view when you choose Home.
-
Reset All Dashboards: Use this option to also reset all the dashboards and remove your configurations on all the Home dashboards.
-
Context Visibility Views
The structure of a Context Visibility page is similar to the Home page, except that Context Visibility pages:
-
Retain your current context (browser window) when you filter the displayed data
-
Are more customizable
-
Focus on endpoint data
You can view the context visibility data only from the Primary Administration Node (PAN).
Dashlets on Context pages show information about endpoints, and endpoint connections to NADs. The information currently displayed is based on the content in the list of data below the dashlets on each page. Each page shows a view of endpoint data, based on the name of the tab. As you filter the data, both the list and dashlets update. You can filter the data by clicking on parts of one or more of the circular graphs, by filtering rows on the table, or any combination those actions. As you select filters, the effects are additive, also referred to as cascading filter, which allows you to drill down to find the particular data you are looking for. You can also click an endpoint in the list, and get a detailed view of that endpoint.
There are four main views under Context Visibility:
-
Endpoints—You can select which endpoints to display based on types of devices, compliance status, authentication type, hardware inventory, and more. Refer to the The Hardware Dashboard section for additional information.

Note
We recommend that you enable the accounting settings on the NADs to ensure that the accounting start and update information is sent to Cisco ISE.
Cisco ISE can collect accounting information, such as the latest IP address, status of the session (Connected, Disconnected, or Rejected), inactivity days of an endpoint, only if accounting is enabled. This information is displayed in the Live Logs/Live Sessions and the Context Visibility pages. When accounting is disabled on a NAD, there might be a missing, incorrect, or mismatch in the accounting information between the Live Sessions/ Live Logs and Context Visibility pages.
Note
The Visibility Setup wizard allows you to add a list of IP address range for endpoints discovery. After this wizard is configured, Cisco ISE authenticates the endpoints, but the endpoints that are not included in the configured IP address range are not displayed in the Context Visibility > Endpoints tab and the Endpoints listing page (under Work Centers > Network Access > Identities > Endpoints).
-
User-Based—Displays user information from user identity sources.
Note the following points while using this view:
-
If there is any change in the username or password attribute, it will be reflected immediately on this page when there is a change in the authentication status.
-
If any other attribute other than the username is changed in the Active Directory, the updated attributes are displayed only after 24 hours upon re-authentication.
-
If the username and other attributes are changed in the Active Directory, the updated changes will be displayed immediately after re-authentication.
-
-
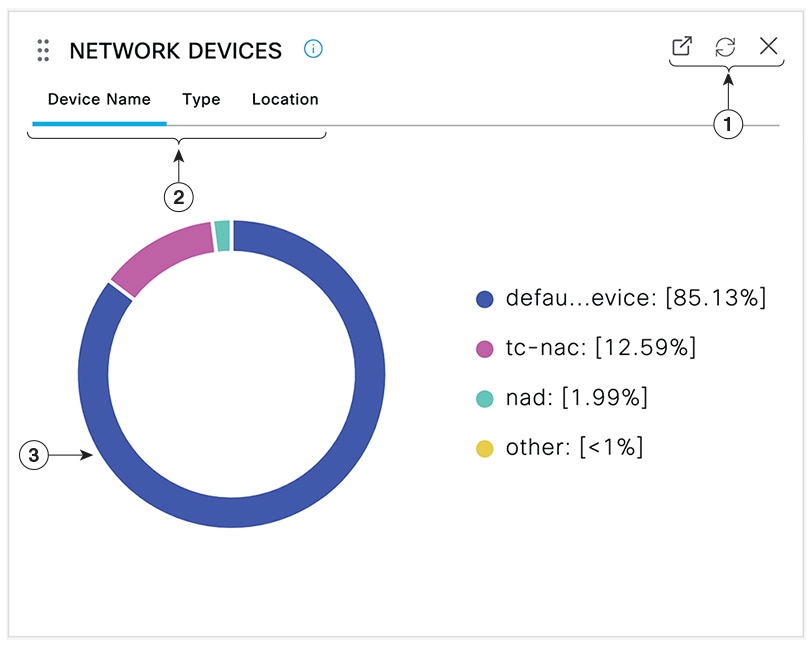
Network Devices—List of NADs that have endpoints connected to them. You can click the Number of Endpoints on a NAD (right-most column) to get a Context Visibility screen listing all those devices filtered by that NAD.
Note
If you have configured your network device with SNMPv3 parameters, you cannot generate the Network Device Session Status Summary report that is provided by the Monitoring service (Operations > Reports > Catalog > Network Device > Session Status Summary). You can generate this report successfully if your network device is configured with SNMPv1 or SNMPv2c parameters.
-
Application—The Application view is used to identify the number of endpoints that have a specified application installed. The results are displayed in graphical and table formats. The graphical representation helps you make a comparative analysis. For example, you can find out the number of endpoints with the Google Chrome software along with their Version, Vendor, and Category (Anti-phishing, Browser, and so on) in a table as well as a bar chart. For more information, see The Application Tab section.
You can create a new view under Context Visibility to create a custom list, for additional filtering. Dashlets are not supported in custom views for this release.
Clicking a section of a circular graph in a dashlet opens a new page with filtered data from that dashlet in Context Visibility mode. From that new page, you can continue to filter the displayed data, as described in Filtering Displayed Data in a View.
For more information about using Context Visibility to find endpoint data, see the following Cisco YouTube video, which uses ISE 2.1 https://www.youtube.com/watch?v=HvonGhrydfg.
Attributes in Context Visibility
The systems and services that provide attributes for Context Visibility sometimes have different values for the same attribute name. A few examples are shown below:
For Operating System
-
OperatingSystem—Posture operating system
-
operating-system—NMAP operating system
-
operating-system-result—Profiler consolidated operating system
Note |
There might be some discrepancies in the endpoint operating system data displayed in the Context Visibility page when multiple probes are enabled for the endpoint in Cisco ISE. |
For Portal Name
-
Portal.Name—Guest portal name when device registration is turned on
-
PortalName—Guest portal name when device registration is not turned on
Portal User
-
User-Name—User name from RADIUS authentication
-
GuestUserName—Guest user
-
PortalUser—Portal user
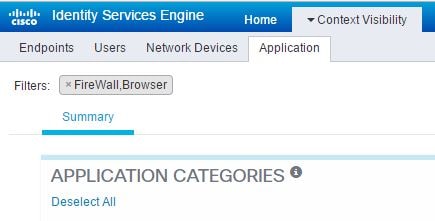
The Application Dashboard
|
Label |
Description |
|||||
|---|---|---|---|---|---|---|
|
1 |
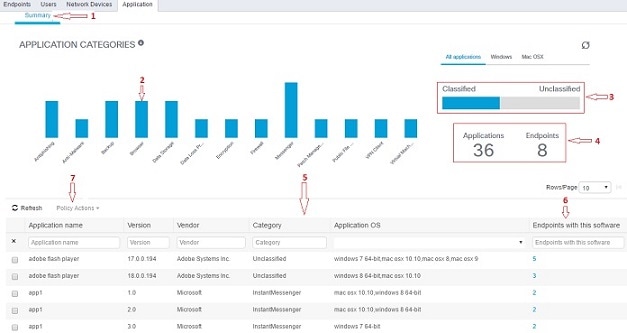
The Summary tab is selected by default. It displays the Application Categories dashlet, which contains a bar chart. Applications are classified into 13 categories. Applications that do not fall into any of these categories are termed Unclassified. The available categories are Anti-Malware, Antiphishing, Backup, Browser, Data Loss Prevention, Data Storage, Encryption, Firewall, Messenger, Patch Management, Public File Sharing, Virtual Machine, and VPN Client. |
|||||
|
2 |
Each bar corresponds to a classified category. You can hover over each bar to view the total number of applications and endpoints that correspond to the selected application category. |
|||||
|
3 |
The applications and endpoints that fall under the Classified category are displayed in Blue. Unclassified applications and endpoints are displayed in Gray. You can hover over the classified or unclassified category bar to view the total number of applications and endpoints that belong to that category. You can click Classified and view the results in the bar chart and table (5). When you click Unclassified, the bar chart is disabled (grayed out) and the results are displayed in the table (5). |
|||||
|
4 |
|
|||||
|
5 |
When you click multiple bars, the corresponding classified applications and endpoints are displayed in the table. For example, if you select the Antimalware and Patch Management categories, the following results are displayed. |
|||||
| Application Name | Version | Vendor | Category | Application OS | Endpoints With This Software | |
| Gatekeeper | 9.9.5 | Apple Inc. | Antimalware | windows 7 64-bit,mac osx 10.10,mac osx 8,mac osx 9 | 5 | |
| Gatekeeper | 10.9.5 | Apple Inc. | Antimalware | windows 8 64-bit,mac osx 10.10 | 3 | |
|
Software Update |
2.3 |
Apple Inc. |
Patch Management |
windows 7 64-bit,mac osx 10.10,mac osx 8,mac osx 9 |
5 |
|
|
6 |
Click an endpoint in the Endpoints With This Software column in the table to view the endpoint details, such as Mac address, NAD IP address, NAD port ID/SSID, IPv4 address, and so on. |
|||||
|
7 |
You can select an application name and choose the Create App Compliance option from the Policy Actions drop-down list to create application compliance condition and remediation. |
|||||
The Hardware Dashboard
The endpoint hardware tab under context visibility helps you collect, analyze, and report endpoint hardware inventory information within a short time. You can gather information, such as finding endpoints with low memory capacity or finding the BIOS model/version in an endpoint. You can increase the memory capacity or upgrade the BIOS version based on these findings. You can assess the requirements before you plan the purchase of an asset. You can ensure timely replacement of resources. You can collect this information without installing any modules or interacting with the endpoint. In summary, you can effectively manage the asset lifecycle.
The page displays the Manufacturers and Endpoint Utilizations dashlets. These dashlets reflect the changes based on the selected filter. The Manufacturers dashlet displays hardware inventory details for endpoints with Windows and Mac OS. The Endpoint Utilizations dashlet displays the CPU, Memory, and Disk utilization for endpoints. You can select any of the three options to view the utilization in percentage.
-
Devices With Over n% CPU Usage.
-
Devices With Over n% Memory Usage.
-
Devices With Over n% Disk Usage.
Note |
The hardware inventory data takes 120 seconds to be displayed in the ISE GUI. The hardware inventory data is collected for posture compliant and non-compliant states. |
Note |
|
The hardware attributes of an endpoint and their connected external devices are displayed in a table format. The following hardware attributes are displayed:
-
MAC Address
-
BIOS Manufacturer
-
BIOS Serial Number
-
BIOS Model
-
Attached Devices
-
CPU Name
-
CPU Speed (GHz)
-
CPU Usage (%)
-
Number of Cores
-
Number of Processors
-
Memory Size (GB)
-
Memory Usage (%)
-
Total Internal Disk(s) Size (GB)
-
Total Internal Disk(s) Free Size (GB)
-
Total Internal Disk(s) Usage (%)
-
Number of Internal Disks
-
NAD Port ID
-
Status
-
Network Device Name
-
Location
-
UDID
-
IPv4 Address
-
Username
-
Hostname
-
OS Types
-
Anomalous Behavior
-
Endpoint Profile
-
Description
-
Endpoint Type
-
Identity Group
-
Registration Date
-
Identity Store
-
Authorization Profile
You can click the number in the Attached Devices column that corresponds to an endpoint to view the Name, Category, Manufacturer, Type, Product ID, and Vendor ID of the USB devices that are currently attached to the endpoint.
Note |
Cisco ISE profiles the hardware attributes of a client’s system, however, there may be a few hardware attributes Cisco ISE does not profile. These hardware attributes may not appear in the Hardware Context Visibility page. |
The hardware inventory data collection interval can be controlled in the page. The default interval is 5 minutes.
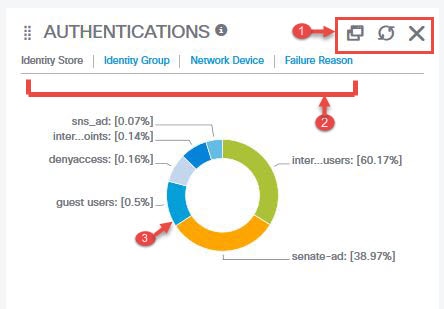
Dashlets
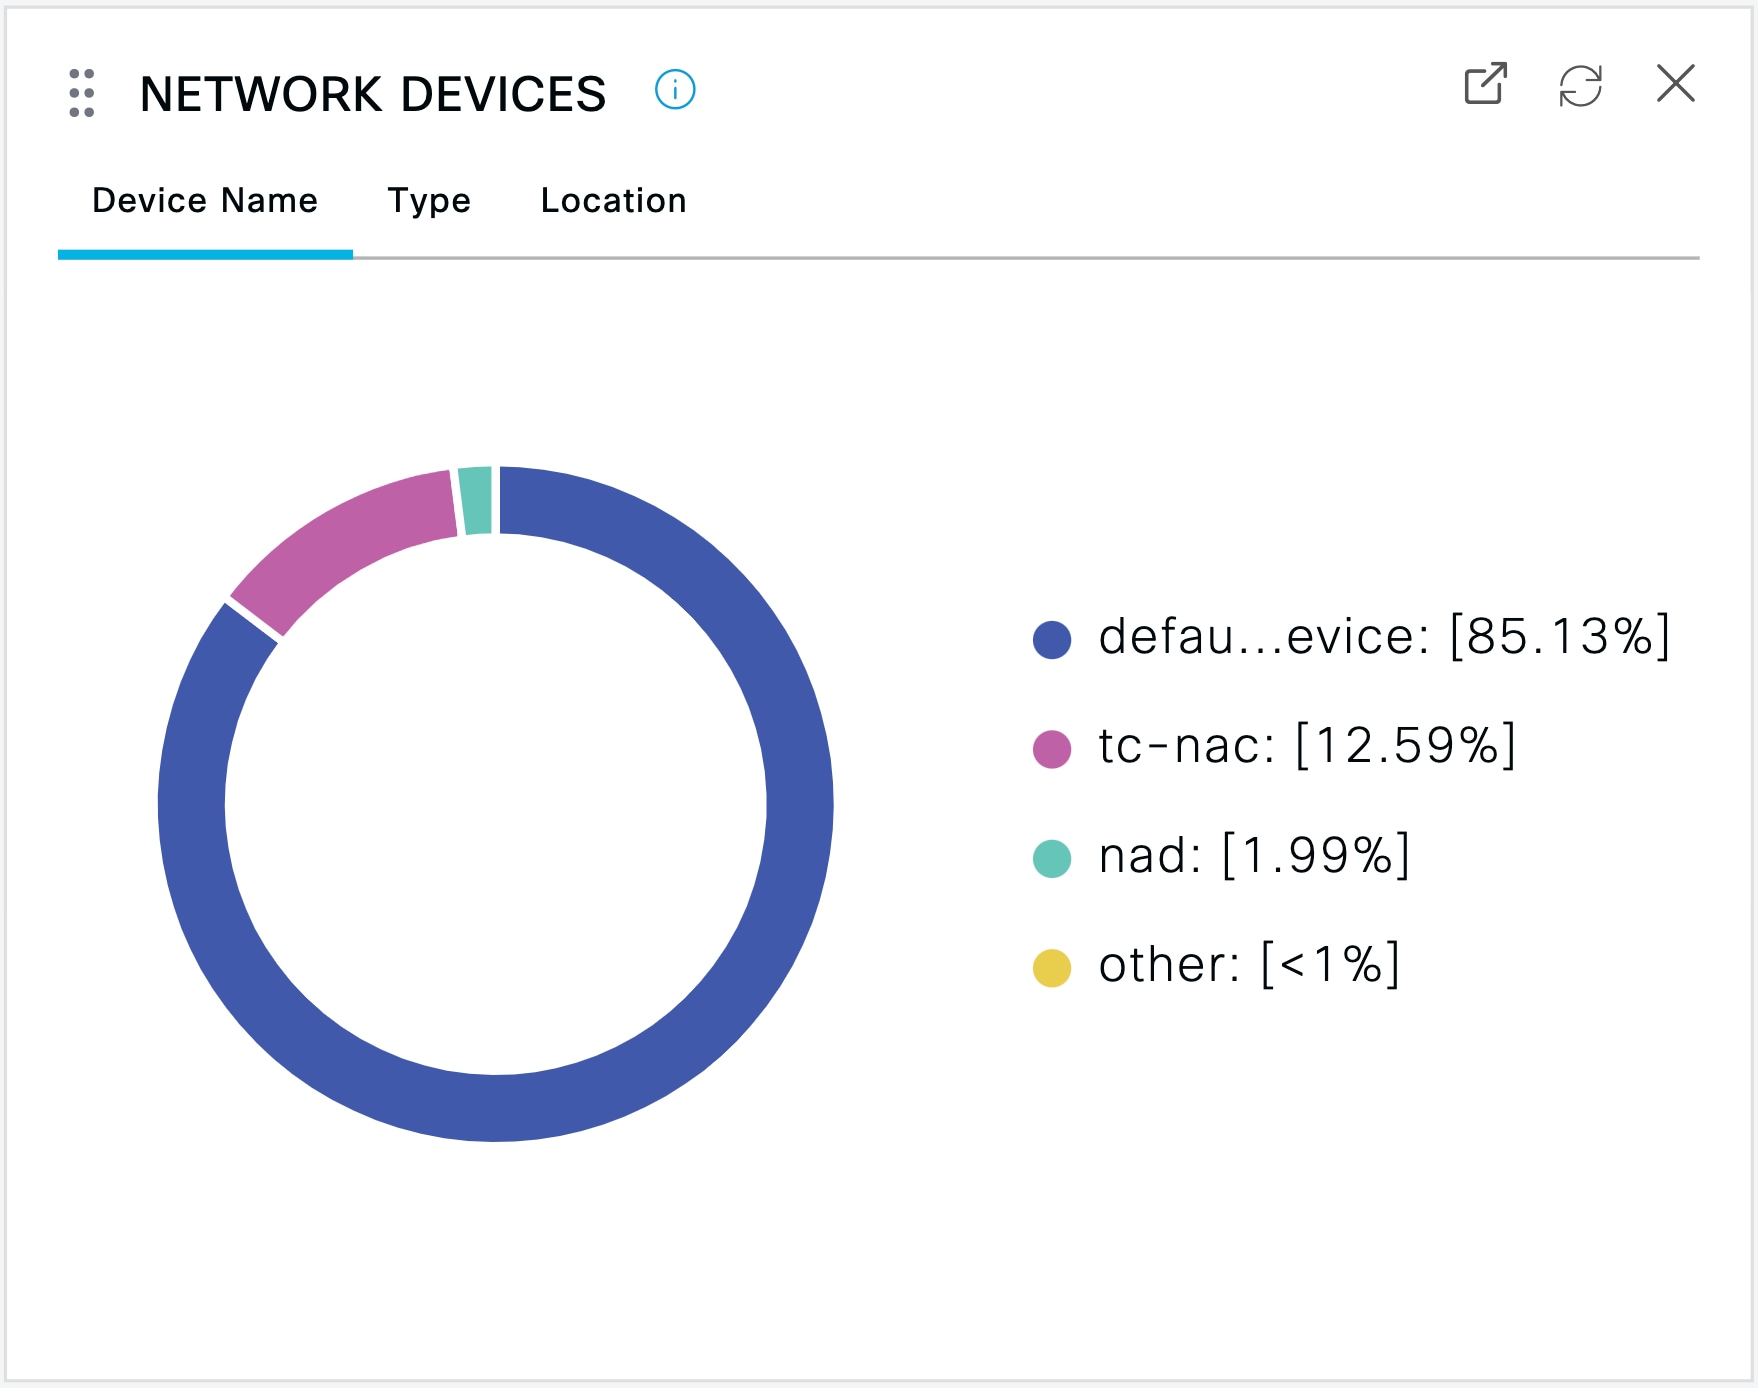
The following image is an example of a dashlet:
-
The stacked window symbol “detaches”,open new window icon opens this dashlet in a new browser window. The circle refreshes. The X deletes this dashlet, but is only available on the Home page. You delete dashlets in Context Visibility using the gear symbol in the top-right corner of the screen.
-
Some dashlets have different categories of data. Click the category to see a pie chart with that set of data.
-
The pie chart shows the data that you have selected. Clicking one of the pie segments opens a new tab in Context Visibility with the filtered data, based on that pie segment.
Clicking a section of the pie chart in a Home dashboard opens in new browser window that displays data filtered by the section of the pie chart that you clicked on.
Clicking a section of the pie chart in a Context view filters the displayed data, but does not change the context; the filtered data displays in the same browser window.
Filtering Displayed Data in a View
Clicking any of the dashlets on a Context Visibility page filters the data that is displayed by the item you clicked, for example, a section of a pie chart.
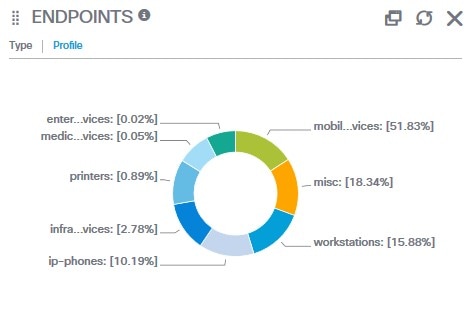
If you click mobil…vices in the Endpoints dashlet, the window redisplays with two Endpoints dashlets, a Network Devices dashlet, and a list of data. The dashlets and list show data for mobile devices, as shown in the following examplea new window is displayed with the data, as shown in the following image:
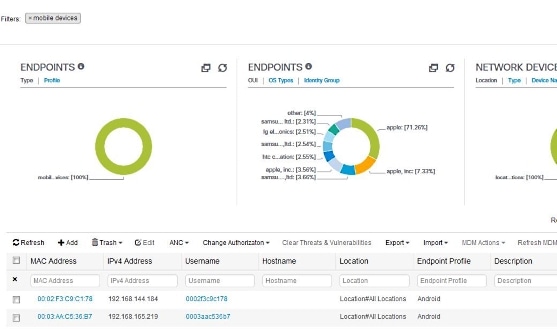
You can continue to filter data by clicking more sections of the pie charts, or by using the controls on the list of data.
-
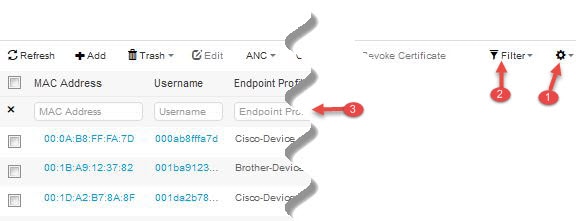
The gear icon filters the displayed columns. The drop-down lets you chose which columns to display in this dashboard’s list.
-
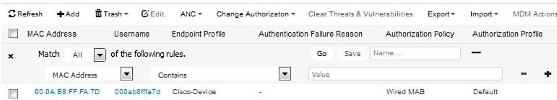
The Quick filter is displayed by default. Entering characters into the box (label number 3) filters the list based on the result. The Custom Filter provides a more granular filter, as shown below.
You can save your custom filters.
Create Custom Filters
You can create and save custom filters and modify the filter criteria in preset filters. Custom filters are not saved in the Cisco ISE database. You can only access them using the same computer and browser used to create them.
Procedure
| Step 1 |
Click the Show drop-down list and choose Advanced Filter. |
| Step 2 |
Specify the search attributes, such as fields, operators, and values from the Filter menus. |
| Step 3 |
Click + to add additional conditions. |
| Step 4 |
Click Go to display the entries that match the specified attributes. |
| Step 5 |
Click the Save icon to save the filter. |
| Step 6 |
Enter a name and click Save. The filter now appears in the Show drop-down list. |
Filter Data by Conditions Using the Advanced Filter
The Advanced Filter allows you to filter information based on specified conditions, such as, First Name = Mike and User Group = Employee. You can specify more than one condition.
Procedure
| Step 1 |
Click the Show drop-down list and choose Advanced Filter. |
| Step 2 |
Specify search the search attributes, such as fields, operators, and values from the Filter menus. |
| Step 3 |
Click + to add additional conditions. |
| Step 4 |
Click Go to display the entries that match the specified attributes. |
Filter Data by Field Attributes Using the Quick Filter
The Quick Filter allows you to enter a value for any of the field attributes displayed in the listing page, refreshes the page, and lists only those records that match your filter criteria.
Procedure
| Step 1 |
Click the Show drop-down list and choose Quick Filter. |
| Step 2 |
Enter search criteria in one or more of the attribute fields, and the entries that match the specified attributes display automatically. |
Endpoint Actions in a View’s List
The toolbar at the top of the list allows you to take actions on endpoints in the list that you selected. Not all actions are enabled for every list, some actions depend on a feature being enabled for use. The following list shows two endoint actions that must be enabled in Cisco ISE before you can use them.
-
If Adaptive Network Control (ANC) is enabled, you can select endpoints in the list, and assign or revoke network access. You can also issue a change of authorization (CoA):
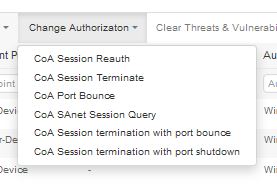
ANC (Endpoint Protection Services) is enabled in Cisco ISE in the Adaptive Network Service window. In the Cisco ISE GUI, click the Menu icon (
 ) and choose\. For more information,
see Enable Adaptive Network Control in Cisco ISE.
) and choose\. For more information,
see Enable Adaptive Network Control in Cisco ISE.
-
If MDM is installed, you can perform MDM actions on selected endpoints.
Cisco ISE Dashboard
The Cisco ISE dashboard or home page (Home > Summary) is the landing page that appears after you log in to the Cisco ISE administration console. The dashboard is a centralized management console consisting of metric meters along the top of the window, with dashlets below. The default dashboards are Summary, Endpoints, Guests, Vulnerability, and Threat. See the Cisco ISE Home Dashboards section for additional information.
Note |
You should view the dashboard data only in the Primary PAN. |
The dashboard’s real-time data provides an at-a-glance status of the devices and users accessing your network as well as an overview of the system's health.
Click the gear icon in the second level menu bar for a drop-down list of dashboard settings. The following table displays information about the options that are available under Dashboard Settings:
|
Option |
Description |
||
|---|---|---|---|
|
Add New Dashboard |
You can have a maximum of 20 dashboards, including the five default dashboards. |
||
|
Rename Dashboard |
To rename a dashboard (available only for custom dashboards):
|
||
|
Add Dashlet |
To add a dashlet to the home page dashboard:
|
||
|
Export |
You can export the dashlet data as a PDF or a CSV file. To do this:
When you export a custom dashboard, the ZIP file is exported with the same name. For example, if you export a custom dashboard named MyDashboard, then the exported file name is MyDashboard.zip. |
||
|
Layout Template |
You can change the layout of the template in which the dashlets are displayed. To change the layout:
|
||
|
Manage Dashboards |
The following options are available under Manage Dashboards:
|
You can delete a dashboard that you have created by clicking the close (x) icon adjacent to the corresponding custom dashboard.
Note |
You cannot rename or delete a default dashboard. |
All the dashlets have a toolbar at the top-right corner, with the following options:
-
Detach: To view a dashlet in a separate window.
-
Refresh: To refresh a dashlet.
-
Remove: To remove a dashlet from the dashboard.
You can drag and drop the dashlet using the gripper icon that is present at the top-left corner of the dashlet.
Quick Filter in Alarms Dashlet: You can filter alarms based on their severity, such as Critical, Warning, and Info. The Alarms dashlet is found on the home page, and contains the Filter drop-down list with the Quick Filter option.


 Feedback