- Prerequisites for Implementing and Monitoring Alarms and Alarm Log Correlation
- Information About Implementing Alarms and Alarm Log Correlation
- Alarm Logging and Debugging Event Management System
- Logging Correlation
- Application of Rules and Rule Sets
- Alarm Severity Level and Filtering
- Bistate Alarms
- Capacity Threshold Setting for Alarms
- Hierarchical Correlation
- Context Correlation Flag
- Duration Timeout Flags
- Reparent Flag
- Reissue Nonbistate Flag
- Internal Rules
- Alarm Logging Suppression
- SNMP Alarm Correlation
- How to Implement and Monitor Alarm Management and Logging Correlation
- Configuring Logging Correlation Rules
- Configuring Logging Correlation Rule Sets
- Configuring Root-cause and Non-root-cause Alarms
- Configuring Hierarchical Correlation Rule Flags
- Configuring Logging Suppression Rules
- Applying Logging Correlation Rules
- Applying Logging Correlation Rule Sets
- Applying Logging Suppression Rules
- Modifying Logging Events Buffer Settings
- Modifying Logging Correlator Buffer Settings
- Enabling Alarm Source Location Display Field for Bistate Alarms
- Displaying Alarms by Severity and Severity Range
- Displaying Alarms According to a Time Stamp Range
- Displaying Alarms According to Message Group and Message Code
- Displaying Alarms According to a First and Last Range
- Displaying Alarms by Location
- Displaying Alarms by Event Record ID
- Displaying the Logging Correlation Buffer Size, Messages, and Rules
- Clearing Alarm Event Records and Resetting Bistate Alarms
- Defining SNMP Correlation Buffer Size
- Defining SNMP Rulesets
- Configuring SNMP Correlation Rules
- Applying SNMP Correlation Rules
- Applying SNMP Correlation Ruleset
- Asynchronous Syslog Communication
- Configuration Examples for Alarm Management and Logging Correlation
- Increasing the Severity Level for Alarm Filtering to Display Fewer Events and Modifying the Alarm Buffer Size and Capacity Threshold: Example
- Configuring a Nonstateful Correlation Rule to Permanently Suppress Node Status Messages: Example
- Configuring a Stateful Correlation Rule for LINK UPDOWN and SONET ALARM Alarms: Example
- Enabling Alarm Source Location Display Field for Bistate Alarms: Example
- Additional References
Implementing and Monitoring Alarms and Alarm Log Correlation
This module describes the concepts and tasks related to configuring alarm log correlation and monitoring alarm logs and correlated event records. Alarm log correlation extends system logging to include the ability to group and filter messages generated by various applications and system servers and to isolate root messages on the router.
This module describes the new and revised tasks you need to perform to implement logging correlation and monitor alarms on your network.
 Note | For more information about system logging on Cisco IOS XR Software and complete descriptions of the alarm management and logging correlation commands listed in this module, see the Related Documents section of this module. To locate documentation for other commands that might appear in the course of performing a configuration task, search online in the Cisco IOS XR Commands Master List for the Cisco XR 12000 Series Router. |
Feature History for Implementing and Monitoring Alarms and Alarm Log Correlation
|
Release |
Modification |
|---|---|
|
Release 3.2 |
This feature was introduced. |
|
Release 3.6.0 |
Support was added for the following features: |
|
Release 3.8.0 |
Support was added for the following features: |
|
Release 3.8.0 |
SNMP alarm correlation feature was added. |
- Prerequisites for Implementing and Monitoring Alarms and Alarm Log Correlation
- Information About Implementing Alarms and Alarm Log Correlation
- How to Implement and Monitor Alarm Management and Logging Correlation
- Configuration Examples for Alarm Management and Logging Correlation
- Additional References
Prerequisites for Implementing and Monitoring Alarms and Alarm Log Correlation
You must be in a user group associated with a task group that includes the proper task IDs. The command reference guides include the task IDs required for each command. If you suspect user group assignment is preventing you from using a command, contact your AAA administrator for assistance.
Information About Implementing Alarms and Alarm Log Correlation
Alarm Logging and Debugging Event Management System
Cisco IOS XR Software Alarm Logging and Debugging Event Management System (ALDEMS) is used to monitor and store alarm messages that are forwarded by system servers and applications. In addition, ALDEMS correlates alarm messages forwarded due to a single root cause.
ALDEMS enlarges on the basic logging and monitoring functionality of Cisco IOS XR Software, providing the level of alarm and event management necessary for a highly distributed system with potentially hundreds of modular service cards (MSCs) and thousands of interfaces.
Cisco IOS XR Software achieves this necessary level of alarm and event management by distributing logging applications across the nodes on the system.
Figure 1 illustrates the relationship between the components that constitute ALDEMS.
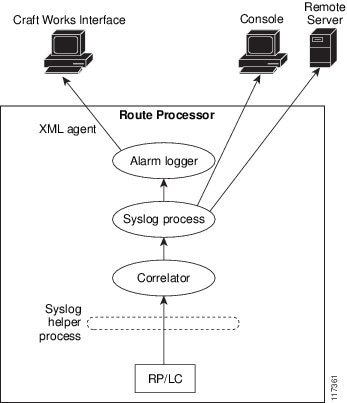
Correlator
The correlator receives messages from system logging (syslog) helper processes that are distributed across the nodes on the router and forwards syslog messages to the syslog process. If a logging correlation rule is configured, the correlator captures messages searching for a match with any message specified in the rule. If the correlator finds a match, it starts a timer that corresponds to the timeout interval specified in the rule. The correlator continues searching for a match to messages in the rule until the timer expires. If the root case message was received, then a correlation occurs; otherwise, all captured messages are forwarded to the syslog. When a correlation occurs, the correlated messages are stored in the logging correlation buffer. The correlator tags each set of correlated messages with a correlation ID.
Note | For more information about logging correlation, see the Logging Correlation section. |
System Logging Process
By default, routers are configured to send system logging messages to a system logging (syslog) process. Syslog messages are gathered by syslog helper processes that are distributed across the nodes on the system. The system logging process controls the distribution of logging messages to the various destinations, such as the system logging buffer, the console, terminal lines, or a syslog server, depending on the network device configuration.
Alarm Logger
The alarm logger is the final destination for system logging messages forwarded on the router. The alarm logger stores alarm messages in the logging events buffer. The logging events buffer is circular; that is, when full, it overwrites the oldest messages in the buffer.
Note | Alarms are prioritized in the logging events buffer. When it is necessary to overwrite an alarm record, the logging events buffer overwrites messages in the following order: nonbistate alarms first, then bistate alarms in the CLEAR state, and, finally, bistate alarms in the SET state. For more information about bistate alarms, see the Bistate Alarms section. |
When the table becomes full of messages caused by bistate alarms in the SET state, the earliest bistate message (based on the message time stamp, not arrival time) is reclaimed before others. The buffer size for the logging events buffer and the logging correlation buffer, thus, should be adjusted so that memory consumption is within your requirements.
A table-full alarm is generated each time the logging events buffer wraps around. A threshold crossing notification is generated each time the logging events buffer reaches the capacity threshold.
Messages stored in the logging events buffer can be queried by clients to locate records matching specific criteria. The alarm logging mechanism assigns a sequential, unique ID to each alarm message.
Logging Correlation
Logging correlation can be used to isolate the most significant root messages for events affecting system performance. For example, the original message describing a card online insertion and removal (OIR) of a card can be isolated so that only the root-cause message is displayed and all subsequent messages related to the same event are correlated. When correlation rules are configured, a common root event that is generating secondary (non-root-cause) messages can be isolated and sent to the syslog, while secondary messages are suppressed. An operator can retrieve all correlated messages from the logging correlator buffer to view correlation events that have occurred.
Correlation Rules
Correlation rules can be configured to isolate root messages that may generate system alarms. Correlation rules prevent unnecessary stress on ALDEMS caused by the accumulation of unnecessary messages. Each correlation rule hinges on a message identification, consisting of a message category, message group name, and message code. The correlator process scans messages for occurrences of the message.
If the correlator receives a root message, the correlator stores it in the logging correlator buffer and forwards it to the syslog process on the RP. From there, the syslog process forwards the root message to the alarm logger in which it is stored in the logging events buffer. From the syslog process, the root message may also be forwarded to destinations such as the console, remote terminals, remote servers, the fault management system, and the Simple Network Management Protocol (SNMP) agent, depending on the network device configuration. Subsequent messages meeting the same criteria (including another occurrence of the root message) are stored in the logging correlation buffer and are forwarded to the syslog process on the router.
If a message matches multiple correlation rules, all matching rules apply and the message becomes a part of all matching correlation queues in the logging correlator buffer.
The following message fields are used to define a message in a logging correlation rule:
-
Message category
-
Message group
-
Message code
Wildcards can be used for any of the message fields to cover wider set of messages. Configure the appropriate set of messages in a logging correlation rule configuration to achieve correlation with a narrow or wide scope (depending on your objective).
Types of Correlation
There are two types of correlation that are configured in rules to isolate root-cause messages:
Nonstateful Correlation—This correlation is fixed after it has occurred, and non-root-cause alarms that are suppressed are never forwarded to the syslog process. All non-root-cause alarms remain buffered in correlation buffers.
Stateful Correlation—This correlation can change after it has occurred, if the bistate root-cause alarm clears. When the alarm clears, all the correlated non-root-cause alarms are sent to syslog and are removed from the correlation buffer. Stateful correlations are useful to detect non-root-cause conditions that continue to exist even if the suspected root cause no longer exists.
Application of Rules and Rule Sets
If a correlation rule is applied to the entire router, then correlation takes place only for those messages that match the configured cause values for the rule, regardless of the context or location setting of that message.
If a correlation rule is applied to a specific set of contexts or locations, then correlation takes place only for those messages that match the configured cause values for the rule and that match at least one of those contexts or locations.
In the case of a rule-set application, the behavior is the same; however, the apply configuration takes place for all rules that are part of the given rule set.
The show logging correlator rule command is used to display apply settings for a given rule, including those settings that have been configured with the logging correlator apply ruleset command.
Root Message and Correlated Messages
When a correlation rule is configured and applied, the correlator starts searching for a message match as specified in the rule. After a match is found, the correlator starts a timer corresponding to the timeout interval that is also specified in the rule. A message search for a match continues until the timer expires. Correlation occurs after the root-cause message is received.
The first message (with category, group, and code triplet) configured in a correlation rule defines the root-cause message. A root-cause message is always forwarded to the syslog process. See the Correlation Rules section to learn how the root-cause message is forwarded and stored.
Alarm Severity Level and Filtering
Filter settings can be used to display information based on severity level. The alarm filter display indicates the severity level settings used to report alarms, the number of records, and the current and maximum log size.
Alarms can be filtered according to the severity level shown in this table.
|
Severity Level |
System Condition |
|---|---|
|
0 |
Emergencies |
|
1 |
Alerts |
|
2 |
Critical |
|
3 |
Errors |
|
4 |
Warnings |
|
5 |
Notifications |
|
6 |
Informational |
Bistate Alarms
Bistate alarms are generated by state changes associated with system hardware, such as a change of interface state from active to inactive, the online insertion and removal (OIR) of a modular service card (MSC), or a change in component temperature. Bistate alarm events are reported to the logging events buffer by default; informational and debug messages are not.
Cisco IOS XR Software software provides the ability to reset and clear alarms. Clients interested in monitoring alarms in the system can register with the alarm logging mechanism to receive asynchronous notifications when a monitored alarm changes state.
Bistate alarm notifications provide the following information:
-
The origination ID, which uniquely identifies the resource that causes an alarm to be raised or cleared. This resource may be an interface, a line card, or an application-specific integrated circuit (ASIC). The origination ID is a unique combination of the location, job ID, message group, and message context.
By default, the general format of bistate alarm messages is the same as for all syslog messages:
node-id:timestamp : process-name pid : %category-group-severity-code : message-text
The following is a sample bistate alarm message:
LC/0/2/CPU0:Aug 15 21:39:11.325 2008:ifmgr[163]: %PKT_INFRA-LINEPRO
TO-5-UPDOWN : Line protocol on Interface POS0/2/0/2, changed state to Down
The following is a sample bistate alarm message: The message text includes the location of the process logging the alarm. In this example, the alarm was logged by the line protocol on POS interface 0/2/0/2. Optionally, you can configure the output to include the location of the actual alarm source, which may be different from the process that logged the alarm. This appears as an additional display field before the message text.
When alarm source location is displayed, the general format becomes:
node-id:timestamp : process-name pid : %category-group-severity-code : source-location:message-text
The example above becomes:
LC/0/2/CPU0:Aug 15 21:39:11.325 2008:ifmgr[163]: %PKT_INFRA-LINEPRO
TO-5-UPDOWN : interface POS0/2/0/2: Line protocol on Interface POS0/2/0/2, changed state to Down
For information about how to configure the output to include the location of the actual alarm source, see Enabling Alarm Source Location Display Field for Bistate Alarms.
Capacity Threshold Setting for Alarms
The capacity threshold setting determines when the alarm system begins reporting threshold crossing alarms. The capacity threshold for generating warning alarms is generally set at 80 percent of buffer capacity, but individual configurations may require different settings.
Hierarchical Correlation
Hierarchical correlation takes effect when the following conditions are true:
-
When a single alarm is both a root cause for one rule and a non-root cause for another rule.
-
When alarms are generated that result in successful correlations associated with both rules.
The following example illustrates two hierarchical correlation rules:
|
Rule 1 |
Category |
Group |
Code |
|---|---|---|---|
|
Root Cause 1 |
Cat 1 |
Group 1 |
Code 1 |
|
Non-root Cause 2 |
Cat 2 |
Group 2 |
Code 2 |
| Rule 2 | |||
|
Root Cause 2 |
Cat 2 |
Group 2 |
Code 2 |
|
Non-root Cause 3 |
Cat 3 |
Group 3 |
Code 3 |
If three alarms are generated for Cause 1, 2, and 3, with all alarms arriving within their respective correlation timeout periods, then the hierarchical correlation appears like this:
Cause 1 -> Cause 2 -> Cause 3
The correlation buffers show two separate correlations: one for Cause 1 and Cause 2 and the second for Cause 2 and Cause 3. However, the hierarchical relationship is implicitly defined.
Note | Stateful behavior, such as reparenting and reissuing of alarms, is supported for rules that are defined as stateful; that is, correlations that can change. |
Context Correlation Flag
The context correlation flag allows correlations to take place on a “per context” basis or not.
This flag causes behavior change only if the rule is applied to one or more contexts. It does not go into effect if the rule is applied to the entire router or location nodes.
The following is a scenario of context correlation behavior:
-
Rule 1 has a root cause A and an associated non-root cause.
-
Context correlation flag is not set on Rule 1.
-
Rule 1 is applied to contexts 1 and 2.
If the context correlation flag is not set on Rule 1, a scenario in which alarm A generated from context 1 and alarm B generated from context 2 results in the rule applying to both contexts regardless of the type of context.
If the context correlation flag is now set on Rule 1 and the same alarms are generated, they are not correlated as they are from different contexts.
With the flag set, the correlator analyzes alarms against the rule only if alarms arrive from the same context. In other words, if alarm A is generated from context 1 and alarm B is generated from context 2, then a correlation does not occur.
Duration Timeout Flags
The root-cause timeout (if specified) is the alternative rule timeout to use in the situation in which a non-root-cause alarm arrives before a root-cause alarm in the given rule. It is typically used to give a shorter timeout in a situation under the assumption that it is less likely that the root-cause alarm arrives, and, therefore, releases the hold on the non-root-cause alarms sooner.
Reparent Flag
The reparent flag specifies what happens to non-root-cause alarms in a hierarchical correlation when their immediate root cause clears.
The following example illustrates context correlation behavior:
-
Rule 1 has a root cause A and an associated non-root cause B
-
Context correlation flag is not set on Rule 1
-
Rule 1 is applied to contexts 1 and 2
In this scenario, if alarm A arrives generated from context 1 and alarm B generated from context 2, then a correlation occurs—regardless of context.
If the context correlation flag is now set on Rule 1 and the same alarms are generated, they are not correlated, because they are from different contexts.
Reissue Nonbistate Flag
The reissue nonbistate flag controls whether nonbistate alarms (events) are forwarded from the correlator log if their parent bistate root-cause alarm clears. Active bistate non-root-causes are always forwarded in this situation, because the condition is still present.
The reissue-nonbistate flag allows you to control whether non-bistate alarms are forwarded.
Internal Rules
Internal rules are defined on Cisco IOS XR Software and are used by protocols and processes within Cisco IOS XR Software. These rules are not customer configurable, but you may view them by using the show logging correlator rule command. All internal rule names are prefixed with [INTERNAL].
Alarm Logging Suppression
The alarm logging suppression feature enables you to suppress the logging of alarms that meet criteria that you define. This is useful for suppressing logs that are either benign for a particular situation, or describe a situation that cannot be rectified immediately. These logs may be emitted frequently and pollute the logs or console or both, and make interacting with Cisco IOS XR Software difficult by obscuring the output of the commands you are executing.
To use the alarm logging suppression feature, you define logging suppression rules that specify the types of alarms that you want to suppress. You can then activate each rule, specifying to which alarm sources to apply the rule.
A logging suppression rule can specify all types of alarms or alarms with specific message categories, group names, and message codes. You can apply a logging suppression rule to alarms originating from all locations on the router or to alarms originating from specific nodes.
SNMP Alarm Correlation
In large-scale systems, such as Cisco IOS XR multi-chassis system , there may be situations when you encounter many SNMP traps emitted at regular intervals of time. These traps, in turn, cause additional time in the Cisco IOS XR processing of traps.
The additional traps can also slow down troubleshooting and increases workload for the monitoring systems and the operators. So, this feature addresses these issues.
The objective of this SNMP alarm correlation feature is to:
How to Implement and Monitor Alarm Management and Logging Correlation
Configuring Logging Correlation Rules
This task explains how to configure logging correlation rules.
The purpose of configuring logging correlation rules is to define the root cause and non-root-cause alarm messages (with message category, group, and code combinations) for logging correlation. The originating root-cause alarm message is forwarded to the syslog process, and all subsequent (non-root-cause) alarm messages are sent to the logging correlation buffer.
The fields inside a message that can be used for configuring correlation rules are as follows:
-
Message category (for example, PKT_INFRA, MGBL, OS)
-
Message group (for example, LINK, LINEPROTO, or OIR)
-
Message code (for example, UPDOWN or GO_ACTIVE).
The logging correlator mechanism, running on the active route processor, begins queueing messages matching the ones specified in the correlation rules for the time specified in the timeout interval of the correlation rule.
The timeout interval begins when the correlator captures any alarm message specified for a given rule.
1.
configure
2.
logging
correlator rule
correlation-rule {
type {
stateful |
nonstateful }}
3.
timeout [
milliseconds ]
4.
commit
5.
show
logging correlator rule {all |
correlation-rule1 ...
correlation-rule14 } [
context
context1 ...
context
6 ] [
location
node-id1...node-id6 ] [
rulesource {
internal |
user
}] [
ruletype {
nonstateful |
stateful }] [
summary |
detail
]
DETAILED STEPS
Configuring Logging Correlation Rule Sets
This task explains how to configure logging correlation rule sets.
1.
configure
2.
logging correlator ruleset
ruleset
3.
rulename
rulename
4.
commit
5.
show
logging correlator ruleset {
all |
correlation-ruleset1...correlation-ruleset14 } [
detail
|
summary ]
DETAILED STEPS
Configuring Root-cause and Non-root-cause Alarms
To correlate a root cause to one or more non-root-cause alarms and configure them to a rule, use the rootcause and nonrootcause commands specified for the correlation rule.
1.
configure
2.
logging correlator rule
correlation-rule {
type {
stateful |
nonstateful }}
3.
rootcause {
msg-category
group-name
msg-code }
4.
nonrootcause
5.
alarm
msg-category
group-name
msg-code
6.
commit
7.
show logging correlator
rule {
all |
correlation-rule1...correlation-rule14 } [
context
context1...context 6 ] [
location
node-id1...node-id6 ] [
rulesource {
internal |
user
}] [
ruletype {
nonstateful |
stateful }] [
summary |
detail
]
DETAILED STEPS
Configuring Hierarchical Correlation Rule Flags
Hierarchical correlation is when a single alarm is both a root cause for one correlation rule and a non-root cause for another rule, and when alarms are generated resulting in a successful correlation associated with both rules. What happens to a non-root-cause alarm hinges on the behavior of its correlated root-cause alarm.
There are cases in which you want to control the stateful behavior associated with these hierarchies and to implement flags, such as reparenting and reissuing of nonbistate alarms. This task explains how to implement these flags.
See the Reparent Flag and Reissue Nonbistate Flag sections for detailed information about these flags.
1.
configure
2.
logging correlator rule
correlation-rule {
type {
stateful |
nonstateful }}
3.
reissue-nonbistate
4.
reparent
5.
commit
6.
show logging correlator
rule {
all |
correlation-rule1...correlation-rule14 } [
context
context1...context 6 ] [
location
node-id1...node-id6 ] [
rulesource {
internal |
user
}] [
ruletype {
nonstateful |
stateful }] [
summary |
detail
]
DETAILED STEPS
To activate a defined correlation rule and rule set, you must apply them by using the logging correlator apply rule and logging correlator apply ruleset commands.
Configuring Logging Suppression Rules
This task explains how to configure logging suppression rules.
1.
configure
2.
logging suppress rule
rule-name [ alarm
msg-category group-name msg-code | all-alarms
]
4.
commit
DETAILED STEPS
Applying Logging Correlation Rules
This task explains how to apply logging correlation rules.
Applying a correlation rule activates it and gives a scope. A single correlation rule can be applied to multiple scopes on the router; that is, a rule can be applied to the entire router, to several locations, or to several contexts.
Note | When a rule is applied or if a rule set that contains this rule is applied, then the rule definition cannot be modified through the configuration until the rule or rule set is once again unapplied. |
Note | It is possible to configure apply settings at the same time for both a rule and rule sets that contain the rule. In this case, the apply settings for the rule are the union of all these apply configurations. |
1.
configure
2.
logging
correlator apply rule
correlation-rule
4.
commit
5.
show logging correlator rule { all |
correlation-rule1...correlation-rule14 } [ context
context1...context 6 ] [ location
node-id1...node-id6 ] [ rulesource { internal |
user }] [ ruletype { nonstateful |
stateful }] [ summary | detail ]
DETAILED STEPS
Applying Logging Correlation Rule Sets
This task explains how to apply logging correlation rule sets.
Applying a correlation rule set activates it and gives a scope. When applied, a single rule-set configuration immediately effects the rules that are part of that given rule set.
Note | Rule definitions that were previously applied (singly or as part of another rule set) cannot be modified until that rule or rule set is unapplied. Use the no form of the command to negate usage and then try to reapply rule set. |
1.
configure
2.
logging
correlator
apply
ruleset
correlation-rule
3.
Do one of the
following:
4.
commit
5.
show logging correlator
ruleset {
all |
correlation-ruleset1 ...
correlation-ruleset14 } [
detail
|
summary ]
DETAILED STEPS
Applying Logging Suppression Rules
This task explains how to apply logging suppression rules.
Applying a logging suppression rule activates it and gives a scope. A logging suppression rule can be applied to alarms originating from everywhere on the entire router, or to specific locations on the router.
1.
configure
2.
logging suppress apply rule
rule-name [ all-of-router | source location
node-id ]
4.
commit
DETAILED STEPS
Modifying Logging Events Buffer Settings
Logging events buffer settings can be adjusted to respond to changes in user activity, network events, or system configuration events that affect network performance, or in network monitoring requirements. The appropriate settings depend on the configuration and requirements of the system.
This task involves the following steps:
-
Modifying logging events buffer size
-
Setting threshold for generating alarms
-
Setting the alarm filter (severity)
 Caution | Modifications to alarm settings that lower the severity level for reporting alarms and threshold for generating capacity-warning alarms may slow system performance. |
Caution | Modifying the logging events buffer size clears the buffer of all event records except for the bistate alarms in the set state. |
1.
show logging events info
2.
configure
3.
logging events buffer-size
bytes
4.
logging events threshold
percent
5.
logging events level
severity
6.
commit
7.
show logging events info
DETAILED STEPS
| Command or Action | Purpose | |
|---|---|---|
| Step 1 | show logging events info
Example:
RP/0/0/CPU0:router# show logging events info
|
(Optional) Displays the size of the logging events buffer (in bytes), the percentage of the buffer that is occupied by alarm-event records, capacity threshold for reporting alarms, total number of records in the buffer, and severity filter, if any. |
| Step 2 |
configure
| |
| Step 3 | logging events buffer-size
bytes
Example:
RP/0/0/CPU0:router(config)# logging events buffer-size 50000
|
Specifies the size of the alarm record buffer. |
| Step 4 | logging events threshold
percent
Example:
RP/0/0/CPU0:router(config)# logging events threshold 85
|
Specifies the percentage of the logging events buffer that must be filled before the alarm logger generates a threshold-crossing alarm. |
| Step 5 | logging events level
severity
Example:
RP/0/0/CPU0:router(config)# logging events level warnings
|
Sets the severity level that determines which logging events are displayed. (See Table 1 under the Alarm Severity Level and Filtering section for a list of the severity levels.)
|
| Step 6 |
commit
| |
| Step 7 | show logging events info
Example:
RP/0/0/CPU0:router# show logging events info
|
(Optional) Displays the size of the logging events buffer (in bytes), percentage of the buffer that is occupied by alarm-event records, capacity threshold for reporting alarms, total number of records in the buffer, and severity filter, if any. |
Modifying Logging Correlator Buffer Settings
This task explains how to modify the logging correlator buffer settings.
The size of the logging correlator buffer can be adjusted to accommodate the anticipated volume of incoming correlated messages. Records can be removed from the buffer by correlation ID, or the buffer can be cleared of all records.
1.
configure
2.
logging correlator buffer-size
bytes
3.
exit
4.
show logging correlator info
5.
clear logging correlator delete
correlation-id
6.
clear logging correlator delete
all-in-buffer
7.
show logging correlator
buffer {
all-in-buffer [
ruletype [
nonstateful |
stateful ]] | [
rulesource [
internal |
user
]] |
rule-name
correlation-rule1...correlation-rule14 |
correlationID
correlation-id1..correlation-id14 }
DETAILED STEPS
Enabling Alarm Source Location Display Field for Bistate Alarms
This task explains how to enable the alarm source location display field for bistate alarms.
1.
configure
2.
logging events display-location
3.
commit
DETAILED STEPS
| Command or Action | Purpose |
|---|
Displaying Alarms by Severity and Severity Range
This task explains how to display alarms by severity and severity range.
Alarms can be displayed according to severity level or a range of severity levels. Severity levels and their respective system conditions are listed in Table 1 under the Alarm Severity Level and Filtering section.
Note | The commands can be entered in any order. |
1.
show logging events buffer severity-lo-limit
severity
2.
show logging events buffer severity-hi-limit
severity
3.
show logging events buffer severity-hi-limit
severity
severity-lo-limit
severity
4.
show logging events buffer
severity-hi-limit
severity
severity-lo-limit
severity
timestamp-lo-limit
hh
:
mm
:
ss [
month
] [
day ]
[
year
]
DETAILED STEPS
Displaying Alarms According to a Time Stamp Range
Alarms can be displayed according to a time stamp range. Specifying a specific beginning and endpoint can be useful in isolating alarms occurring during a particular known system event.
This task explains how to display alarms according to a time stamp range.
Note | The commands can be entered in any order. |
1.
show logging events buffer
timestamp-lo-limit
hh
:
mm
:
ss [
month
] [
day ]
[
year
]
2.
show logging events buffer
timestamp-hi-limit
hh
:
mm
:
ss [
month
] [
day ]
[
year
]
3.
show logging events buffer
timestamp-hi-limit
hh
:
mm
:
ss [
month
] [
day ]
[
year ]
timestamp-lo-limit
hh
:
mm
:
ss [
month
] [
day ]
[
year
]
DETAILED STEPS
| Command or Action | Purpose | |
|---|---|---|
| Step 1 | show logging events buffer
timestamp-lo-limit
hh
:
mm
:
ss [
month
] [
day ]
[
year
]
Example:
RP/0/0/CPU0:router# show logging events buffer timestamp-lo-limit 21:28:00 april 18 04
|
(Optional) Displays logging events with a time stamp after the specified time and date. |
| Step 2 | show logging events buffer
timestamp-hi-limit
hh
:
mm
:
ss [
month
] [
day ]
[
year
]
Example:
RP/0/0/CPU0:router# show logging events buffer timestamp-hi-limit 21:28:03 april 18 04
|
(Optional) Displays logging events with a time stamp before the specified time and date. |
| Step 3 | show logging events buffer
timestamp-hi-limit
hh
:
mm
:
ss [
month
] [
day ]
[
year ]
timestamp-lo-limit
hh
:
mm
:
ss [
month
] [
day ]
[
year
]
Example:
RP/0/0/CPU0:router# show logging events buffer timestamp-hi-limit 21:28:00 april 18 04 timestamp-lo-limit 21:16:00 april 18 03
|
(Optional) Displays logging events with a time stamp after and before the specified time and date. |
Displaying Alarms According to Message Group and Message Code
This task explains how to display alarms in the logging events buffer according to message code and message group.
Displaying alarms by message group and message code can be useful in isolating related events.
Note | The commands can be entered in any order. |
1.
show logging events buffer group
message-group
2.
show logging events buffer message
message-code
3.
show
logging
events
buffer
group
message-group
message
message-code
DETAILED STEPS
| Command or Action | Purpose | |
|---|---|---|
| Step 1 | show logging events buffer group
message-group
Example:
RP/0/0/CPU0:router# show logging events buffer group SONET
|
(Optional) Displays logging events matching the specified message group. |
| Step 2 | show logging events buffer message
message-code
Example:
RP/0/0/CPU0:router# show logging events buffer message ALARM
|
(Optional) Displays logging events matching the specified message code. |
| Step 3 | show
logging
events
buffer
group
message-group
message
message-code
Example:
RP/0/0/CPU0:router# show logging events buffer group SONET message ALARM
|
(Optional) Displays logging events matching the specified message group and message code. |
Displaying Alarms According to a First and Last Range
This task explains how to display alarms according to a range of the first and last alarms in the logging events buffer.
Alarms can be displayed according to a range, beginning with the first or last alarm in the logging events buffer.
Note | The commands can be entered in any order. |
1.
show logging events buffer first
event-count
2.
show logging events buffer last
event-count
3.
show logging events buffer first
event-count
last
event-count
DETAILED STEPS
| Command or Action | Purpose | |
|---|---|---|
| Step 1 | show logging events buffer first
event-count
Example:
RP/0/0/CPU0:router# show logging events buffer first 15
|
(Optional) Displays logging events beginning with the first event in the logging events buffer. |
| Step 2 | show logging events buffer last
event-count
Example:
RP/0/0/CPU0:router# show logging events buffer last 20
|
(Optional) Displays logging events beginning with the last event in the logging events buffer. |
| Step 3 | show logging events buffer first
event-count
last
event-count
Example:
RP/0/0/CPU0:router# show logging events buffer first 20 last 20
|
(Optional) Displays the first and last events in the logging events buffer. |
Displaying Alarms by Location
This task explains how to display alarms by location.
Note | The commands can be entered in any order. |
1.
show logging events buffer location
node-id
2.
show logging events buffer
location
node-id
event-hi-limit
event-id
event-lo-limit
event-id
DETAILED STEPS
| Command or Action | Purpose | |
|---|---|---|
| Step 1 | show logging events buffer location
node-id
Example:
RP/0/0/CPU0:router# show logging events buffer 0/2/CPU0
|
(Optional) Isolates the occurrence of the range of event IDs to a particular node. |
| Step 2 | show logging events buffer
location
node-id
event-hi-limit
event-id
event-lo-limit
event-id
Example:
RP/0/0/CPU0:router# show logging events buffer location 0/2/CPU0 event-hi-limit 100 event-lo-limit 1
|
(Optional) Isolates the occurrence of the range of event IDs to a particular node and narrows the range by specifying a high and low limit of event IDs to be displayed. |
Displaying Alarms by Event Record ID
This task explains how to display alarms by event record ID.
Note | The commands can be entered in any order. |
1.
show logging events buffer all-in-buffer
2.
show logging events buffer event-hi-limit
event-id
event-lo-limit
event-id
DETAILED STEPS
| Command or Action | Purpose | |||
|---|---|---|---|---|
| Step 1 | show logging events buffer all-in-buffer
Example:
RP/0/0/CPU0:router# show logging events buffer all-in-buffer
|
(Optional) Displays all messages in the logging events buffer.
| ||
| Step 2 | show logging events buffer event-hi-limit
event-id
event-lo-limit
event-id
Example:
RP/0/0/CPU0:router# show logging events buffer event-hi-limit 100 event-lo-limit 1
|
(Optional) Narrows the range by specifying a high and low limit of event IDs to be displayed. |
Displaying the Logging Correlation Buffer Size, Messages, and Rules
This task explains how to display the logging correlation buffer size, messages in the logging correlation buffer, and correlation rules.
Note | The commands can be entered in any order. |
1.
show logging correlator info
2.
show logging correlator buffer
all-in-buffer
3.
show logging correlator buffer correlationID
correlation-id
4.
show
logging
correlator
buffer
rule-name
correlation-rule
5.
show logging correlator rule all
6.
show logging correlator rule
correlation-rule
7.
show logging correlator ruleset all
8.
show logging correlator ruleset
ruleset-name
DETAILED STEPS
| Command or Action | Purpose | |
|---|---|---|
| Step 1 | show logging correlator info
Example:
RP/0/0/CPU0:router# show logging correlator info
|
(Optional) Displays the size of the logging correlation buffer (in bytes) and the percentage occupied by correlated messages. |
| Step 2 | show logging correlator buffer
all-in-buffer
Example:
RP/0/0/CPU0:router# show logging correlator buffer all-in-buffer
|
(Optional) Displays all messages in the logging correlation buffer. |
| Step 3 | show logging correlator buffer correlationID
correlation-id
Example:
RP/0/0/CPU0:router# show logging correlator buffer correlationID 37
|
(Optional) Displays specific messages matching a particular correlation ID in the correlation buffer. |
| Step 4 | show
logging
correlator
buffer
rule-name
correlation-rule
Example:
RP/0/0/CPU0:router# show logging correlator buffer rule-name rule7
|
(Optional) Displays specific messages matching a particular rule in the correlation buffer. |
| Step 5 | show logging correlator rule all
Example:
RP/0/0/CPU0:router# show logging correlator rule all
|
(Optional) Displays all defined correlation rules. |
| Step 6 | show logging correlator rule
correlation-rule
Example:
RP/0/0/CPU0:router# show logging correlator rule rule7
|
(Optional) Displays the specified correlation rule. |
| Step 7 | show logging correlator ruleset all
Example:
RP/0/0/CPU0:router# show logging correlator ruleset all
|
(Optional) Displays all defined correlation rule sets. |
| Step 8 | show logging correlator ruleset
ruleset-name
Example:
RP/0/0/CPU0:router# show logging correlator ruleset ruleset_static
|
(Optional) Displays the specified correlation rule set. |
Clearing Alarm Event Records and Resetting Bistate Alarms
This task explains how to clear alarm event records and bistate alarms.
Unnecessary and obsolete messages can be cleared to reduce the size of the event logging buffer and make it more searchable, and thus more navigable.
The filtering capabilities available for clearing events in the logging events buffer (with the clear logging events delete command) are also available for displaying events in the logging events buffer (with the show logging events buffer command).
Note | The commands can be entered in any order. |
1.
show logging events buffer all-in-buffer
2.
clear logging events delete
timestamp-lo-limit
hh
:
mm
:
ss [
month
] [
day ]
[
year
]
3.
clear logging events delete event-hi-limit
severity
event-lo-limit
severity
4.
clear logging events delete location
node-id
5.
clear
logging
events
delete
first
event-count
6.
clear
logging
events
delete
last
event-count
7.
clear
logging
events
delete
message
message-code
8.
clear
logging
events
delete
group
message-group
9.
clear logging events reset all-in-buffer
10.
show logging events buffer all-in-buffer
DETAILED STEPS
| Command or Action | Purpose | |
|---|---|---|
| Step 1 | show logging events buffer all-in-buffer
Example:
RP/0/0/CPU0:router# show logging events buffer all-in-buffer
|
It retains the messages before the specified time and displayed the messages after the timestamp. The timestamp-lo-limit specifies the lower time limit. Similarly timestamp-hi-limit specifies the higher time limit of a time window. All events within this time window will be displayed. The default value of the timestamp-lo-limit is the timestamp of the earliest event in the buffer. The timestamp-hi-limit is the timestamp of the latest event in the buffer. |
| Step 2 | clear logging events delete
timestamp-lo-limit
hh
:
mm
:
ss [
month
] [
day ]
[
year
]
Example:
RP/0/0/CPU0:router# clear logging events delete timestamp-lo-limit 20:00:00 april 01 2004
|
It retains the messages before the specified time and deletes the messages after the timestamp. The timestamp-lo-limit specifies the lower time limit. Similarly timestamp-hi-limit specifies the higher time limit of a time window. All events within this time window will be deleted. The default value of the timestamp-lo-limit is the timestamp of the earliest event in the buffer. The timestamp-hi-limit is the timestamp of the latest event in the buffer. |
| Step 3 | clear logging events delete event-hi-limit
severity
event-lo-limit
severity
Example:
RP/0/0/CPU0:router# clear logging events delete event-hi-limit warnings event-lo-limit informational
|
(Optional) Deletes logging events within a range of severity levels for logging alarm messages. |
| Step 4 | clear logging events delete location
node-id
Example:
RP/0/0/CPU0:router# clear logging events delete location 0/2/CPU0
|
(Optional) Deletes logging events from the logging events that have occurred on a particular node. |
| Step 5 | clear
logging
events
delete
first
event-count
Example:
RP/0/0/CPU0:router# clear logging events delete first 10
|
(Optional) Deletes logging events beginning with the first event in the logging events buffer. |
| Step 6 | clear
logging
events
delete
last
event-count
Example:
RP/0/0/CPU0:router# clear logging events delete last 20
|
(Optional) Deletes logging events beginning with the last event in the logging events buffer. |
| Step 7 | clear
logging
events
delete
message
message-code
Example:
RP/0/0/CPU0:router# clear logging events delete message sys
|
(Optional) Deletes logging events that contain the specified message code. |
| Step 8 | clear
logging
events
delete
group
message-group
Example:
RP/0/0/CPU0:router# clear logging events delete group config_i
|
(Optional) Deletes logging events that contain the specified message group. |
| Step 9 | clear logging events reset all-in-buffer
Example:
RP/0/0/CPU0:router# clear logging events reset all-in-buffer
|
(Optional) Clears all bistate alarms in the SET state from the logging events buffer. |
| Step 10 | show logging events buffer all-in-buffer
Example:
RP/0/0/CPU0:router# show logging events buffer all-in-buffer
|
(Optional) Displays all messages in the logging events buffer. |
Defining SNMP Correlation Buffer Size
This task explains how to define correlation buffer size for SNMP traps.
1.
configure
2.
snmp-server
correlator
buffer-size
bytes
3.
commit
DETAILED STEPS
| Command or Action | Purpose | |
|---|---|---|
| Step 1 |
configure
| |
| Step 2 |
snmp-server
correlator
buffer-size
bytes
Example:
RP/0/0/CPU0:router(config)# snmp-server correlator buffer-size 600
|
Defines the buffer size that can store SNMP correlation traps. The default size is 64KB. You can clear the correlation buffers manually or the buffer wraps automatically, wherein the oldest correlations are purged to accommodate the newer correlations. |
| Step 3 |
commit
|
Defining SNMP Rulesets
This task defines a ruleset that allows you to group two or more rules into a group. You can apply the specified group to a set of hosts or all of them.
1.
configure
2.
snmp-server
correlator
ruleset
name
rulename
name
3.
commit
DETAILED STEPS
| Command or Action | Purpose | |
|---|---|---|
| Step 1 |
configure
| |
| Step 2 | snmp-server
correlator
ruleset
name
rulename
name
Example:
RP/0/0/CPU0:router(config)# snmp-server correlator ruleset rule1 rulename rule2 host ipv4 address 1.2.3.4 host ipv4 address 2.3.4.5 port 182
|
Specifies a ruleset that allows you to group two or more rules into a group and apply that group to a set of hosts. |
| Step 3 |
commit
|
Configuring SNMP Correlation Rules
This task explains how to configure SNMP correlation rules.
The purpose of configuring SNMP trap correlation rules is to define the correlation rules or non-correlation rules and apply them to specific trap destinations.
1.
configure
2.
snmp-server
correlator
rule
rule_name
{
nonrootcause
trap
trap_oid
varbind
vbind_OID
{
index
|
value
}
regex
line
|
rootcause
trap
trap_oid
varbind
vbind_OID
{
index
|
value
}
regex
line |
timeout }
3.
commit
DETAILED STEPS
| Command or Action | Purpose | |||||
|---|---|---|---|---|---|---|
| Step 1 |
configure
| |||||
| Step 2 |
snmp-server
correlator
rule
rule_name
{
nonrootcause
trap
trap_oid
varbind
vbind_OID
{
index
|
value
}
regex
line
|
rootcause
trap
trap_oid
varbind
vbind_OID
{
index
|
value
}
regex
line |
timeout }
Example:
RP/0/0/CPU0:router(config)#
snmp-server correlator rule test
  rootcause A
    varbind A1 value regex RA1
    varbind A2 index regex RA2
  timeout 5000
  nonrootcause
    trap B
      varbind B1 index regex RB1
      varbind B2 value regex RB2
    trap C
      varbind C1 value regex RC1
      varbind C2 value regex RC2
|
Configures a SNMP correlation rule. You can specify the numeric rootcause trap OID or non-rootcause trap matching definitions.
| ||||
| Step 3 |
commit
|
Applying SNMP Correlation Rules
The purpose of this task is to apply the SNMP trap correlation rules to specific trap destinations.
1.
configure
2.
snmp-server
correlator
apply
rule
rule-name
[
all-hosts
|
host
ipv4
address
address
port
3.
commit
DETAILED STEPS
| Command or Action | Purpose | |
|---|---|---|
| Step 1 |
configure
| |
| Step 2 | snmp-server
correlator
apply
rule
rule-name
[
all-hosts
|
host
ipv4
address
address
port
Example:
RP/0/0/CPU0:router# snmp-server correlator apply rule ifupdown host ipv4 address 1.2.3.4 host ipv4 address 2.3.4.5 port 182
|
Applies the SNMP trap correlation rules to specific trap destinations. You have an option of applying the rule to traps destined for all trap hosts, or to a specific subset by specifying individual IP addresses and optional ports. |
| Step 3 |
commit
|
Applying SNMP Correlation Ruleset
The purpose of this task is to apply the set of two SNMP trap correlation rules or more rules as a group to specific trap destinations.
1.
configure
2.
snmp-server
correlator
apply
ruleset
ruleset-name
[
all-hosts
|
host
ipv4
address
address
port
3.
commit
DETAILED STEPS
| Command or Action | Purpose | |
|---|---|---|
| Step 1 |
configure
| |
| Step 2 | snmp-server
correlator
apply
ruleset
ruleset-name
[
all-hosts
|
host
ipv4
address
address
port
Example:
RP/0/0/CPU0:router# snmp-server correlator apply ruleset ruleset_1 host ipv4 address 1.2.3.4 host ipv4 address 2.3.4.5 port 182
|
Applies the SNMP trap correlation ruleset to specific trap destinations. You have an option of applying the set of two or more SNMP trap correlation rules to traps destined for all trap hosts, or to a specific subset by specifying individual IP addresses and optional ports. |
| Step 3 |
commit
|
Asynchronous Syslog Communication
The asynchronous syslog communication feature enables proper ordering of messages testing on each node (LC, RP), non dropping of messages generated from multiple clients on each node (LC, RP) and checking performance, scalability and latency by sending log messages at incremental rates.
This feature enables the following:
Proper ordering of messages testing on MC min 4+1.
Non dropping of messages generated from multiple clients on MC min 4+1.
Syslogd_helper message handling capacity - flood lots of syslog messages using test client (logger), verify if no syslog message is lost ( specified rate as per new design).
1200/1500 msgs/sec from every node - restart restart/crash syslogd_helper on LCs and RP/correlatord and syslogd on RP.
Configure the routing protocol ospf. Configure 5k neighbors using sub interfaces. Perform interface flapping to generate log messages and check syslogd_helper performance.
Enable debug for few heavy processes - sysdb/gsp
Configuration Examples for Alarm Management and Logging Correlation
This section provides these configuration examples:
- Increasing the Severity Level for Alarm Filtering to Display Fewer Events and Modifying the Alarm Buffer Size and Capacity Threshold: Example
- Configuring a Nonstateful Correlation Rule to Permanently Suppress Node Status Messages: Example
- Configuring a Stateful Correlation Rule for LINK UPDOWN and SONET ALARM Alarms: Example
- Enabling Alarm Source Location Display Field for Bistate Alarms: Example
Increasing the Severity Level for Alarm Filtering to Display Fewer Events and Modifying the Alarm Buffer Size and Capacity Threshold: Example
This configuration example shows how to set the capacity threshold to 90 percent, to reduce the size of the logging events buffer to 10,000 bytes from the default, and to increase the severity level to errors:
!
logging events threshold 90
logging events buffer-size 10000
logging events level errors
!
Increasing the severity level to errors reduces the number of alarms that are displayed in the logging events buffer, because only alarms with a severity of errors or higher are displayed. Increasing the threshold capacity to 90 percent reduces the time interval between the threshold crossing and wraparound events; the logging events buffer thus does not generate a threshold-crossing alarm until it reaches 90 percent capacity. Reducing the size of the logging events buffer to 10,000 bytes decreases the number of alarms that are displayed in the logging events buffer and reduces the memory requirements for the component.
Configuring a Nonstateful Correlation Rule to Permanently Suppress Node Status Messages: Example
This example shows how to configure a nonstateful correlation rule to permanently suppress node status messages:
logging correlator rule node_status type nonstateful
timeout 4000
  rootcause PLATFORM INVMGR NODE_STATE_CHANGE
  nonrootcause
    alarm PLATFORM SYSLDR LC_ENABLED
    alarm PLATFORM ALPHA_DISPLAY CHANGE
  !
!
logging correlator apply rule node_status

  all-of-router
!
In this example, three similar messages are identified as forwarded to the syslog process simultaneously after a card boots:
PLATFORM-INVMGR-6-NODE_STATE_CHANGE : Node: 0/1/CPU0, state: IOS XR RUN
PLATFORM-SYSLDR-5-LC_ENABLED : LC in slot 1 is now running IOX
PLATFORM-ALPHA_DISPLAY-6-CHANGE : Alpha display on node 0/1/CPU0 changed to IOX RUN in state default
These messages are similar. To see only one message appear in the logs, one of the messages is designated as the root cause message (the one that appears in the logs), and the other messages are considered non-root-cause messages.
The root-cause message is typically the one that arrives earliest, but that is not a requirement.
logging correlator rule node_status type nonstateful
  timeout 4000
  rootcause PLATFORM INVMGR NODE_STATE_CHANGE
  nonrootcause
    alarm PLATFORM SYSLDR LC_ENABLED
    alarm PLATFORM ALPHA_DISPLAY CHANGE
  !
!
In this example, the correlation rule named node_status is configured to correlate the PLATFORM INVMGR NODE_STATE_CHANGE alarm (the root-cause message) with the PLATFORM SYSLDR LC_ENABLED and PLATFORM ALPHA_DISPLAY CHANGE alarms. The updown correlation rule is applied to the entire router.
logging correlator apply rule node_status
  all-of-router
!
After a card boots and sends these messages:
PLATFORM-INVMGR-6-NODE_STATE_CHANGE : Node: 0/1/CPU0, state: IOS XR RUN
PLATFORM-SYSLDR-5-LC_ENABLED : LC in slot 1 is now running IOX
PLATFORM-ALPHA_DISPLAY-6-CHANGE : Alpha display on node 0/1/CPU0 changed to IOX RUN in state default
the correlator forwards the PLATFORM-INVMGR-6-NODE_STATE_CHANGE message to the syslog process, while the remaining two messages are held in the logging correlator buffer.
In this example, the show sample output from the show logging events buffer all-in-buffer command displays the alarms stored in the logging events buffer after the 4-second time period expires for the node_status correlation rule:
RP/0/0/CPU0:router# show logging events buffer all-in-buffer

#ID :C_id:Source :Time :%CATEGORY-GROUP-SEVERITY-MESSAGECODE: Text

#76 :12  :RP/0/0/CPU0:Aug  2 22:32:43 : invmgr[194]:

%PLATFORM-INVMGR-6-NODE_STATE_CHANGE : Node: 0/1/CPU0, state: IOS XR RUN
The show logging correlator buffer correlation ID command generates the following output after the one minute interval expires. The output displays the alarms assigned correlation ID 12 in the logging correlator buffer.
RP/0/0/CPU0:router# show logging correlator buffer correlationID 46

#C_id.id:Rule Name:Source :Time : Text

#12.1 :nodestatus:RP/0/0/CPU0:Aug  2 22:32:43 : invmgr[194]: %PLATFORM-INVMGR-6-NODE_STATE_CHANGE : Node: 0/1/CPU0, state: IOS XR RUN
#12.2 :nodestatus:RP/0/0/CPU0:Aug  2 22:32:43 : sysldr[336]: %PLATFORM-SYSLDR-5-LC_ENABLED : LC in slot 1 is now running IOX
#12.3 :nodestatus:RP/0/0/CPU0:Aug  2 22:32:44 : alphadisplay[102]: %PLATFORM-ALPHA_DISPLAY-6-CHANGE : Alpha display on node 0/1/CPU0 changed to IOX RUN  in state default
Because this rule was defined as nonstateful, these messages are held in the buffer indefinitely.
Configuring a Stateful Correlation Rule for LINK UPDOWN and SONET ALARM Alarms: Example
This example shows how to configure a correlation rule for the LINK UPDOWN and SONET ALARM messages:
!
logging correlator rule updown type stateful
  timeout 10000
  rootcause PKT_INFRA LINK UPDOWN
  nonrootcause
    alarm L2 SONET ALARM
  !
!
logging correlator apply rule updown
  all-of-router
!
In this example, suppose that two routers are connected using Packet-over-SONET (POS) interface 0/7/0/0. When the correlator receives a root-cause message, the correlator sends it directly to the syslog process. Subsequent PKT_INFRA-LINK- UPDOWN or L2-SONET-ALARM messages matching the rule are considered leaf messages and are stored in the logging correlator buffer. If, for any reason, a leaf message (such as the L2-SONET-ALARM alarm in this example) is received first, the correlator does not send it to the logging events buffer immediately; the correlator, instead, waits until the timeout interval expires. After the timeout, if the root message is never received, all messages in the logging correlator buffer received during the timeout interval are forwarded to the syslog process.
In this example, the correlation rule named updown is configured to correlate the PKT_INFRA-LINK-UPDOWN alarm (the root message) and L2-SONET-ALARM alarms (leaf messages associated with PKT_INFRA-LINK-UPDOWN alarms).
logging correlator rule updown type stateful
  timeout 10000
  rootcause PKT_INFRA LINK UPDOWN
  nonrootcause
    alarm L2 SONET ALARM
In this example, the updown correlation rule is applied to the entire router:
logging correlator apply rule updown
  all-of-router
Suppose that a physical layer interface module (PLIM) card is removed from slot 7 on the adjacent remote router, the PLIM slot in the remote router chassis in which the port for POS interface 0/7/0/0 resides. This action brings down the link for POS interface 0/7/0/0. When the link goes down, PKT_INFRA-LINK-UPDOWN and L2- SONET-ALARM messages are generated, which indicates that the POS interface link is down. The first PKT_INFRA-LINK-UPDOWN message is forwarded to the syslog process. Subsequent PKT_INFRA- LINK-UPDOWN and L2-SONET-ALARM messages, which are set as leaf alarms, remain in the logging correlator buffer and are not forwarded to the syslog process.
This example shows sample output from the show logging events buffer all-in-buffer command. The output displays the alarms stored in the logging events buffer after the one minute time period expires for the updown correlation rule configured:
RP/0/0/CPU0:router# show logging events buffer all-in-buffer

#ID :C_id:Source :Time :%CATEGORY-GROUP-SEVERITY-MESSAGECODE: Text

#144 :46 :LC/0/7/CPU0:Jan 30 16:35:39 2004:ifmgr[130]: %PKT_INFRA-LINK-3-UPDOWN :

Interface POS0/7/0/0, changed state to Down
Note | Only the first LINK UPDOWN root message is forwarded to the syslog process during the timeout interval. |
The following example shows output from the show logging correlator buffer correlationID command generated after the one-minute interval expires. The output displays the alarms assigned correlation ID 46 in the logging correlator buffer. In the example, the PKT_INFRA-LINK-UPDOWN root-cause message and L2-SONET-ALARM leaf messages generated during the timeout interval assigned correlation ID 46 are displayed:
RP/0/0/CPU0:router# show logging correlator buffer correlationID 46

#C_id.id:Rule Name:Source :Time : Text

#46.1 :updown :LC/0/7/CPU0:Jan 30 16:35:39 2004:ifmgr[130]: %PKT_INFRA-LINK-3-UPDOWN :

Interface POS0/7/0/0, changed state to Down

#46.2 :updown :LC/0/7/CPU0:Jan 30 16:35:41 2004:DI_Partner[50]: %L2-SONET-4-ALARM :

SONET0_7_0_0: SLOS
Note | The subsequent PKT_INFRA-LINK-UPDOWN and L2-SONET-ALARM leaf messages generated during the timeout interval remain in the logging correlator buffer because they are leaf messages. |
Suppose then that the PLIM card is reinserted into slot 7 on the adjacent remote router. This action brings the link for POS interface 0/7/0/0 back up. When the POS interface comes back up, the PKT_INFRA-LINK-UPDOWN root alarm is cleared. Because this is a stateful rule, it triggers forwarding of the stored non-root-cause alarms for this correlation (that is, the L2-SONET-ALARM). If the SONET protocol also comes back up, as a result, then the L2-SONET-ALARM also clears.
This example shows output from the show logging correlator buffer correlationID command. The output displays the alarms assigned to correlation IDs 46 and 47, the correlation IDs associated with the PKT_INFRA-LINK-UPDOWN and L2-SONET-ALARM root-cause messages:
RP/0/0/CPU0:router# show logging correlator buffer correlationID 46

NO records matching query found
Enabling Alarm Source Location Display Field for Bistate Alarms: Example
This example shows show logging output for bistate alarms before and after enabling the alarm source location display field:
RP/0/0/CPU0:router show logging | inc Interface

Wed Aug 13 01:30:58.461 UTC
LC/0/2/CPU0:Aug 12 01:20:54.073 : ifmgr[159]: %PKT_INFRA-LINK-5-CHANGED : Interface GigabitEthernet0/2/0/0, changed state to Administratively Down
LC/0/2/CPU0:Aug 12 01:20:59.450 : ifmgr[159]: %PKT_INFRA-LINK-3-UPDOWN : Interface GigabitEthernet0/2/0/0, changed state to Down
LC/0/2/CPU0:Aug 12 01:20:59.451 : ifmgr[159]: %PKT_INFRA-LINEPROTO-5-UPDOWN : Line protocol on Interface GigabitEthernet0/2/0/0, changed state to Down
RP/0/5/CPU0:Aug 12 01:22:11.496 : ifmgr[202]: %PKT_INFRA-LINK-5-CHANGED : Interface MgmtEth0/5/CPU0/0, changed state to Administratively Down
RP/0/5/CPU0:Aug 12 01:23:23.842 : ifmgr[202]: %PKT_INFRA-LINK-3-UPDOWN : Interface MgmtEth0/5/CPU0/0, changed state to Down
RP/0/5/CPU0:Aug 12 01:23:23.843 : ifmgr[202]: %PKT_INFRA-LINEPROTO-5-UPDOWN : Line protocol on Interface MgmtEth0/5/CPU0/0, changed state to Down
RP/0/5/CPU0:Aug 12 01:23:23.850 : ifmgr[202]: %PKT_INFRA-LINK-3-UPDOWN : Interface MgmtEth0/5/CPU0/0, changed state to Up
RP/0/5/CPU0:Aug 12 01:23:23.856 : ifmgr[202]: %PKT_INFRA-LINEPROTO-5-UPDOWN : Line protocol on Interface MgmtEth0/5/CPU0/0, changed state to Up
RP/0/0/CPU0:router# configure
Wed Aug 13 01:31:32.517 UTC
RP/0/0/CPU0:router(config)# logging events display-location
RP/0/0/CPU0:router(config)# commit
RP/0/0/CPU0:router(config)# exit
RP/0/0/CPU0:router# show logging | inc Interface

Wed Aug 13 01:31:48.141 UTC
LC/0/2/CPU0:Aug 12 01:20:54.073 : ifmgr[159]: %PKT_INFRA-LINK-5-CHANGED : Interface GigabitEthernet0/2/0/0, changed state to Administratively Down
LC/0/2/CPU0:Aug 12 01:20:59.450 : ifmgr[159]: %PKT_INFRA-LINK-3-UPDOWN : interface GigabitEthernet0/2/0/0: Interface GigabitEthernet0/2/0/0, changed state to Down
LC/0/2/CPU0:Aug 12 01:20:59.451 : ifmgr[159]: %PKT_INFRA-LINEPROTO-5-UPDOWN : interface GigabitEthernet0/2/0/0: Line protocol on Interface GigabitEthernet0/2/0/0, changed state to Down
RP/0/5/CPU0:Aug 12 01:22:11.496 : ifmgr[202]: %PKT_INFRA-LINK-5-CHANGED : Interface MgmtEth0/5/CPU0/0, changed state to Administratively Down
RP/0/5/CPU0:Aug 12 01:23:23.842 : ifmgr[202]: %PKT_INFRA-LINK-3-UPDOWN : interface MgmtEth0/5/CPU0/0: Interface MgmtEth0/5/CPU0/0, changed state to Down
RP/0/5/CPU0:Aug 12 01:23:23.843 : ifmgr[202]: %PKT_INFRA-LINEPROTO-5-UPDOWN : interface MgmtEth0/5/CPU0/0: Line protocol on Interface MgmtEth0/5/CPU0/0, changed state to Down
RP/0/5/CPU0:Aug 12 01:23:23.850 : ifmgr[202]: %PKT_INFRA-LINK-3-UPDOWN : interface MgmtEth0/5/CPU0/0: Interface MgmtEth0/5/CPU0/0, changed state to Up
RP/0/5/CPU0:Aug 12 01:23:23.856 : ifmgr[202]: %PKT_INFRA-LINEPROTO-5-UPDOWN : interface MgmtEth0/5/CPU0/0: Line protocol on Interface MgmtEth0/5/CPU0/0, changed state to Up
Additional References
The following sections provide references related to implementing and monitoring alarm logs and logging correlation on the Cisco IOS XR Software.
Related Documents
|
Related Topic |
Document Title |
|---|---|
|
Alarm and logging correlation commands |
Alarm Management and Logging Correlation Commands module in the Cisco IOS XR System Monitoring Command Reference for the Cisco XR 12000 Series Router |
|
Logging services commands |
Logging Services Commands module in the Cisco IOS XR System Monitoring Command Reference for the Cisco XR 12000 Series Router |
|
Onboard Failure Logging (OBFL) configuration tasks |
Implementing Logging Services module in the Cisco IOS XR System Monitoring Command Reference for the Cisco XR 12000 Series Router |
|
Onboard Failure Logging (OBFL) commands |
Onboard Failure Logging Commands module in the Cisco IOS XR System Monitoring Command Reference for the Cisco XR 12000 Series Router |
|
Cisco IOS XR software XML API material |
Cisco IOS XR XML API Guide for the Cisco XR 12000 Series Router |
|
Cisco IOS XR software getting started material |
Cisco IOS XR Getting Started Guide for the Cisco XR 12000 Series Router |
|
Information about user groups and task IDs |
Configuring AAA Services module in the Cisco IOS XR System Security Configuration Guide for the Cisco XR 12000 Series Router |
Standards
|
Standards |
Title |
|---|---|
|
No new or modified standards are supported by this feature, and support for existing standards has not been modified by this feature. |
— |
MIBs
|
MIBs |
MIBs Link |
|---|---|
| — |
To locate and download MIBs using Cisco IOS XR software, use the Cisco MIB Locator found at the following URL and choose a platform under the Cisco Access Products menu: http://cisco.com/public/sw-center/netmgmt/cmtk/mibs.shtml |
RFCs
|
RFCs |
Title |
|---|---|
|
No new or modified RFCs are supported by this feature, and support for existing RFCs has not been modified by this feature. |
— |
Technical Assistance
|
Description |
Link |
|---|---|
|
The Cisco Technical Support website contains thousands of pages of searchable technical content, including links to products, technologies, solutions, technical tips, and tools. Registered Cisco.com users can log in from this page to access even more content. |
http://www.cisco.com/cisco/web/support/index.html |
 Feedback