- Read Me First
- What's New in Cisco IOS XE (Catalyst SD-WAN)
- Policy Overview
- Centralized Policy
- Localized Policy
- Default AAR and QoS Policies
- Device Access Policy
- Cisco Catalyst SD-WAN Application Intelligence Engine Flow
- Custom Applications
- Application-Aware Routing
- Traffic Flow Monitoring
- Forward Error Correction
- Packet Duplication
- Elephant Flow Throttling
- Service Chaining
- Cisco vEdge Device as a NAT Device
- Lawful Intercept 2.0
- Traffic Flow Monitoring
- Traffic Flow Monitoring
- Information About Traffic Flow Monitoring
- Restrictions for Traffic Flow Monitoring
- Configure Traffic Flow Monitoring
- Configure Cflowd Traffic Flow Monitoring
- Configure Cflowd Traffic Flow Monitoring Using the CLI
- Configuration Examples for Flexible NetFlow Export of BFD Metrics
- Apply and Enable Cflowd Policy
- Cflowd Traffic Flow Monitoring Configuration Examples
- Configure the Maximum FNF Record Rate for Aggregated Data, Using CLI Commands
- Verify Traffic Flow Monitoring
Traffic Flow Monitoring
Information About Traffic Flow Monitoring
The following sections describe traffic flow monitoring.
Traffic Flow Monitoring with Cflowd Overview
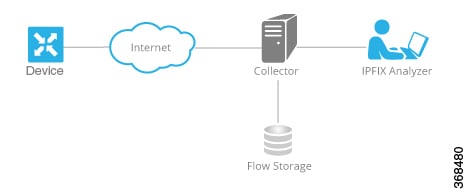
Cflowd is a flow analysis tool, used for analyzing Flexible NetFlow (FNF) traffic data. It monitors traffic flowing through Cisco vEdge devices in the overlay network and exports flow information to a collector, where it can be processed by an IP Flow Information Export (IPFIX) analyzer. For a traffic flow, Cflowd periodically sends template reports to flow collector. These reports contain information about the flows and the data is extracted from the payload of these reports.
You can create a Cflowd template that defines the location of Cflowd collectors, how often sets of sampled flows are sent to the collectors, and how often the template is sent to the collectors (on Cisco SD-WAN Controllers and on Cisco SD-WAN Manager). You can configure a maximum of four Cflowd collectors per Cisco vEdge device. To have a Cflowd template take effect, apply it with the appropriate data policy.
You must configure at least one Cflowd template, but it need not contain any parameters. With no parameters, the data flow cache on the nodes is managed using default settings, and no flow export occurs.
Cflowd traffic flow monitoring is equivalent to FNF.
The Cflowd software implements Cflowd version 10, as specified in RFC 7011 and RFC 7012. Cflowd version 10 is also called the IP Flow Information Export (IPFIX) protocol.
Cflowd performs 1:1 sampling. Information about all flows is aggregated in the Cflowd records; flows are not sampled. Cisco vEdge devices do not cache any of the records that are exported to a collector.
 Note |
From Cisco IOS XE Catalyst SD-WAN Release 17.9.1a, netFlow on Secure Internet Gateway (SIG) tunnels is supported on Cisco vEdge devices. However, netflow is not supported on regular IPSec tunnel. |
Cflowd and SNMP Comparison
Cflowd monitors service side traffic. Cflowd mainly monitors traffic from LAN to WAN, WAN to LAN, LAN to LAN and DIA. If you use Cflowd and SNMP to monitor traffic of LAN interface (input or output), then packets and bytes should be similar. The difference of bytes in SNMP starts from L2 header, but Cflowd starts from L3 header. However, if we use Cflowd and SNMP to monitor traffic of WAN interface (input or output), then packets or bytes are unlikely to be the same. All the traffic of WAN interfaces is not service side traffic. For example, Cflowd does not monitor BFD traffic, but SNMP does. The packets or bytes of Cflowd and SNMP traffic are not the same.
Components of Cflowd
In the overlay network, you configure cflowd using a centralized data policy. As part of the policy, you specify the location of the collector.
By default, flow information is sent to the collector every 60 seconds. You can modify this and other timers related to how often cflowd templates are refreshed and how often a traffic flow times out.
You can configure many cflowd policies, but in one single cflowd policy, you can configure at most four external collectors. When you configure a new data policy that changes which flows are sampled, the software allows the old flows to expire gracefully rather than deleting them all at once.
The Cisco vEdge device exports template records and data records to a collector. The template record is used by the collector to parse the data record information that is exported to it.
Note |
Option templates are not supported on Cisco vEdge devices. |
The source IP address for the packet containing the IPFIX records is selected from the collector that is closer to the interfaces in the VPN. The flow records are exported through TCP or UDP connections for Cisco devices. Anonymization of records and TLS encryption are not performed, because it is assumed that the collector and the IPFIX analyzer are both located within the data center, traffic traveling within the data center is assumed to be safe.
Cflowd can track GRE, ICMP, IPsec, SCTP, TCP, and UDP flows.
IPFIX Information Elements for Cisco vEdge Devices
The Cisco Catalyst SD-WAN cflowd software exports the following IPFIX information elements to the cflowd collector. These information elements are a subset of those defined in RFC 7012 and maintained by IANA. The elements are exported in the order listed. You cannot modify the information elements that are exported, nor can you change the order in which they appear.
|
Information Element |
Element ID |
Description |
Data Type |
Data Type Semantics |
Units or Range |
|---|---|---|---|---|---|
|
ipClassOfService |
5 |
Value of type of service (TOS) field in the IPv4 packet header. |
unsigned8 (1 byte) |
identifier |
— |
|
ipNextHopIPv4Address |
15 |
IPv4 address of the next IPv4 hop. |
IPv4Address (4 bytes) |
default |
— |
|
minimumIpTotalLength |
25 |
Length of the smallest packet observed for this flow. The packet length includes the IP headers and the IP payload. |
unsigned64 (8 bytes) |
— |
Octets |
|
maximumIpTotalLength |
26 |
Length of the largest packet observed for this flow. The packet length includes the IP headers and the IP payload. |
unsigned64 (8 bytes) |
— |
Octets |
|
icmpTypeCodeIPv4 |
32 |
Type and Code of the IPv4 ICMP message. The combination of both values is reported as (ICMP type * 256) + ICMP code. |
unsigned16 (2 bytes) |
identifier |
— |
|
octetTotalCount |
85 |
Total number of octets in incoming packets for this flow at the observation point since initialization or re-initialization of the metering process for the observation point. The count includes the IP headers and the IP payload. |
unsigned64 (8 bytes) |
totalCounter |
Octets |
|
packetTotalCount |
86 |
Total number of incoming packets for this flow at the observation point since initialization or re-initialization of the metering process for the observation point. |
unsigned64 (8 bytes) |
totalCounter |
Packets |
|
flowStartSeconds |
150 |
Absolute timestamp of the first packet of this flow. |
dateTime-Seconds (4 bytes) |
— |
— |
|
flowEndSeconds |
151 |
Absolute timestamp of the last packet of this flow. |
dateTime-Seconds (4 bytes) |
— |
— |
|
ipPrecedence |
196 |
Value of IP precedence. This value is encoded in the first 3 bits of the IPv4 TOS field. |
unsigned8 (1 byte) |
flags |
0 through 7 |
|
paddingOctets |
210 |
Value of this Information Element is always a sequence of 0x00 values. |
octetArray |
default |
— |
Information About Configuring a Maximum FNF Record Rate for Aggregated Data
Minimum supported releases: Cisco IOS XE Catalyst SD-WAN Release 17.14.1a, Cisco Catalyst SD-WAN Control Components Release 20.14.1
Raw and Aggregated Traffic Flow Data
When traffic flow visibility is enabled (see Configure Global Flow Visibility), devices in the network send raw and aggregated traffic flow data to Cisco SD-WAN Manager.
To aggregate flow data, routers use 4-tuples of flow data (containing VPN ID, application name, ingress interface of the flow, and egress interface of the flow) as a key for consolidating the raw data of multiple flows. The router consolidates each flow for which the 4-tuple is identical into a single aggregated FNF record.
Cisco SD-WAN Manager uses the aggregated data to provide a high-level view of network traffic flow information. The aggregated data shows the network applications that are producing traffic, but is less granular than the full traffic flow data. It does not provide source and destination addresses, or source and destination ports for traffic flows.
For a detailed view of traffic flows, use functions such as On Demand Troubleshooting. For information about On Demand Troubleshooting, see On-Demand Troubleshooting.
Maximum FNF Record Rate
You can configure a maximum rate (records per minute) of aggregated traffic data FNF records that a device can send to reduce the performance demands (CPU and memory) on the device. This may be helpful when there is a large number of applications producing network traffic. For information about configuring this, see Configure the Maximum FNF Record Rate for Aggregated Data, Using CLI Commands.
Restrictions for Traffic Flow Monitoring
The following sections describe notes, limitations, and restrictions related to traffic flow monitoring.
Restrictions for Enabling Collect Loopback in Flow Telemetry When Using Loopbacks as TLOCs
-
Supports configuration only through the Cisco Catalyst SD-WAN Controller CLI or Cisco SD-WAN Manager CLI-template. Feature template is not supported for this release.
-
Collect loopback in FNF VPN0 interfaces is not supported.
-
Collect loopback in the Decidated Internet Acccess (DIA) scenario, is not supported.
-
Multi-tenant scenario is not supported.
-
All IP or IPv6 visibility features are sub-features to flow-visibility and app-visibility. You must enable flow-visibility or app-visibility before enabling the sub-features.
Configure Traffic Flow Monitoring
The following sections provide information about configuring traffic flow monitoring.
Configure Cflowd Traffic Flow Monitoring
This topic provides general procedures for configuring Cflowd traffic flow monitoring. You configure Cflowd traffic flow monitoring using the basic components of centralized data policy. Cflowd template and Cflowd in data policy are independent of each other.
To configure policy for Cflowd traffic flow monitoring, use the Cisco SD-WAN Manager policy configuration wizard. The wizard consists of four sequential screens that guide you through the process of creating and editing policy components:
-
Create Applications or Groups of Interest—Create lists that group together related items and that you call in the match or action components of a policy.
-
Configure Topology—Create the network structure to which the policy applies.
-
Configure Traffic Rules—Create the match and action conditions of a policy.
-
Apply Policies to Sites and VPNs—Associate policy with sites and VPNs in the overlay network.
In the first three policy configuration wizard screens, you are creating policy components or blocks. In the last screen, you are applying policy blocks to sites and VPNs in the overlay network.
For the Cflowd policy to take effect, you must activate the policy.
Step 1: Start the Policy Configuration Wizard
To start the policy configuration wizard:
-
In the Cisco SD-WAN Manager NMS, select the screen. When you first open this screen, the Centralized Policy tab is selected by default.
-
Click Add Policy.
The policy configuration wizard opens, and the Create Applications or Groups of Interest screen is displayed.
Step 2: Create Applications or Groups of Interest
To create lists of applications or groups to use in Cflowd policy:
-
Create new lists as described in the following table:
-
Prefix
-
In the left bar, click Prefix.
-
Click New Prefix List.
-
Enter a name for the list.
-
In the Add Prefix field, enter one or more data prefixes separated by commas.
-
Click Add.
-
-
Site
-
In the left bar, click Site.
-
Click New Site List.
-
Enter a name for the list.
-
In the Add Site field, enter one or more site IDs separated by commas.
-
Click Add.
-
-
VPN
-
In the left bar, click VPN.
-
Click New VPN List.
-
Enter a name for the list.
-
In the Add VPN field, enter one or more VPN IDs separated by commas.
-
Click Add.
-
-
-
Click Next to Configure Topology in the wizard. When you first open this screen, the Topology tab is selected by default.
Step 3: Configure the Network Topology
To configure the network topology:
In the Topology tab, create a network topology as described:
-
Hub and Spoke - Policy for a topology with one or more central hub sites and with spokes connected to a hub
-
In the Add Topology drop-down, select Hub and Spoke.
-
Enter a name for the hub-and-spoke policy.
-
Enter a description for the policy.
-
In the VPN List field, select the VPN list for the policy.
-
In the left pane, click Add Hub and Spoke. A hub-and-spoke policy component containing the text string My Hub-and-Spoke is added in the left pane.
-
Double-click the My Hub-and-Spoke text string, and enter a name for the policy component.
-
In the right pane, add hub sites to the network topology:
-
Click Add Hub Sites.
-
In the Site List field, select a site list for the policy component.
-
Click Add.
-
Repeat Steps 7a, 7b, and 7c to add more hub sites to the policy component.
-
-
In the right pane, add spoke sites to the network topology:
-
Click Add Spoke Sites.
-
In the Site List field, select a site list for the policy component.
-
Click Add.
-
Repeat Steps 8a, 8b, and 8c to add more spoke sites to the policy component.
-
-
Repeat Steps 5 through 8 to add more components to the hub-and-spoke policy.
-
Click Save Hub and Spoke Policy.
-
-
Mesh - Partial-mesh or full-mesh region
-
In the Add Topology drop-down, select Mesh.
-
Enter a name for the mesh region policy component.
-
Enter a description for the mesh region policy component.
-
In the VPN List field, select the VPN list for the policy.
-
Click New Mesh Region.
-
In the Mesh Region Name field, enter a name for the individual mesh region.
-
In the Site List field, select one or more sites to include in the mesh region.
-
Repeat Steps 5 through 7 to add more mesh regions to the policy.
-
Click Save Mesh Region.
-
To use an existing topology:
-
In the Add Topology drop-down, click Import Existing Topology. The Import Existing Topology popup displays.
-
Select the type of topology.
-
In the Policy drop-down, select the name of the topology.
-
Click Import.
Click Next to move to Configure Traffic Rules in the wizard. When you first open this screen, the Application-Aware Routing tab is selected by default.
Step 4: Configure Traffic Rules
To configure traffic rules for Cflowd policy:
-
In the Application-Aware Routing bar, select the Cflowd tab.
-
Click the Add Policy drop-down.
-
Select Create New. The Add Cflowd Policy popup opens.
-
Configure timer parameters for the Cflowd template:
-
In the Active Flow Timeout field, specify how long to collect a set of flows on which traffic is actively flowing, a value from 30 through 3,600 seconds. The default is 600 seconds (10 minutes).
-
In the Inactive Flow Timeout field, specify how long to wait to send a set of sampled flows to a collector for a flow on which no traffic is flowing, a value from 1 through 3,600 seconds. The default is 60 seconds (1 minute).
-
In the Flow Refresh Interval field, specify how often to send the Cflowd template record fields to the collector, a value from 60 through 86,400 seconds (1 minute through 1 day). The default is 90 seconds.
-
In the Sampling Interval field, specify how many packets to wait before creating a new flow, a value from 1 through 65,536 seconds. While you can configure any integer value, the software rounds the value down to the nearest power of 2.
-
-
Click Add New Collector, and configure the location of the Cflowd collector. You can configure up to four collectors.
-
In the VPN ID field, enter the number of the VPN in which the collector is located.
-
In the IP Address field, enter the IP address of the collector.
-
In the Port Number field, enter the collector port number. The default port is 4739.
-
In the Transport Protocol drop-down, select the transport type to use to reach the collector, either TCP or UDP.
-
In the Source Interface field, enter the name of the interface to use to send flows to the collector. It can be either a Gigabit Ethernet, a 10-Gigabit Ethernet interface (ge), or a loopback interface (loopback number).
-
-
Click Save Cflowd Policy.
-
Click Next to move to Apply Policies to Sites and VPNs in the wizard.
Step 5: Apply Policies to Sites and VPNs
To apply a policy block to sites and VPNs in the overlay network:
-
If you are already in the policy configuration wizard, skip to Step 6. Otherwise, in the Cisco SD-WAN Manager NMS, select the screen. When you first open this screen, the Centralized Policy tab is selected by default.
-
Click Add Policy. The policy configuration wizard opens, and the Create Applications or Groups of Interest screen is displayed
-
Click Next. The Network Topology screen opens, and in the Topology bar, the Topology tab is selected by default.
-
Click Next. The Configure Traffic Rules screen opens, and in the Application-Aware Routing bar, the Application-Aware Routing tab is selected by default.
-
Click Next. The Apply Policies to Sites and VPNs screen opens.
-
In the Policy Name field, enter a name for the policy. This field is mandatory and can contain only uppercase and lowercase letters, the digits 0 through 9, hyphens (–), and underscores (_). It cannot contain spaces or any other characters.
-
In the Policy Description field, enter a description of the policy. It can contain up to 2048 characters. This field is mandatory, and it can contain any characters and spaces.
-
From the Topology bar, select the type of policy block. The table then lists policies that you have created for that type of policy block.
-
Click Add New Site List. Select one or more site lists, and click Add.
-
Click Preview to view the configured policy. The policy is displayed in CLI format.
-
Click Save Policy. The screen opens, and the policies table includes the newly created policy.
Step 6: Activate a Centralized Policy
Activating a Cflowd policy sends that policy to all connected Cisco Catalyst SD-WAN Controllers. To activate a Cflowd policy:
-
In the Cisco SD-WAN Manager NMS, select the screen. When you first open this screen, the Centralized Policy tab is selected by default.
-
Select a policy.
-
Click the More Actions icon to the right of the row, and click Activate. The Activate Policy popup opens. It lists the IP addresses of the reachable Cisco Catalyst SD-WAN Controllers to which the policy is to be applied.
-
Click Activate.
Configure Cflowd Traffic Flow Monitoring Using the CLI
Following are the high-level steps for configuring a Cflowd centralized data policy to perform traffic monitoring and to export traffic flows to a collector:
-
Create a list of overlay network sites to which the Cflowd centralized data policy is to be applied (in the apply-policy command).
vSmart(config)# policy vSmart(config-policy)# lists site-list list-name vSmart(config-lists-list-name)# site-id site-idThe list can contain as many site IDs as necessary. Include one site-id command for each site ID. For contiguous site IDs, you can specify a range of numbers separated with a dash (–). Create additional site lists, as needed.
-
Create a list of VPN for which the Cflowd centralized data policy is to be configured (in the policy data-policy command). vSmart(config)# policy lists vSmart(config-lists)# vpn-list list-name vSmart(config-lists-list-name)# vpn vpn-id -
Create lists of IP prefixes, as needed. vSmart(config)# policy lists vSmart(config-lists)# prefix-list list-name vSmart(config-lists-list-name)# ip-prefix prefix/length -
Configure a Cflowd template, and optionally, configure template parameters, including the location of the Cflowd collector, the flow export timers, and the flow sampling interval. vSmart(config)# policy cflowd-template template-name vSmart(config-cflowd-template-template-name)# collector vpn vpn-id address ip-address port port-number transport-type (transport_tcp | transport_udp) source-interface interface-name vSmart(config-cflowd-template-template-name)# flow-active-timeout seconds vSmart(config-cflowd-template-template-name)# flow-inactive-timeout seconds vSmart(config-cflowd-template-template-name)# protocol ipv4/ipv6/both vSmart(config-cflowd-template-template-name)# template-refresh secondsYou must configure a Cflowd template, but it need not contain any parameters. With no parameters, the data flow cache on router is managed using default settings, and no flow export occurs. You can configure one Cflowd template per router, and it can export to a maximum of four collectors.
By default, an actively flowing data set is exported to the collector every 60 seconds (1 minute), a data set for a flow on which no traffic is flowing is sent every 10 seconds, and the Cflowd template record fields (the three timer values) are sent to the collector every 600 seconds.
Also by default, a new flow is created immediately after an existing flow has ended. If you modify the configuration of the template record fields, the changes take effect only on flows that are created after the configuration change has been propagated to the router. Because an existing flow continues indefinitely, to have configuration changes take effect, clear the flow with the clear app cflowd flows command.
Note
On Cisco IOS XE Catalyst SD-WAN devices, a flow-active-timeout is fixed as 60 seconds. If a flow-inactive-timeout is fixed as 10 seconds. The flow-active-timeout and flow-inactive-timeout value that is configured on Cisco SD-WAN Controller or Cisco SD-WAN Manager do not take effect on Cisco IOS XE Catalyst SD-WAN devices.
-
If you configure a logging action, configure how often to log packets to the syslog files. vEdge(config)# policy log-frequency number -
Create a data policy instance and associate it with a list of VPNs. vSmart(config)# policy data-policy policy-name vSmart(config-data-policy-policy-name)# vpn-list list-name -
Create a sequence to contain a single match–action pair.
The match–action pairs are evaluated in order, by sequence number, starting with the lowest numbered pair and ending when the route matches the conditions in one of the pairs. If no match occurs, the default action is taken.vSmart(config-vpn-list-list-name)# sequence number vSmart(config-sequence-number)# -
Define match parameters for the data packets. vSmart(config-sequence-number)# match parameters -
Enable Cflowd action. vSmart(config-sequence-number)# action cflowd -
In the action, count or log data packets. vSmart(config-sequence-number)# action count counter-name vSmart(config-sequence-number)# action log -
Create additional numbered sequences of match–action pairs within the data policy, as needed.
-
If a route does not match any of the conditions in one of the sequences, it is rejected by default. If you want nonmatching prefixes to be accepted, configure the default action for the policy. vSmart(config-policy-name)# default-action accept -
Apply the policy and the Cflowd template to one or more sites in the overlay network. vSmart(config)# apply-policy site-list list-name data-policy policy-name vSmart(config)# apply-policy site-list list-name cflowd-template template-name
Configuration Examples for Flexible NetFlow Export of BFD Metrics
Minimum supported releases: Cisco IOS XE Catalyst SD-WAN Release 17.10.1a and Cisco Catalyst SD-WAN Control Components Release 20.10.1
The following example shows a centralized policy configuration with export of BFD metrics enabled:
Device# show sdwan policy from-vsmart
from-vsmart cflowd-template fnf
 flow-active-timeout    600
 flow-inactive-timeout  60
 template-refresh       600
 flow-sampling-interval 1
 protocol               ipv4
 customized-ipv4-record-fields
  no collect-tos
  no collect-dscp-output
 collector vpn 0 address 10.0.100.1 port 4739 transport transport_udp
  bfd-metrics-export
   export-interval 600
The following example shows FNF BFD telemetry data with average jitter, average latency, and loss metrics:
{ 'Data_Template': 'Data_Flow',
  'ObservationDomainId': 6,
  'Version': 10,
  'arrive_time': 1658807309.2496994,
  'dfs_tfs_length': 200,
  'export_dfs_tfs_templates_list_dict': { 'FlowSequence': 3354,
                                          'Flowset_id': '258',
                                          'Flowset_length': 200,
                                          'Length': 286,
                                          'ObservationDomainId': 6,
                                          'TimeStamp': 1658807269,
                                          'Version': 10,
                                          'flow': [ { 'bfd_avg_jitter': 1000,
                                                      'bfd_avg_latency': 1000,
                                                      'bfd_loss': 15,
                                                      'bfd_pfr_update_ts': 1658806692155,
                                                      'bfd_rx_cnt': 0,
                                                      'bfd_tx_cnt': 0,
                                                      'ipDiffServCodePoint': 48,
                                                      'tloc_table_overlay_session_id': 10},
                                                      …
                                                  ]},
 'flow_length': 4,
  'flow_time': 1658807269,
  'flowset_id': '258',
  'header': { 'FlowSequence': 3354,
              'Length': 286,
              'ObservationDomainId': 6,
              'TimeStamp': 1658807269,
              'Version': 10},
  'host': '10.0.100.15',
  'ipfix_length': 286,
  'packet_number': 2,
  'template_id': '258'}
The following example displays cflowd Forwarding Table Manager (FTM) statistics:
Minimum supported release: Cisco IOS XE Release 17.4.1a
device# show sdwan app-fwd cflowd statistics ftm
      ftm-flow-rate-limit      :      0
      ipfix-data-flow-rate     :      0
      ipfix-data-packet-rate   :      0
      flow-rate-limit-drop     :      0
      app-aggregation-db-cnt   :      0
      app-aggregation-aged-cnt :      0
      app-aggregation-drop-cnt :      0
      app-aggregation-high-watermark :0
====================================================================
      ftm-fw-zone-pair         :      0
      ftm-fw-zone              :      0
      ftm-utd-policy           :      0
      ftm-utd-policy-aged      :      0
      ftm-utd-urlf-url         :      0
      ftm-utd-urlf-url-aged    :      0
      ftm-utd-amp-filename     :      0
      ftm-utd-amp-filename-aged:      0
      ftm-utd-amp-malname      :      0
      ftm-utd-amp-malname-aged :      0
      ftm-c3pl-class           :      0
      ftm-c3pl-policy          :      0
The following example displays cflowd Data Tracking Agent (DTA) statistics:
Minimum supported release: Cisco IOS XE Catalyst SD-WAN Release 17.18.1a
device# show sdwan app-fwd cflowd statistics dta
DTA Common Statistics Summary

dta_flow_rate_limit: 27000
dta_punt_packet_rate_limit: 1928
dta_flow_seq_drop: 0
dta_fnf_cb_cnt: 5405
dta_lowq_active_cnt: 0
ipfix_data_flow_rate: 0
ipfix_data_packet_rate: 0
Apply and Enable Cflowd Policy
For a centralized data policy to take effect, you must apply it to a list of sites in the overlay network:
vSmart(config)# apply-policy site-list list-name data-policy policy-nameTo activate the Cflowd template, associate it with the data policy:
vSmart(config)# apply-policy cflowd-template template-name
For all data-policy policies that you apply with apply-policy commands, the site IDs across all the site lists must be unique. That is, the site lists must not contain overlapping site IDs. An example of overlapping site IDs are those in the two site lists site-list 1 site-id 1-100 and site-list 2 site-id 70-130. Here, sites 70 through 100 are in both lists. If you apply these two site lists to two different data-policy policies, the attempt to commit the configuration on the Cisco Catalyst SD-WAN Controller would fail.
The same type of restriction also applies to the following types of policies:
-
Application-aware routing policy (app-route-policy)
-
Centralized control policy (control-policy)
-
Centralized data policy (data-policy)
You can, however, have overlapping site IDs for site lists that you apply for different types of policy. For example, the sites lists for control-policy and data-policy policies can have overlapping site IDs. So for the two example site lists above, site-list 1 site-id 1-100 and site-list 2 site-id 70-130, you could apply one to a control policy and the other to a data policy.
After you successfully activate the configuration by issuing a commit command, the Cisco Catalyst SD-WAN Controller pushes the data policy to the Cisco vEdge devices located in the specified sites. To view the policy as configured on the Cisco Catalyst SD-WAN Controller, use the show running-config command in the Cisco Catalyst SD-WAN Controller. To view the policy that has been pushed to the device, use the show policy from-vsmart command on the device.
To display the centralized data policy as configured on the Cisco Catalyst SD-WAN Controller, use the show running-config command:
vSmart# show running-config policy
vSmart# show running-config apply-policy
Enable Cflowd Visibility on Cisco vEdge devices
You can enable Cflowd visibility directly on Cisco vEdge devices, without configuring a data policy, so that you can perform traffic-flow monitoring on traffic coming to the router from all VPNs in the LAN. To do this, configure Cflowd visiblity on the device:
Device(config)# policy flow-visibility To monitor the applications, use the show app cflowd flows and show app cflowd statistics commands on the device.
Note |
Do not attach the flow monitor to a certain interface after configuring the flow or app visibility. The policy flow-visibility command applies the global flow monitor. You need not attach the monitor to any interface again manually. |
Cflowd Traffic Flow Monitoring Configuration Examples
This topic shows a complete example of configuring traffic flow monitoring.
Configuration Steps
Enable Cflowd traffic monitoring with a centralized data policy, so all configuration is done on a Cisco Catalyst SD-WAN Controller. The following example procedure monitors all TCP traffic, sending it to a single collector:
-
Create a Cflowd template to define the location of the collector and to modify Cflowd timers. vsmart(config)# policy cflowd-template test-cflowd-template vsmart(config-cflowd-template-test-cflowd-template)# collector vpn 1 address 172.16.155.15 port 13322 transport transport_udp vsmart(config-cflowd-template-test-cflowd-template)# flow-inactive-timeout 60 vsmart(config-cflowd-template-test-cflowd-template)# template-refresh 90 -
Create a list of VPNs whose traffic you want to monitor. vsmart(config)# policy lists vpn-list vpn_1 vpn 1 -
Create a list of sites to apply the data policy to. vsmart(config)# policy lists site-list cflowd-sites site-id 400,500,600 -
Configure the data policy. vsmart(config)# policy data-policy test-cflowd-policy vsmart(config-data-policy-test-cflowd-policy)# vpn-list vpn_1 vsmart(config-vpn-list-vpn_1)# sequence 1 vsmart(config-sequence-1)# match protocol 6 vsmart(config-match)# exit vsmart(config-sequence-1)# action accept cflowd vsmart(config-action)# exit vsmart(config-sequence-1)# exit vsmart(config-vpn-list-vpn_1)# default-action accept -
Apply the policy and the Cflowd template to sites in the overlay network. vsmart(config)# apply-policy site-list cflowd-sites data-policy test-cflowd-policy Device(config-site-list-cflowd-sites)# cflowd-template test-cflowd-template -
Activate the data policy. vsmart(config-site-list-cflowd-sites)# validate Validation complete vsmart(config-site-list-cflowd-sites)# commit Commit complete. vsmart(config-site-list-cflowd-sites)# exit configuration-mode
Example Configuration
Here is a complete example of a Cflowd configuration:
vsmart(config)# show configuration
apply-policy
 site-list cflowd-sites
  data-policy     test-cflowd-policy
  cflowd-template test-cflowd-template
 !
!
policy
 data-policy test-cflowd-policy
  vpn-list vpn_1
   sequence 1
    match
     protocol 6
    !
    action accept
     cflowd
    !
   !
   default-action accept
  !
 !
 cflowd-template test-cflowd-template
  flow-inactive-timeout 60
  template-refresh      90
  collector vpn 1 address 192.168.0.1 protocol ipv4 port 13322 transport transport_udp
 !
 lists
  vpn-list vpn_1
   vpn 1
  !
  site-list cflowd-sites
   site-id 400,500,600
  !
 !
!
Verify Cflowd Configuration
To verify the Cflowd configuration after activating it on the Cisco Catalyst SD-WAN Controller, use the show running-config policy and show running-config apply-policy commands.
Starting from Cisco IOS XE Catalyst SD-WAN Release 17.12.1a, the cflowd commands have been enhanced for both IPv4 and IPv6 flow records.
Device# show flow record sdwan_flow_record-xxx IPv4 flow record:
flow record sdwan_flow_record-1666223692122679:
  Description:        flow and application visibility records
  No. of users:       1
  Total field space:  102 bytes
  Fields:
    match ipv4 protocol
    match ipv4 source address
    match ipv4 destination address
    match transport source-port
    match transport destination-port
    match routing vrf service
    collect ipv4 dscp
    collect transport tcp flags
    collect interface input
    collect interface output
    collect counter bytes long
    collect counter packets long
    collect timestamp absolute first
    collect timestamp absolute last
    collect application name
    collect flow end-reason
    collect connection initiator
    collect overlay session id input
    collect overlay session id output
    collect connection id long
    collect drop cause id
    collect counter bytes sdwan dropped long
    collect sdwan sla-not-met
    collect sdwan preferred-color-not-met
    collect sdwan qos-queue-id
collect counter packets sdwan dropped long
IPv6 flow format:
flow record sdwan_flow_record_ipv6-1667963213662363:
  Description:        flow and application visibility records
  No. of users:       1
  Total field space:  125 bytes
  Fields:
    match ipv6 protocol
    match ipv6 source address
    match ipv6 destination address
    match transport source-port
    match transport destination-port
    match routing vrf service
    collect ipv6 dscp
    collect transport tcp flags
    collect interface input
    collect interface output
    collect counter bytes long
    collect counter packets long
    collect timestamp absolute first
    collect timestamp absolute last
    collect application name
    collect flow end-reason
    collect connection initiator
    collect overlay session id input
    collect overlay session id output
    collect connection id long
    collect drop cause id
    collect counter bytes sdwan dropped long
    collect sdwan sla-not-met
    collect sdwan preferred-color-not-met
    collect sdwan qos-queue-id
    collect counter packets sdwan dropped long
Device# show flow monitor sdwan_flow_monitor cache
Cache type: Normal (Platform cache)
Cache size: 128000
Current entries: 4
High Watermark: 5
Flows added: 6
Flows aged: 2
- Inactive timeout ( 10 secs) 2
IPV4 SOURCE ADDRESS: 10.20.24.110
IPV4 DESTINATION ADDRESS: 10.20.25.110
TRNS SOURCE PORT: 40254
TRNS DESTINATION PORT: 443
IP VPN ID: 1
IP PROTOCOL: 6
tcp flags: 0x02
interface input: Gi5
interface output: Gi1
counter bytes long: 3966871
counter packets long: 52886
timestamp abs first: 02:07:45.739
timestamp abs last: 02:08:01.840
flow end reason: Not determined
connection initiator: Initiator
interface overlay session id input: 0
interface overlay session id output: 4
connection connection id long: 0xD8F051F000203A22
Check the Flows
On the Cisco vEdge devices affected by the Cflowd data policy, various commands let you check the status of the Cflowd flows.
To display information about the flows themselves.
vEdge# show app cflowd flows
                                                            TCP                                                                                        TIME
                                 SRC    DEST         IP     CNTRL  ICMP             EGRESS  INGRESS  TOTAL  TOTAL  MIN  MAX                            TO
VPN  SRC IP       DEST IP        PORT   PORT   DSCP  PROTO  BITS   OPCODE  NHOP IP  INTF    INTF     PKTS   BYTES  LEN  LEN  START TIME                EXPIRE
---------------------------------------------------------------------------------------------------------------------------------------------------------------
1    10.20.24.15  172.16.155.15  46772  13322  0     6      2      0       0.0.0.0  0       0        1      78     78   78   Wed Nov 19 12:31:45 2014  3
1    10.20.24.15  172.16.155.15  46773  13322  0     6      2      0       0.0.0.0  0       0        1      78     78   78   Wed Nov 19 12:31:50 2014  8
1    10.20.24.15  172.16.155.15  46774  13322  0     6      2      0       0.0.0.0  0       0        1      78     78   78   Wed Nov 19 12:31:55 2014  13
1    10.20.24.15  172.16.155.15  46775  13322  0     6      2      0       0.0.0.0  0       0        1      78     78   78   Wed Nov 19 12:32:00 2014  18
1    10.20.24.15  172.16.155.15  46776  13322  0     6      2      0       0.0.0.0  0       0        1      78     78   78   Wed Nov 19 12:32:05 2014  23
1    10.20.24.15  172.16.155.15  46777  13322  0     6      2      0       0.0.0.0  0       0        1      78     78   78   Wed Nov 19 12:32:10 2014  28
1    10.20.24.15  172.16.155.15  46778  13322  0     6      2      0       0.0.0.0  0       0        1      78     78   78   Wed Nov 19 12:32:15 2014  33
1    10.20.24.15  172.16.155.15  46779  13322  0     6      2      0       0.0.0.0  0       0        1      78     78   78   Wed Nov 19 12:32:19 2014  38
1    10.20.24.15  172.16.155.15  46780  13322  0     6      2      0       0.0.0.0  0       0        1      78     78   78   Wed Nov 19 12:32:25 2014  43
1    10.20.24.15  172.16.155.15  46781  13322  0     6      2      0       0.0.0.0  0       0        1      78     78   78   Wed Nov 19 12:32:30 2014  48
1    10.20.24.15  172.16.155.15  46782  13322  0     6      2      0       0.0.0.0  0       0        1      78     78   78   Wed Nov 19 12:32:35 2014  53
1    10.20.24.15  172.16.155.15  46783  13322  0     6      2      0       0.0.0.0  0       0        1      78     78   78   Wed Nov 19 12:32:40 2014  58
To quickly get a count of the number of flows.
vEdge# show app cflowd flow-count
VPN  count
------------
1    12
To display flow statistics.
vEdge# show app cflowd statistics

      data_packets             :      0
      template_packets         :      0
      total-packets            :      0
      flow-refresh             :      123
      flow-ageout              :      117
      flow-end-detected        :      0
      flow-end-forced          :      0
The following commands show information about the Cflowd collectors and the Cflowd template information that is sent to the collector.
vEdge# show app cflowd collector

VPN  COLLECTOR IP   COLLECTOR  CONNECTION            IPFIX    CONNECTION  TEMPLATE  DATA
ID   ADDRESS        PORT       STATE       PROTOCOL  VERSION  RETRY       PACKETS   PACKETS
---------------------------------------------------------------------------------------------
1    172.16.155.15  13322      false       TCP       10       133         0         0

vEdge# show app cflowd template
app cflowd template name test-cflowd-template
app cflowd template flow-active-timeout 30
app cflowd template flow-inactive-timeout 60
app cflowd template template-refresh 90
FNF IPv6 Configuration Example for IPv6 traffic
The following example shows the centralized policy configuration with Cflowd for IPv6 traffic:
policy
 data-policy _vpn_1_accept_cflowd_vpn_1
  vpn-list vpn_1
   sequence 102
    match
     source-ipv6      2001:DB8:0:/32
     destination-ipv6 2001:DB8:1:/32
    !
    action accept
     count  cflowd_ipv6_1187157291
     cflowd
    !
   !
   default-action accept
  !
 !
 cflowd-template cflowd_server
  flow-active-timeout   60
  flow-inactive-timeout 30
  protocol              ipv6
 !
 lists
  vpn-list vpn_1
   vpn 1
  site-list vedge1
   site-id 500
  !

apply-policy
 site-list vedge1
  data-policy _vpn_1_accept_cflowd_vpn_1 all
  cflowd-template cflowd_server
FNF Export Spread Configuration Example
The following example shows the configuration for export spreading:
Device# show sdwan policy from-vsmart
from-vsmart cflowd-template cflowd
 flow-active-timeout    600
 flow-inactive-timeout  60
 template-refresh       60
 flow-sampling-interval 1
 protocol               ipv4
 customized-ipv4-record-fields
  no collect-tos
  no collect-dscp-output
 collector vpn 0 address 10.0.100.1 port 4739 transport transport_udp
  export-spread
   app-tables   20
   tloc-tables  10
   other-tables 5
Configure the Maximum FNF Record Rate for Aggregated Data, Using CLI Commands
Minimum supported releases: Cisco IOS XE Catalyst SD-WAN Release 17.14.1a, Cisco Catalyst SD-WAN Control Components Release 20.14.1
Before You Begin
For more information about using CLI templates, see CLI Add-On Feature Templates and CLI Templates. By default, CLI templates execute commands in global configuration mode.
Configure the Maximum FNF Record Rate
Configure the maximum rate (FNF records per minute) for a device to send aggregated traffic data to Cisco SD-WAN Manager.
policy app-agg-node max-records-per-minuteExample
The following configures a device to send a maximum of 1000 FNF records per minute of aggregated traffic data.
policy app-agg-node 1000Example
The following restores a device to the default value of sending a maximum of 10000 FNF records per minute of aggregated traffic data.
no policy app-agg-nodeVerify Traffic Flow Monitoring
The following sections provide information about verifying traffic flow monitoring.
Verify Collect Loopback
You can verify the ingress and egress interface output using the following command.
show sdwan app-fwd cflowd flows
The following is a sample output from the show sdwan app-fwd cflowd flows using the flows keyword.
Device#show sdwan app-fwd cflowd flows
app-fwd cflowd flows vpn 1 src-ip 10.10.15.12 dest-ip 10.20.15.12 src-port 0 dest-port 0 dscp 0 ip-proto 1
 tcp-cntrl-bits           24
 icmp-opcode              0
 total-pkts               5
 total-bytes              500
 start-time               "Tue Jun 27 09:21:09 2023"
 egress-intf-name         Loopback1
 ingress-intf-name        GigabitEthernet5
 application              ping
 family                   network-service
 drop-cause               "No Drop"
 drop-octets              0
 drop-packets             0
 sla-not-met              0
 color-not-met            0
 queue-id                 2
 initiator                2
 tos                      0
 dscp-output              0
 sampler-id               0
 fec-d-pkts               0
 fec-r-pkts               0
 pkt-dup-d-pkts-orig      0
 pkt-dup-d-pkts-dup       0
 pkt-dup-r-pkts           0
 pkt-cxp-d-pkts           0
 category                 0
 service-area             0
 cxp-path-type            0
 region-id                0
 ssl-read-bytes           0
 ssl-written-bytes        0
 ssl-en-read-bytes        0
 ssl-en-written-bytes     0
 ssl-de-read-bytes        0
 ssl-de-written-bytes     0
 ssl-service-type         0
 ssl-traffic-type         0
 ssl-policy-action        0
 appqoe-action            0
 appqoe-sn-ip             0.0.0.0
 appqoe-pass-reason       0
 appqoe-dre-input-bytes   0
 appqoe-dre-input-packets 0
 appqoe-flags             0
You can verify the ingress and egress interface output using the following command.
show sdwan app-fwd cflowd table
The following is a sample output from the show sdwan app-fwd cflowd table using the table keyword.
show sdwan app-fwd cflowd flows table
PKT    PKT    PKT   PKT                                                    SSL             SSL                                                                APPQOE  APPQOE
                                                                                  TCP                                                                                                                                                        SLA  COLOR                                          FEC   FEC   DUP D  DUP D  DUP   CXP                      CXP           SSL    SSL      EN     SSL EN   DE     SSL DE   SSL      SSL      SSL                      APPQOE  DRE     DRE
                                                       SRC    DEST         IP     CNTRL  ICMP    TOTAL  TOTAL                             EGRESS INTF       INGRESS INTF                                                    DROP    DROP     NOT  NOT    QUEUE                  DSCP    SAMPLER  D     R     PKTS   PKTS   R     D               SERVICE  PATH  REGION  READ   WRITTEN  READ   WRITTEN  READ   WRITTEN  SERVICE  TRAFFIC  POLICY  APPQOE  APPQOE   PASS    INPUT   INPUT    APPQOE
VPN  SRC IP                   DEST IP                  PORT   PORT   DSCP  PROTO  BITS   OPCODE  PKTS   BYTES   START TIME                NAME              NAME              APPLICATION  FAMILY              DROP CAUSE   OCTETS  PACKETS  MET  MET    ID     INITIATOR  TOS  OUTPUT  ID       PKTS  PKTS  ORIG   DUP    PKTS  PKTS  CATEGORY  AREA     TYPE  ID      BYTES  BYTES    BYTES  BYTES    BYTES  BYTES    TYPE     TYPE     ACTION  ACTION  SN IP    REASON  BYTES   PACKETS  FLAGS
----------------
1    10.10.15.11              10.20.20.10              0      0      0     1      24     0       5      500     Tue Jun 27 09:21:06 2023  Loopback1         GigabitEthernet5  ping         network-service     No Drop      0       0        0    0      2      2          0    0       0        0     0     0      0      0     0     0         0        0     0       0      0        0      0        0      0        0        0        0       0       0.0.0.0  0       0       0        0
0    10.0.5.5                 10.0.15.10                58048  22     4     6      24     0       41     1752    Tue Jun 27 09:21:06 2023  internal0/0/rp:0  GigabitEthernet9  unknown      network-service     No Drop      0       0        0    0      2      0          0    0       0        0     0     0      0      0     0     0         0        0     0       0      0        0      0        0      0        0        0        0       0       0.0.0.0  0       0       0        0
1    10.10.15.11              10.20.20.10              0      2048   0     1      24     2048    5      500     Tue Jun 27 09:21:06 2023  GigabitEthernet5  Loopback1         ping         network-service     No Drop      0       0        0    0      2      2          0    0       0        0     0     0      0      0     0     0         0        0     0       0      0        0      0        0      0        0        0        0       0       0.0.0.0  0       0       0        0
1    10.10.15.11              10.5.10.15               0      2048   0     1      31     2048    20     960     Tue Jun 27 09:21:06 2023  Null              GigabitEthernet5  ping         network-service     Ipv4NoRoute  960     20       0    0      2      2          0    0       0        0     0     0      0      0     0     0         0        0     0       0      0        0      0        0      0        0        0        0       0       0.0.0.0  0       0       0        0
1    10.10.15.11              10.20.20.10              50920  4739   0     17     31     0       473    524768  Tue Jun 27 09:21:06 2023  GigabitEthernet5  internal0/0/rp:0  ipfix        network-management  No Drop      0       0        0    0      2      1          0    0       0        0     0     0      0      0     0     0         0        0     0       0      0        0      0        0      0        0        0        0       0       0.0.0.0  0       0       0        0
0    10.0.5.10                10.0.5.10                 22     58048  48    6      24     0       39     3020    Tue Jun 27 09:21:05 2023  GigabitEthernet9  internal0/0/rp:0  ssh          terminal            No Drop      0       0        0    0      2      2          0    0       0        0     0     0      0      0     0     0         0        0     0       0      0        0      0        0      0        0        0        0       0       0.0.0.0  0       0       0        0
1    10.10.15.11              10.20.20.10              0      771    48    1      31     771     8      4192    Tue Jun 27 09:21:05 2023  internal0/0/rp:0  GigabitEthernet5  icmp         network-service     No Drop      0       0        0    0      2      2          0    0       0        0     0     0      0      0     0     0         0        0     0       0      0        0      0        0      0        0        0        0       0       0.0.0.0  0       0       0        0
1    fe40::6044:ff:feb7:c2db  ff01::1:ff00:10          0      34560  0     58     0      34560   6      432     Tue Jun 27 09:20:41 2023  internal0/0/rp:0  GigabitEthernet5  ipv6-icmp    network-service     No Drop      0       0        0    0      0      2          0    0       0        0     0     0      0      0     0     0         0        0     0       0      0        0      0        0      0        0        0        0       0       0.0.0.0  0       0       0        0
1    10:20:20::10             fe40::6024:ff:feb6:c1db  0      34816  56    58     0      34816   4      288     Tue Jun 27 09:20:41 2023  GigabitEthernet5  internal0/0/rp:0  ipv6-icmp    network-service     No Drop      0       0        0    0      2      2          0    0       0        0     0     0      0      0     0     0         0        0     0       0      0        0      0        0      0        0        0        0       0       0.0.0.0  0       0       0        0
Verify Interface Binding on the Device
You can verify the interface binding on the device using the following command.
show sdwan control local-properties wan-interface-list
The following is a sample output from the show sdwan control local-properties wan-interface-list using the wan-interface-list keyword.
The command displays:
-
The physical interface bound to the loopback WAN interface in bind mode.
-
Unbind for loopback WAN interface in unbind mode.
-
N/A for any other cases.
Device#show sdwan control local-properties wan-interface-list
 NAT TYPE: E -- indicates End-point independent mapping
           A -- indicates Address-port dependent mapping
           N -- indicates Not learned
           Note: Requires minimum two vbonds to learn the NAT type

                         PUBLIC          PUBLIC PRIVATE         PRIVATE                                 PRIVATE
MAX   RESTRICT/           LAST         SPI TIME    NAT  VM          BIND
INTERFACE                IPv4            PORT   IPv4            IPv6                                    PORT    VS/VM COLOR            STATE
CNTRL CONTROL/     LR/LB  CONNECTION   REMAINING   TYPE CON REG     INTERFACE
                                                                                                                                                   STUN                                              PRF IDs
-----------------------------------------------------------------------------------------------------------------------------------------------------------------------------------------------------------------------------------------
GigabitEthernet1              10.0.10.10      12346  10.0.10.10      ::                                      12346    2/1  lte              up     2      no/yes/no   No/No  0:20:20:27   0:01:14:20  N    5  Default N/A
GigabitEthernet4              10.0.10.10      12346  10.0.10.10      ::                                      12346    2/0  blue             up     2      no/yes/no   No/No  0:20:20:27   0:01:14:20  N    5  Default N/A
Loopback1                     1.1.1.1         12366  1.1.1.1         ::                                      12366    2/0  custom1          up     2      no/yes/no   No/No  0:20:20:27   0:01:14:20  N    5  Default GigabitEthernet1
Loopback2                     2.2.2.2         12406  2.2.2.2         ::                                      12406    2/0  custom2          up     2      no/yes/no   No/No  0:20:20:27   0:01:14:20  N    5  Default Unbind
 Feedback