| Checkpoint Failed. |
Check the archive. |
| CiscoIosFileUploadException:
Full error: Error occurred while verifying file upload operation for net element CGR1120/K9+FOC21255MYX
|
Check provisioning URL (HTTP, HTTPS)
Check WSMA with test script: user and port
|
| org.apache.cxf.interceptor.Fault: Connection refused (Connection refused) |
Check port used for HTTPS communication
(varies by platform).
For example:
|
| PnP Service Error 3341 Full error:
Error while creating FND trustpoint on the device.
errorCode: PnP Service Error 3341, errorMessage: SSL Server ID check failed after cert-install
|
Check SAN field in the FND certificate:
For additional information, click
to view the document:
Enter the keystore command to list SAN fields
on the certificate in the keystore used for PNP.
This verifies the accuracy of the SAN field(s). keytool -list -v -keystore cgms_keystore | grep
SubjectAlt -A3
Enter keystore password:
keystore SubjectAlternativeName
[IPAddress: 10.48.43.229]
|
|
PnP Service Error 1702 Full error:
Error while deploying odm/config file on the device.
errorCode: PnP Service Error 1702, errorMessage: I/O error
|
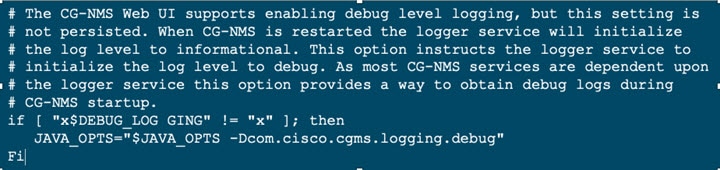
If error is seen, enable debug in FND for bootstrapping,
Ensure that FAR is able to reach TPS or FND using its hostname.
For example, in the below debug logs for FND bootstrapping, FAR should be able to resolve and reach iot-tps.example.cisco.com
on 9120 and viceversa.
[sev=DEBUG][tid=tunnelProvJetty-534][part=33728.4/16]: <fileTransfer>
[sev=DEBUG][tid=tunnelProvJetty-534][part=33728.5/16]: <copy>
[sev=DEBUG][tid=tunnelProvJetty-534][part=33728.6/16]: <source>
[sev=DEBUG][tid=tunnelProvJetty-534][part=33728.7/16]: <location>https://iot-tps.example.cisco.com:9120/pnp/odm/IR829GW </location>
[sev=DEBUG][tid=tunnelProvJetty-534][part=33728.8/16]: </source>
[sev=DEBUG][tid=tunnelProvJetty-534][part=33728.9/16]: <destination>
[sev=DEBUG][tid=tunnelProvJetty-534][part=33728.10/16]: <location>flash:/managed/odm/cg-nms.odm</location>
[sev=DEBUG][tid=tunnelProvJetty-534][part=33728.11/16]: </destination>
|
| java.lang.reflect. InnvocationTargetException.
Full error description: PnP request for element ID [IR1101-K9+FCW223700AV] failed [java.lang.reflect.InvocationTargetException].
|
Check bootstrap configuration.
If error is seen immediately after updating ODM:
-
Check provisioning settings in the
user interface.
-
Check debug log for empty value for
proxy-bootstrap-ip property field.
-
Must provide a valid IP address or hostname.
|
| Could not generate DH keypair.
Full error description: java.security.Invalid.AlgorithmParameterException:
DH key size must be multiple of 64 and must be in the range of 512 to 2048 (inclusive).
The specific key size 4096 is not supported.
|
Check: ip http secure-ciphersuite
|
|
Error:
PKIX path building failed: sun.security.provider.certpath. SunCertPathBuilderException: unable to find valid certification path to requested target.
Cause:
Wrong certificate is offered through HTTPS-server on FAR.
|
Check the certificate for Web communication with
IoT FND on the router (FAR):
-
Check the configuration
of the secure-transport:
-
Router# sh run | i secure-trustpoint
-
ip http secure-trustpoint LDevID
-
ip http client secure-trustpoint LDevID
-
If the secure-transport configuration is
correct, then restart https server on FAR:
|
|
Error:
PKIX path validation failed: java.security.cert.CertPathValidatorException: validity check failed.
Cause:
Wrong certificate is offered through HTTPS-server on FAR.
|
If this error is seen, then there
is an issue with the certificate used for
https communication between IoT FND and FAR.
In certain situations, for example,
if reload-during-bootstrap=true property is
used in the cgms.properties file,
then this error might be seen once, after
which the tunnel formation is successful.
This is because of the delay in obtaining the
LDevID certificate after the router boots up.
But the first tunnel formation request
has already been sent before LDevID is obtained.
So the first time failure of tunnel formation,
this error message is seen.
However, when the second tunnel formation
request in sent,
the LDevID has already been obtained
by this time for the https communication
and hence the tunnel formation is successful.
Workaround:
From IoT FND 4.6.x onwards,
remove reload-during-bootstrap=true
from the cgms.properties file,
as this property was introduced
as a workaround for CSCvk66991.
|
Note
|
CSCvk66991 is fixed now, hence
this property is not mandatory
from IoT FND 4.6.x onwards.
|
|
|
Error:
sun.security.validator.ValidatorException: PKIX path building failed: sun.security.provider.certpath.
SunCertPathBuilderException: unable to find valid certification path to requested target
Cause:
Issuing CA certificate is missing in keystore.
|
Install Issuing CA cert.
|
| Error in running file check command
Full error: Error in running file check command: dir flash:/managed/odm/cg-nms.odm.,
Reason: javax.xml.ws.soap.SOAPFaultException: Serve D-H key verification failed
|
Add the following command to the file check:
|
| Error during registration process:
javax.xml.ws.WebServiceException: Could not send Message
|
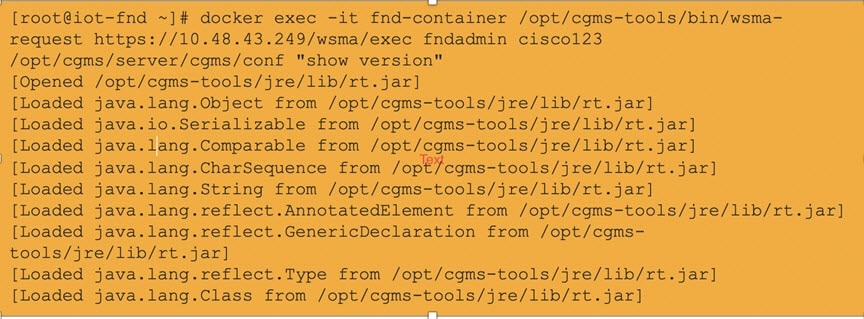
Check WSMA.
On the router (FAR), run debug: Router# debug ip http all
|
| HTTP response ‘502: Bad Gateway’
Full error: org.apache.cxf.transport.http.HTTPException:
HTTP response ‘502:Bad Gateway’ when communicating with https://10.48.43.249.443/wsma/config
Error is typically seen with NGINX on IR1101.
|
Note
|
NGINX is a software-based web server.
|
|
Note
|
In most cases, the ‘502:
Bad Gateway’ error is related to http max-connections set in the command below.
tunnel(config)# ip http max-connections 20
|
|
Note
|
Should the value that you enter in the command (noted above) return an error, you can increase the value until the error goes
away.
|
|
On the IR1101, check NGINX log by
entering one of the commands: IR1101# show platform software trace message
nginx RP active
-or-
You can find the latest nginx file in the directory: IR1101# dir bootflash/tracelogs/nginx*
To copy the latest nginx file,
use one of the following:
Cisco IOS file operations such as SCP or TFTP.
|
| Failed to load function ‘CA InitRolePIN’Issue with (outdated) HSM Java libraries Full error:
Failed to load function ‘CA_InitSlotRolePIN’ Failed to load function ‘CA_...Failed to load function ‘CA_DescribeUtilizationCounterId’
Failed to load function ‘CA TestTrace’
|
Backup/copy new libs to
cgms or cgms-tools libs folder:
[root@FNDPRDAPP01 bin]# cp -r /opt/cgms-tools/jre/lib/ext/opt/cgms-tools/jre/lib/ext-bc/
root@FNDPRDAPP01 bin]# cp /usr/safenet/lunaclient/jsp/lib/*/opt/cgms-tools/jre/lib/ext/
|
| Reverse DNS (1 of 2)
Nothing in FND log when running CGNA on FAR tcpdump does not show incoming traffic to FND
Debugging CGNA/HTTP on FAR shows:
cgna_httpc_post: http_send_request rc= 0 tid=55
cgna_prf timer_start:cg-nms-register:timer started Thu Jul 18 14:10:55 2019
httpc_request:Do not have the credentials
cgna_http_resp_data: Received for sid=5 tid=55 status= 7
|
Debugging CGNA/HTTP on FAR should be
(rather than the display to the left):
cgna_httpc_post: http_send_request rc= 0
tid=114
cgna_prf timer_start:cg-nms-periodic:
timer started
Thu Jul 18 16:37:38 2019
httpc_request: Dont have the credentials
Jul 18 16:37:40.844 UTC:
Thu, 18 Jul 2019 14:37:40 GMT
10.48.43.251
http:10.48.43.299/cgna/ios/metrics ok
Protocol = HTTP/1.1
Jul 18 16:37:40.844 UTC:
Date =Thu, 18 Jul 2019 14:40:27 GMT
cgna_http_resp_data: Received for sid= 4 tid=114
status=8
|
| Reverse DNS (2 of 2)
Every time FAR tries (http client) to create a TLS connection with FND, Java does a reverse DNS lookup of the source IP of the device.
This is by design in Java. Apparently, for preventing DDoS attacks.
|
Remove DNS server or set the following
in the cgms.properties:
enable-reverse-dns-lookup=false
(Addressed in CSCvk59944)
|
|
FND will not start (1 of 2)
Symptom:
FND stops suddenly or is unable to start on an
Oracle installation where the database is installed locally.
|
Check the hard disk space using the command
‘df-h’ on the linux shell.
If the disk is showing as ‘full’, most likely the
Oracle DB archive logs have filled up the
disk space and needs cleaning.
Another reason could be that the database
password has expired.
Run the command to confirm: /opt/cgms/server/cgms/log/cgms_db_connection_test.log
To change the password, become the oracle user
and use the script provided in the Oracle RPM:
su - oracle $ORACLE_BASE/cgms/scripts/change_password.sh
|
| FND will not start (2 of 2)
Symptom: FND service is up but GUI will not load.
|
Issue is mostly likely due to
Linux firewall getting enabled.
Disable firewall using the Linux CLI command:
systemctl firewalld stop
|
|
After FND is upgraded to FND 4.8, the HSM Client to FND Server communication does not work and displays the following error
message:
‘Could not get CsmpSignatureKeyStore instance.
Please verify HSM connection. Exception: Object not found.’
The error above is seen in FND Deployments with HSM that are running with or without High Availability (HA).
|
This is an HSM library issue. HSM client is not
sending right slot ID to the FND server. Hence, the customer will have to follow up with
HSM support.
‘Could not get CsmpSignatureKeyStore instance.
Please verify HSM connection. Exception:
Object not found.’
(CSCvz59702)
Although, the HSM client resides on the same
Linux server, where the FND
Application Server is also installed.
The HSM client is not provided by HSM and
not by Cisco.
Only HSM has the expertise and visibility to
the HSM code and the HSM support
team can help fix this issue.
FND uses SSM or HSM to store encrypted
information and keys.
If there is an issue with SSM or HSM, then FND
will not initialize.
The IoT FND component remains in Down state
even if the FND application server is in UP state.
In this case, when the SSM is used,
then you can contact Cisco Support.
They have the expertise and visibility to the code
to help you resolve this issue.
However, if the HSM client to server connection
has issues, then the Thales/HSM vendor
has the visibility and expertise to help
resolve the issue.
|
|
CSMP certificate not displayed in IoT FND GUI during fresh install.
|
For a fresh install of IoT FND and HSM integration,
the CSMP certificate appears in the FND UI only
when an endpoint/meter is added to FND,
irrespective of whether th emeter/endpoint
is registered to FND or not.
You can also add a dummy entry for
meter/endpoint.
If there is no real endpoint or meter to add at the
point of testing CSMP certificate display.
Apart from the CSMP certificate displayed in
the GUI, you can also use the following methods
to verify if IoT FND can access
and retrieve the CSMP certificate from HSM:
-
Method 1
Run the following command: cat /opt/cgms/server/cgms/log/server.log |
grep -i HSM
If you get the below message, then IoT FND and HSM communication is successful, and
FND can retrieve the public key.
%IOTFND-6-UNSPECIFIED: %[ch=HSMKeyStore][sev=INFO]
[tid=MSC service thread 1-3]:
Retrieved public key:
3059301306072a8648ce3d020106082a864
8ce3d03010703 420004d914167514ec0a110 f3170eef742a000572cea6f0285a3074db
87e43da398
ab016e40ca4be5b888c26c4 fe91106cbf685a04b0f61d599826bdbcff
25cf065d24
-
Method 2
Run the following command. The cmu list command checks if FND can see
two objects stored in HSM partition, namely
private keys and CSMP certificate.
[root@iot-fnd ~]# cd /usr/safenet/lunaclient/bin
[root@iot-fnd bin]# ./cmu list
Certificate Management Utility
(64-bit) v7.3.0-165. Copyright (c)
2018 SafeNet. All rights reserved.
Please enter password for token in slot 0 :
******* handle=2000001
label=NMS_SOUTHBOUND_KEY
handle=2000002 label=NMS_SOUTHBOUND_KEY--cert0
You have new mail in /var/spool/mail/root
|
| Error:
Caused by FATAL: terminating connection due to idle-in-transaction timeout
|
|
Note
|
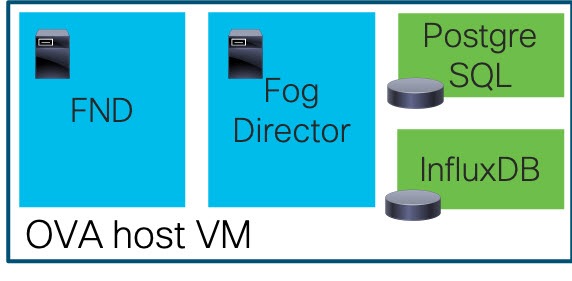
This is applicable only to FND-Postgres ova deployments.
|
Edit the idle_in_transaction_session_timeout property in postgresql.conf file.
By default it is set to 3h. If any operation requires the transaction to be opened for more than 3h then on getting the above
error, set the value for the idle_in_transaction_session_timeout property to more than 3h and restart Postgresql service for
the property to take effect.
|
| With IoT FND and HSM integration, the CSMP certificate will not load in IoT FND UI after the upgrade. |
The inability of the certificate to load is mostly
likely due to the upgrade process overwriting the old HSM client libraries (example: version 5.x)
with the new client libraries (example: version 7.x or 10.x or higher)
that are bundled with FND 4.4 and later releases.
|
Note
|
For more information on the HSM client
version that is bundled with
IoT FND, refer to the
corresponding FND release notes.
|
To restore the old libraries, perform the following
on the Linux shell:
cp /usr/safenet/lunaclient/jsp/lib/LunaProvider.jar /opt/cgms/jre/lib/ext/
cp /usr/safenet/lunaclient/jsp/lib/libLunaAPI.so /opt/cgms/jre/lib/ext/
cp /usr/safenet/lunaclient/jsp/lib/LunaProvider.jar /opt/cgms/safenet/
cp /usr/safenet/lunaclient/jsp/lib/libLunaAPI.so /opt/cgms/safenet/
To restore the tools package:
cp /usr/safenet/lunaclient/jsp/lib/LunaProvider.jar /opt/cgms-tools/jre/lib/ext
cp /usr/safenet/lunaclient/jsp/lib/libLunaAPI.so /opt/cgms-tools/jre/lib/ext
cp /usr/safenet/lunaclient/jsp/lib/LunaProvider.jar /opt/cgms-tools/safenet/
cp /usr/safenet/lunaclient/jsp/lib/libLunaAPI.so /opt/cgms-tools/safenet/
|
|
ODM file will not update on the router
Symptom: During Plug and Play (PnP) or ZTD, the ODM file on the router
does not get updated, which results in failure to register the device.
|
Issue is most likely due to the following entry
in the cgms.properties file: update-files-oncgr=false
Either remove the entry above or change it to ‘true’
as shown below: update-files-oncgr=true
|
|
Any CGR running Cisco IOS 15.6.x will not
register with FND 4.3 or newer release.
|
Problem occurs because the WPAN
high-availability (HA) feature was introduced
in FND 4.3. This feature requires a minimum Cisco IOS
release of 15.7(M)4.
|
|
SSM certificate will not load.
|
After upgrading to FND 4.4 or newer versions,
the SSM cert is no longer seen in the CSMP
certificates page.
This occurs because the web certificate is
getting changed after every upgrade.
The web cert is used for establishing secure
communication with the SSM.
This change was done as part of the
security compliance in FND 4.4. and all
subsequent releases of FND,
which generates a unique web (browser)
certificate upon install or upgrade.
To fix, export the self-signed web certificate
from FND GUI:
-
Go to Admin > Certificates > web certificate tab.
Use the base64 format.
-
Transfer the file to the opt/cgms-ssm directory.
-
Stop SSM service: service ssm stop.
-
Enter cd /opt/cgms-ssm/bin.
-
Execute: /ssm setup.sh.
-
Select option 8 : Import a trusted certificate
to SSM-Web keystore.
-
Enter current ssm_web_keystore password:
ssmweb.
-
Enter the alias for import: fnd.
-
Enter Certificate filename:
/opt/cgms-ssm/certForWeb.pem.
-
Start the SSM service: service ssm start.
|
|
Could not get CsmpSignatureKeyStore instance.
Please verify HSM connection.
|
This is an HSM client library issue. The HSM client is not sending the correct
slot ID to the FND server.
Please follow up with HSM support.
|
| fndserver1.test.com: %IOTFND-3-UNSPECIFIED: %[ch=CgmsAuthenticator][sev=ERROR] [tid=http-/0.0.0.0:443-4] [part=150156.1/55]:
Exception when adding remote user to the db.
fndserver1.test.com: %IOTFND-3-UNSPECIFIED: %[ch=CgmsAuthenticator][sev=ERROR] [tid=http-/0.0.0.0:443-4] [part=150156.2/55]:
com.cisco.cgms.exceptions.AAAException: failed to decrypt stored shared secret
|
The IoT FND server certificate contents
for HA setup is:
-
The Subject — Must have the FQDN of the VIP.
Example: FNDSERVERVIP.TEST.COM
-
The Subject Alternative Name (SAN) —
Added must include the FQDN of the VIP.
Example: FNDSERVERVIP.TEST.COM
(same as the subject)
-
The Subject Alternative Name —
Must NOT have the individual server names.
Example: It must not contain
FNDSERVER1.TEST.COM,
FNDSERVER2.TEST.COM
|

 Feedback