
Use Product Analytics for Cisco 8000 Series Routers
Product analytics for Cisco 8000 Series routers
This document provides information about the Product Analytics feature for enterprise routers.
Product Analytics refers to the collection of product telemetry such as product performance and resource usage information directly from the IOS-XE-based routing platforms.
This functionality is available from Cisco IOS XE 17.18.1 release onwards and is enabled by default when you start your router.
By default, there is a grace period of 7 days where no data is collected. No reports are generated during this time. After this period, the collection of device data starts, and a report is generated based on the reporting policy. This report is sent to Cisco SSM through direct connection or through non-direct modes (SSM On-Prem, CSLU, and Offline). The product analytics report is then included in the Smart Licensing RUM report, where you can view the report data.
 Note
NoteIf you reload the device before the seven days grace period, the timer for grace period restarts from the time of boot. Seven days from this restart time, product analytics data is collected.
Benefits
This list outlines the benefits of using the Product Analytics functionality for your routers.
- Collecting data through Product Analytics enables you to have a better vision of product performance and feature consumption.
- The data insights offered through this feature allows you to proactively choose a dynamic licensing system best suited for your needs.
Key performance index
You can use the Product Analytics feature to collect and view a report of all the Key Performance Index (KPI)s listed here:
- adv_voice_uc_digital
- app_hosting_app
- app_hosting_app_UTD
- bfd_support
- bgp_ipv4
- bonjour_mdns_discovery
- bonjour_mdns_wide_area
- cellular_interface
- dhcpv4_support
- dhcpv6_support
- dns_web_layer_security
- domain_name_server
- dsl_ipoe
- dsl_ppoe
- dsl_support
- eigrp_ipv4
- ethernet_support
- ethernet_switch_ports
- flexible_netflow
- hardware_inventory
- interface_ethernet_100G
- interface_ethernet_10G
- interface_ethernet_1G
- interface_ethernet_25G
- interface_ethernet_2.5G
- interface_ethernet_40G
- interface_ethernet_5G
- ips_ids
- lisp_config
- lisp_extranet
- lisp_intf
- lisp_l2_intf
- lisp_silent_host_detection
- multicast_bidi_pim
- multicast_igmp
- multicast_ssm_ext
- ntp_configured
- ospf
- ospf_v3
- power_consumption
- prog_grpc
- prog_netconf
- prog_restconf
- qos_enabled
- security_aaa
- security_acl_ipv4
- security_acl_ipv6
- serial_t1_e1
- snmp_support
- snmp_wan_edge
- switch_virtual_port
- syslog_support
- thousand_eyes
- trustsec_global
- tunnel_dmvpn
- tunnel_eogre
- tunnel_flex_ipsec_over_gre
- tunnel_flex_vpn_vti
- tunnel_get_vpn
- tunnel_gre_config
- tunnel_ipsec
- tunnel_l2_forwarding
- tunnel_l2tpv2
- tunnel_l2tpv3
- tunnel_lac4
- tunnel_lns4
- tunnel_v4_over_v6
- tunnel_v6_over_v4
- tunnel_vpdn
- url_filtering
- virtual_routing_forwarding
- voice_net_int_modules
- zone_based_firewall_policy
- zone_based_firewall_wan
Platforms supported
The Product Analytics feature is supported in the platforms listed in this section.
- Cisco Catalyst 8200 Series
- Cisco Catalyst 8300 Series
- Cisco Catalyst 8500 Series
- Cisco Catalyst 8000V Edge Software
How Product Analytics works
The Product Analytics architecture is driven by an policy with a product analytics engine that automates data capturing from various data sources.
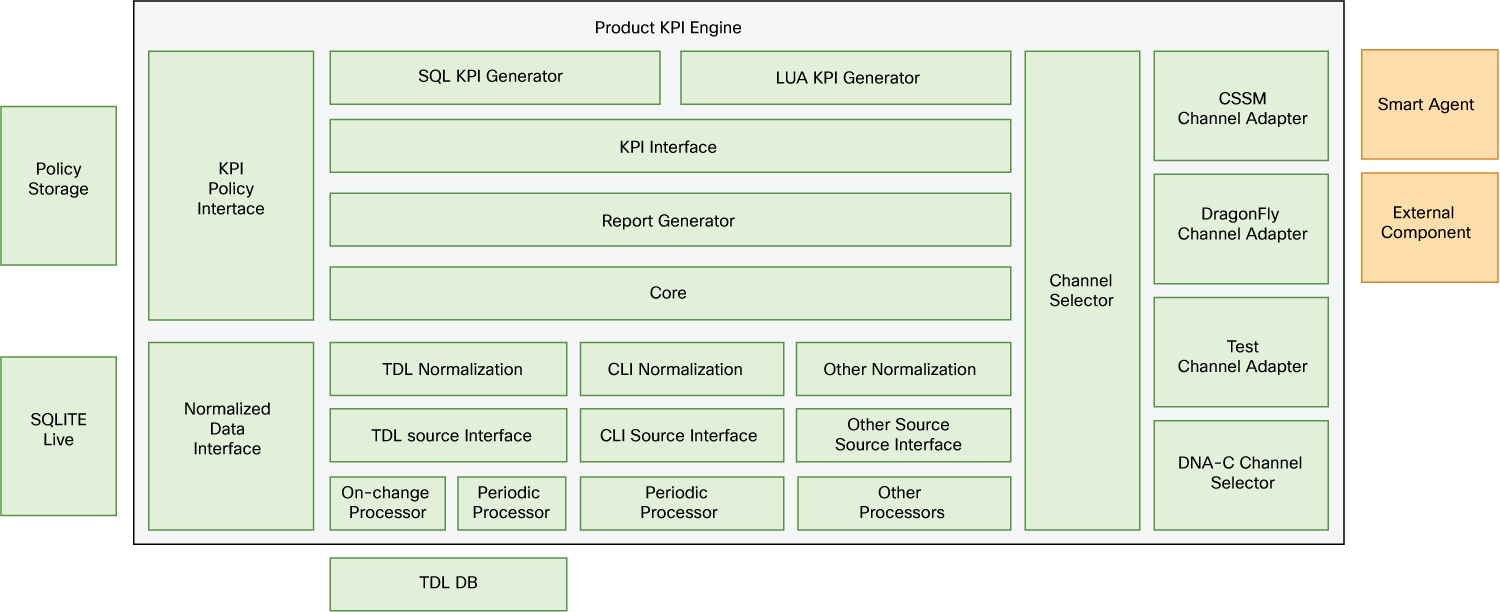
Summary
The key components of this architecture include:
- Data Sources: These are the data sources on which we can enable capture points for the purpose of tracking data for KPI computation.
- Normalization: This component acts as an intermediate format to ensure neither the data nor the KPI computation know about the source of data. Normalization is applied to data coming from each data source to translate source specific data format and semantic to an intermediate representation, which is common to all data sources. JSON with a specific schema has been chosen as an intermediate representation.
- Data Store: The component from which data is sourced for analysis. The data store provides efficient retrieval and combining of data to facilitate the KPI computation. The store tracks raw data from data sources during an observation period, for example, 1 day. The observation period data is kept in an off-memory store and reflects observed data at the time of the data source capture: periodically or on-change.
- Dynamic KPI Generator: These are the run time components for the evaluation of KPIs based on the normalized data.
- Report Generator: This component collects KPIs into a report at the end of each observation period, stores it in TDL format, and prepares it for transmission via various channels.
- Channel Selector: This component chooses the communication channel to export the KPI report.
- Policy: A Policy defines the telemetry attributes (KPIs) to be collected, the data source of the telemetry attributes, the data collection and pre-processing rules, and the data collection and reporting interval. This component manages the reporting policy for a device, as per the reporting policy you have chosen. This component notifies components about new policy items, and allows each component to define and evolve its relevant parameters.
Workflow
The Product Analytics architecture captures automated data from different types of data sources and normalizes this data. Relevant data is kept in a common store, which allows efficient retrieval. It also allows for combination of data to produce valuable business KPIs.
The KPI engines leverage the tracked data to compute relevant KPIs for the IOS-XE device at run time. The report generator then collects these KPIs to formulate this into a consumable report. Reports are available through the RUM reports and you can view the RUM reports and their status on your device using the appropriate show commands.
Depending on your deployment topology: connected or disconnected SSM On-Prem, CSLU utility, direct deployment, the RUM reports are generated, uploaded, and synchronized manually or automatically.
At the end of the observation period, the store discards the data and starts a new observation period.
Prerquisites
To use the Product Analytics functionality for your device, the criteria mentioned in this list should be fulfilled.
- License boot level must be configured with at least network-essentials
- Your device must run on Cisco IOS-XE release 17.18.1 release at a minimum.
-
The configurations mentioned in this list must be enabled:
- license smart url smart <smart-license-URL>
- license smart transport smart
- license smart vrf <vrf-name> (If WAN intf is attached to vrf)
- ip name-server [vrf <vrf-name>] <dns-server-ip>
- ip domain lookup [vrf <vrf-name>] source-interface <WAN-intf>
- ip domain name cisco.com
- license smart trust idtoken <smart-acount-generated-token> local force
Limitations
This list specifies the limitations and restrictions for the Product Analytics feature:
- The Product Analytics feature is not supported for custom SLP reporting policies and by devices that have SLR or PLR enabled.
- The Product Analytics feature does not work if Cisco SSM is disabled.
- If trust is not established between your device and Cisco SSM, you will not be able to receive or access the Product Analytics report.
- This feature is only supported on routing platforms running in autonomous mode. This feature is not supported for SD-Routing. For devices running in controller mode, or in autonomous mode with SD-Routing enabled, Product Analytics is not supported.
Enable the Product Analytics functionality
If your device supports this functionality and runs on Cisco IOS XE 17.18.1 version or later, by default, this functionality is enabled after the grace period. No action is required from your side.
After you boot your router for the first time, a grace period of seven days is provided, where no data is collected. The system displays a syslog message that this functionality will be enabled after seven days.
Here’s a sample of syslog message:
*Jan 09 03:05:30.078: %IOSXE_RP_PAE_NOT-4-PAE_STARTUP_DELAY: Product Analytics is Enabled Product Analytics will start in 7 days, configure "no product-analytics" to disableAfter the grace period ends, the system automatically generates a configuration in the device to collect the data for the device. The system displays a syslog message to indicate that the functionality is enabled.
Here’s a sample syslog message indicating that the Product Analytics feature is enabled for your device:
*Jun 16 07:02:29.388: %IOSXE_RP_PAE_NOT-6-PAE_STARTUP: Product Analytics is EnabledSample RUM Report
The Product Analytics telemetry report contains the summary of all the KPIs you have chosen in the interval configured as per the policy you’ve applied.
Device# show license rum id all | in TELEMETRY
1739497992          DELETED   E     TELEMETRY
1739498073          DELETED   P     TELEMETRY
1739498098          DELETED   N     TELEMETRY
1739498129          DELETED   N     TELEMETRY
1739498132          DELETED   N     TELEMETRY
1739498133          DELETED   N     TELEMETRY
1739498134          OPEN      N     TELEMETRY
Note that the status of the latest telemetry is OPEN. This indicates that the report is still stored in the local device and has not yet been sent out.
To view the content of your Product Analytics report on your device, run the test license smart telemetry show command. Here is a sample report that you can generate by running this show command.
Device# test license smart telemetry show
{"version":"2.0","asset_identification":{"report_id":1739498134,"asset":{"name":"regid.2019-10.com.cisco.C8000V,1.0_e361c3dc-27c2-4084-b4a-cae639cff335"},"instance":{"sudi":{"udi_pid":"C8000V","udi_serial_number":"9ZC221OFDY5"},"product_instance_identifier":"f1815a6e-0533-4773-8173c7263c3f9d6d"}},"meta":{"report_type":"telemetry","utility_enabled":false,"ha_udi":[{"role":"Active","sudi":{"udi_pid":"C8000V","udi_serial_number":"9ZC221OFDY5"}}]},"measurements":[{"start_time":1752468833,"end_time":1752475067,"meta":[{"type":"report_id","value":"1752475067"}],"metric_name":"Telemetry MetaInfo","values":[{"type":"report_id","value":"1752475067"},{"type":"policy_version","value":"17.19.1"},{"type":"engine_version","value":"17.19.1"},{"type":"policy_file_version","value":"1"},{"type":"timezone","value":"0"},{"type":"software_version","value":"17.19.01.0.224758.1752059402..IOSXE"},{"type":"serial_num","value":"SSI130300YK"},{"type":"product_id","value":"C8000V"},
Verify Product Analytics enablement
To verify whether Product Analytics is enabled for your device, perform this task.
Run the show license summary command in the CLI. Example:The Available status against the Product Analytics field indicates that the Product Analytics feature is enabled and working. |
View a Product Analytics report
Perform this task to view a Product Analytics report.
The Product Analytics report is delivered to you as a part of the RUM report. By default, the licensing usage report frequency is set to once in 30 days. That is, you will receive a Product Analytics report once every 30 days. This report is added to the license RUM report, where you can view the details of all the data that has been collected over the 30 days.
Step 1 | Run the show product-analytics kpi summary command to view the Product Analytics report. Example: |
Step 2 | Run the show product-analytics kpi detail command to check the detail KPI context in the Product Analytics report. |
View Smart License usage interval
Perform these steps in the device CLI to learn how to change the RUM report interval for your device’s Smart License.
The Product Analytics report is generated every 30 days internally and this interval cannot be changed as it is defined in the built-in SQL profile. Smart license receives and stores the telemetry of the Product Analytics report and sends a RUM report including telemetry of the Product Analytics report every 30 days.
Step 1 | Run the enable command. Example:Enters the privileged EXEC mode. |
Step 2 | Run the configure terminal command. Example:Enters the configure terminal mode. |
Step 3 | Run the license smart usage interval command to view the interval in which the Product Analytics report is sent. By default, the usage interval is 30 days. You cannot modify this value and change the license usage interval. |
Disable Product Analytics
Perform this task to disable the Product Analytics feature on your device.
Run the no product-analytics command. Example: |