- 5.1 Threshold Performance Monitoring
- 5.2 Intermediate-Path Performance Monitoring
- 5.3 Pointer Justification Count Performance Monitoring
- 5.4 Performance Monitoring Parameter Definitions
- 5.5 Performance Monitoring for Electrical Cards
- 5.6 Performance Monitoring for Ethernet Cards
- 5.7 Performance Monitoring for Optical Cards
- 5.8 Performance Monitoring for Transponder and Muxponder Cards
- 5.9 Performance Monitoring for the Fibre Channel Card
- 5.10 Performance Monitoring for DWDM Cards
Performance Monitoring
Performance monitoring (PM) parameters are used by service providers to gather, store, set thresholds, and report performance data for early detection of problems. In this chapter, PM parameters and concepts are defined for electrical cards, Ethernet cards, and optical cards in the Cisco ONS 15454 SDH.
For information about enabling and viewing PM values, refer to the Cisco ONS 15454 SDH Procedure Guide.
Chapter topics include:
•![]() Threshold Performance Monitoring
Threshold Performance Monitoring
•![]() Intermediate-Path Performance Monitoring
Intermediate-Path Performance Monitoring
•![]() Pointer Justification Count Performance Monitoring
Pointer Justification Count Performance Monitoring
•![]() Performance Monitoring Parameter Definitions
Performance Monitoring Parameter Definitions
•![]() Performance Monitoring for Electrical Cards
Performance Monitoring for Electrical Cards
•![]() Performance Monitoring for Ethernet Cards
Performance Monitoring for Ethernet Cards
•![]() Performance Monitoring for Optical Cards
Performance Monitoring for Optical Cards
•![]() Performance Monitoring for Transponder and Muxponder Cards
Performance Monitoring for Transponder and Muxponder Cards
•![]() Performance Monitoring for the Fibre Channel Card
Performance Monitoring for the Fibre Channel Card
•![]() Performance Monitoring for DWDM Cards
Performance Monitoring for DWDM Cards

Note ![]() For additional information regarding PM parameters, refer to ITU G.826, and Telcordia documents GR-820-CORE, GR-499-CORE, and GR-253-CORE.
For additional information regarding PM parameters, refer to ITU G.826, and Telcordia documents GR-820-CORE, GR-499-CORE, and GR-253-CORE.
5.1 Threshold Performance Monitoring
Thresholds are used to set error levels for each PM parameter. You can set individual PM threshold values from the Cisco Transport Controller (CTC) card view Provisioning tab. For procedures on provisioning card thresholds, such as line, path, and SDH thresholds, refer to the Cisco ONS 15454 SDH Procedure Guide.
During the accumulation cycle, if the current value of a performance monitoring parameter reaches or exceeds its corresponding threshold value, a threshold crossing alert (TCA) is generated by the node and displayed by CTC. TCAs provide early detection of performance degradation. When a threshold is crossed, the node continues to count the errors during a given accumulation period. If 0 is entered as the threshold value, the performance monitoring parameter is disabled.
Note ![]() Due to limitations of memory and the number of TCAs generated by different platforms, you can manually add or modify the following two properties to their property file (CTC.INI for Windows and .ctcrc for UNIX) to fit the need:
Due to limitations of memory and the number of TCAs generated by different platforms, you can manually add or modify the following two properties to their property file (CTC.INI for Windows and .ctcrc for UNIX) to fit the need:
ctc.15xxx.node.tr.lowater=yyy (where xxx is the platform and yyy is the number of the lowater mark. The default lowater mark is 25.)
ctc.15xxx.node.tr.hiwater=yyy (where xxx is the platform and yyy is the number of the hiwater mark. The default hiwater mark is 50.)
If the number of incoming TCA is greater than the hiwater mark, it will keep the latest lowater mark and discard older ones.
Change the threshold if the default value does not satisfy your error monitoring needs. For example, customers with a critical E1 installed for 911 calls must guarantee the best quality of service on the line; therefore, they lower all thresholds so that the slightest error raises a TCA.
5.2 Intermediate-Path Performance Monitoring
Intermediate-path performance monitoring (IPPM) allows transparent monitoring of a constituent channel of an incoming transmission signal by a node that does not terminate that channel. Many large ONS 15454 SDH networks only use line terminating equipment (LTE), not path terminating equipment (PTE). Table 5-1 shows ONS 15454 SDH cards that are considered LTE.
Software Release 3.0 (R3.0) and later allow LTE cards to monitor near-end PM data on individual high-order paths by enabling IPPM. After enabling IPPM provisioning on the line card, service providers can monitor high-order paths that are configured in pass-through mode on an ONS 15454 SDH operating in SDH AU4 mode, thus making troubleshooting and maintenance activities more efficient.
IPPM occurs only on high-order paths that have IPPM enabled, and TCAs are raised only for PM parameters on the IPPM enabled paths. The monitored IPPM parameters are HP-EB, HP-BBE, HP-ES, HP-SES, HP-UAS, HP-ESR, HP-SESR, and HP-BBER.
Note ![]() The E1 card and STM-1 card can monitor far-end IPPM. For all other cards listed in Table 5-1, far-end IPPM is not supported. However, SDH path PM parameters can be monitored by logging into the far-end node directly.
The E1 card and STM-1 card can monitor far-end IPPM. For all other cards listed in Table 5-1, far-end IPPM is not supported. However, SDH path PM parameters can be monitored by logging into the far-end node directly.
The ONS 15454 SDH performs IPPM by examining the overhead in the monitored path and by reading all of the near-end path PM values in the incoming direction of transmission. The IPPM process allows the path signal to pass bidirectionally through the node completely unaltered.
For detailed information about specific IPPM parameters, locate the card name in the following sections and review the appropriate definition.
5.3 Pointer Justification Count Performance Monitoring
Pointers are used to compensate for frequency and phase variations. Pointer justification counts indicate timing errors on SDH networks. When a network is out of synchronization, jitter and wander occur on the transported signal. Excessive wander can cause terminating equipment to slip.
Slips cause different effects in service. Voice service has intermittent audible clicks. Compressed voice technology has short transmission errors or dropped calls. Fax machines lose scanned lines or experience dropped calls. Digital video transmission has distorted pictures or frozen frames. Encryption service loses the encryption key causing data to be transmitted again.
Pointers provide a way to align the phase variations in VC4 payloads. The VC4 payload pointer is located in the H1 and H2 bytes of the AU pointers section and is a count of the number of bytes the VC4 path overhead (POH) J1 byte is away from the H3 byte, not including the section overhead bytes. Clocking differences are measured by the offset in bytes from the pointer to the first byte of the VC4 POH called the J1 byte. Clocking differences that exceed the normal range of 0 to 782 can cause data loss.
There are positive (PPJC) and negative (NPJC) pointer justification count parameters. PPJC is a count of path-detected (PPJC-Pdet) or path-generated (PPJC-Pgen) positive pointer justifications. NPJC is a count of path-detected (NPJC-Pdet) or path-generated (NPJC-Pgen) negative pointer justifications depending on the specific PM name.
A consistent pointer justification count indicates clock synchronization problems between nodes. A difference between the counts means the node transmitting the original pointer justification has timing variations with the node detecting and transmitting this count. Positive pointer adjustments occur when the frame rate of the POH is too slow in relation to the rate of the VC4.
You must enable PPJC and NPJC performance monitoring parameters for LTE cards. See Table 5-1 for a list of Cisco ONS 15454 SDH LTE cards. In CTC, the count fields for PPJC and NPJC PM parameters appear white and blank unless they are enabled on the card view Provisioning tab.
For detailed information about specific pointer justification count PM parameters, locate the card name in the following sections and review the appropriate definition.
5.4 Performance Monitoring Parameter Definitions
Table 5-2 gives definitions for each type of performance monitoring parameter found in this chapter.
|
|
|
|---|---|
AISS-P |
AIS Seconds Path (AISS-P) is a count of one-second intervals containing one or more alarm indication signal (AIS) defects. |
BBE |
Path Background Block Error (BBE) is an errored block not occurring as part of a severely errored second (SES). |
BBE-PM |
Path Monitoring Background Block Errors (BBE-PM) indicates the number of background block errors recorded in the optical transfer network (OTN) path during the PM time interval. |
BBER |
Path Background Block Error Ratio (BBER) is the ratio of BBE to total blocks in available time during a fixed measurement interval. The count of total blocks excludes all blocks during SESs. |
BBER-PM |
Path Monitoring Background Block Errors Ratio (BBER-PM) indicates the background block errors ratio recorded in the OTN path during the PM time interval. |
BBER-SM |
Section Monitoring Background Block Errors Ratio (BBER-SM) indicates the background block errors ratio recorded in the OTN section during the PM time interval. |
BBE-SM |
Section Monitoring Background Block Errors (BBE-SM) indicates the number of background block errors recorded in the optical transport network (OTN) section during the PM time interval. |
BIE |
The number of bit errors (BIE) corrected in the dense wavelength division multiplexing (DWDM) trunk line during the PM time interval. |
BIT-EC |
The number of Bit Errors Corrected (BIT-EC) in the DWDM trunk line during the PM time interval. |
CGV |
Code Group Violations (CGV) is a count of received code groups that do not contain a start or end delimiter. |
CVCP-P |
Code Violation Path (CVCP-P) is a count of CP-bit parity errors occurring in the accumulation period. |
CVCP-PFE |
Code Violation (CVCP-PFE) is a parameter that is counted when the three far-end block error (FEBE) bits in a M-frame are not all collectively set |
CV-L |
Code Violation Line (CV-L) indicates the number of coding violations occurring on the line. This parameter is a count of BPVs and EXZs occurring over the accumulation period. |
CVP-P |
Code Violation Path (CVP-P) is a code violation parameter for M23 applications. CVP-P is a count of P-bit parity errors occurring in the accumulation period. |
DCG |
Date Code Groups (DCG) is a count of received data code groups that do not contain ordered sets. |
EB |
Path Errored Block (EB) indicates that one or more bits are in error within a block. |
ES |
Path Errored Second (ES) is a one-second period with one or more errored blocks or at least one defect. |
ESCP-P |
Errored Second Path (ESCP-P) is a count of seconds containing one or more CP-bit parity errors, one or more severely errored framing (SEF) defects, or one or more AIS defects. ESCP-P is defined for the C-bit parity application. |
ESCP-PFE |
Far-End Errored Second CP-bit Path (ESCP-PFE) is a count of one-second intervals containing one or more M-frames with the three FEBE bits not all collectively set to 1 or one or more far-end SEF/AIS defects. |
ES-L |
Errored Seconds Line (ES-L) is a count of the seconds containing one or more anomalies (BPV + EXZ) and/or defects (loss of signal) on the line. |
ES-P |
Path Errored Second (ES-P) is a one-second period with at least one defect. |
ES-PM |
Path Monitoring Errored Seconds (ES-PM) indicates the errored seconds recorded in the OTN path during the PM time interval. |
ESP-P |
Errored Second Path (ESP-P) is a count of seconds containing one or more P-bit parity errors, one or more SEF defects, or one or more AIS defects. |
ESR |
Path Errored Second Ratio (ESR) is the ratio of errored seconds to total seconds in available time during a fixed measurement interval. |
ESR-P |
Path Errored Second Ratio (ESR-P) is the ratio of errored seconds to total seconds in available time during a fixed measurement interval. |
ESR-PM |
Path Monitoring Errored Seconds Ratio (ESR-PM) indicates the errored seconds ratio recorded in the OTN path during the PM time interval. |
ESR-SM |
Section Monitoring Errored Seconds Ratio (ESR-SM) indicates the errored seconds ratio recorded in the OTN section during the PM time interval. |
ES-SM |
Section Monitoring Errored Seconds (ES-SM) indicates the errored seconds recorded in the OTN section during the PM time interval. |
FC-PM |
Path Monitoring Failure Counts (FC-PM) indicates the failure counts recorded in the OTN path during the PM time interval. |
FC-SM |
Section Monitoring Failure Counts (FC-SM) indicates the failure counts recorded in the OTN section during the PM time interval. |
HP-BBE |
High-Order Path Background Block Error (HP-BBE) is an errored block not occurring as part of an SES. |
HP-BBER |
High-Order Path Background Block Error Ratio (HP-BBER) is the ratio of BBE to total blocks in available time during a fixed measurement interval. The count of total blocks excludes all blocks during SESs. |
HP-EB |
High-Order Path Errored Block (HP-EB) indicates that one or more bits are in error within a block. |
HP-ES |
High-Order Path Errored Second (HP-ES) is a one-second period with one or more errored blocks or at least one defect. |
HP-ESR |
High-Order Path Errored Second Ratio (HP-ESR) is the ratio of errored seconds to total seconds in available time during a fixed measurement interval. |
HP-NPJC-Pdet |
High-Order, Negative Pointer Justification Count, Path Detected (HP-NPJC-Pdet) is a count of the negative pointer justifications detected on a particular path on an incoming SDH signal. |
HP-NPJC-Pgen |
High-Order, Negative Pointer Justification Count, Path Generated (HP-NPJC-Pgen) is a count of the negative pointer justifications generated for a particular path. |
HP-PJCDiff |
High-Order Path Pointer Justification Count Difference (HP-PJCDiff) is the absolute value of the difference between the total number of detected pointer justification counts and the total number of generated pointer justification counts. That is, HP-PJCDiff is equal to |
HP-PJCS-Pdet |
High-Order Path Pointer Justification Count Seconds (HP-PJCS-PDet) is a count of the one-second intervals containing one or more HP-PPJC-PDet or HP-NPJC-PDet. |
HP-PJCS-Pgen |
High-Order Path Pointer Justification Count Seconds (HP-PJCS-PGen) is a count of the one-second intervals containing one or more HP-PPJC-PGen or HP-NPJC-PGen. |
HP-PPJC-Pdet |
High-Order, Positive Pointer Justification Count, Path Detected (HP-PPJC-Pdet) is a count of the positive pointer justifications detected on a particular path on an incoming SDH signal. |
HP-PPJC-Pgen |
High-Order, Positive Pointer Justification Count, Path Generated (HP-PPJC-Pgen) is a count of the positive pointer justifications generated for a particular path. |
HP-SES |
High-Order Path Severely Errored Seconds (HP-SES) is a one-second period containing 30 percent or more errored blocks or at least one defect. SES is a subset of ES. |
HP-SESR |
High-Order Path Severely Errored Second Ratio (HP-SESR) is the ratio of SES to total seconds in available time during a fixed measurement interval. |
HP-UAS |
High-Order Path Unavailable Seconds (HP-UAS) is a count of the seconds when the VC path was unavailable. A high-order path becomes unavailable when ten consecutive seconds occur that qualify as HP-SESs, and it continues to be unavailable until ten consecutive seconds occur that do not qualify as HP-SESs. |
IOS |
Idle Ordered Sets (IOS) is a count of received packets containing idle ordered sets. |
IPC |
A count of received packets that contain errored data code groups that have start and end delimiters. |
LBC-MIN |
LBC-MIN is the minimum percentage of Laser Bias Current. |
LBC-AVG |
Laser Bias Current—Average (LBC-AVG) is the average percentage of laser bias current. |
LBC-MAX |
Laser Bias Current—Maximum (LBC-MAX) is the maximum percentage of laser bias current. |
LBC-MIN |
Laser Bias Current—Minimum (LBC-MIN) is the minimum percentage of laser bias current. |
LOSS-L |
Line Loss of Signal Seconds (LOSS-L) is a count of one-second intervals containing one or more LOS defects. |
LP-BBE |
Low-Order Path Background Block Error (LP-BBE) is an errored block not occurring as part of an SES. |
LP-BBER |
Low-Order Path Background Block Error Ratio (LP-BBER) is the ratio of BBE to total blocks in available time during a fixed measurement interval. The count of total blocks excludes all blocks during SESs. |
LP-EB |
Low-Order Path Errored Block (LP-EB) indicates that one or more bits are in error within a block. |
LP-ES |
Low-Order Path Errored Second (LP-ES) is a one-second period with one or more errored blocks or at least one defect. |
LP-ESR |
Low-Order Path Errored Second Ratio (LP-ESR) is the ratio of errored seconds to total seconds in available time during a fixed measurement interval. |
LP-SES |
Low-Order Path Severely Errored Seconds (LP-SES) is a one-second period containing greater than or equal to 30 percent errored blocks or at least one defect. SES is a subset of ES. |
LP-SESR |
Low-Order Path Severely Errored Second Ratio (LP-SESR) is the ratio of SES to total seconds in available time during a fixed measurement interval. |
LP-UAS |
Low-Order Path Unavailable Seconds (LP-UAS) is a count of the seconds when the VC path was unavailable. A low-order path becomes unavailable when ten consecutive seconds occur that qualify as LP-SESs, and it continues to be unavailable until ten consecutive seconds occur that do not qualify as LP-SESs. |
MS-BBE |
Multiplex Section Background Block Error (MS-BBE) is an errored block not occurring as part of an SES. |
MS-BBER |
Multiplex Section Background Block Error Ratio (MS-BBER) is the ratio of BBE to total blocks in available time during a fixed measurement interval. The count of total blocks excludes all blocks during SESs. |
MS-EB |
Multiplex Section Errored Block (MS-EB) indicates that one or more bits are in error within a block. |
MS-ES |
Multiplex Section Errored Second (MS-ES) is a one-second period with one or more errored blocks or at least one defect. |
MS-ESR |
Multiplex Section Errored Second Ratio (MS-ESR) is the ratio of errored seconds to total seconds in available time during a fixed measurement interval. |
MS-NPJC-Pdet |
Multiplex Section Negative Pointer Justification Count, Path Detected (MS-NPJC-Pdet) is a count of the negative pointer justifications detected on a particular path on an incoming SDH signal. |
MS-NPJC-Pgen |
Multiplex Section Negative Pointer Justification Count, Path Generated (MS-NPJC-Pgen) is a count of the negative pointer justifications generated for a particular path. |
MS-PPJC-Pdet |
Multiplex Section Positive Pointer Justification Count, Path Detected (MS-PPJC-Pdet) is a count of the positive pointer justifications detected on a particular path on an incoming SDH signal. |
MS-PPJC-Pgen |
Multiplex Section Positive Pointer Justification Count, Path Generated (MS-PPJC-Pgen) is a count of the positive pointer justifications generated for a particular path. |
MS-PSC (1+1 protection) |
In a 1+1 protection scheme for a working card, Multiplex Section Protection Switching Count (MS-PSC) is a count of the number of times service switches from a working card to a protection card plus the number of times service switches back to the working card. For a protection card, MS-PSC is a count of the number of times service switches to a working card from a protection card plus the number of times service switches back to the protection card. The MS-PSC PM is only applicable if revertive line-level protection switching is used. |
MS-PSC1 (MS-SPRing) |
For a protect line in a two-fiber multiplex section-shared protection ring (MS-SPRing), Multiplex Section Protection Switching Count (MS-PSC) refers to the number of times a protection switch has occurred either to a particular span's line protection or away from a particular span's line protection. Therefore, if a protection switch occurs on a two-fiber MS-SPRing, the MS-PSC of the protection span to which the traffic is switched will increment, and when the switched traffic returns to its original working span from the protect span, the MS-PSC of the protect span will increment again. |
MS-PSC-R1 |
In a four-fiber MS-SPRing, Multiplex Section Protection Switching Count-Ring (MS-PSC-R) is a count of the number of times service switches from a working line to a protection line plus the number of times it switches back to a working line. A count is only incremented if ring switching is used. |
MS-PSC-S |
In a four-fiber MS-SPRing, Multiplex Section Protection Switching Count-Span (MS-PSC-S) is a count of the number of times service switches from a working line to a protection line plus the number of times it switches back to the working line. A count is only incremented if span switching is used. |
MS-PSC-W |
For a working line in a two-fiber MS-SPRing, Multiplex Section Protection Switching Count-Working (MS-PSC-W) is a count of the number of times traffic switches away from the working capacity in the failed line and back to the working capacity after the failure is cleared. MS-PSC-W increments on the failed working line and MS-PSC increments on the active protect line. For a working line in a four-fiber MS-SPRing, MS-PSC-W is a count of the number of times service switches from a working line to a protection line plus the number of times it switches back to the working line. MS-PSC-W increments on the failed line and MS-PSC-R or MS-PSC-S increments on the active protect line. |
MS-PSD |
Multiplex Section Protection Switching Duration (MS-PSD) applies to the length of time, in seconds, that service is carried on another line. For a working line, MS-PSD is a count of the number of seconds that service was carried on the protection line. For the protection line, MS-PSD is a count of the seconds that the line was used to carry service. The MS-PSD PM is only applicable if revertive line-level protection switching is used. MS-PSD increments on the active protect line and MS-PSD-W increments on the failed working line. |
MS-PSD-R |
In a four-fiber MS-SPRing, Multiplex Section Protection Switching Duration-Ring (MS-PSD-R) is a count of the seconds that the protection line was used to carry service. A count is only incremented if ring switching is used. |
MS-PSD-S |
In a four-fiber MS-SPRing, Multiplex Section Protection Switching Duration-Span (MS-PSD-S) is a count of the seconds that the protection line was used to carry service. A count is only incremented if span switching is used. |
MS-PSD-W |
For a working line in a two-fiber MS-SPRing, Multiplex Section Protection Switching Duration-Working (MS-PSD-W) is a count of the number of seconds that service was carried on the protection line. MS-PSD-W increments on the failed working line and PSD increments on the active protect line. |
MS-SES |
Multiplex Section Severely Errored Second (MS-SES) is a one-second period which contains 30 percent or more errored blocks or at least one defect. SES is a subset of ES. For more information, refer to ITU-T G.829 Section 5.1.3. |
MS-SESR |
Multiplex Section Severely Errored Second ratio (MS-SESR) is the ratio of SES to total seconds in available time during a fixed measurement interval. |
MS-UAS |
Multiplex Section Unavailable Seconds (MS-UAS) is a count of the seconds when the section was unavailable. A section becomes unavailable when ten consecutive seconds occur that qualify as MS-SESs, and it continues to be unavailable until ten consecutive seconds occur that do not qualify as MS-SESs. When the condition is entered, MS-SESs decrement and then count toward MS-UAS. |
NIOS |
Non-Idle Ordered Sets (NIOS) is a count of received packets containing non-idle ordered sets. |
OPR |
Optical Power Received (OPR) is the measure of average optical power received as a percentage of the nominal OPT. |
OPR-AVG |
Average Receive Optical Power (dBm). |
OPR-MAX |
Maximum Receive Optical Power (dBm). |
OPR-MIN |
Minimum Receive Optical Power (dBm). |
OPT |
Optical Power Transmitted (OPT) is the measure of average optical power transmitted as a percentage of the nominal OPT. |
OPT-AVG |
Average Transmit Optical Power (dBm). |
OPT-MAX |
Maximum Transmit Optical Power (dBm). |
OPT-MIN |
Minimum Transmit Optical Power (dBm). |
RS-BBE |
Regenerator Section Background Block Error (RS-BBE) is an errored block not occurring as part of an SES. |
RS-BBER |
Regenerator Section Background Block Error Ratio (RS-BBER) is the ratio of BBE to total blocks in available time during a fixed measurement interval. The count of total blocks excludes all blocks during SESs. |
RS-EB |
Regenerator Section Errored Block (RS-EB) indicates that one or more bits are in error within a block. |
RS-ES |
Regenerator Section Errored Second (RS-ES) is a one-second period with one or more errored blocks or at least one defect. |
RS-ESR |
Regenerator Section Errored Second Ratio (RS-ESR) is the ratio of errored seconds to total seconds in available time during a fixed measurement interval. |
RS-SES |
Regenerator Section Severely Errored Second (RS-SES) is a one-second period which contains 30 percent or more errored blocks or at least one defect. SES is a subset of ES. |
RS-SESR |
Regenerator Section Severely Errored Second Ratio (RS-SESR) is the ratio of SES to total seconds in available time during a fixed measurement interval. |
RS-UAS |
Regenerator Section Unavailable Second (RS-UAS) is a count of the seconds when the regenerator section was unavailable. A section becomes unavailable when ten consecutive seconds occur that qualify as RS-UASs, and it continues to be unavailable until ten consecutive seconds occur that do not qualify as RS-UASs. |
Rx AISS-P |
Receive Path Alarm Indication Signal Seconds (AISS-P) means that an alarm indication signal occurred on the receive end of the path. This parameter is a count of seconds containing one or more AIS defects. |
Rx BBE-P |
Receive Path Background Block Error (BBE-P) is an errored block not occurring as part of an SES. |
Rx EB-P |
Receive Path Errored Block (EB-P) indicates that one or more bits are in error within a block. |
Rx ES-P |
Receive Path Errored Second (ES-P) is a one-second period with one or more errored blocks or at least one defect. |
Rx ESR-P |
Receive Path Errored Second Ratio (ESR-P) is the ratio of errored seconds to total seconds in available time during a fixed measurement interval. |
Rx SES-P |
Receive Path Severely Errored Seconds (SES-P) is a one-second period containing 30 percent or more errored blocks or at least one defect; SES is a subset of ES. |
Rx SESR-P |
Receive Path Severely Errored Second Ratio (SESR-P) is the ratio of SES to total seconds in available time during a fixed measurement interval. |
Rx UAS-P |
Receive Path Unavailable Seconds (UAS-P) is a count of one-second intervals when the E-1 path is unavailable on the signal receive end. The E-1 path is unavailable when ten consecutive SESs occur. The ten SESs are included in unavailable time. After the E-1 path becomes unavailable, it becomes available when ten consecutive seconds occur with no SESs. The ten seconds with no SESs are excluded from unavailable time. |
Rx BBER-P |
Receive Path Background Block Error Ratio (BBER-P) is the ratio of BBE to total blocks in available time during a fixed measurement interval. The count of total blocks excludes all blocks during SESs. |
SASCP-P |
SEF/AIS Second (SASCP-P) is a count of one-second intervals containing one or more near-end SEF/AIS defects. |
SASP-P |
SEF/AIS Seconds Path (SASP-P) is a count of one-second intervals containing one or more SEFs or one or more AIS defects on the path. |
SES |
Severely Errored Seconds (SES) is a one-second period containing 30 percent or more errored blocks or at least one defect. SES is a subset of ES. |
SESCP-P |
Severely Errored Seconds CP-bit Path (SESCP-P) is a count of seconds containing more than 44 CP-bit parity errors, one or more SEF defects, or one or more AIS defects. |
SESCP-PFE |
Severely Errored Seconds CP-bit Path Far End (SESCP-PFE) is a count of one-second intervals containing one or more 44 M-frames with the three FEBE bits not all collectively set to 1, or with one or more far-end SEF/AIS defects. |
SES-L |
Severely Errored Seconds Line (SES-L) is a count of the seconds containing more than a particular quantity of anomalies (BPV + EXZ > 44) and/or defects on the line. |
SES-P |
Severely Errored Seconds Path (SES-P) is a one-second period containing at least one defect. SES-P is a subset of ES-P. |
SES-PFE |
Far-End Path Severely Errored Seconds (SES-PFE) is a one-second period containing at least one defect. SES-PFE is a subset of ES-PFE. |
SES-PM |
Path Monitoring Severely Errored Seconds (SES-PM) indicates the severely errored seconds recorded in the OTN path during the PM time interval. |
SESP-P |
Severely Errored Seconds Path (SESP-P) is a count of seconds containing more than 44 P-bit parity violations, one or more SEF defects, or one or more AIS defects. |
SESR-P |
Path Severely Errored Second Ratio (SESR-P) is the ratio of SES to total seconds in available time during a fixed measurement interval. |
SESR-PM |
Path Monitoring Severely Errored Seconds Ratio (SESR-PM) indicates the severely errored seconds ratio recorded in the OTN path during the PM time interval. |
SES-SM |
Section Monitoring Severely Errored Seconds (SES-SM) indicates the severely errored seconds recorded in the OTN section during the PM time interval. |
Tx AISS-P |
Transmit Path Alarm Indication Signal (AISS-P) means that an alarm indication signal occurred on the transmit end of the path. This parameter is a count of seconds containing one or more AIS defects. |
Tx BBE-P |
Transmit Path Background Block Error (BBE-P) is an errored block not occurring as part of an SES. |
Tx ES-P |
Transmit Path Errored Second (ES-P) is a one-second period with one or more errored blocks or at least one defect. |
Tx ESR-P |
Transmit Path Errored Second Ratio (ESR-P) is the ratio of errored seconds to total seconds in available time during a fixed measurement interval. |
Tx SES-P |
Transmit Path Severely Errored Seconds (SES-P) is a one-second period containing 30 percent or more errored blocks or at least one defect; SES is a subset of ES. |
Tx SESR-P |
Transmit Path Severely Errored Second Ratio (SESR-P) is the ratio of SES to total seconds in available time during a fixed measurement interval. |
Tx UAS-P |
Transmit Path Unavailable Seconds (UAS-P) is a count of one-second intervals when the E-1 path is unavailable on the transmit end of the signal. The E-1 path is unavailable when ten consecutive SESs occur. The ten SESs are included in unavailable time. After the E-1 path becomes unavailable, it becomes available when ten consecutive seconds occur with no SESs. The ten seconds with no SESs are excluded from unavailable time. |
Tx BBER-P |
Transmit Path Background Block Error Ratio (BBER-P) is the ratio of BBE to total blocks in available time during a fixed measurement interval. The count of total blocks excludes all blocks during SESs. |
Tx EB-P |
Transmit Path Errored Block (EB-P) indicates that one or more bits are in error within a block. |
UAS |
Path Unavailable Seconds (UAS) is a count of the seconds when the VC path was unavailable. A high-order path becomes unavailable when ten consecutive seconds occur that qualify as HP-SESs, and it continues to be unavailable until ten consecutive seconds occur that do not qualify as HP-SESs. |
UASCP-P |
Unavailable Seconds CP-bit Path (UASCP-P) is a count of one-second intervals when the DS-3 path is unavailable. A DS-3 path becomes unavailable when ten consecutive SESCP-Ps occur. The ten SESCP-Ps are included in unavailable time. After the DS-3 path becomes unavailable, it becomes available when ten consecutive seconds with no SESCP-Ps occur. The ten seconds with no SESCP-Ps are excluded from unavailable time. |
UASCP-PFE |
Unavailable Seconds CP-bit Far End Path (UASCP-PFE) is a count of one-second intervals when the DS-3 path becomes unavailable. A DS-3 path becomes unavailable when ten consecutive far-end CP-bit SESs occur. The ten CP-bit SESs are included in unavailable time. After the DS-3 path becomes unavailable, it becomes available when ten consecutive seconds occur with no CP-bit SESs. The ten seconds with no CP-bit SESs are excluded from unavailable time. |
UAS-P |
Path Unavailable Seconds (UAS-P) is a count of the seconds when the path was unavailable. A path becomes unavailable when ten consecutive seconds occur that qualify as P-SESs, and it continues to be unavailable until ten consecutive seconds occur that do not qualify as P-SESs. |
UAS-PFE |
Far-End Path Unavailable Seconds (UAS-PFE) is a count of the seconds when the path was unavailable. A path becomes unavailable when ten consecutive seconds occur that qualify as P-SESs, and it continues to be unavailable until ten consecutive seconds occur that do not qualify as P-SESs. |
UAS-PM |
Path Monitoring Unavailable Seconds (UAS-PM) indicates the unavailable seconds recorded in the OTN path during the PM time interval. |
UASP-P |
Unavailable Second Path (UASP-P) is a count of one-second intervals when the DS-3 path is unavailable. A DS3 path becomes unavailable when ten consecutive SESP-Ps occur. The ten SESP-Ps are included in unavailable time. After the DS-3 path becomes unavailable, it becomes available when ten consecutive seconds with no SESP-Ps occur. The ten seconds with no SESP-Ps are excluded from unavailable time. |
UAS-SM |
Section Monitoring Unavailable Seconds (UAS-SM) indicates the unavailable seconds recorded in the OTN section during the PM time interval. |
UNC-WORDS |
The number of uncorrectable words detected in the DWDM trunk line during the PM time interval. |
VPC |
A count of received packets that contain non-errored data code groups that have start and end delimiters. |
1 4-fiber MS-SPRing is not supported on the STM-4 and STM4 SH 1310-4 cards; therefore, the MS-PSC-S and MS-PSC-R PM parameters do not increment. |
5.5 Performance Monitoring for Electrical Cards
The following sections define performance monitoring parameters for the E1-N-14, E1-42, E3-12, and DS3i-N-12 electrical cards.
5.5.1 E1-N-14 Card and E1-42 Card Performance Monitoring Parameters
Figure 5-1 shows the signal types that support near-end and far-end PM parameters for the E1-N-14 card and the E1-42 card.
Figure 5-1 Monitored Signal Types for the E1-N-14 Card and E1-42 Card
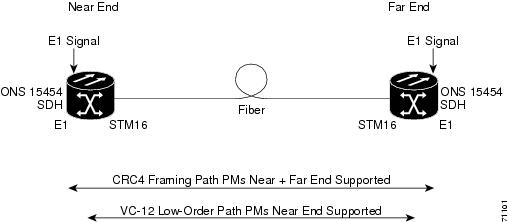
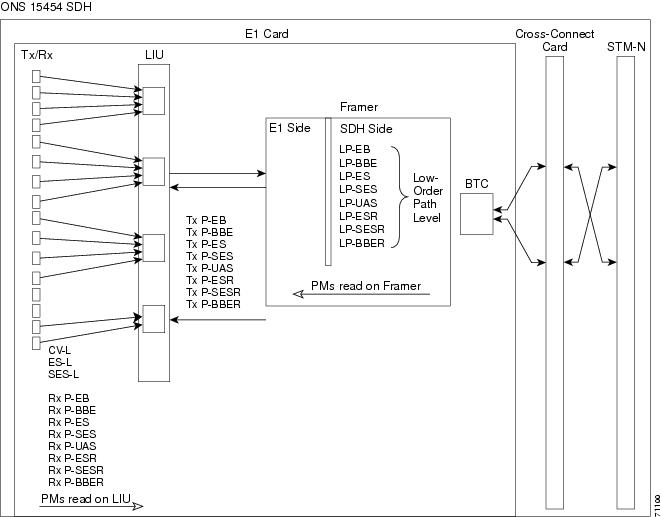
Figure 5-2 shows where overhead bytes detected on the application-specific integrated circuits (ASICs) produce performance monitoring parameters for the E1-N-14 card.
Note ![]() The E1-42 card uses the same PM read points. The only difference from Figure 5-2 is that the number of ports on the E1-42 equal 42.
The E1-42 card uses the same PM read points. The only difference from Figure 5-2 is that the number of ports on the E1-42 equal 42.
Figure 5-2 PM Read Points on the E1-N-14 Card
The PM parameters for the E1-N-14 card and E1-42 card are listed in Table 5-3. The parameters are defined in Table 5-2.
|
|
|
|
|
|---|---|---|---|
CV-L |
AISS-P |
LP-EB |
AISS-PFE |
1 SDH path PMs do not increment unless IPPM is enabled. See the "Intermediate-Path Performance Monitoring" section. 2 Transmit and receive CEPT and CRC4 framing path PM parameters for the near-end and far-end E1-N-14 and E1-42 cards. 3 Under the Provisioning > Threshold tab, the E1-N-14 card and the E1-42 card have user-defined thresholds for the E-1 Rx path PM parameters. In the Threshold tab, they are displayed as EB, BBE, ES, SES, and UAS without the Rx prefix. |
5.5.2 E3-12 Card Performance Monitoring Parameters
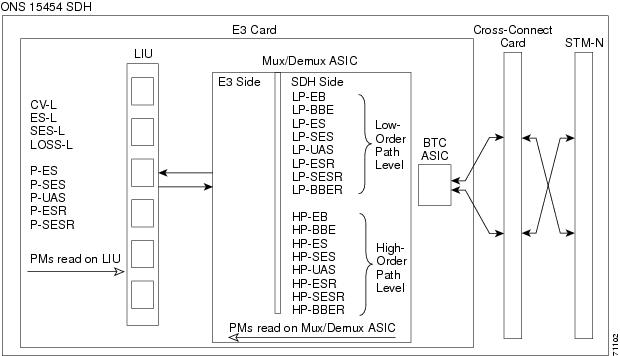
Figure 5-3 shows the signal types that support near-end and far-end PM parameters for the E3-12 card. Figure 5-4 shows where overhead bytes detected on the ASICs produce performance monitoring parameters for the E3-12 card.
Figure 5-3 Monitored Signal Types for the E3-12 Card
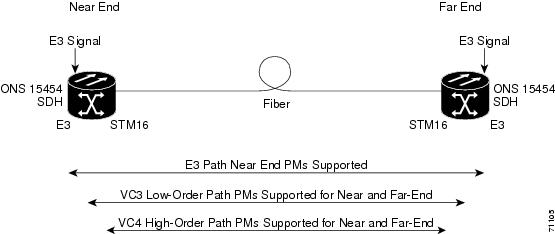
Figure 5-4 PM Read Points on the E3-12 Card
The PM parameters for the E3-12 card are listed in Table 5-4. The parameters are defined in Table 5-2.
5.5.3 DS3i-N-12 Card Performance Monitoring Parameters
Figure 5-5 shows the signal types that support near-end and far-end PM parameters for the DS3i-N-12 card. Figure 5-6 shows where overhead bytes detected on the ASICs produce performance monitoring parameters for the DS3i-N-12 card.
Figure 5-5 Monitored Signal Types for the DS3i-N-12 Card
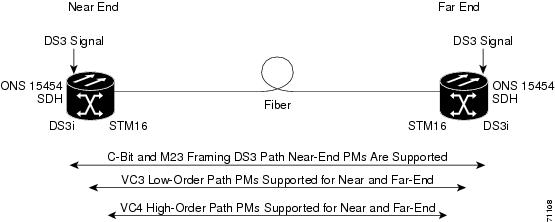
Figure 5-6 PM Read Points on the DS3i-N-12 Card
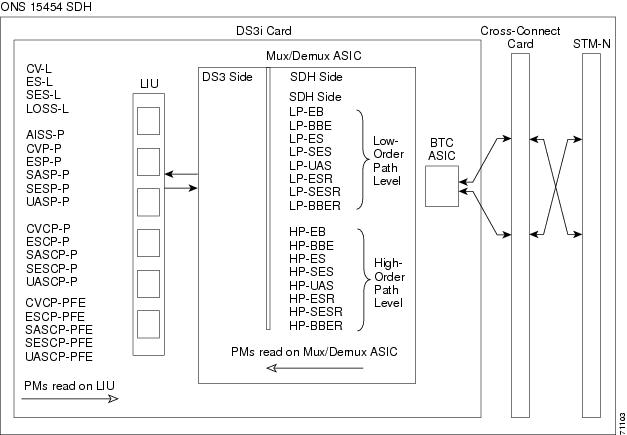
The PM parameters for the DS3i-N-12 card are listed in Table 5-5. The parameters are defined in Table 5-2.
|
|
|
|
|
|
|---|---|---|---|---|
CV-L |
AISS-P |
CVCP-PFE |
LP-BBE |
HP-BBE |
1 C-Bit and M23 framing path PM parameters 2 The C-bit PMs (PMs that contain the text "CP-P") are applicable only if line format is C-bit. 3 DS3i-N-12 cards support SAS-P only on the Rx path. |
5.6 Performance Monitoring for Ethernet Cards
The following sections define performance monitoring parameters and definitions for the E-Series, G-Series, and ML-Series Ethernet cards.
5.6.1 E-Series Ethernet Card Performance Monitoring Parameters
CTC provides Ethernet performance information, including line-level parameters, port bandwidth consumption, and historical Ethernet statistics. The E-Series Ethernet performance information is divided into the Statistics, Utilization, and History tabbed windows within the card view Performance tab window. The following sections describe PM parameters provided for the E100T-G and E1000-2 Ethernet cards.
5.6.1.1 E-Series Ethernet Statistics Window
The Ethernet statistics window lists Ethernet parameters at the line level. The Statistics window provides buttons to change the statistical values shown. The Baseline button resets the displayed statistics values to zero. The Refresh button manually refreshes statistics. Auto-Refresh sets a time interval at which automatic refresh occurs.
Table 5-6 defines the E-Series Ethernet card statistics parameters.
5.6.1.2 E-Series Ethernet Utilization Window
The Utilization window shows the percentage of transmit (Tx) and receive (Rx) line bandwidth used by the Ethernet ports during consecutive time segments. The Mode field displays the real-time mode status, such as "100 Full," which is the mode setting configured on the E-Series port. However, if the E-Series port is set to autonegotiate the mode (Auto), this field shows the result of the link negotiation between the E-Series and the peer Ethernet device attached directly to the E-Series port.
The Utilization window provides an Interval menu that enables you to set time intervals of 1 minute, 15 minutes, 1 hour, and 1 day. Line utilization is calculated with the following formulas:
Rx = (inOctets + inPkts * 20) * 8 / 100% interval * maxBaseRate
Tx = (outOctets + outPkts * 20) * 8 / 100% interval * maxBaseRate
The interval is defined in seconds. The maxBaseRate is defined by raw bits per second in one direction for the Ethernet port (that is, 1 Gbps). STS circuit maxBaseRates are shown in Table 5-7.
|
|
|
|---|---|
VC3 |
51840000 |
VC4 |
155000000 |
VC42C |
311000000 |
VC44C |
622000000 |
Note ![]() Line utilization numbers express the average of ingress and egress traffic as a percentage of capacity.
Line utilization numbers express the average of ingress and egress traffic as a percentage of capacity.
Note ![]() The E-Series Ethernet card is a Layer 2 device or switch and supports Trunk Utilization statistics. The Trunk Utilization statistics are similar to the Line Utilization statistics, but shows the percentage of circuit bandwidth used rather than the percentage of line bandwidth used. The Trunk Utilization statistics are accessed through the card view Maintenance tab.
The E-Series Ethernet card is a Layer 2 device or switch and supports Trunk Utilization statistics. The Trunk Utilization statistics are similar to the Line Utilization statistics, but shows the percentage of circuit bandwidth used rather than the percentage of line bandwidth used. The Trunk Utilization statistics are accessed through the card view Maintenance tab.
5.6.1.3 E-Series Ethernet History Window
The Ethernet History window lists past Ethernet statistics for the previous time intervals. Depending on the selected time interval, the History window displays the statistics for each port for the number of previous time intervals as shown in Table 5-8. The parameters are defined in Table 5-6.
5.6.2 G-Series Ethernet Card Performance Monitoring Parameters
CTC provides Ethernet performance information, including line-level parameters, port bandwidth consumption, and historical Ethernet statistics. The G-Series Ethernet performance information is divided into the Statistics, Utilization, and History tabbed windows within the card view Performance tab window. The following sections describe PM parameters provided for the G1000-4 and G1K-4 Ethernet cards.
5.6.2.1 G-Series Ethernet Statistics Window
The Ethernet Statistics window lists Ethernet parameters at the line level. The Statistics window provides buttons to change the statistical values shown. The Baseline button resets the displayed statistics values to zero. The Refresh button manually refreshes statistics. Auto-Refresh sets a time interval at which automatic refresh occurs. The G-Series Statistics window also has a Clear button. The Clear button sets the values on the card to zero, but does not reset the G-Series card.
Table 5-9 defines the G-Series Ethernet card statistics parameters.
5.6.2.2 G-Series Ethernet Utilization Window
The Utilization window shows the percentage of Tx and R) line bandwidth used by the Ethernet ports during consecutive time segments. The Mode field displays the real-time mode status, such as "100 Full," which is the mode setting configured on the G-Series port. However, if the G-Series port is set to autonegotiate the mode (Auto), this field shows the result of the link negotiation between the G-Series and the peer Ethernet device attached directly to the G-Series port.
The Utilization window provides an Interval menu that enables you to set time intervals of 1 minute, 15 minutes, 1 hour, and 1 day. Line utilization is calculated with the following formulas:
Rx = (inOctets + inPkts * 20) * 8 / 100% interval * maxBaseRate
Tx = (outOctets + outPkts * 20) * 8 / 100% interval * maxBaseRate
The interval is defined in seconds. The maxBaseRate is defined by raw bits per second in one direction for the Ethernet port (that is, 1 Gbps). The maxBaseRate for G-Series VC is shown in Table 5-7.
Note ![]() Line utilization numbers express the average of ingress and egress traffic as a percentage of capacity.
Line utilization numbers express the average of ingress and egress traffic as a percentage of capacity.
Note ![]() Unlike E-Series cards, G-Series cards do not have a display of Trunk Utilization statistics, because G-Series cards are not Layer 2 devices.
Unlike E-Series cards, G-Series cards do not have a display of Trunk Utilization statistics, because G-Series cards are not Layer 2 devices.
5.6.2.3 G-Series Ethernet History Window
The Ethernet History window lists past Ethernet statistics for the previous time intervals. Depending on the selected time interval, the History window displays the statistics for each port for the number of previous time intervals as shown in Table 5-8. The parameters are defined in Table 5-9.
5.6.3 ML-Series Ethernet Card Performance Monitoring Parameters
CTC provides Ethernet performance information for line-level parameters and historical Ethernet statistics. The ML-Series Ethernet performance information is divided into the Ether Ports and Packet over SONET/SDH (POS) Ports tabbed windows within the card view Performance tab window. The following sections describe PM parameters provided for the ML100T-12 and ML1000-2 Ethernet cards.
5.6.3.1 ML-Series Ether Ports Parameters
The Ether Ports window lists Ethernet PM parameter values for each Ethernet port on the card. Auto-Refresh sets a time interval at which automatic refresh will occur. The PM values are a snapshot captured at the time intervals selected in the Auto-Refresh field. Historical PM values are not stored or displayed.
Table 5-10 defines the ML-Series Ethernet card Ether Ports PM parameters.
5.6.3.2 ML-Series POS Ports Parameters
The POS Ports window lists PM parameter values for each POS port on the card. The parameters displayed depend on the framing mode employed by the ML-Series card. The two framing modes for the POS port on the ML-Series card are HDLC and frame-mapped generic framing procedure (GFP-F). For more information on provisioning a framing mode, refer to the Cisco ONS 15454 SDH Procedure Guide.
Auto-Refresh sets a time interval at which automatic refresh will occur. The PM values are a snapshot captured at the time intervals selected in the Auto-Refresh field. Historical PM values are not stored or displayed.
Table 5-11 defines the ML-Series Ethernet card POS Ports parameters for HDLC mode.
Table 5-12 defines the ML-Series Ethernet card POS Ports parameters for GFP-F mode.
5.6.4 CE-Series Ethernet Card Performance Monitoring Parameters
CTC provides Ethernet performance information for line-level parameters and historical Ethernet statistics. The CE-Series Ethernet performance information is divided into the Ether Ports and POS Ports tabbed windows within the card view Performance tab window. The following sections describe PM parameters provided for the CE-100T-8 Ethernet card.
5.6.4.1 CE-Series Ether Ports Statistics Parameters
The Ethernet Ether Ports Statistics window lists Ethernet parameters at the line level. The Statistics window provides buttons to change the statistical values shown. The Baseline button resets the displayed statistics values to zero. The Refresh button manually refreshes statistics. Auto-Refresh sets a time interval at which automatic refresh occurs. The CE-Series Statistics window also has a Clear button. The Clear button sets the values on the card to zero, but does not reset the CE-Series card.
During each automatic cycle, whether auto-refreshed or manually refreshed (using the Refresh button), statistics are added cumulatively and are not immediately adjusted to equal total received packets until testing ends. To see the final PM count totals, allow a few moments for the PM window statistics to finish testing and update fully. PM counts are also listed in the CE-Series card Performance > History window.
Table 5-13 defines the CE-Series Ethernet card Ether Ports PM parameters.
5.6.4.2 CE-Series Card Ether Ports Utilization Parameters
The Ether Ports Utilization window shows the percentage of Tx and Rx line bandwidth used by the Ethernet ports during consecutive time segments. The Utilization window provides an Interval menu that enables you to set time intervals of 1 minute, 15 minutes, 1 hour, and 1 day. Line utilization is calculated with the following formulas:
Rx = (inOctets + inPkts * 20) * 8 / 100% interval * maxBaseRate
Tx = (outOctets + outPkts * 20) * 8 / 100% interval * maxBaseRate
The interval is defined in seconds. The maxBaseRate is defined by raw bits per second in one direction for the Ethernet port (that is, 1 Gbps). The maxBaseRate for CE-Series Ethernet cards is shown in Table 5-7.
5.6.4.3 CE-Series Card Ether Ports History Parameters
The Ethernet Ether Ports History window lists past Ethernet statistics for the previous time intervals. Depending on the selected time interval, the History window displays the statistics for each port for the number of previous time intervals as shown in Table 5-8. The parameters are those defined in Table 5-13.
5.6.4.4 CE-Series POS Ports Statistics Parameters
The Ethernet POS Ports statistics window lists Ethernet POS parameters at the line level. Table 5-14 defines the CE-Series Ethernet card POS Ports parameters.
5.6.4.5 CE-Series Card POS Ports Utilization Parameters
The POS Ports Utilization window shows the percentage of Tx and Rx line bandwidth used by the POS ports during consecutive time segments. The Utilization window provides an Interval menu that enables you to set time intervals of 1 minute, 15 minutes, 1 hour, and 1 day. Line utilization is calculated with the following formulas:
Rx = (inOctets * 8) / (interval * maxBaseRate)
Tx = (outOctets * 8) / (interval * maxBaseRate)
The interval is defined in seconds. The maxBaseRate is defined by raw bits per second in one direction for the Ethernet port (that is, 1 Gbps). The maxBaseRate for CE-Series cards is shown in Table 5-7.
Note ![]() Line utilization numbers express the average of ingress and egress traffic as a percentage of capacity.
Line utilization numbers express the average of ingress and egress traffic as a percentage of capacity.
5.6.4.6 CE-Series Card Ether Ports History Parameters
The Ethernet POS Ports History window lists past Ethernet POS Ports statistics for the previous time intervals. Depending on the selected time interval, the History window displays the statistics for each port for the number of previous time intervals as shown in Table 5-14. The parameters are defined in Table 5-8.
5.7 Performance Monitoring for Optical Cards
The following sections define performance monitoring parameters and definitions for the OC3 IR 4/STM1 SH 1310 card, the OC3 IR/STM1 SH 1310-8 card, the OC12 IR/STM4 SH 1310, OC12 LR/STM4 LH 1310 card, the OC12 LR/STM4 LH 1550 card, the OC12 IR/STM4 SH 1310-4 card, the OC48 IR/STM16 SH AS 1310 card, OC48 LR/STM16 LH AS 1550 card, the OC48 ELR/STM16 EH 100 GHz card, the OC192 SR/STM64 IO 1310 card, the OC192 IR/STM64 SH 1550 card, OC192 LR/STM 64 LH 1550 card, the OC192 LR/STM64 LH ITU 15xx.xx, OC192 SR1/STM64IO Short Reach card, and the OC192/STM64 Any Reach card.
On all STM-N optical cards, errors are calculated in bits instead of blocks for B1 and B3. This means there could possibly be a slight difference between what is inserted and what is reported on CTC. In STM4, for example, there are approximately 15,000 to 30,000 bits per block (per ITU-T-G.826). If there were two bit errors within that block, the standard would require reporting one block error whereas the STM-N cards would have reported two bit errors.
When a tester inputs only single errors during testing, this issue would not appear because a tester is not fast enough to induce two errors within a single block. However, if the test is performed with an error rate, certain error rates could cause two or more errors in a block. For example, since the STM4 is roughly 622 Mbps and the block in the STM4 has 15,000 bits, there would be about 41,467 blocks in a second. If the tester inputs a 10e-4 error rate, that would create 62,200 errors per second. If the errors are distributed uniformly, then CTC could potentially report two bit errors within a single block. On the other hand, if the error ratio is 10e-5, then there will be 6,220 errors per second. If the errors are not distributed uniformly, then CTC might report one bit error within a single block. In summary, if the errors are distributed equally, then a discrepancy with the standard might be seen when a tester inputs 10e-4 or 10e-3 error rates.
5.7.1 STM-1 Card Performance Monitoring Parameters
Figure 5-7 shows where overhead bytes detected on the ASICs produce performance monitoring parameters for the OC3 IR 4/STM1 SH 1310 card and the OC3 IR/STM1 SH 1310-8 card.
Figure 5-7 PM Read Points on the STM-1 Cards
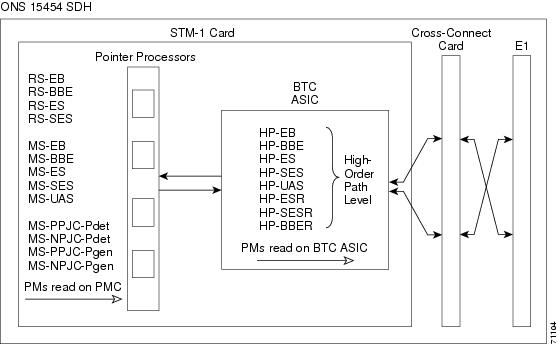
The PM parameters for the STM-1 and STM1 SH 1310-8 cards are listed in Table 5-15. The parameters are defined in Table 5-2.
|
|
|
|
|
|
|---|---|---|---|---|
RS-BBE |
MS-BBE |
MS-PSC (1+1) |
HP-PPJC-Pdet |
HP-BBE |
1 For information about troubleshooting subnetwork connection protection (SNCP) switch counts, refer to "Alarm Troubleshooting" in the Cisco ONS 15454 SDH Troubleshooting Guide. For information about creating circuits that perform a switch, refer to the "Circuits and Tunnels" chapter in the Cisco ONS 15454 SDH Reference Manual. 2 MS-SPRing is not supported on the STM-1 card and STM-1E card; therefore, the MS-PSD-W, MS-PSD-S, and MS-PSD-R PM parameters do not increment. 3 In CTC, the count fields for the HP-PPJC and HP-NPJC PM parameters appear white and blank unless they are enabled on the Provisioning > Line tab. See the "Pointer Justification Count Performance Monitoring" section. 4 Far-end high-order VC4 and VC4-Xc path PM parameters do not apply to the STM1-4 card. 5 SDH path PM parameters do not increment unless IPPM is enabled. See the "Intermediate-Path Performance Monitoring" section. |
5.7.2 STM-1E Card Performance Monitoring Parameters
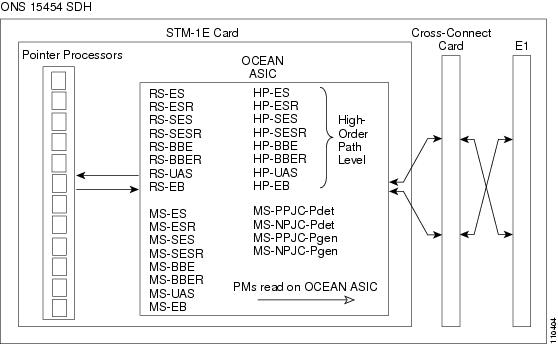
Figure 5-8 shows where overhead bytes detected on the ASICs produce performance monitoring parameters for the STM-1E card.
Figure 5-8 PM Read Points on the STM-1E Cards
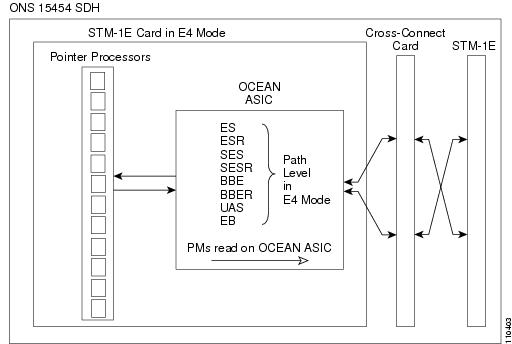
Ports 9 to 12 can be provisioned as E4 framed from the Provisioning > Ports tabs. Figure 5-9 shows the VC4 performance monitoring parameters in E4 mode.
Figure 5-9 PM Read Points on the STM-1E Cards in E4 Mode
The PM parameters for the STM-1E cards are listed in Table 5-16. The parameters are defined in Table 5-2.
|
|
|
|
|
|
|---|---|---|---|---|
RS-BBE |
MS-BBE |
HP-PPJC-Pdet |
HP-BBER |
BBE |
1 In CTC, the count fields for PPJC and NPJC PM parameters appear white and blank unless they are enabled on the Provisioning > OC3 Line tabs. See the "Pointer Justification Count Performance Monitoring" section. 2 For information about troubleshooting SNCP switch counts, refer to "Alarm Troubleshooting" in the Cisco ONS 15454 SDH Troubleshooting Guide. 3 SDH path PM parameters do not increment unless IPPM is enabled. See the "Intermediate-Path Performance Monitoring" section. |
5.7.3 STM-4 Card Performance Monitoring Parameters
Figure 5-10 shows the signal types that support near-end and far-end PM parameters for the OC12 IR/STM4 SH 1310, OC12 LR/STM4 LH 1310 card, the OC12 LR/STM4 LH 1550 card, and the OC12 IR/STM4 SH 1310-4 card. Figure 5-11 shows where overhead bytes detected on the ASICs produce performance monitoring parameters for the
Figure 5-10 Monitored Signal Types for the STM-4 Cards
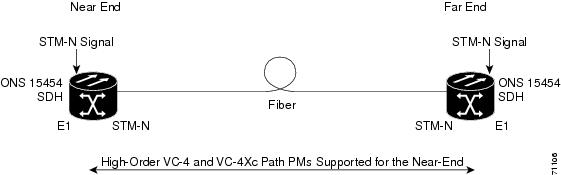
Note ![]() PM parameters on the protect VC4 are not supported for MS-SPRing.
PM parameters on the protect VC4 are not supported for MS-SPRing.
Figure 5-11 PM Read Points on the STM-4 Cards
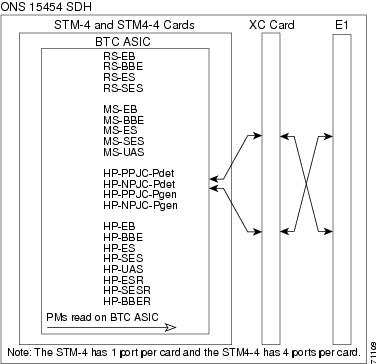
The PM parameters for the STM-4 cards are described in Table 5-17. The parameters are defined in Table 5-2.
|
|
|
|
|
|
|---|---|---|---|---|
RS-BBE |
MS-BBE |
MS-PSC (1+1) |
HP-PPJC-Pdet |
HP-BBE |
1 For information about troubleshooting SNCP switch counts, refer to t"Alarm Troubleshooting" in the Cisco ONS 15454 SDH Troubleshooting Guide. For information about creating circuits that perform a switch, refer to the "Circuits and Tunnels" chapter in the Cisco ONS 15454 SDH Reference Manual. 2 In CTC, the count fields for HP-PPJC and HP-NPJC PM parameters appear white and blank unless they are enabled on the Provisioning > Line tab. See the "Pointer Justification Count Performance Monitoring" section. 3 SDH path PM parameters do not increment unless IPPM is enabled. See the "Intermediate-Path Performance Monitoring" section. |
5.7.4 STM-16 and STM-64 Card Performance Monitoring Parameters
Figure 5-12 shows the signal types that support near-end and far-end PM parameters for the OC48 IR/STM16 SH AS 1310 card, the OC48 LR/STM16 LH AS 1550 card, the OC48 ELR/STM16 EH 100 GHz card, the OC192 SR/STM64 IO 1310 card, the OC192 IR/STM64 SH 1550 card, the OC192 LR/STM 64 LH 1550 card, the OC192 LR/STM64 LH ITU 15xx.xx card, the OC192 SR1/STM64IO Short Reach card, and the OC192/STM64 Any Reach card.
Figure 5-12 Monitored Signal Types for STM-16 and STM-64 Cards
Note ![]() PM parameters on the protect VC4 are not supported for MS-SPRing.
PM parameters on the protect VC4 are not supported for MS-SPRing.
Figure 5-13 shows where overhead bytes detected on the ASICs produce performance monitoring parameters for STM-16 and STM-64 cards.
Figure 5-13 PM Read Points on STM-16 and STM-64 Cards
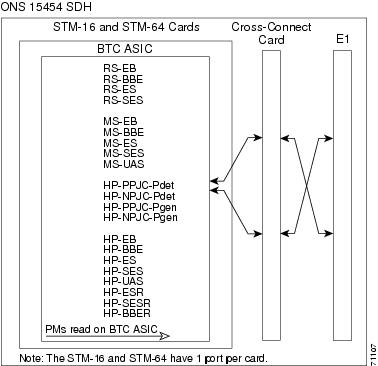
The PM parameters for STM-16 and STM-64 cards are listed Table 5-18.
|
|
|
|
|
|
|---|---|---|---|---|
RS-BBE |
MS-BBE |
MS-PSC (1+1) |
HP-PPJC-Pdet |
HP-BBE |
1 For information about troubleshooting SNCP switch counts, refer to "Alarm Troubleshooting" in the Cisco ONS 15454 SDH Troubleshooting Guide. For information about creating circuits that perform a switch, refer to the "Circuits and Tunnels" chapter in the Cisco ONS 15454 SDH Reference Manual. 2 In CTC, the count fields for HP-PPJC and HP-NPJC PM parameters appear white and blank unless they are enabled on the Provisioning > Line tab. See the "Pointer Justification Count Performance Monitoring" section. 3 SDH path PM parameters do not increment unless IPPM is enabled. See the "Intermediate-Path Performance Monitoring" section. |
.
5.7.5 MRC-12 Card Performance Monitoring Parameters
This section lists performance monitoring parameters for the mutirate card, also known as the MRC-12. card.
Figure 5-21 shows where overhead bytes detected on the ASICs produce performance monitoring parameters for the MRC-12 card.
Figure 5-14 PM Read Points for the MRC-12 Card
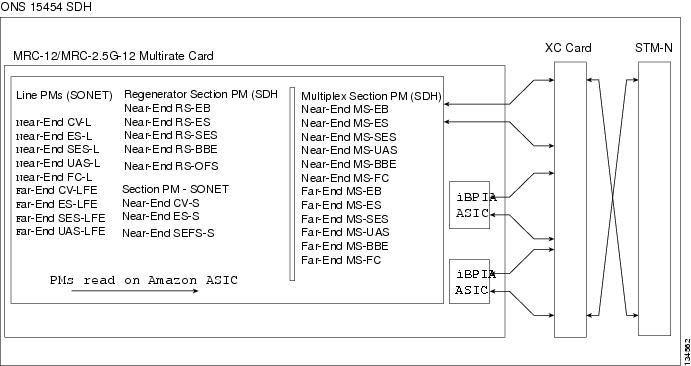
Table 5-19 lists the PM parameters for MRC-12 cards.
5.8 Performance Monitoring for Transponder and Muxponder Cards
This section lists performance monitoring parameters for transponder cards (TXP_MR_10G, TXP_MR_2.5G, TXPP_MR_2.5G, and TXP_MR_10E), and muxponder cards (MXP_2.5G_10G, MXP_25G_10E, MXP_MR_2.5G, and MXPP_MR_2.5G).
5.8.1 TXP_MR_10G Card Performance Monitoring Parameters
Figure 5-15 shows the signal types that support near-end and far-end PM parameters. Figure 5-16 shows where overhead bytes detected on the ASICs produce performance monitoring parameters for the TXP_MR_10G card.
Figure 5-15 Monitored Signal Types for TXP_MR_10G Cards
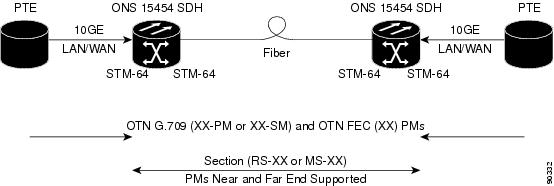
Note ![]() The XX in Figure 5-15 represents all PMs listed in Table 5-20 with the given suffix and/or prefix.
The XX in Figure 5-15 represents all PMs listed in Table 5-20 with the given suffix and/or prefix.
Figure 5-16 PM Read Points on TXP_MR_10G Cards
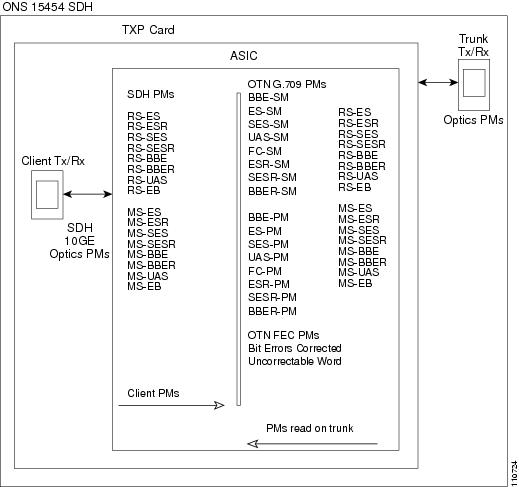
The PM parameters for the TXP_MR_10G cards are described in Table 5-20. The parameters are defined in Table 5-2.
|
|
|
|
|
|
|---|---|---|---|---|
RS-BBE |
MS-BBE |
LBC-AVG |
ES-PM |
BIT-EC |
1 Applicable to optical channel (OCH) facility. |
The Ethernet PM parameters for the TXP_MR_10G cards are described in Table 5-21.
5.8.2 TXP_MR_2.5G and TXPP_MR_2.5G Card Performance Monitoring Parameters
Figure 5-17 shows the signal types that support near-end and far-end PM parameters. Figure 5-18 shows where overhead bytes detected on the ASICs produce performance monitoring parameters for the TXP_MR_2.5G and TXPP_MR_2.5G cards.
Figure 5-17 Monitored Signal Types for TXP_MR_2.5G and TXPP_MR_2.5G Cards
Note ![]() The XX in Figure 5-17 represents all PMs listed in Table 5-22 with the given prefix and/or suffix.
The XX in Figure 5-17 represents all PMs listed in Table 5-22 with the given prefix and/or suffix.
Figure 5-18 PM Read Points on TXP_MR_2.5G and TXPP_MR_2.5G Cards
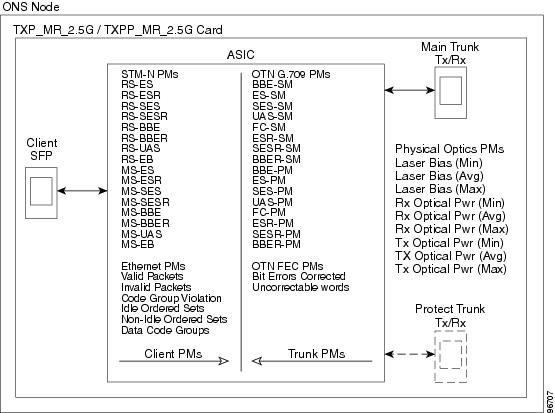
The PM parameters for the TXP_MR_2.5G and TXPP_MR_2.5G cards are described in Table 5-22. The parameters are defined in Table 5-2.
|
|
|
|
|
(NE and FE)1 |
|
|---|---|---|---|---|---|
RS-BBE |
MS-BBE |
LBC-AVG |
CGV |
ES-PM |
BIT-EC |
1 Enterprise System Connection (ESCON), DV6000, SDI/D1 video, and high definition television (HDTV) client signals are unframed payload data types. If the configured payload data type is unframed, line threshold provisioning and performance monitoring are not available. |
.
5.8.3 MXP_2.5G_10G, MXP_MR_2.5G, MXPP_MR_2.5G, MXP_2.5G_10E, and TXP_MR_10E Card Performance Monitoring Parameters
Figure 5-19 shows the signal types that support near-end and far-end PM parameters. Figure 5-20 shows where overhead bytes detected on the ASICs produce performance monitoring parameters for the MXP_2.5G_10G, MXP_MR_2.5G, MXPP_MR_2.5G, MXP_2.5G_10E, and TXP_MR_10E cards.
Figure 5-19 Monitored Signal Types for MXP_2.5G_10G, MXP_MR_2.5G, MXPP_MR_2.5G, MXP_2.5G_10E, and TXP_MR_10E Cards

Note ![]() The XX in Figure 5-19 represents all PMs listed in Table 5-23 with the given prefix and/or suffix.
The XX in Figure 5-19 represents all PMs listed in Table 5-23 with the given prefix and/or suffix.
Figure 5-20 PM Read Points for MXP_2.5G_10G, MXP_MR_2.5G, MXPP_MR_2.5G, MXP_2.5G_10E, and TXP_MR_10E cards
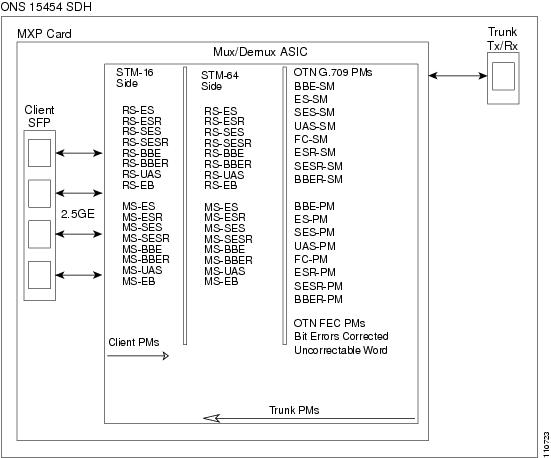
The PM parameters for the MXP_2.5G_10G, MXP_MR_2.5G, MXPP_MR_2.5G, MXP_2.5G_10E, and TXP_MR_10E cards are described in Table 5-23. The parameters are defined in Table 5-2.
5.9 Performance Monitoring for the Fibre Channel Card
The following sections define PM parameters and definitions for the FC_MR-4 card.
5.9.1 FC_MR-4 Card Performance Monitoring Parameters
CTC provides FC_MR-4 performance information, including line-level parameters, port bandwidth consumption, and historical statistics. The FC_MR-4 card performance information is divided into the Statistics, Utilization, and History tabbed windows within the card view Performance tab window.
5.9.1.1 FC_MR-4 Statistics Window
The Statistics window lists parameters at the line level. The Statistics window provides buttons to change the statistical values shown. The Baseline button resets the displayed statistics values to zero. The Refresh button manually refreshes statistics. Auto-Refresh sets a time interval at which automatic refresh occurs. The Statistics window also has a Clear button. The Clear button sets the values on the card to zero. All counters on the card are cleared.
Table 5-24 defines the FC_MR-4 card statistics parameters.
5.9.1.2 FC_MR-4 Utilization Window
The Utilization window shows the percentage of Tx and Rx line bandwidth used by the ports during consecutive time segments. The Utilization window provides an Interval menu that enables you to set time intervals of 1 minute, 15 minutes, 1 hour, and 1 day. Line utilization is calculated with the following formulas:
Rx = (inOctets + inPkts * 24) * 8 / 100% interval * maxBaseRate
Tx = (outOctets + outPkts * 24) * 8 / 100% interval * maxBaseRate
The interval is defined in seconds. The maxBaseRate is defined by raw bits per second in one direction for the port (that is, 1 Gbps or 2 Gbps). The maxBaseRate for FC_MR-4 cards is shown in Table 5-25.
|
|
|
|---|---|
STS-24 |
850000000 |
STS-48 |
850000000 x 21 |
1 For 1 Gigabit of bit rate being transported, there is only 850 Mbps of actual data because of 8b->10b conversion. Similarly, for 2 G of bit rate being transported there is only 850 Mbps x 2 of actual data. |
Note ![]() Line utilization numbers express the average of ingress and egress traffic as a percentage of capacity.
Line utilization numbers express the average of ingress and egress traffic as a percentage of capacity.
5.9.1.3 FC_MR-4 History Window
The History window lists past FC_MR-4 statistics for the previous time intervals. Depending on the selected time interval, the History window displays the statistics for each port for the number of previous time intervals as shown in Table 5-26. The parameters are defined in Table 5-8.
5.10 Performance Monitoring for DWDM Cards
The following section defines performance monitoring parameters and definitions for the OSCM and OSC-CSM DWDM cards.
5.10.1 Optical Service Channel Card Performance Monitoring Parameters
Figure 5-21 shows where overhead bytes detected on the ASICs produce performance monitoring parameters for the OSCM and OSC-CSM cards.
Figure 5-21 PM Read Points on OSCM and OSC-CSM Cards
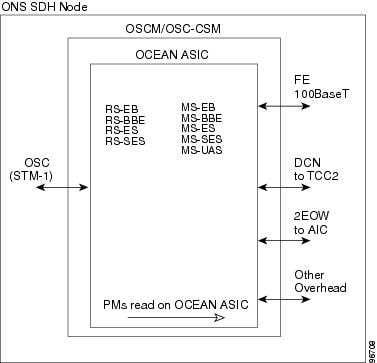
The PM parameters for the OSCM and OSC-CSM cards are listed in Table 5-27.
|
|
|
|
|---|---|---|
RS-BBE |
MS-BBE |
OPT |
 Feedback