- About This Book
- Using the Prime Fulfillment Graphical User Interface
- Setting Up Prime Fulfillment Services
- Managing Carrier Ethernet and L2VPN Services
- Managing RAN Backhaul Services
- Managing MPLS VPN Services
- Managing MPLS Transport Profile Services
- Managing MPLS Traffic Engineering Services
- Managing Service Requests
- Managing Templates and Data Files
- Monitoring
- Performing Diagnostics
- Using the Topology Tool
- Using Inventory Manager
- Administration Tasks
- Cisco Configuration Engine Server
- Property Settings
- WatchDog Commands
- XML Reference
- Terminating an Access Ring on Two N-PEs
- Repository Views
- Inventory - Discovery
- Adding Additional Information to Services
Cisco Prime Fulfillment User Guide 6.2
Bias-Free Language
The documentation set for this product strives to use bias-free language. For the purposes of this documentation set, bias-free is defined as language that does not imply discrimination based on age, disability, gender, racial identity, ethnic identity, sexual orientation, socioeconomic status, and intersectionality. Exceptions may be present in the documentation due to language that is hardcoded in the user interfaces of the product software, language used based on RFP documentation, or language that is used by a referenced third-party product. Learn more about how Cisco is using Inclusive Language.
- Updated:
- March 20, 2015
Chapter: Monitoring
Monitoring
This chapter explains the monitoring activity. It contains the following sections:
•![]() Ping
Ping
•![]() SLA
SLA
Ping
Ping is the way Cisco Prime Fulfillment monitors the VPN connectivity, that is, verifies the connectivity among various edge devices comprising the VPN.

Note ![]() Ping features are not supported on devices running IOS XR.
Ping features are not supported on devices running IOS XR.
To achieve this, you can perform a series of pings among these devices. Ping has the following benefits:
•![]() Service independent and therefore can be used for functional auditing of MPLS applications.
Service independent and therefore can be used for functional auditing of MPLS applications.
•![]() Can establish whether a service is working without doing a functional audit for that service.
Can establish whether a service is working without doing a functional audit for that service.
•![]() Can be used to verify IPv4 connectivity among CPEs prior to VPN service deployment.
Can be used to verify IPv4 connectivity among CPEs prior to VPN service deployment.
However, Ping does not do the following:
•![]() Ping does not work in environments where ICMP traffic is blocked, for example, in a Cisco IOS router with an access-list denying all ICMP traffic.
Ping does not work in environments where ICMP traffic is blocked, for example, in a Cisco IOS router with an access-list denying all ICMP traffic.
•![]() Ping can only inform you that there is a connectivity problem. It does not offer any service-specific information. The connectivity problem can be due to many reasons, such as device failure, misconfiguration, and so on, which ping cannot distinguish.
Ping can only inform you that there is a connectivity problem. It does not offer any service-specific information. The connectivity problem can be due to many reasons, such as device failure, misconfiguration, and so on, which ping cannot distinguish.
•![]() Only the immediate subnet behind the router's customer-facing (also, inside or nonsecured) interface is supported. Campus subnets cannot be supported.
Only the immediate subnet behind the router's customer-facing (also, inside or nonsecured) interface is supported. Campus subnets cannot be supported.
The Ping GUI supports all possible pings for MPLS service requests. This section explains how to ping MPLS service requests.
Note ![]() Cisco Prime Fulfillment has a component Prime Diagnostics that might help you. See the Cisco Prime Fulfillment User Guide 6.2.
Cisco Prime Fulfillment has a component Prime Diagnostics that might help you. See the Cisco Prime Fulfillment User Guide 6.2.
After you choose Inventory > Device Tools > Ping. The Services window appears.
The Type field indicates MPLS. Follow these steps:
Step 1 ![]() Check the check box next to each row for which you want to configure ping parameters.
Check the check box next to each row for which you want to configure ping parameters.
Step 2 ![]() Click the Configure Ping Parameters button, which becomes enabled.
Click the Configure Ping Parameters button, which becomes enabled.
The MPLS Parameters window appears.
Fill in the following and then click Start Ping:
•![]() Ping Type: Do PE to CE Ping—When this radio button is chosen, a VRF ping occurs for all PE CE pairs that form an MPLS VPN link. The IP addresses taken for this ping are the link endpoint addresses. For example, assume that an MPLS service request has two linked PE1<>CE1 and PE2<>CE2. Then this selection initiates four VRF pings: (PE1, CE1), (PE2, CE2), (PE1, CE2), and (PE2, CE1). When this selection is chosen, then after you click Start Ping, you go directly to and receive a result page.
Ping Type: Do PE to CE Ping—When this radio button is chosen, a VRF ping occurs for all PE CE pairs that form an MPLS VPN link. The IP addresses taken for this ping are the link endpoint addresses. For example, assume that an MPLS service request has two linked PE1<>CE1 and PE2<>CE2. Then this selection initiates four VRF pings: (PE1, CE1), (PE2, CE2), (PE1, CE2), and (PE2, CE1). When this selection is chosen, then after you click Start Ping, you go directly to and receive a result page.
•![]() Ping Type: Do CE to CE Ping—When this radio button is chosen, a ping occurs between all CEs that make the endpoint in the service request. When this selection is chosen, then after you click Start Ping, you go to Step 3.
Ping Type: Do CE to CE Ping—When this radio button is chosen, a ping occurs between all CEs that make the endpoint in the service request. When this selection is chosen, then after you click Start Ping, you go to Step 3.
•![]() Two-way Ping (default: unavailable and deselected)—This check box is only available when you select Do CE to CE Ping. When a ping occurs from device1 to device2 and this check box is checked, then a ping from device2 to device1 also occurs.
Two-way Ping (default: unavailable and deselected)—This check box is only available when you select Do CE to CE Ping. When a ping occurs from device1 to device2 and this check box is checked, then a ping from device2 to device1 also occurs.
•![]() Packet Repeat Count (default: 5)—This value indicates how many ICMP packets to use for a ping.
Packet Repeat Count (default: 5)—This value indicates how many ICMP packets to use for a ping.
•![]() Datagram size (default: 100)—This value is the packet size of ICMP used for pinging.
Datagram size (default: 100)—This value is the packet size of ICMP used for pinging.
Step 3 ![]() For Do CE to CE Ping, a MPLS CE Selection window appears.
For Do CE to CE Ping, a MPLS CE Selection window appears.
Step 4 ![]() Check the check box next to each row for which you want to select a CE.
Check the check box next to each row for which you want to select a CE.
Step 5 ![]() Click the Start MPLS CE Ping button, which becomes enabled.
Click the Start MPLS CE Ping button, which becomes enabled.
You receive a MPLS Ping Test Results window.
The buttons at the bottom of the window are as follows:
•![]() Redo Ping—When you click this button, you restart all the pings. The parameters used are the same as those specified in the last request.
Redo Ping—When you click this button, you restart all the pings. The parameters used are the same as those specified in the last request.
•![]() View Job Logs—When you click this button, you receive logs of all the Prime Fulfillment jobs created for doing ping. The ping application creates one job per selected service request.
View Job Logs—When you click this button, you receive logs of all the Prime Fulfillment jobs created for doing ping. The ping application creates one job per selected service request.
•![]() Refresh—To selectively refresh, turn off the Auto Refresh button and click this button whenever you want to update the results.
Refresh—To selectively refresh, turn off the Auto Refresh button and click this button whenever you want to update the results.
•![]() Close—Click this button to close the current ping request. You return to the Monitoring page.
Close—Click this button to close the current ping request. You return to the Monitoring page.
Note ![]() Any column heading in blue indicates that by clicking that column header, you can sort on that column.
Any column heading in blue indicates that by clicking that column header, you can sort on that column.
Step 6 ![]() Click Close and you are finished with this Ping session.
Click Close and you are finished with this Ping session.
SLA
A service-level agreement (SLA) defines a level of service provided by a service provider to any customer. Performance is monitored through the SLA server. Cisco Prime Fulfillment monitors the service-related performance criteria by provisioning, collecting, and monitoring SLAs on Cisco IOS routers that support the Service Assurance Agent (SA Agent) devices. To provision the SLAs and to collect statistics for each SLA, the data collection task requires minimal user input.
Note ![]() SLA features are not supported on devices running IOS XR.
SLA features are not supported on devices running IOS XR.
The SLA collection task collects the relevant performance data, stores it persistently, aggregates it, and presents useful reports. The SLA collection task collects from the SA Agent MIB on devices. Prime Fulfillment leverages the SA Agent MIB to monitor SLA performance on a 24 x 7 basis. Using the MIB, you can monitor network traffic for the popular protocols:
•![]() Dynamic Host Configuration Protocol (DHCP)
Dynamic Host Configuration Protocol (DHCP)
•![]() Domain Name System (DNS)
Domain Name System (DNS)
•![]() File Transfer Protocol (FTP)
File Transfer Protocol (FTP)
•![]() Hyper text Transfer Protocol (HTTP)
Hyper text Transfer Protocol (HTTP)
•![]() Internet Control Message Protocol Echo (ICMP Echo)
Internet Control Message Protocol Echo (ICMP Echo)
•![]() Jitter (voice jitter)
Jitter (voice jitter)
•![]() Transmission Control Protocol Connect (TCP Connect)
Transmission Control Protocol Connect (TCP Connect)
•![]() User Datagram Protocol Echo (UDP Echo).
User Datagram Protocol Echo (UDP Echo).
Note ![]() SLA uses the embedded Sybase database, independent of whether you choose Oracle as your database.
SLA uses the embedded Sybase database, independent of whether you choose Oracle as your database.
Note ![]() The SLA operations Create, Delete, Enable Probes, Disable Probes, Enable Traps, and Disable Traps automatically result in the creation of a task, which executes the actual operation. You can view the status of the task by navigating Inventory > Task Manager > Logs.
The SLA operations Create, Delete, Enable Probes, Disable Probes, Enable Traps, and Disable Traps automatically result in the creation of a task, which executes the actual operation. You can view the status of the task by navigating Inventory > Task Manager > Logs.
This section explains how to configure SLA probes, collect SLA data, and view SLA reports about these SLA probes.
Before you choose Inventory > Device Tools > SLA, implement the setup procedures in the "Setup Prior to Using SLA" section."
Then choose Inventory > Device Tools > SLA and you can select one of the following:
•![]() Probes is the default selection.
Probes is the default selection.
Setup Prior to Using SLA
SLA is an SNMP activity. Be sure SNMP is enabled and the SNMP settings on the router match the settings in the repository.
When creating an SLA From MPLS CPE or From MPLS PE or MVRF-CE, the service requests associated with the devices must be in the Deployed state.
Setting Up SNMP
To work with Prime Fulfillment, SNMP must be configured on each CPE device in the customer network. In Prime Fulfillment, SNMP is used to:
•![]() collect from the Interface MIB
collect from the Interface MIB
•![]() provision and collect SLA data.
provision and collect SLA data.
Two security models are available: SNMPv1/v2c and SNMPv3. Table 10-1 identifies the combinations of security models and levels.
SNMPv3 provides for both security models and security levels. A security model is an authentication strategy that is set up for a user and the group in which the user resides. A security level is the permitted level of security within a security model. A combination of a security model and a security level determines which security mechanism is employed when handling an SNMP packet.
The security features provided in SNMPv3 are as follows:
•![]() Message integrity—Ensures that a packet has not been tampered with in-transit.
Message integrity—Ensures that a packet has not been tampered with in-transit.
•![]() Authentication—Determines the message is from a valid source.
Authentication—Determines the message is from a valid source.
•![]() Encryption—Encoding the contents of a packet to prevent it from being read by an unauthorized source.
Encryption—Encoding the contents of a packet to prevent it from being read by an unauthorized source.
SNMPv3 objects have the following characteristics:
•![]() Each user belongs to a group.
Each user belongs to a group.
•![]() The group defines the access policy for a set of users and determines the list of notifications its users can receive. The group also defines the security model and security level for its users.
The group defines the access policy for a set of users and determines the list of notifications its users can receive. The group also defines the security model and security level for its users.
•![]() The access policy defines which SNMP objects can be accessed for reading, writing, or creation.
The access policy defines which SNMP objects can be accessed for reading, writing, or creation.
•![]() SNMPv3 is not supported for Discovery.
SNMPv3 is not supported for Discovery.
Setting Up SNMPv1/v2c on Cisco IOS Routers
To determine whether SNMP is enabled, and to set the SNMP community strings on a Cisco IOS router, perform the following steps for each router:

Tip ![]() The SNMP community strings defined in Prime Fulfillment for each target device must be identical to those configured on the device.
The SNMP community strings defined in Prime Fulfillment for each target device must be identical to those configured on the device.
Setting SNMPv3 Parameters on Cisco IOS Routers
This section describes how to set the SNMPv3 parameters on Cisco IOS routers. SNMPv3 is only supported on IOS crypto images. For Authentication/Encryption, the IOS image must have DES56.
Tip ![]() The SNMP users defined in Prime Fulfillment for each target device must be identical to those configured on the device.
The SNMP users defined in Prime Fulfillment for each target device must be identical to those configured on the device.
To check the existing SNMP configuration, use these commands in the router terminal session:
•![]() show snmp group
show snmp group
•![]() show snmp user
show snmp user
To set the SNMPv3 server group and user parameters on a Cisco IOS router, perform the following steps:
Note ![]() The group must be created first and then the user.
The group must be created first and then the user.
Manually Enabling RTR Responder on Cisco IOS Routers
Note ![]() SNMP must be configured on the router.
SNMP must be configured on the router.
To manually enable an RTR Responder on a Cisco IOS router, execute the following steps:
Probes
When you choose Inventory > Device Tools > SLA, a SLA Probes window appears.
The default button that is enabled is Create and from the Create drop-down list, you can choose to create SLA probes From Any SA Agent Device(s); From MPLS CPE; or From MPLS PE or MVRF-CE. However, if you select one or more existing probes by clicking the row(s) of existing probe(s), then you have access to the other buttons, Details, Delete, Enable, and Disable. For Enable and Disable, the drop-down list contains options to enable or disable SLA Probes and SLA Traps.
The explanations of the buttons and subsequent drop-down lists is given as follows:
•![]() Create Common Parameters—This section explains the SLA common parameters for all of the probe creation types: From Any SA Agent Device(s); From MPLS CPE; or From MPLS PE or MVRF-CE.
Create Common Parameters—This section explains the SLA common parameters for all of the probe creation types: From Any SA Agent Device(s); From MPLS CPE; or From MPLS PE or MVRF-CE.
•![]() Create From Any SA Agent Device(s)—This section explains how to create probes from any SA Agent device(s) and begins after creating common parameters.
Create From Any SA Agent Device(s)—This section explains how to create probes from any SA Agent device(s) and begins after creating common parameters.
•![]() Create from MPLS CPE—This section explains how to create probes from an MPLS CPE and begins after creating common parameters.
Create from MPLS CPE—This section explains how to create probes from an MPLS CPE and begins after creating common parameters.
•![]() Create From MPLS PE or MVRF-CE—This section explains how to create probes from an MPLS PE or MVRF-CE and begins after creating common parameters.
Create From MPLS PE or MVRF-CE—This section explains how to create probes from an MPLS PE or MVRF-CE and begins after creating common parameters.
•![]() Protocols—This section is common Probes information for each of the Create paths.
Protocols—This section is common Probes information for each of the Create paths.
•![]() Details—This section gives details about a specified probe.
Details—This section gives details about a specified probe.
•![]() Delete—This section explains how to delete a probe.
Delete—This section explains how to delete a probe.
•![]() Enable Probes—This section explains how to enable the Probe and change its status from Created to Active state.
Enable Probes—This section explains how to enable the Probe and change its status from Created to Active state.
•![]() Enable Traps—This section explains how to enable traps.
Enable Traps—This section explains how to enable traps.
•![]() Disable Probes—This section explains how to disable the Probe and change its status from Active to Disabled.
Disable Probes—This section explains how to disable the Probe and change its status from Active to Disabled.
•![]() Disable Traps—This sections explains how to disable traps.
Disable Traps—This sections explains how to disable traps.
Create Common Parameters
When you choose Inventory > Device Tools > SLA, the default is the Probes page with only the Create button enabled. From the Create drop-down list, you can choose From Any SA Agent Device(s), From MPLS CPE, or From MPLS PE or MVRF-CE. The first window to appear in all ways of creation is specified here. Then you proceed to the specific creation type you have chosen.
Follow these steps:
Step 1 ![]() Choose Create, and the window to appear is as shown in Figure 10-1.
Choose Create, and the window to appear is as shown in Figure 10-1.
Figure 10-1 SLA Common Parameters
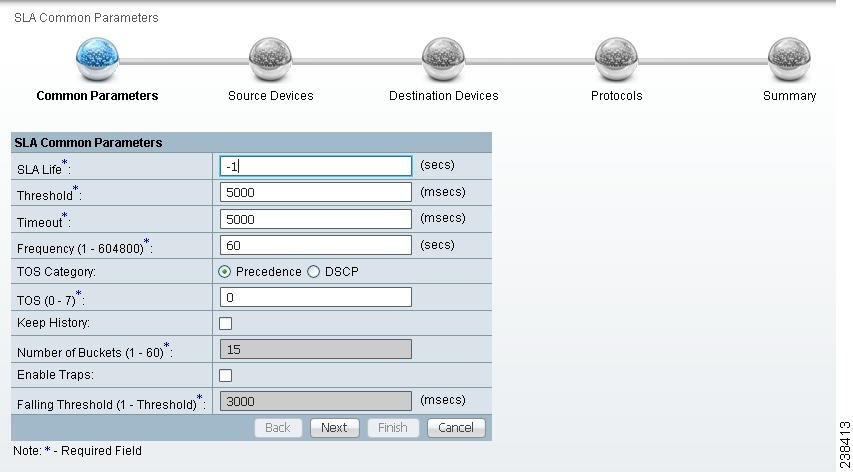
Accept the defaults or change the information in the fields of the common SLA parameters, as follows, and then click Next:
•![]() SLA Life (required)—The number of seconds that the probe is active (with the maximum value of a 32-bit integer in seconds). If the value is set to -1, the typical and default value, the probe is active forever.
SLA Life (required)—The number of seconds that the probe is active (with the maximum value of a 32-bit integer in seconds). If the value is set to -1, the typical and default value, the probe is active forever.
•![]() Threshold (required)—An integer that defines the threshold limit in milliseconds. When this threshold is exceeded and traps are enabled, a trap is sent. The maximum value is the maximum value of a 32-bit integer. If the service affecting agent (SA Agent) operation time exceeds this limit, the threshold violation is recorded by the SA Agent. The value for Threshold must not exceed the value for Timeout. The default value is 5000.
Threshold (required)—An integer that defines the threshold limit in milliseconds. When this threshold is exceeded and traps are enabled, a trap is sent. The maximum value is the maximum value of a 32-bit integer. If the service affecting agent (SA Agent) operation time exceeds this limit, the threshold violation is recorded by the SA Agent. The value for Threshold must not exceed the value for Timeout. The default value is 5000.
•![]() Timeout (required)—Duration in milliseconds to wait for an SA Agent operation completion. The value for Timeout must be less than or equal to the value for Frequency and greater than or equal to the value for Threshold. The default value is 5000
Timeout (required)—Duration in milliseconds to wait for an SA Agent operation completion. The value for Timeout must be less than or equal to the value for Frequency and greater than or equal to the value for Threshold. The default value is 5000
•![]() Frequency (0 - 604800) (required)—Duration in seconds between initiating each SA Agent operation. The value for Frequency must be greater than or equal to the value for Timeout. The default value is 60.
Frequency (0 - 604800) (required)—Duration in seconds between initiating each SA Agent operation. The value for Frequency must be greater than or equal to the value for Timeout. The default value is 60.
•![]() TOS Category (default: Precedence)—If you choose the Precedence radio button for TOS Category, you have one set of type of service (TOS) values. If you choose the DSCP radio button for TOS Category, you have a different set of TOS values.
TOS Category (default: Precedence)—If you choose the Precedence radio button for TOS Category, you have one set of type of service (TOS) values. If you choose the DSCP radio button for TOS Category, you have a different set of TOS values.
•![]() TOS (required)—An integer. The range and meanings of the values depend on whether the radio button in the TOS Category is set to Precedence (values: 0 to 7) or DSCP (values: 0 to 63).
TOS (required)—An integer. The range and meanings of the values depend on whether the radio button in the TOS Category is set to Precedence (values: 0 to 7) or DSCP (values: 0 to 63).
–![]() When the TOS Category is set to Precedence, the valid values are 0 to 7. These values represent the three most significant bits of the ToS field in an IP header. The default value is 0. The meanings of the Precedence values are specified in Table 10-2.
When the TOS Category is set to Precedence, the valid values are 0 to 7. These values represent the three most significant bits of the ToS field in an IP header. The default value is 0. The meanings of the Precedence values are specified in Table 10-2.
Note ![]() Type of Service does not apply to the DNS and DHCP types of SLA probes. Prime Fulfillment ignores any ToS value set for these two types of SLA probes. For example, if you first choose a ToS value of 5, then choose the DNS, DHCP, and ICMP Echo protocols for an SLA probe, Prime Fulfillment applies the selected ToS value to the ICMP Echo probe only.
Type of Service does not apply to the DNS and DHCP types of SLA probes. Prime Fulfillment ignores any ToS value set for these two types of SLA probes. For example, if you first choose a ToS value of 5, then choose the DNS, DHCP, and ICMP Echo protocols for an SLA probe, Prime Fulfillment applies the selected ToS value to the ICMP Echo probe only.
–![]() When the TOS Category is set to DSCP, the valid values are 0 to 63. These values represent the six most significant bits of this ToS field in an IP header. The default value is 0. The interpretation of these TOS values is user specified.
When the TOS Category is set to DSCP, the valid values are 0 to 63. These values represent the six most significant bits of this ToS field in an IP header. The default value is 0. The interpretation of these TOS values is user specified.
Note ![]() Prime Fulfillment maps the 0 - 7 PRECEDENCE values to the three most significant ToS bits by left-shifting the value by five positions. Similarly, the 0 - 63 DSCP values are left-shifted by two positions.
Prime Fulfillment maps the 0 - 7 PRECEDENCE values to the three most significant ToS bits by left-shifting the value by five positions. Similarly, the 0 - 63 DSCP values are left-shifted by two positions.
•![]() Keep History (default: unchecked)—If you check the Keep History check box, you indicate to keep the recent History Table on the router. Specifically, it is kept in the SA Agent MIB that keeps the raw round-trip time (RTT) SLA measurement. This selection also enables you to indicate the Number of Buckets of raw history data to keep. If you leave the default of an unchecked check box for Keep History, no raw history data is kept. Keep History is not supported for HTTP and Jitter.
Keep History (default: unchecked)—If you check the Keep History check box, you indicate to keep the recent History Table on the router. Specifically, it is kept in the SA Agent MIB that keeps the raw round-trip time (RTT) SLA measurement. This selection also enables you to indicate the Number of Buckets of raw history data to keep. If you leave the default of an unchecked check box for Keep History, no raw history data is kept. Keep History is not supported for HTTP and Jitter.
•![]() Number of Buckets (1 - 60) (required)—The default is 15 when the Keep History check box is checked. The range is 1 to 60 and indicates the number of most recent raw data entries to be kept in the raw history data. When the specified Number of Buckets is surpassed, removal of buckets starts with the oldest bucket to keep only the number of raw data entries specified.
Number of Buckets (1 - 60) (required)—The default is 15 when the Keep History check box is checked. The range is 1 to 60 and indicates the number of most recent raw data entries to be kept in the raw history data. When the specified Number of Buckets is surpassed, removal of buckets starts with the oldest bucket to keep only the number of raw data entries specified.
•![]() Enable Traps (default: unchecked, which means No)—If you check the Enable Traps check box, the created SLA is configured to send three types of traps. This selection also enables you to indicate the Falling Threshold. If you leave the Enable Traps check box unchecked, the traps are disabled on the SLAs created in this task.
Enable Traps (default: unchecked, which means No)—If you check the Enable Traps check box, the created SLA is configured to send three types of traps. This selection also enables you to indicate the Falling Threshold. If you leave the Enable Traps check box unchecked, the traps are disabled on the SLAs created in this task.
•![]() Falling Threshold (1 - Threshold) (required)—The default is 3000 in milliseconds when the Enable Traps check box is checked. The range is 1 to the Threshold value in milliseconds. When traps are enabled and the delay meets the specified number of milliseconds, a trap is sent.
Falling Threshold (1 - Threshold) (required)—The default is 3000 in milliseconds when the Enable Traps check box is checked. The range is 1 to the Threshold value in milliseconds. When traps are enabled and the delay meets the specified number of milliseconds, a trap is sent.
Step 2 ![]() Next you proceed to Create From Any SA Agent Device(s), Create from MPLS CPE, or Create From MPLS PE or MVRF-CE.
Next you proceed to Create From Any SA Agent Device(s), Create from MPLS CPE, or Create From MPLS PE or MVRF-CE.
Create From Any SA Agent Device(s)
After you have completed the steps in Create Common Parameters, follow these steps:
Note ![]() IP connectivity must be available between the SA Agent devices.
IP connectivity must be available between the SA Agent devices.
Step 1 ![]() The next window to appear is as shown in Figure 10-2.
The next window to appear is as shown in Figure 10-2.
Figure 10-2 SLA Source Devices
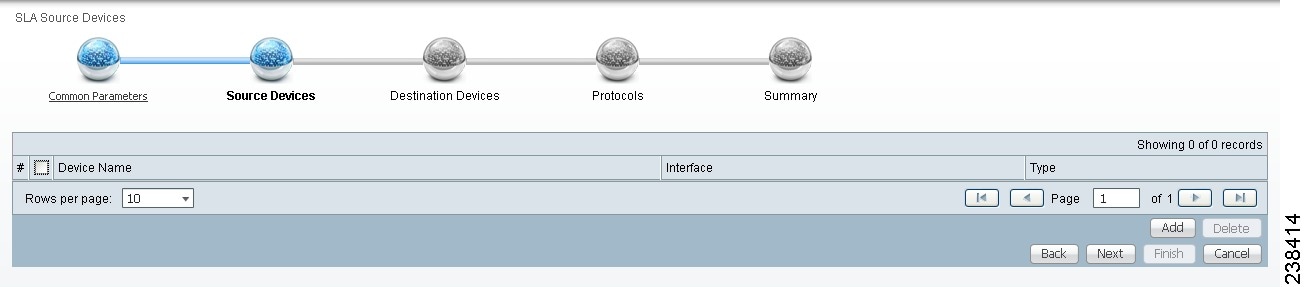
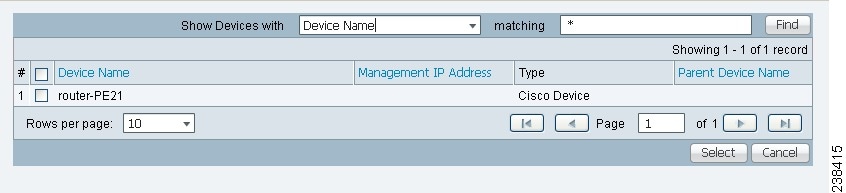
Step 2 ![]() Click the Add button and a window appears as shown in Figure 10-3, which lists all the devices in the database that have a minimum of one interface. Check the check box next to each row for the device you want to select, then click Select.
Click the Add button and a window appears as shown in Figure 10-3, which lists all the devices in the database that have a minimum of one interface. Check the check box next to each row for the device you want to select, then click Select.
Figure 10-3 SLA Devices > Add
You return to Figure 10-2 and the newly added source device(s) appear. The information about this source device is specified in the following columns:
•![]() Device Name—You can click this heading and the device names are organized alphabetically.
Device Name—You can click this heading and the device names are organized alphabetically.
•![]() Interface—You can click Select and from the resulting window, you can update the IP address. Select one radio button for an interface and click Select and the IP address changes in Figure 10-2.
Interface—You can click Select and from the resulting window, you can update the IP address. Select one radio button for an interface and click Select and the IP address changes in Figure 10-2.
•![]() Type—Gives you the type of the source device.
Type—Gives you the type of the source device.
Step 3 ![]() You can repeat Step 2 to to add more devices, or you can delete any of the currently selected source devices. To delete, check the check box next to each row for the device you want to delete and then click Delete.
You can repeat Step 2 to to add more devices, or you can delete any of the currently selected source devices. To delete, check the check box next to each row for the device you want to delete and then click Delete.
Note ![]() There is no second chance for deleting source devices. There is no confirm window.
There is no second chance for deleting source devices. There is no confirm window.
Step 4 ![]() Click Next.
Click Next.
The next window to appear is as shown in Figure 10-4.
Figure 10-4 SLA Destination Devices
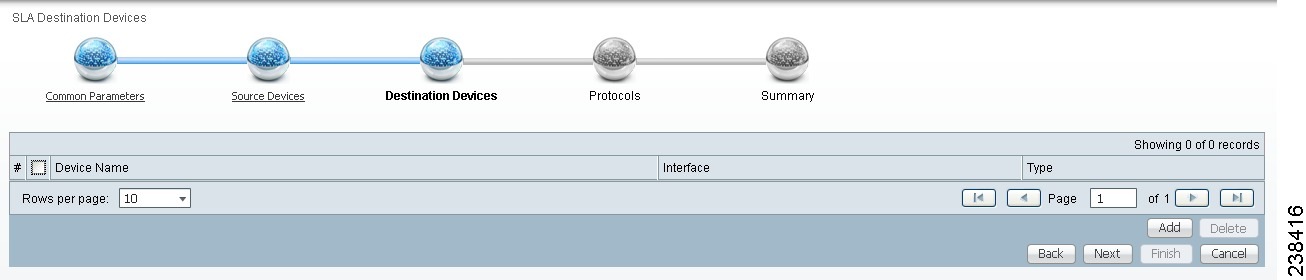
Step 5 ![]() Click the Add button and a window appears as shown in Figure 10-3. Check the check box next to each row for the device you want to select. Then click Select.
Click the Add button and a window appears as shown in Figure 10-3. Check the check box next to each row for the device you want to select. Then click Select.
Step 6 ![]() You return to Figure 10-4 and the newly added destination device(s) appear. The information about this destination device is specified in the following columns:
You return to Figure 10-4 and the newly added destination device(s) appear. The information about this destination device is specified in the following columns:
•![]() Device Name—You can click this heading and the device names are organized alphabetically.
Device Name—You can click this heading and the device names are organized alphabetically.
•![]() Interface—You can click Select and from the resulting window, you can update the IP address. Select one radio button for an interface and click Select and the IP address changes in Figure 10-4.
Interface—You can click Select and from the resulting window, you can update the IP address. Select one radio button for an interface and click Select and the IP address changes in Figure 10-4.
•![]() Type—Gives you the type of the source device.
Type—Gives you the type of the source device.
Step 7 ![]() You can repeat Step 5 to Step 6 to add more devices, or you can delete any of the currently selected destination devices. To delete, check the check box next to each row for the device you want to delete and then click Delete.
You can repeat Step 5 to Step 6 to add more devices, or you can delete any of the currently selected destination devices. To delete, check the check box next to each row for the device you want to delete and then click Delete.
Note ![]() There is no second chance for deleting destination devices. There is no confirm window.
There is no second chance for deleting destination devices. There is no confirm window.
Step 8 ![]() Click Next. Proceed to the "Protocols" section."
Click Next. Proceed to the "Protocols" section."
Create from MPLS CPE
After you have completed the steps in Create Common Parameters, follow these steps:
Step 1 ![]() Complete the steps in the "Create Common Parameters" section and the next window to appear is as shown in Figure 10-5.
Complete the steps in the "Create Common Parameters" section and the next window to appear is as shown in Figure 10-5.
Figure 10-5 SLA CPE Parameters
Step 2 ![]() Click the Select button for VPN and a window appears, which lists all the VPNs in the database.
Click the Select button for VPN and a window appears, which lists all the VPNs in the database.
Step 3 ![]() Click the radio button for the VPN you want to select. Then click Select. You return to Figure 10-5 and the newly added VPN and Customer information appear and a Select button appears for CPE. You can change the VPN by repeating Step 2.
Click the radio button for the VPN you want to select. Then click Select. You return to Figure 10-5 and the newly added VPN and Customer information appear and a Select button appears for CPE. You can change the VPN by repeating Step 2.
Step 4 ![]() Click the Select button for CPE and a window appears which lists the CPEs associated with the selected VPN. Click the radio button for the CPE you want to select. Then click Select.
Click the Select button for CPE and a window appears which lists the CPEs associated with the selected VPN. Click the radio button for the CPE you want to select. Then click Select.
Step 5 ![]() You return to Figure 10-5 and the newly added CPE and its first interface appear and a Select button appears for CPE Interface. You can change the CPE by repeating Step 4.
You return to Figure 10-5 and the newly added CPE and its first interface appear and a Select button appears for CPE Interface. You can change the CPE by repeating Step 4.
Step 6 ![]() If you want to change the default CPE Interface information that appears, click Select and you receive a window appears.
If you want to change the default CPE Interface information that appears, click Select and you receive a window appears.
Step 7 ![]() Click the radio button next to the row for the interface you want to select. Then click Select. You return to Figure 10-5 and the newly added CPE Interface appears.
Click the radio button next to the row for the interface you want to select. Then click Select. You return to Figure 10-5 and the newly added CPE Interface appears.
Step 8 ![]() You can change the CPE Interface by repeating Step 6.
You can change the CPE Interface by repeating Step 6.
Step 9 ![]() You can keep the default Type, by leaving the radio button for Connected PE chosen, which creates an SLA between the CPE and its directly connected PE, or you can select the radio button for CPEs in the same VPN. If you keep the default of Connected PE, proceed to Step 10. If you click the CPEs radio button, proceed to Step 14.
You can keep the default Type, by leaving the radio button for Connected PE chosen, which creates an SLA between the CPE and its directly connected PE, or you can select the radio button for CPEs in the same VPN. If you keep the default of Connected PE, proceed to Step 10. If you click the CPEs radio button, proceed to Step 14.
Step 10 ![]() Click Select for Connected PE Interface and a window appears.
Click Select for Connected PE Interface and a window appears.
Step 11 ![]() Click the radio button next to the row for the interface you want to select. Then click Select.
Click the radio button next to the row for the interface you want to select. Then click Select.
Step 12 ![]() You return to Figure 10-5 and the newly added Connected PE Interface appears. You can change the Connected PE Interface by repeating Step 10.
You return to Figure 10-5 and the newly added Connected PE Interface appears. You can change the Connected PE Interface by repeating Step 10.
Step 13 ![]() Click Next and proceed to the "Protocols" section.
Click Next and proceed to the "Protocols" section.
Step 14 ![]() When you click CPEs, the window is as shown in Figure 10-6, "CPEs."
When you click CPEs, the window is as shown in Figure 10-6, "CPEs."
Figure 10-6 CPEs
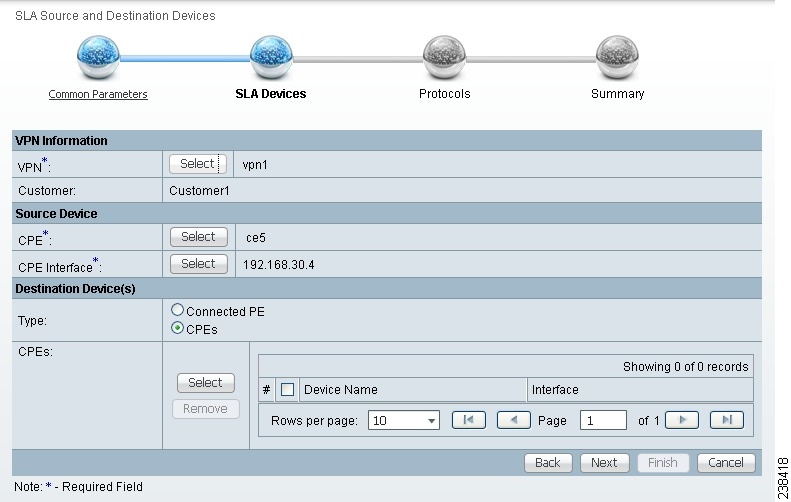
Step 15 ![]() Click the Select button for CPEs and a window appears which lists all the CPEs associated with the specified VPN in the database.
Click the Select button for CPEs and a window appears which lists all the CPEs associated with the specified VPN in the database.
Step 16 ![]() Check the check box next to the row(s) for the CPE(s) you want to select. Then click Select.
Check the check box next to the row(s) for the CPE(s) you want to select. Then click Select.
Note ![]() Do not add a device chosen as a Source Device to Destination Device(s).
Do not add a device chosen as a Source Device to Destination Device(s).
You return to Figure 10-6 and the newly added Device Name appears.
Step 17 ![]() Click Select in the Interface column and a window appears.
Click Select in the Interface column and a window appears.
Step 18 ![]() Click the radio button next to the row for the CPE you want to select. Then click Select.
Click the radio button next to the row for the CPE you want to select. Then click Select.
Step 19 ![]() You return to Figure 10-6 and the newly added CPE Interface appears. You can change the CPE Interface by repeating Step 17.
You return to Figure 10-6 and the newly added CPE Interface appears. You can change the CPE Interface by repeating Step 17.
Step 20 ![]() Check the check box next to each row for the Devices you want to remove. Then click the Remove button and a window as shown in Figure 10-6 appears without the removed Device(s).
Check the check box next to each row for the Devices you want to remove. Then click the Remove button and a window as shown in Figure 10-6 appears without the removed Device(s).
Step 21 ![]() When Figure 10-6 reflects what you want, click Next and proceed to the "Protocols" section.
When Figure 10-6 reflects what you want, click Next and proceed to the "Protocols" section.
Create From MPLS PE or MVRF-CE
After you have completed the steps in Create Common Parameters, follow these steps:
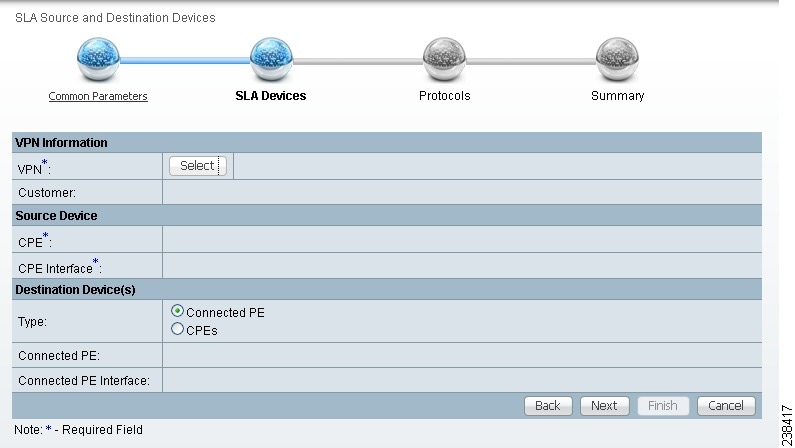
Step 1 ![]() Complete the steps in the "Create Common Parameters" section and the next window to appear is as shown in Figure 10-7, "SLA Source and Destination Devices."
Complete the steps in the "Create Common Parameters" section and the next window to appear is as shown in Figure 10-7, "SLA Source and Destination Devices."
Figure 10-7 SLA Source and Destination Devices
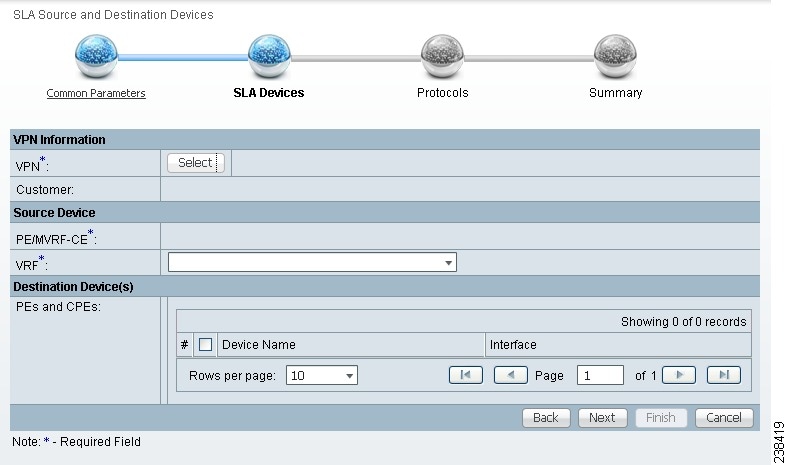
Step 2 ![]() Click the Select button for VPN and a window appears which lists all the VPNs in the database. Click the radio button next to the row for the VPN you want to select.
Click the Select button for VPN and a window appears which lists all the VPNs in the database. Click the radio button next to the row for the VPN you want to select.
Step 3 ![]() Then click Select.
Then click Select.
Step 4 ![]() You return to Figure 10-7 and the newly added VPN and Customer information appears. You can change the VPN and Customer by repeating Step 2.
You return to Figure 10-7 and the newly added VPN and Customer information appears. You can change the VPN and Customer by repeating Step 2.
Step 5 ![]() Click the new Select button for PE/MVRF-CE and you receive a drop-down list from which you can choose PE or MVRF-CE. If you choose PE, a window appears, which lists all the PEs associated with the selected VPN. If you choose MVRF-CE, a window appears, which lists all the MVRF-CEs associated with the selected VPN. Click the radio button next to the row for the PE or MVRF-CE you want to select. Then click Select or OK.
Click the new Select button for PE/MVRF-CE and you receive a drop-down list from which you can choose PE or MVRF-CE. If you choose PE, a window appears, which lists all the PEs associated with the selected VPN. If you choose MVRF-CE, a window appears, which lists all the MVRF-CEs associated with the selected VPN. Click the radio button next to the row for the PE or MVRF-CE you want to select. Then click Select or OK.
Step 6 ![]() You return to Figure 10-7 and the newly added PE or MVRF-CE information appears. You can change this selection by repeating Step 5.
You return to Figure 10-7 and the newly added PE or MVRF-CE information appears. You can change this selection by repeating Step 5.
Step 7 ![]() If in Step 5 you chose MVRF-CE information, you can click the VRF drop-down list.
If in Step 5 you chose MVRF-CE information, you can click the VRF drop-down list.
Step 8 ![]() Click the new Select button for Destination Device(s)—PEs and CPEs and from a drop-down list, choose PEs or CPEs. If you choose PEs, a window appears, which lists all the PE Interfaces in the database. If you choose CPEs, a window appears, which lists all the CPE Interfaces in the database. Click the radio button next to the row for the Device Interface you want to select. Then click Select.
Click the new Select button for Destination Device(s)—PEs and CPEs and from a drop-down list, choose PEs or CPEs. If you choose PEs, a window appears, which lists all the PE Interfaces in the database. If you choose CPEs, a window appears, which lists all the CPE Interfaces in the database. Click the radio button next to the row for the Device Interface you want to select. Then click Select.
Note ![]() Do not add a device chosen as a Source Device to Destination Device(s).
Do not add a device chosen as a Source Device to Destination Device(s).
Step 9 ![]() You return to Figure 10-7 and you receive interface information. Click Select and you get a window from which you can click a radio button next to a different interface. Click Select and the new interface replaces the old interface. You can change the Interface by repeating this step.
You return to Figure 10-7 and you receive interface information. Click Select and you get a window from which you can click a radio button next to a different interface. Click Select and the new interface replaces the old interface. You can change the Interface by repeating this step.
Step 10 ![]() Click Next and proceed to the "Protocols" section.
Click Next and proceed to the "Protocols" section.
Protocols
You choose this location after you have completed all the steps in one of the Create functions: Create Common Parameters; Create from MPLS CPE; or Create From MPLS PE or MVRF-CE. Follow these steps:
Step 1 ![]() Complete the steps in the "Create Common Parameters" section and the next window to appear is as shown in Figure 10-8.
Complete the steps in the "Create Common Parameters" section and the next window to appear is as shown in Figure 10-8.
Figure 10-8 Protocols
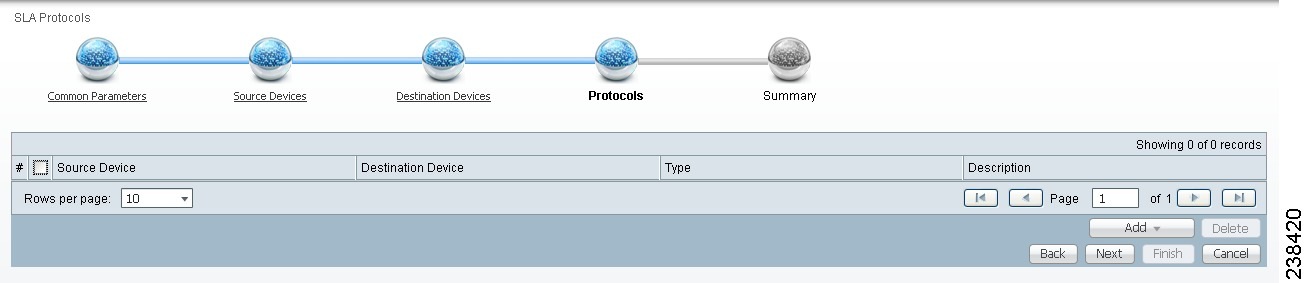
Step 2 ![]() Click the Add drop-down list and select:
Click the Add drop-down list and select:
•![]() ICMP Echo (only available if destination devices are available)—Proceed to Step 3.
ICMP Echo (only available if destination devices are available)—Proceed to Step 3.
•![]() TCP Connect (not available for Create From MPLS PE or MVRF-CE; for all the other Creates, TCP Connect is only available if destination devices are available)—Proceed to Step 4.
TCP Connect (not available for Create From MPLS PE or MVRF-CE; for all the other Creates, TCP Connect is only available if destination devices are available)—Proceed to Step 4.
•![]() UDP Echo (only available if destination devices are available)—Proceed to Step 5.
UDP Echo (only available if destination devices are available)—Proceed to Step 5.
•![]() Jitter (only available if destination devices are available)—Proceed to Step 6.
Jitter (only available if destination devices are available)—Proceed to Step 6.
•![]() FTP (not available for Create from MPLS PE or MVRF-CE)—Proceed to Step 7.
FTP (not available for Create from MPLS PE or MVRF-CE)—Proceed to Step 7.
•![]() DNS (not available for Create from MPLS PE or MVRF-CE)—Proceed to Step 8.
DNS (not available for Create from MPLS PE or MVRF-CE)—Proceed to Step 8.
•![]() HTTP (not available for Create from MPLS PE or MVRF-CE)—Proceed to Step 9.
HTTP (not available for Create from MPLS PE or MVRF-CE)—Proceed to Step 9.
•![]() DHCP (not available for Create from MPLS PE or MVRF-CE)—Proceed to Step 10.
DHCP (not available for Create from MPLS PE or MVRF-CE)—Proceed to Step 10.
Step 3 ![]() From Step 2, if you chose ICMP Echo, a Protocol ICMP Echo window appears.
From Step 2, if you chose ICMP Echo, a Protocol ICMP Echo window appears.
Enter the required information as follows, click OK, and then proceed to Step 11.
•![]() Request Size (0 - 16384) (required)—Number that represents the number of octets (in bytes) to be placed into the data portion of the packet. The default is 28.
Request Size (0 - 16384) (required)—Number that represents the number of octets (in bytes) to be placed into the data portion of the packet. The default is 28.
Step 4 ![]() From Step 2, if you chose TCP Connect, a Protocol TCP Connect window appears.
From Step 2, if you chose TCP Connect, a Protocol TCP Connect window appears.
Enter the required and optional information as follows, click OK, and then proceed to Step 11.
•![]() Destination Port (1 - 65535) (required)—Port number on the target where the monitoring packets is sent. If you do not specify a specific port, port 23 is used.
Destination Port (1 - 65535) (required)—Port number on the target where the monitoring packets is sent. If you do not specify a specific port, port 23 is used.
•![]() Request Size (1 - 16384) (optional)—Number that represents the number of octets (in bytes) to be placed into the data portion of the packet. The default is 1.
Request Size (1 - 16384) (optional)—Number that represents the number of octets (in bytes) to be placed into the data portion of the packet. The default is 1.
Step 5 ![]() From Step 2, if you chose UDP Echo, a Protocol UDP Echo window appears.
From Step 2, if you chose UDP Echo, a Protocol UDP Echo window appears.
Enter the required and optional information as follows, click OK, and then proceed to Step 11.
•![]() Destination Port (1 - 65535) (required)—Port number on the target to where the monitoring packets are sent. If you do not specify a specific port, port 7 is used.
Destination Port (1 - 65535) (required)—Port number on the target to where the monitoring packets are sent. If you do not specify a specific port, port 7 is used.
•![]() Request Size (4 - 8192) (optional)—Number that represents the number of octets (in bytes) to be placed into the data portion of the packet. The default is 16.
Request Size (4 - 8192) (optional)—Number that represents the number of octets (in bytes) to be placed into the data portion of the packet. The default is 16.
Step 6 ![]() From Step 2, if you chose Jitter, a Protocol Jitter window appears.
From Step 2, if you chose Jitter, a Protocol Jitter window appears.
Enter the required and optional information as follows, click OK, and then proceed to Step 11.
•![]() Destination Port (1 - 65535) (required)—Port number on the target where the monitoring packets are sent. If you do not specify a specific port, port 8000 is used.
Destination Port (1 - 65535) (required)—Port number on the target where the monitoring packets are sent. If you do not specify a specific port, port 8000 is used.
•![]() Request Size (16 - 1500) (optional)—Number that represents the number of octets (in bytes) to be placed into the data portion of the packet. The default is 32.
Request Size (16 - 1500) (optional)—Number that represents the number of octets (in bytes) to be placed into the data portion of the packet. The default is 32.
•![]() Number of Packets (1 - 1000) (optional)—Integer that represents the number of packets that must be transmitted. The default value is 10.
Number of Packets (1 - 1000) (optional)—Integer that represents the number of packets that must be transmitted. The default value is 10.
•![]() Interval (1 - 1000) (optional)—Integer, 1 to 1,000, that represents the inter-packet delay between packets in milliseconds.The default value is 20.
Interval (1 - 1000) (optional)—Integer, 1 to 1,000, that represents the inter-packet delay between packets in milliseconds.The default value is 20.
Step 7 ![]() From Step 2, if you chose FTP, a Protocol FTP window appears.
From Step 2, if you chose FTP, a Protocol FTP window appears.
Enter the required and optional information as follows, click OK, and then proceed to Step 11.
•![]() User Name (optional)—If blank, anonymous is used.
User Name (optional)—If blank, anonymous is used.
•![]() Password (optional)—If blank, test is used.
Password (optional)—If blank, test is used.
•![]() Host IP Address (required)—Enter the IP address for File Transfer Protocol (FTP).
Host IP Address (required)—Enter the IP address for File Transfer Protocol (FTP).
•![]() File Path (required)—Enter the path of the file you want to FTP on the FTP server.
File Path (required)—Enter the path of the file you want to FTP on the FTP server.
Step 8 ![]() From Step 2, if you chose DNS, a Protocol DNS window appears.
From Step 2, if you chose DNS, a Protocol DNS window appears.
Enter the required information as follows, click OK, and then proceed to Step 11.
•![]() Name Server (required)—String that specifies the IP address of the name server. The address is in dotted IP address format.
Name Server (required)—String that specifies the IP address of the name server. The address is in dotted IP address format.
•![]() Name to be Resolved (required)—String that is either the name or the IP address that is to be resolved by the DNS server. If the string is a name, the length is 255 characters. If the string is an IP address, it is in dotted IP address format.
Name to be Resolved (required)—String that is either the name or the IP address that is to be resolved by the DNS server. If the string is a name, the length is 255 characters. If the string is an IP address, it is in dotted IP address format.
•![]() Request Size (0 - 16384) (required)—Number that represents the number of octets (in bytes) to be placed into the data portion of the packet. The default is 1.
Request Size (0 - 16384) (required)—Number that represents the number of octets (in bytes) to be placed into the data portion of the packet. The default is 1.
Step 9 ![]() From Step 2, if you chose HTTP, a Protocol HTTP window appears.
From Step 2, if you chose HTTP, a Protocol HTTP window appears.
Enter the optional and required information as follows, click OK, and then proceed to Step 11.
•![]() Version (default: 1.0)—String that specifies the version of the HTTP server. Do not change this. Prime Fulfillment only supports version 1.0.
Version (default: 1.0)—String that specifies the version of the HTTP server. Do not change this. Prime Fulfillment only supports version 1.0.
•![]() URL (required)—String that represents the URL to which an HTTP probe should communicate, HTTPServerName[/directory]/filename or HTTPServerAddress[/directory]/filename (for example: http://www.cisco.com/index.html or http://209.165.201.22/index.html). If you specify the HTTPServerName, the Name Server is required. If you specify the HTTPServerAddress, the Name Server is not required.
URL (required)—String that represents the URL to which an HTTP probe should communicate, HTTPServerName[/directory]/filename or HTTPServerAddress[/directory]/filename (for example: http://www.cisco.com/index.html or http://209.165.201.22/index.html). If you specify the HTTPServerName, the Name Server is required. If you specify the HTTPServerAddress, the Name Server is not required.
•![]() Cache (default: selected, which means Yes)—For an unchecked check box, the HTTP request should not download cached pages. For a checked check box, the HTTP request downloads cached pages if available, otherwise the request is forwarded to the HTTP server.
Cache (default: selected, which means Yes)—For an unchecked check box, the HTTP request should not download cached pages. For a checked check box, the HTTP request downloads cached pages if available, otherwise the request is forwarded to the HTTP server.
•![]() Proxy Server (optional)—String that represents the proxy server information (with a maximum of 255 characters). The default is the null string.
Proxy Server (optional)—String that represents the proxy server information (with a maximum of 255 characters). The default is the null string.
•![]() Name Server (optional, dependent on the URL setting)—String that specifies the IP address of the name server. The address is in dotted IP address format.
Name Server (optional, dependent on the URL setting)—String that specifies the IP address of the name server. The address is in dotted IP address format.
•![]() Operation (default: HTTPGet)—If you want HTTPRaw, which represents the HTTP request with user defined payload, instead of the default HTTPGet which represents the HTTP get request, use the drop-down list and make that choice.
Operation (default: HTTPGet)—If you want HTTPRaw, which represents the HTTP request with user defined payload, instead of the default HTTPGet which represents the HTTP get request, use the drop-down list and make that choice.
•![]() Raw Request (required if the Operation is HTTPRaw; not available if the Operation is HTTPGet)—String that is only needed if the Operation is HTTPRaw. It allows you to invoke other types of HTTP operations other than the simple GET operation.
Raw Request (required if the Operation is HTTPRaw; not available if the Operation is HTTPGet)—String that is only needed if the Operation is HTTPRaw. It allows you to invoke other types of HTTP operations other than the simple GET operation.
•![]() Request Size (1 - 16384) (required)—Number that represents the number of octets (in bytes) to be placed into the data portion of the packet. The default is 28.
Request Size (1 - 16384) (required)—Number that represents the number of octets (in bytes) to be placed into the data portion of the packet. The default is 28.
Step 10 ![]() From Step 2, if you chose DHCP, a Protocol DHCP window appears.
From Step 2, if you chose DHCP, a Protocol DHCP window appears.
Enter the required information as follows, click OK, and then proceed to Step 11.
•![]() Destination IP Address (required)
Destination IP Address (required)
Step 11 ![]() You return to Figure 10-8 and additional columns of information now appear based on the Protocol information you provided. Before you click Next to proceed, determine if you want to Add more protocols, in which case repeat Step 2 to Step 10, or Delete any of the currently selected protocols, in which case, click Delete and proceed much as in Step 2 to Step 10 to now delete protocols.
You return to Figure 10-8 and additional columns of information now appear based on the Protocol information you provided. Before you click Next to proceed, determine if you want to Add more protocols, in which case repeat Step 2 to Step 10, or Delete any of the currently selected protocols, in which case, click Delete and proceed much as in Step 2 to Step 10 to now delete protocols.
Note ![]() There is no second chance for deleting destination devices. There is no confirm window.
There is no second chance for deleting destination devices. There is no confirm window.
Step 12 ![]() The next window to appear is a Probe Creation Task Summary window that shows the Description (date and time created), Common Parameters, Source Devices, Destination Devices, and Protocols that you have defined. If all exists the way you want it, click Finish. Otherwise, click Back and make corrections.
The next window to appear is a Probe Creation Task Summary window that shows the Description (date and time created), Common Parameters, Source Devices, Destination Devices, and Protocols that you have defined. If all exists the way you want it, click Finish. Otherwise, click Back and make corrections.
Details
When you choose Inventory > Device Tools > SLA, you can get details by following these steps:
Step 1 ![]() Select an existing probe by checking the corresponding check box for which you want details. Then you have access to the Details button.
Select an existing probe by checking the corresponding check box for which you want details. Then you have access to the Details button.
Step 2 ![]() After you click the Details button, you receive a SLA Probes Details window. This includes the Common Attributes information defined when you first Create and the Protocol Specific Attributes information defined in the section Protocols.
After you click the Details button, you receive a SLA Probes Details window. This includes the Common Attributes information defined when you first Create and the Protocol Specific Attributes information defined in the section Protocols.
Step 3 ![]() Click OK to return. You can continue to select more Details or complete another function.
Click OK to return. You can continue to select more Details or complete another function.
Delete
When you choose Inventory > Device Tools > SLA, you can delete probes from the list by following these steps:
Step 1 ![]() Select one or more existing probes by checking the check box(es) for the row(s) of existing probe(s). Then you have access to the Delete button.
Select one or more existing probes by checking the check box(es) for the row(s) of existing probe(s). Then you have access to the Delete button.
Step 2 ![]() After you click the Delete button, a confirmation window appears.
After you click the Delete button, a confirmation window appears.
Step 3 ![]() Click OK if it reflects what you want to delete or click Cancel if it does not.
Click OK if it reflects what you want to delete or click Cancel if it does not.
Note ![]() After the probe is deleted, it is deleted from the probe list page but still remains in the database.
After the probe is deleted, it is deleted from the probe list page but still remains in the database.
You return to window with updated information.
Enable Probes
When you choose Inventory > Device Tools > SLA, you can enable probes by following these steps:
Step 1 ![]() Select one or more existing probes by checking the check box(es) for the row(s) of existing probe(s). Then you have access to the Enable button. From the Enable drop-down list, you have access to Probes.
Select one or more existing probes by checking the check box(es) for the row(s) of existing probe(s). Then you have access to the Enable button. From the Enable drop-down list, you have access to Probes.
Step 2 ![]() After you choose Enable > Probes, a confirm enable probes window appears.
After you choose Enable > Probes, a confirm enable probes window appears.
Step 3 ![]() Click OK if it reflects the probes you want to enable or click Cancel if it does not.
Click OK if it reflects the probes you want to enable or click Cancel if it does not.
If this was successful, you receive a Status window with a green check mark for Succeeded. The Status column is set to Active when the probe is created successfully on the router.
Enable Traps
When you choose Inventory > Device Tools > SLA, you can enable traps by following these steps:
Step 1 ![]() Select one or more existing probes by checking the check box(es) for the row(s) of existing probe(s). Then you have access to the Enable button. From the Enable drop-down list, you have access to Traps.
Select one or more existing probes by checking the check box(es) for the row(s) of existing probe(s). Then you have access to the Enable button. From the Enable drop-down list, you have access to Traps.
Step 2 ![]() After you choose Enable > Traps, a confirm enable traps window appears. All the traps have 3000 ms as the falling threshold set automatically
After you choose Enable > Traps, a confirm enable traps window appears. All the traps have 3000 ms as the falling threshold set automatically
Step 3 ![]() Click OK if it reflects the traps you want to enable or click Cancel if it does not.
Click OK if it reflects the traps you want to enable or click Cancel if it does not.
If this was successful, you receive a Status window with a green check mark for Succeeded. The Traps Enabled column is set to yes when the probes on the router are successfully changed.
Disable Probes
When you choose Inventory > Device Tools > SLA, you can use Disable Probes to delete probes on the devices. Follow these steps:
Step 1 ![]() Select one or more enabled probes by checking the check box(es) for the row(s) of existing probe(s). Then you have access to the Disable button. From the Disable drop-down list, you have access to Probes.
Select one or more enabled probes by checking the check box(es) for the row(s) of existing probe(s). Then you have access to the Disable button. From the Disable drop-down list, you have access to Probes.
Step 2 ![]() After you choose Disable > Probes, a confirm disable probes window appears.
After you choose Disable > Probes, a confirm disable probes window appears.
Step 3 ![]() Click OK if it reflects the probes you want to disable or click Cancel if it does not.
Click OK if it reflects the probes you want to disable or click Cancel if it does not.
If this was successful, you receive a Status window with a green check mark for Succeeded, and the probe's status becomes Disabled when the probe on the router is successfully removed.
Disable Traps
When you choose Inventory > Device Tools > SLA, you can disable traps by following these steps:
Step 1 ![]() Select one or more existing probes by checking the check box(es) for the row(s) of existing probe(s). Then you have access to the Disable button. From the Disable drop-down list, you have access to Traps.
Select one or more existing probes by checking the check box(es) for the row(s) of existing probe(s). Then you have access to the Disable button. From the Disable drop-down list, you have access to Traps.
Step 2 ![]() After you choose Disable > Traps, a confirm disable traps window appears.
After you choose Disable > Traps, a confirm disable traps window appears.
Step 3 ![]() Click OK if it reflects the traps you want to disable or click Cancel if it does not.
Click OK if it reflects the traps you want to disable or click Cancel if it does not.
If this was successful, you receive a Status window with a green check mark for Succeeded. The traps are disabled when the probes on the router are successfully changed.
Reports
When you choose Inventory > Device Tools > SLA, you receive a window as shown in Figure 10-9.
Figure 10-9 SLA Reports
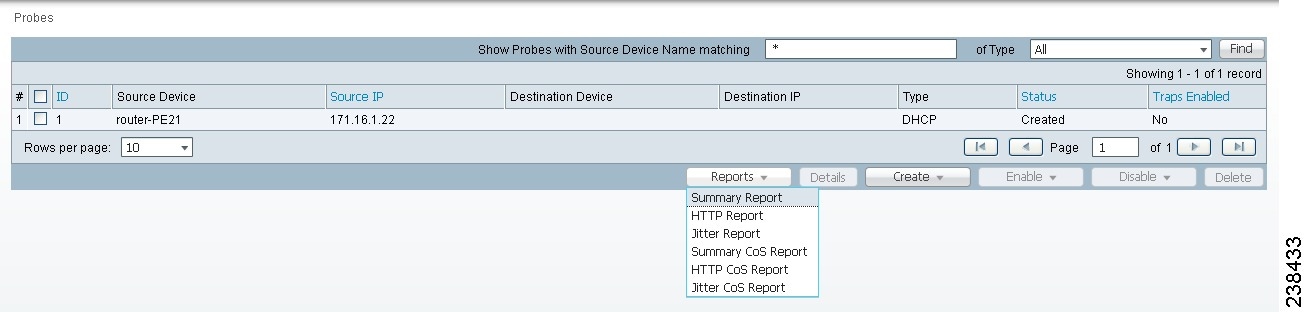
You can then click on any of the following choices and receive that report
•![]() Summary Report—This report summarizes all the information other than for HTTP and Jitter (ICMP Echo, TCP Connect, UDP Echo, FTP, DNS, and DHCP).
Summary Report—This report summarizes all the information other than for HTTP and Jitter (ICMP Echo, TCP Connect, UDP Echo, FTP, DNS, and DHCP).
•![]() HTTP Report—This is a summary report for HTTP information.
HTTP Report—This is a summary report for HTTP information.
•![]() Jitter Report—This is a summary report for Jitter information.
Jitter Report—This is a summary report for Jitter information.
•![]() Summary CoS Report—This report a summary report for Class of Service (CoS) other than for HTTP and Jitter (ICMP Echo, TCP Connect, UDP Echo, FTP, DNS, and DHCP).
Summary CoS Report—This report a summary report for Class of Service (CoS) other than for HTTP and Jitter (ICMP Echo, TCP Connect, UDP Echo, FTP, DNS, and DHCP).
•![]() HTTP CoS Report—This report is for HTTP CoS information.
HTTP CoS Report—This report is for HTTP CoS information.
•![]() Jitter CoS Report—This report is for Jitter CoS information.
Jitter CoS Report—This report is for Jitter CoS information.
Summary Report
From Figure 10-9, choose Summary Report and follow these steps:
Step 1 ![]() Choose Summary Report, and the resulting window is shown in Figure 10-10.
Choose Summary Report, and the resulting window is shown in Figure 10-10.
Figure 10-10 Parameters of Summary Report
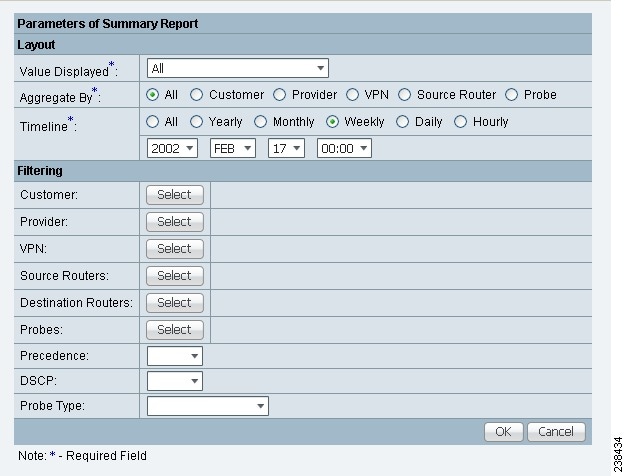
Step 2 ![]() For Figure 10-10, fill in the Layout fields, as follows:
For Figure 10-10, fill in the Layout fields, as follows:
•![]() Value Displayed (required) (default: All) Click the drop-down list and choose one of the following:
Value Displayed (required) (default: All) Click the drop-down list and choose one of the following:
–![]() All—To display all the values.
All—To display all the values.
–![]() Connections (#)—To display the number of connections.
Connections (#)—To display the number of connections.
–![]() Timeouts (#)—To display the number of timeouts.
Timeouts (#)—To display the number of timeouts.
–![]() Connectivity (%)—To display connectivity as a percentage.
Connectivity (%)—To display connectivity as a percentage.
–![]() Threshold Violations (%)—To display threshold violations as a percentage.
Threshold Violations (%)—To display threshold violations as a percentage.
–![]() Max Delay (ms)—To display the maximum delay in milliseconds.
Max Delay (ms)—To display the maximum delay in milliseconds.
–![]() Min Delay (ms)—To display the minimum delay in milliseconds.
Min Delay (ms)—To display the minimum delay in milliseconds.
–![]() Avg Delay (ms)—To display the average delay in milliseconds.
Avg Delay (ms)—To display the average delay in milliseconds.
•![]() Aggregate By (required) (default: All) Click the radio button for how you want to aggregate the data, by All, Customer, Provider, VPN, Source Router, or Probe.
Aggregate By (required) (default: All) Click the radio button for how you want to aggregate the data, by All, Customer, Provider, VPN, Source Router, or Probe.
•![]() Timeline (required) (default: Weekly; starting with midnight of the first day of the selected week) Click the radio button for the report data that you want to display, All data; Yearly data; Monthly data; Weekly data; Daily data; or Hourly data. Also click the drop-down lists for the year, month, day of the month, and time of day for which to start the report.
Timeline (required) (default: Weekly; starting with midnight of the first day of the selected week) Click the radio button for the report data that you want to display, All data; Yearly data; Monthly data; Weekly data; Daily data; or Hourly data. Also click the drop-down lists for the year, month, day of the month, and time of day for which to start the report.
Step 3 ![]() For Figure 10-10, fill in the Filtering fields, as follows.
For Figure 10-10, fill in the Filtering fields, as follows.
Note ![]() The report contains only the data that fulfills all the conditions in the filtering fields (all the conditions are ANDed together).
The report contains only the data that fulfills all the conditions in the filtering fields (all the conditions are ANDed together).
•![]() Customer (optional)—Click the Select button and from the resulting list of Customers, filter the list if you choose. From the listed Customers, click the radio button for the Customer for which you want this SLA report. Then click Select. The result is that you return to Figure 10-10 and the selected customer is listed for Customer. You can repeat this process if you want to change your selection.
Customer (optional)—Click the Select button and from the resulting list of Customers, filter the list if you choose. From the listed Customers, click the radio button for the Customer for which you want this SLA report. Then click Select. The result is that you return to Figure 10-10 and the selected customer is listed for Customer. You can repeat this process if you want to change your selection.
•![]() Provider (optional)—Click the Select button and from the resulting list of Providers, filter the list if you choose. From the listed Providers, click the radio button for the Provider for which you want this SLA report. Then click Select. The result is that you return to Figure 10-10 and the selected provider is listed for Provider. You can repeat this process if you want to change your selection.
Provider (optional)—Click the Select button and from the resulting list of Providers, filter the list if you choose. From the listed Providers, click the radio button for the Provider for which you want this SLA report. Then click Select. The result is that you return to Figure 10-10 and the selected provider is listed for Provider. You can repeat this process if you want to change your selection.
•![]() VPN (optional)—Click the Select button and from the resulting list of VPNs, filter the list if you choose. From the listed VPNs, click the radio button for the VPN for which you want this SLA report. Then click Select. The result is that you return to Figure 10-10 and the selected VPN is listed for VPN. You can repeat this process if you want to change your selection.
VPN (optional)—Click the Select button and from the resulting list of VPNs, filter the list if you choose. From the listed VPNs, click the radio button for the VPN for which you want this SLA report. Then click Select. The result is that you return to Figure 10-10 and the selected VPN is listed for VPN. You can repeat this process if you want to change your selection.
•![]() Source Routers (optional)—Click the Select button and from the resulting list of devices, filter the list if you choose. From the listed devices, check the check box(es) for device(s). Then click Select. The result is that you return to Figure 10-10 and Source Routers contains the selected device(s). You can repeat this process if you want to change your selection.
Source Routers (optional)—Click the Select button and from the resulting list of devices, filter the list if you choose. From the listed devices, check the check box(es) for device(s). Then click Select. The result is that you return to Figure 10-10 and Source Routers contains the selected device(s). You can repeat this process if you want to change your selection.
•![]() Destination Routers (optional)—Click the Select button and from the resulting list of devices, filter the list if you choose. From the listed devices, check the check box(es) for device(s). Then click Select. The result is that you return to Figure 10-10 and Destination Routers contains the selected device(s). You can repeat this process if you want to change your selection.
Destination Routers (optional)—Click the Select button and from the resulting list of devices, filter the list if you choose. From the listed devices, check the check box(es) for device(s). Then click Select. The result is that you return to Figure 10-10 and Destination Routers contains the selected device(s). You can repeat this process if you want to change your selection.
•![]() Probes (optional)—Click the Select button and from the resulting list of source probes, filter the list if you choose. From the listed source probes, check the check box(es) for source probe(s). Then click Select. The result is that you return to Figure 10-10 and Probes contains the selected source probe(s). You can repeat this process if you want to change your selection.
Probes (optional)—Click the Select button and from the resulting list of source probes, filter the list if you choose. From the listed source probes, check the check box(es) for source probe(s). Then click Select. The result is that you return to Figure 10-10 and Probes contains the selected source probe(s). You can repeat this process if you want to change your selection.
•![]() Precedence (default: All)—Click the drop-down list to select the other Precedence TOS choices, 0 to 7. These values represent the three most significant bits of the ToS field in an IP header. The meanings of the Precedence values are specified in Table 10-2.
Precedence (default: All)—Click the drop-down list to select the other Precedence TOS choices, 0 to 7. These values represent the three most significant bits of the ToS field in an IP header. The meanings of the Precedence values are specified in Table 10-2.
Note ![]() Prime Fulfillment maps the 0 - 7 PRECEDENCE values to the three most significant ToS bits by left-shifting the value by five positions.
Prime Fulfillment maps the 0 - 7 PRECEDENCE values to the three most significant ToS bits by left-shifting the value by five positions.
Note ![]() Type of Service does not apply to the DNS and DHCP types of SLA probes. Prime Fulfillment ignores any ToS value set for these two types of SLA probes. For example, if you first choose a ToS value of 5, then choose the DNS, DHCP, and ICMP Echo protocols for an SLA probe, Prime Fulfillment applies the selected ToS value to the ICMP Echo probe only.
Type of Service does not apply to the DNS and DHCP types of SLA probes. Prime Fulfillment ignores any ToS value set for these two types of SLA probes. For example, if you first choose a ToS value of 5, then choose the DNS, DHCP, and ICMP Echo protocols for an SLA probe, Prime Fulfillment applies the selected ToS value to the ICMP Echo probe only.
•![]() DSCP (default: All)—Click the drop-down list to select the other DSCP TOS choices, 0 to 63. These values represent the six most significant bits of this ToS field in an IP header. The interpretation of these TOS values is user specified.
DSCP (default: All)—Click the drop-down list to select the other DSCP TOS choices, 0 to 63. These values represent the six most significant bits of this ToS field in an IP header. The interpretation of these TOS values is user specified.
Note ![]() Prime Fulfillment maps the 0 - 63 DSCP values to the six most significant ToS bits by left-shifting the values by two positions.
Prime Fulfillment maps the 0 - 63 DSCP values to the six most significant ToS bits by left-shifting the values by two positions.
•![]() Probe Type (default: All)—Click the drop-down list to select from the following types of probes: ICMP Echo; UDP Echo; TCP Connect; HTTP; DNS; Jitter; DHCP; FTP.
Probe Type (default: All)—Click the drop-down list to select from the following types of probes: ICMP Echo; UDP Echo; TCP Connect; HTTP; DNS; Jitter; DHCP; FTP.
Note ![]() These probe types are explained in detail in the "Protocols" section.
These probe types are explained in detail in the "Protocols" section.
Step 4 ![]() Click OK in Figure 10-10 after you have the information you want.
Click OK in Figure 10-10 after you have the information you want.
The result is a Summary Report with the selections you made listed. You can Modify, Refresh, Print, or Close this report with the appropriate button.
Note ![]() If you choose Modify, you receive a window such as Figure 10-10 in which you can modify your selections as explained in the previous steps.
If you choose Modify, you receive a window such as Figure 10-10 in which you can modify your selections as explained in the previous steps.
HTTP Report
From Figure 10-9, choose HTTP Report and proceed similarly to the "Summary Report" section, with the following exceptions:
•![]() Value Displayed has different drop-down choices.
Value Displayed has different drop-down choices.
•![]() There is no Destination Routers selection.
There is no Destination Routers selection.
•![]() There is no Probe Type drop-down list in the equivalent of Figure 10-10, because the probe type is automatically HTTP. The result is an HTTP Report.
There is no Probe Type drop-down list in the equivalent of Figure 10-10, because the probe type is automatically HTTP. The result is an HTTP Report.
Jitter Report
From Figure 10-9, choose Jitter Report and proceed similarly to the "Summary Report" section, with the following exceptions:
•![]() Value Displayed has different drop-down choices.
Value Displayed has different drop-down choices.
•![]() There is no Destination Routers selection.
There is no Destination Routers selection.
•![]() There is no Probe Type drop-down list in the equivalent of Figure 10-10, because the probe type is automatically Jitter. The result is a Jitter Report.
There is no Probe Type drop-down list in the equivalent of Figure 10-10, because the probe type is automatically Jitter. The result is a Jitter Report.
Summary CoS Report
From Figure 10-9, choose Summary CoS Report for a summary of the Class of Service (CoS) reports, which are based on the TOS values of the SLA probes, and follow these steps:
Step 1 ![]() Choose Summary CoS Report, and the resulting window is shown in Figure 10-11.
Choose Summary CoS Report, and the resulting window is shown in Figure 10-11.
Figure 10-11 Parameters of CoS Summary Report
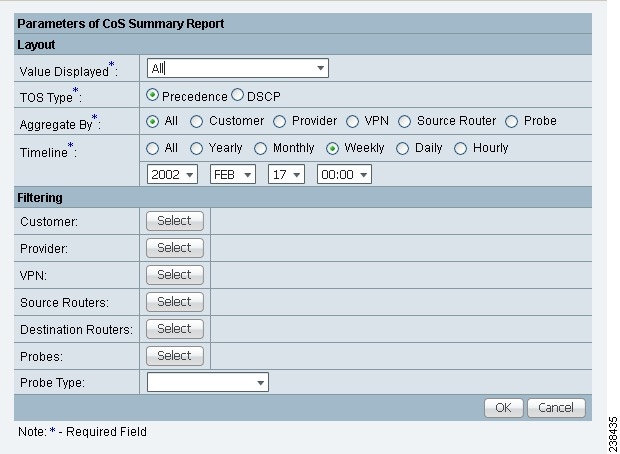
Step 2 ![]() For Figure 10-11, fill in the Layout fields, as shown in Step 2 of the "Summary Report" section, with the following exception. After Value Displayed and before Aggregate By, select the radio button Precedence (default) or DSCP for the new TOS Type. The explanations are given in the Filtering section, Step 3 of the "Summary Report" section.
For Figure 10-11, fill in the Layout fields, as shown in Step 2 of the "Summary Report" section, with the following exception. After Value Displayed and before Aggregate By, select the radio button Precedence (default) or DSCP for the new TOS Type. The explanations are given in the Filtering section, Step 3 of the "Summary Report" section.
Step 3 ![]() For Figure 10-11, fill in the Filtering fields, as shown in Step 3 of the "Summary Report" section, with the exception that there are no Precedence or DSCP drop-down lists. They are now in the Layout fields, as explained in Step 2 in this section.
For Figure 10-11, fill in the Filtering fields, as shown in Step 3 of the "Summary Report" section, with the exception that there are no Precedence or DSCP drop-down lists. They are now in the Layout fields, as explained in Step 2 in this section.
Step 4 ![]() Click OK in Figure 10-11 after you have the information you want.
Click OK in Figure 10-11 after you have the information you want.
The result is a CoS Summary Report with the selections you made listed. You can Modify, Refresh, Print, or Close this report with the appropriate button.
Note ![]() If you choose Modify, you receive a window such as Figure 10-11 in which you can modify your selections as explained in the previous steps.
If you choose Modify, you receive a window such as Figure 10-11 in which you can modify your selections as explained in the previous steps.
HTTP CoS Report
From Figure 10-9, choose HTTP Report and proceed exactly as in the "Summary CoS Report" section, with the following exceptions:
•![]() Value Displayed has the same drop-down choices as HTTP Report.
Value Displayed has the same drop-down choices as HTTP Report.
•![]() There is no Destination Routers selection.
There is no Destination Routers selection.
•![]() There is no Probe Type drop-down list in the equivalent of Figure 10-11, because the probe type is automatically HTTP CoS. The result is a CoS HTTP Report. This CoS HTTP report is based on the TOS values of the SLA probes.
There is no Probe Type drop-down list in the equivalent of Figure 10-11, because the probe type is automatically HTTP CoS. The result is a CoS HTTP Report. This CoS HTTP report is based on the TOS values of the SLA probes.
Jitter CoS Report
From Figure 10-9, choose Jitter Report and proceed exactly as in the "Summary CoS Report" section, with he following exceptions:
•![]() Value Displayed has the same drop-down choices as Jitter Report.
Value Displayed has the same drop-down choices as Jitter Report.
•![]() There is no Destination Routers selection.
There is no Destination Routers selection.
•![]() There is no Probe Type drop-down list in the equivalent of Figure 10-11, because the probe type is automatically Jitter CoS. The result is a CoS Jitter Report. This CoS Jitter report is based on the TOS values of the SLA probes.
There is no Probe Type drop-down list in the equivalent of Figure 10-11, because the probe type is automatically Jitter CoS. The result is a CoS Jitter Report. This CoS Jitter report is based on the TOS values of the SLA probes.
Task Manager
Cisco Prime Fulfillment provides a Task Manager that allows you to view pertinent information about both current and expired tasks of all types, and to create and schedule new tasks, delete specified tasks, and delete the active and expired tasks.
This section contains the following subsections:
Tasks
This section contains the following topics:
•![]() Logs
Logs
Starting Task Manager
To start Task Manager, click Operate > Tasks > Task Manager. The Tasks list page appears.
The Tasks window displays information about each task by Task Name, Type, Targets, Schedules date and time, the User Name who created those tasks, and the date Created on. To view, schedule, or delete the listed tasks, check the corresponding check box.
New Tasks can also be created or audited using this window.
Create
To create a new task, follow these steps:
Step 1 ![]() From the Task Manager Window, click Create. From the resulting drop-down list, you can choose from the following and that choice becomes the Type in Figure 10-12.
From the Task Manager Window, click Create. From the resulting drop-down list, you can choose from the following and that choice becomes the Type in Figure 10-12.
•![]() Collect Config—Collects configuration from devices.
Collect Config—Collects configuration from devices.
•![]() Collect Config From Files—Collects configurations from files for Prime Diagnostics only.
Collect Config From Files—Collects configurations from files for Prime Diagnostics only.
•![]() Enable Disable VFW Traps—Enable or disable the VFW traps.
Enable Disable VFW Traps—Enable or disable the VFW traps.
•![]() L2VPN (L2TPv3) Functional Audit—
L2VPN (L2TPv3) Functional Audit—
•![]() Password Management—Manages user passwords and SNMP community strings.
Password Management—Manages user passwords and SNMP community strings.
•![]() SLA Collection—Collects data from SLA enabled devices.
SLA Collection—Collects data from SLA enabled devices.
•![]() Service Deployment—Deploys an existing SR.
Service Deployment—Deploys an existing SR.
•![]() TE Full Discovery—
TE Full Discovery—
•![]() TE Incremental Discovery—
TE Incremental Discovery—
•![]() TE Interface Performance—Calculates tunnel and interface bandwidth utilization using SNMP.
TE Interface Performance—Calculates tunnel and interface bandwidth utilization using SNMP.
Figure 10-12 Create Tasks
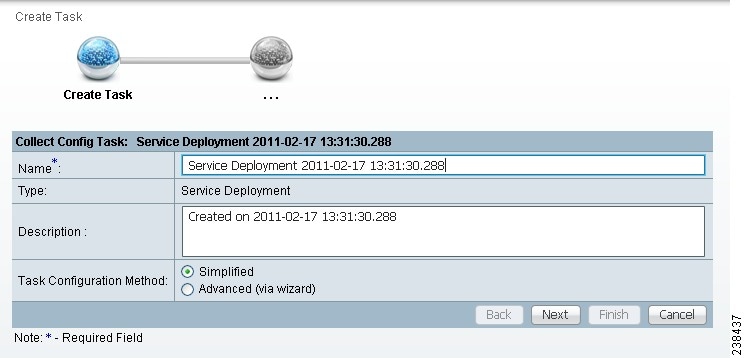
Step 2 ![]() Name—Enter the name of the task. You can accept the default value.
Name—Enter the name of the task. You can accept the default value.
Step 3 ![]() Type—Defined in Step 1.
Type—Defined in Step 1.
Step 4 ![]() Description (optional)—Enter a description.
Description (optional)—Enter a description.
Step 5 ![]() Task Configuration Method (default: Simplified)—Choose Simplified or Advanced (via wizard). If you choose Simplified, you can make many selections in one window. If you choose Advanced (via wizard), you navigate through many windows to make your selections.
Task Configuration Method (default: Simplified)—Choose Simplified or Advanced (via wizard). If you choose Simplified, you can make many selections in one window. If you choose Advanced (via wizard), you navigate through many windows to make your selections.
Step 6 ![]() Click Next to continue.
Click Next to continue.
Depending on what type of task you select, the Task Devices, Task Service Requests, or Configurations File Directory page appears with variations.
Step 7 ![]() Where appropriate, click Select/Deselect to add devices or service requests.
Where appropriate, click Select/Deselect to add devices or service requests.
Note ![]() Step 7 to Step 10 do not apply for Collect Config From Files and TE Interface Performance.
Step 7 to Step 10 do not apply for Collect Config From Files and TE Interface Performance.
Step 8 ![]() In the resulting selection window, select the devices or service requests and click Select.
In the resulting selection window, select the devices or service requests and click Select.
The selected devices or service requests appears.
Step 9 ![]() Groups might or might not appear depending on the task you specify in the previous step. If it does appear, you can add groups of devices, similarly to Step 7 and Step 8. If it does not appear or after you complete this device group selection, proceed to Step 10.
Groups might or might not appear depending on the task you specify in the previous step. If it does appear, you can add groups of devices, similarly to Step 7 and Step 8. If it does not appear or after you complete this device group selection, proceed to Step 10.
Step 10 ![]() Choose the Options.
Choose the Options.
If the Retrieve Interfaces check box is checked, Prime Fulfillment uses Simple Network Management Protocol (SNMP) to retrieve device interface information, such as ifIndex, and so on. If the Retrieve Interfaces check box is unchecked, configuration collection information is still retrieved, but SNMP is not used. All scenarios other than doing IP Service Level Agreement (SLA) probes do not require SNMP or this option.
Step 11 ![]() If Configuration File Directory appears, enter the path to the directory on your Prime Fulfillment server into the Configuration File Directory text box, to indicate the directory on the Prime Fulfillment server where the offline configuration files are stored.
If Configuration File Directory appears, enter the path to the directory on your Prime Fulfillment server into the Configuration File Directory text box, to indicate the directory on the Prime Fulfillment server where the offline configuration files are stored.
Step 12 ![]() For Schedule, click Now, Later, or None. If you choose Later, a Later Schedule category appears. You are then required to click the Edit button and the Task Scheduler page appears.
For Schedule, click Now, Later, or None. If you choose Later, a Later Schedule category appears. You are then required to click the Edit button and the Task Scheduler page appears.
Step 13 ![]() Select information to schedule the task and click OK (default is to schedule Now).
Select information to schedule the task and click OK (default is to schedule Now).
Step 14 ![]() Click Submit to continue.
Click Submit to continue.
The new task is added to the list of tasks.
Audit
To get audit information, click Audit from the Tasks page. From the resulting drop-down list, you can choose from the following and that choice becomes the Type:
•![]() Config Audit—Compares Prime Fulfillment generated configlet against the one in the device.
Config Audit—Compares Prime Fulfillment generated configlet against the one in the device.
•![]() L2VPN (L2TPv3) Functional Audit—Audits L2TPv3 functionality.
L2VPN (L2TPv3) Functional Audit—Audits L2TPv3 functionality.
•![]() MPLS Functional Audit—Audits MPLS functionality.
MPLS Functional Audit—Audits MPLS functionality.
•![]() TE Functional Audit—Checks the Label-Switch Path (LSP) on a router against the LSP stored in the repository.
TE Functional Audit—Checks the Label-Switch Path (LSP) on a router against the LSP stored in the repository.
Details
To get details about a particular task, follow these steps:
Step 1 ![]() From the Tasks page, check a check box for one task for which you want to see a detailed list of information.
From the Tasks page, check a check box for one task for which you want to see a detailed list of information.
Step 2 ![]() Click Details.
Click Details.
Step 3 ![]() Click OK to return.
Click OK to return.
Schedules
To change the scheduling of an existing task, follow these steps:
Step 1 ![]() From the Tasks page, check a check box for the one task for which you want to reset the scheduling directions.
From the Tasks page, check a check box for the one task for which you want to reset the scheduling directions.
Step 2 ![]() Click Schedules.
Click Schedules.
Step 3 ![]() If you want to delete this task, proceed to Step 4. If you want to reset the scheduling directions, proceed to Step 5.
If you want to delete this task, proceed to Step 4. If you want to reset the scheduling directions, proceed to Step 5.
Step 4 ![]() In the new window, check the check box for the task you want to delete and click the Delete button. Then proceed to Step 7.
In the new window, check the check box for the task you want to delete and click the Delete button. Then proceed to Step 7.
Step 5 ![]() In the new window, click Create.
In the new window, click Create.
Step 6 ![]() Make the new scheduling selections you want and click Save to reset the scheduling directions.
Make the new scheduling selections you want and click Save to reset the scheduling directions.
Step 7 ![]() Uncheck any check boxes and click OK to return.
Uncheck any check boxes and click OK to return.
Logs
This selection from the Tasks page, is another way of doing what is explained in the "Task Logs" section.
Delete
To delete one or more tasks, follow these steps:
Step 1 ![]() From the Tasks page, check one or more check boxes for the task(s) you want to delete.
From the Tasks page, check one or more check boxes for the task(s) you want to delete.
You receive a confirmation window.
Step 2 ![]() If you want to delete, click OK. If not, click Cancel.
If you want to delete, click OK. If not, click Cancel.
Step 3 ![]() You return to an updated Tasks page.
You return to an updated Tasks page.
Task Logs
Task Logs can be used to understand the status of a task, whether it completed successfully. You can also use the Task Logs to troubleshoot why a task has failed. To view the Task Logs, follow these steps:
Step 1 ![]() Click Operate > Tasks > Task Logs.
Click Operate > Tasks > Task Logs.
The Task Logs window appears.
This window displays the task by Runtime Task Name, and the Action, Start Time, End Time, and the Status of the task. You can use this window to view or delete the logs.
Step 2 ![]() To view the log, check the check box for the row that represents the task and click the View Log button.
To view the log, check the check box for the row that represents the task and click the View Log button.
The Task Log page appears.
It is possible to set the types of log level you want to view. Specify the Log Level and click on the Filter button to view that information you want to view.
Step 3 ![]() Click Return to Logs to specify another log to view.
Click Return to Logs to specify another log to view.
Reports
When you choose Inventory > Reports > Inventory Reports, a tree of reports appears in the data pane. Click on the + sign for each folder in the data pane and you receive a listing of all the provided reports. The non-SAMPLE reports in the L2VPN folder and the non-SAMPLE reports in the MPLS folder are explained in the Cisco Prime Fulfillment User Guide 6.2.
Click on any of the specific reports and you can define how to set up the report. Figure 10-13, shows the sample file under the folder Inventory.
Figure 10-13 Inventory > SAMPLE - Template Report - Report Window
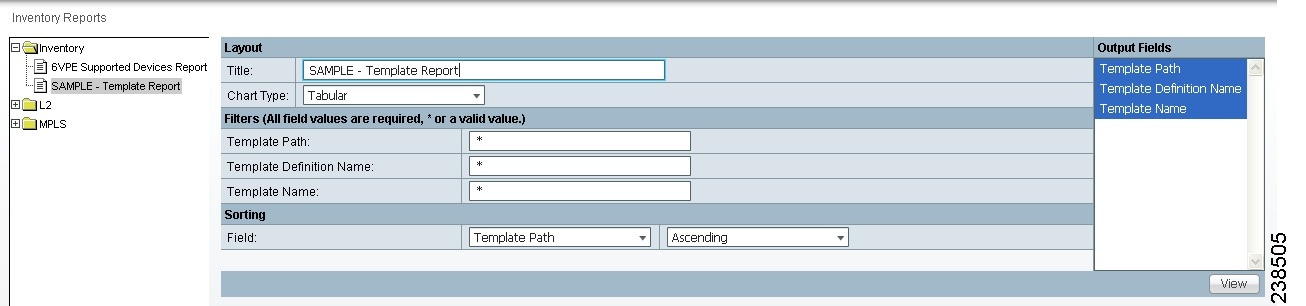
This section explains the Reports feature and how to use it in the following areas:
Introducing Reports
Network operators often want to have detailed reports on the services provisioned. For example, for a given customer, you might want to see a list of the PE-CE connections and their detailed PE-CE configuration parameters or you might want to see specific Layer2 or Layer3 service requests on a PE. These reports help network operators by providing a centralized location for finding Service Requests (SRs) and VPN information.
When you choose Inventory > Reports > Inventory Reports, reports are grouped by type to allow for easy navigation. Prime Fulfillment displays only predefined (canned) reports for which the user has RBAC permission.
You can select the filtering criteria and the outputs to be displayed in the report. You can save reports to a variety of formats.
In addition to the predefined reports that are documented in the Cisco Prime Fulfillment User Guide 6.2, Prime Fulfillment provides additional sample reports. Sample reports are provided for informational purposes only and are untested and unsupported.
The data structures that Prime Fulfillment uses to provide reports in the GUI are defined in an XML format.
Accessing Reports
To access the reports, follow these steps:
Step 1 ![]() To access the reports framework in the Prime Fulfillment GUI, choose Inventory > Reports > Inventory Reports.
To access the reports framework in the Prime Fulfillment GUI, choose Inventory > Reports > Inventory Reports.
Step 2 ![]() Click on the folders to display the available reports.
Click on the folders to display the available reports.
The Reports window appears, as shown in Figure 10-13.
Step 3 ![]() From the reports listed under one of the folders in the left navigation tree, click on the desired report to bring up the window associated with that report.
From the reports listed under one of the folders in the left navigation tree, click on the desired report to bring up the window associated with that report.
Note ![]() Several sample reports are provided in the each of the reports folders. These reports begin with the title SAMPLE-. These reports are provided for informational purposes only. They are untested and unsupported. You might want to use them, along with the supported reports, as a basis for creating your own custom reports. See the "Creating Custom Reports" section for information about custom reports.
Several sample reports are provided in the each of the reports folders. These reports begin with the title SAMPLE-. These reports are provided for informational purposes only. They are untested and unsupported. You might want to use them, along with the supported reports, as a basis for creating your own custom reports. See the "Creating Custom Reports" section for information about custom reports.
Using Reports GUI
This section provides some general comments on using the reports GUI. This information applies to all reports. When you invoke a report, you see a window like the one shown in Figure 10-13.
The window is divided into several areas:
Layout
This area displays the title of the report and allows you to select the chart type. You can enter your own report title by overwriting the Title field.
Note ![]() Only tabular output is supported.
Only tabular output is supported.
Filters
In this pane you can define inputs or search criteria for the reports. Values entered here are compared against corresponding values associated with data objects in the Prime Fulfillment repository. Values must be entered for all fields. An asterisk (*) can be used as a wild-card character for an entire string.
For each filterable field, the GUI displays a label and a text input field. For certain fields, the GUI also displays a Select button that allows you to choose an existing object (for example, customer, Service Type, SR State, and so on). All available output fields are displayed in the window, allowing you to select the fields to include in the report. All output fields are selected by default.
Note ![]() Filter values must be in the same format as the values represented within Prime Fulfillment. For example, a Service Request (SR) ID must be a number.
Filter values must be in the same format as the values represented within Prime Fulfillment. For example, a Service Request (SR) ID must be a number.
Output Fields
In this pane you can choose output fields to be displayed in the report. You can choose any or all of the output fields by selecting them with the mouse. Use the Shift key to select a continuous range of output values. Or, use the Control key to select random output values.
Sorting
This pane allows you to select how you want to sort the report output. For Field:, use the first drop-down list to select each filter field and then the second drop-down list to choose whether to display the report fields in ascending or descending order. The sort order can also be changed after you have the report output displayed (see Figure 10-14).
Running Reports
To run the report, click View in the lower right corner of the report window. This generates the report output. An example of a report output is shown in Figure 10-14.
Figure 10-14 Report Output
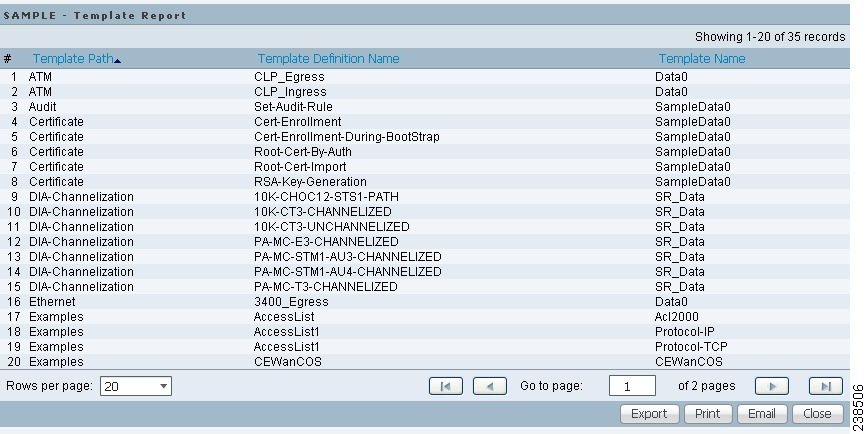
The reports GUI supports output in tabular format. The output is listed in columns, which are derived form the outputs you selected in the reports window.
Each row (or record) represents one match of the search criteria you set using the filter fields in the reports window.
In some cases, the value returned in a field can be displayed as one of the following:
•![]() -1 means no information updated for this field
-1 means no information updated for this field
•![]() F means false
F means false
•![]() T means true
T means true
The column heading with a triangle icon is the output by which the records are sorted. By clicking on any column heading, you can toggle between ascending and descending sort order. To sort on another output value, click on the heading for that value.
From the report output window, you can export, print, or e-mail using the following button:
•![]() Export explained in the "Exporting Reports" section
Export explained in the "Exporting Reports" section
•![]() Print explained in the "Printing Reports" section
Print explained in the "Printing Reports" section
•![]() E-mail explained in the "E-mailing Reports" section
E-mail explained in the "E-mailing Reports" section
Exporting Reports
Click on the Export icon in Figure 10-14 and then follow these steps.
Step 1 ![]() Select the appropriate radio button for the format you want:
Select the appropriate radio button for the format you want:
•![]() PDF file—Adobe's portable document format.
PDF file—Adobe's portable document format.
•![]() CSV file—Comma Separated Values format that allows for the data to be easily exported into a variety of applications.
CSV file—Comma Separated Values format that allows for the data to be easily exported into a variety of applications.
Step 2 ![]() Select the rows you would like to save, then click OK.
Select the rows you would like to save, then click OK.
Prime Fulfillment generates the report in the format you selected.
Note ![]() You must have the appropriate application on your system (for example, Acrobat Reader or Excel) to view and save the output.
You must have the appropriate application on your system (for example, Acrobat Reader or Excel) to view and save the output.
Printing Reports
Click on the Print icon in Figure 10-14.
This window allows you to display the report in a form more appropriate for printing. Select the desired rows, then click OK. The results are displayed in your web browser, from which you can print the report.
E-mailing Reports
Click on the E-mail icon in Figure 10-14 and then follow these steps.
Step 1 ![]() In the To: field (required), specify one or more e-mail addresses to which the report should be sent.
In the To: field (required), specify one or more e-mail addresses to which the report should be sent.
Step 2 ![]() In the From: field (optional), enter an e-mail address you want to appear in the message header.
In the From: field (optional), enter an e-mail address you want to appear in the message header.
This allows a reply message to be sent to a valid e-mail address.
Step 3 ![]() In the CC: field (optional), enter e-mail addresses for recipients you want to receive copies of this report.
In the CC: field (optional), enter e-mail addresses for recipients you want to receive copies of this report.
Step 4 ![]() The subject field shows the title of the report being sent.
The subject field shows the title of the report being sent.
You can overwrite this field to rename the report. This is what appears in the Subject field of the e-mail message.
Step 5 ![]() Select the radio button for the output format (PDF or CSV) in which you want the report sent.
Select the radio button for the output format (PDF or CSV) in which you want the report sent.
Step 6 ![]() Select the number of rows you want sent.
Select the number of rows you want sent.
Step 7 ![]() If applicable, in the Message field, write a message to announce the report, then click Send.
If applicable, in the Message field, write a message to announce the report, then click Send.
Creating Custom Reports
The reports listed in the Prime Fulfillment GUI in the each folder are derived from an underlying configuration file. The file is in XML format. You can access the file in the following location:
$PRIMEF_HOME/resources/nbi/reports/PrimeFulfillment/<folder_name>_report.xml
where <folder_name> is Inventory, L2, or MPLS.
Each of the available reports (including sample reports) is defined by XML content contained within an <objectDef name> start and end tag under packageDef name = "<folder_name>". The intervening XML content specifies the title of the report, all allowable filter parameters, outputs, and the default sorting behavior. You can modify existing reports or copy them to use as templates for new reports.
To do this, follow these steps:
Step 1 ![]() Stop the Prime Fulfillment server using the ./prime.sh stopall command.
Stop the Prime Fulfillment server using the ./prime.sh stopall command.
See "WatchDog Commands" for information on starting and stopping Prime Fulfillment.
Step 2 ![]() Open the $PRIMEF_HOME/resources/nbi/reports/PrimeFulfillment/<folder_name>_report.xml (where: <folder_name> is Inventory, L2, or MPLS) configuration file using an editing tool of your choice.
Open the $PRIMEF_HOME/resources/nbi/reports/PrimeFulfillment/<folder_name>_report.xml (where: <folder_name> is Inventory, L2, or MPLS) configuration file using an editing tool of your choice.
Note ![]() You should back up the file before making any changes to it.
You should back up the file before making any changes to it.
Step 3 ![]() Depending on your needs, either modify an existing report or copy one and use it as the basis for a new one.
Depending on your needs, either modify an existing report or copy one and use it as the basis for a new one.
Step 4 ![]() Save the modified $PRIMEF_HOME/resources/nbi/reports/PrimeFulfillment/<folder_name>_report.xml file.
Save the modified $PRIMEF_HOME/resources/nbi/reports/PrimeFulfillment/<folder_name>_report.xml file.
Step 5 ![]() Restart the Prime Fulfillment server using the ./prime.sh startwd command.
Restart the Prime Fulfillment server using the ./prime.sh startwd command.
See "WatchDog Commands" for information on starting and stopping Prime Fulfillment.
After restarting Prime Fulfillment, the modifications take effect, based on changes you made to the $PRIMEF_HOME/resources/nbi/reports/PrimeFulfillment/<folder_name>_report.xml file.
Generating L2 and VPLS Reports
The Prime Fulfillment reporting GUI is used across multiple Prime Fulfillment modules, including L2 and VPLS. For a general coverage of using the reports GUI, running reports, using the output from reports, and creating customized reports, see Reports. The rest of this section provides information about the L2 and VPLS reports available in Prime Fulfillment.
This section provides information on generating L2 and VPLS reports. It contains the following sections:
•![]() Accessing L2 and VPLS Reports
Accessing L2 and VPLS Reports
•![]() Creating Custom L2 and VPLS Reports
Creating Custom L2 and VPLS Reports
Accessing L2 and VPLS Reports
To access the L2 and VPLS reports, perform the following steps:
Step 1 ![]() To access the reports framework in the Prime Fulfillment GUI, choose Inventory > Reports > Inventory Reports.
To access the reports framework in the Prime Fulfillment GUI, choose Inventory > Reports > Inventory Reports.
The Reports window appears.
Step 2 ![]() Click the L2 folder to display the available L2 and VPLS reports.
Click the L2 folder to display the available L2 and VPLS reports.
Step 3 ![]() Click the icon of a report to bring up the window associated with that report.
Click the icon of a report to bring up the window associated with that report.
Details on each of the reports are provided in L2 and VPLS Reports.
L2 and VPLS Reports
This section provides details on the following L2 and VPLS reports:
•![]() VPLS Attachment Circuit Report
VPLS Attachment Circuit Report
Note ![]() Several sample reports are provided in the L2 reports folder. These reports begin with the title SAMPLE-. These reports are provided for informational purposes only. They are untested and unsupported. You might want to use them as a basis for creating your own custom reports. For more information, see Creating Custom L2 and VPLS Reports.
Several sample reports are provided in the L2 reports folder. These reports begin with the title SAMPLE-. These reports are provided for informational purposes only. They are untested and unsupported. You might want to use them as a basis for creating your own custom reports. For more information, see Creating Custom L2 and VPLS Reports.
The following information is provided for each report:
•![]() Description or purpose of the report.
Description or purpose of the report.
•![]() An illustration of the report window.
An illustration of the report window.
•![]() List of filter values and descriptions.
List of filter values and descriptions.
•![]() List of output values and descriptions.
List of output values and descriptions.
L2 End-to-End Wire Report
An L2 end-to-end wire is a point-to-point connection containing two attachment circuits. The L2 EndtoEndWire report displays the services that are running on L2 end-to-end connections. You can use this report to view all the services and respective attachment circuit attributes for each connection.
Click the L2 EndtoEndWire Report icon to bring up the window for this report.
Filter Values:
•![]() EndToEndWire ID—End-to-end wire identification number.
EndToEndWire ID—End-to-end wire identification number.
•![]() Customer Name—Name of the customer.
Customer Name—Name of the customer.
•![]() VC ID—Virtual circuit identification number.
VC ID—Virtual circuit identification number.
•![]() SR Job ID—Service request job identification number.
SR Job ID—Service request job identification number.
•![]() Service Type—Type of service. Values can be:
Service Type—Type of service. Values can be:
–![]() ATM
ATM
–![]() ATM_NO_CE
ATM_NO_CE
–![]() FRAME_RELAY
FRAME_RELAY
–![]() FRAME_RELAY_NO_CE
FRAME_RELAY_NO_CE
–![]() L2VPN_ERS
L2VPN_ERS
–![]() L2VPN_ERS_NO_CE
L2VPN_ERS_NO_CE
–![]() L2VPN_EWS
L2VPN_EWS
–![]() L2VPN_EWS_NO_CE
L2VPN_EWS_NO_CE
•![]() SR State—Service request state. Values can be:
SR State—Service request state. Values can be:
–![]() BROKEN
BROKEN
–![]() DEPLOYED
DEPLOYED
–![]() FAILED_AUDIT
FAILED_AUDIT
–![]() FAILED_DEPLOY
FAILED_DEPLOY
–![]() FUNCTIONAL
FUNCTIONAL
–![]() INVALID
INVALID
–![]() LOST
LOST
–![]() PENDING
PENDING
–![]() REQUESTED
REQUESTED
–![]() WAIT_DEPLOY
WAIT_DEPLOY
•![]() AC1-ID—First attachment circuit (AC1) identification number.
AC1-ID—First attachment circuit (AC1) identification number.
•![]() AC2-ID—Second attachment circuit (AC2) identification number.
AC2-ID—Second attachment circuit (AC2) identification number.
Output Values:
•![]() EndToEndWire ID—End-to-end wire identification number.
EndToEndWire ID—End-to-end wire identification number.
•![]() Customer Name—Name of the customer.
Customer Name—Name of the customer.
•![]() VPN—Name of the VPN.
VPN—Name of the VPN.
•![]() VC ID—Virtual circuit identification number.
VC ID—Virtual circuit identification number.
•![]() SR ID—Service request identification number.
SR ID—Service request identification number.
•![]() SR Job ID—Service request job identification number.
SR Job ID—Service request job identification number.
•![]() Service Type—Type of service.
Service Type—Type of service.
•![]() SR State—Service request state.
SR State—Service request state.
Note ![]() The SR State output does not list service requests in the CLOSED state. Service requests in other states are listed, as determined by the filter values.
The SR State output does not list service requests in the CLOSED state. Service requests in other states are listed, as determined by the filter values.
•![]() AC1-ID—Identification number of the first attachment circuit (AC1).
AC1-ID—Identification number of the first attachment circuit (AC1).
•![]() AC1-UNI Device Interface—UNI device interface of the first attachment circuit (AC1).
AC1-UNI Device Interface—UNI device interface of the first attachment circuit (AC1).
•![]() AC1-NPC—Named physical circuit for the first attachment circuit (AC1).
AC1-NPC—Named physical circuit for the first attachment circuit (AC1).
•![]() AC2-VLAN ID/DLCI/VCD—VLAN identification number, DLCI (data-link connection identifier) or VCD (virtual circuit descriptor) of the first attachment circuit (AC1).
AC2-VLAN ID/DLCI/VCD—VLAN identification number, DLCI (data-link connection identifier) or VCD (virtual circuit descriptor) of the first attachment circuit (AC1).
•![]() AC1-VPI—Virtual path identifier for the first attachment circuit (AC1).
AC1-VPI—Virtual path identifier for the first attachment circuit (AC1).
•![]() AC1-VCI—Virtual channel identifier for the first attachment circuit (AC1).
AC1-VCI—Virtual channel identifier for the first attachment circuit (AC1).
•![]() AC1-Interface Encap Type—Encapsulation type used for the first attachment circuit (AC1).
AC1-Interface Encap Type—Encapsulation type used for the first attachment circuit (AC1).
•![]() AC1-AccessDomain—Access domain name for the first attachment circuit (AC1).
AC1-AccessDomain—Access domain name for the first attachment circuit (AC1).
•![]() AC1-Customer Facing UNI—Customer-facing UNI port of the first attachment circuit (AC1).
AC1-Customer Facing UNI—Customer-facing UNI port of the first attachment circuit (AC1).
•![]() AC1-Loopback IP Address—Loop back address for the first attachment circuit (AC1).
AC1-Loopback IP Address—Loop back address for the first attachment circuit (AC1).
•![]() AC1-STP Shutdown Threshold—Spanning Tree Protocol shutdown threshold (in packets/second) for the first attachment circuit (AC1).
AC1-STP Shutdown Threshold—Spanning Tree Protocol shutdown threshold (in packets/second) for the first attachment circuit (AC1).
•![]() AC1-VTP Shutdown Threshold—VLAN Trunk Protocol shutdown threshold (in packets/second) for the first attachment circuit (AC1).
AC1-VTP Shutdown Threshold—VLAN Trunk Protocol shutdown threshold (in packets/second) for the first attachment circuit (AC1).
•![]() AC1-CDP Shutdown Threshold—Cisco Discovery Protocol shutdown threshold (in packets/second) for the first attachment circuit (AC1).
AC1-CDP Shutdown Threshold—Cisco Discovery Protocol shutdown threshold (in packets/second) for the first attachment circuit (AC1).
•![]() AC1-STP Drop Threshold—Spanning Tree Protocol drop threshold (in packets/second) for the first attachment circuit (AC1).
AC1-STP Drop Threshold—Spanning Tree Protocol drop threshold (in packets/second) for the first attachment circuit (AC1).
•![]() AC1-CDP Drop Threshold—Cisco Discovery Protocol drop threshold (in packets/second) for the first attachment circuit (AC1).
AC1-CDP Drop Threshold—Cisco Discovery Protocol drop threshold (in packets/second) for the first attachment circuit (AC1).
•![]() AC1-VTP Drop Threshold—VLAN Trunk Protocol drop threshold (in packets/second) for the first attachment circuit (AC1).
AC1-VTP Drop Threshold—VLAN Trunk Protocol drop threshold (in packets/second) for the first attachment circuit (AC1).
•![]() AC1-UNI Recovery Interval—Recovery interval (in seconds) of the UNI port for the first attachment circuit (AC1).
AC1-UNI Recovery Interval—Recovery interval (in seconds) of the UNI port for the first attachment circuit (AC1).
•![]() AC1-UNI Speed—UNI port speed for the first attachment circuit (AC1).
AC1-UNI Speed—UNI port speed for the first attachment circuit (AC1).
•![]() AC1-UNI Shutdown—Shutdown status of the UNI port for the first attachment circuit (AC1).
AC1-UNI Shutdown—Shutdown status of the UNI port for the first attachment circuit (AC1).
•![]() AC1-UNI PortSecurity—Status of UNI port security for the first attachment circuit (AC1).
AC1-UNI PortSecurity—Status of UNI port security for the first attachment circuit (AC1).
•![]() AC1-UNI Duplex—Duplex status (none, full, half, or auto) of the UNI port for the first attachment circuit (AC1).
AC1-UNI Duplex—Duplex status (none, full, half, or auto) of the UNI port for the first attachment circuit (AC1).
•![]() AC1-Maximum MAC Address—Maximum MAC addresses allowed on the UNI port for the first attachment circuit (AC1).
AC1-Maximum MAC Address—Maximum MAC addresses allowed on the UNI port for the first attachment circuit (AC1).
•![]() AC1-UNI Aging—Length of time, in seconds, that MAC addresses can stay in the UNI port security table for the first attachment circuit (AC1).
AC1-UNI Aging—Length of time, in seconds, that MAC addresses can stay in the UNI port security table for the first attachment circuit (AC1).
•![]() AC2-ID—Second attachment circuit (AC2) identification number.
AC2-ID—Second attachment circuit (AC2) identification number.
•![]() AC2-UNI Device Interface—UNI device interface of the second attachment circuit (AC2).
AC2-UNI Device Interface—UNI device interface of the second attachment circuit (AC2).
•![]() AC2-NPC—Named physical circuit for the second attachment circuit (AC2).
AC2-NPC—Named physical circuit for the second attachment circuit (AC2).
•![]() AC2-VLAN ID/DLCI/VCD—The VLAN ID, DLCI or VCD of the second attachment circuit (AC2).
AC2-VLAN ID/DLCI/VCD—The VLAN ID, DLCI or VCD of the second attachment circuit (AC2).
•![]() AC2-VPI—Virtual path identifier for the first attachment circuit (AC2).
AC2-VPI—Virtual path identifier for the first attachment circuit (AC2).
•![]() AC2-VCI—Virtual channel identifier for the first attachment circuit (AC2).
AC2-VCI—Virtual channel identifier for the first attachment circuit (AC2).
•![]() AC2-Interface Encap Type—Encapsulation type used for the second attachment circuit (AC2).
AC2-Interface Encap Type—Encapsulation type used for the second attachment circuit (AC2).
•![]() AC2-AccessDomain—Access domain name for the second attachment circuit (AC2).
AC2-AccessDomain—Access domain name for the second attachment circuit (AC2).
•![]() AC2-Customer Facing UNI—Customer-facing UNI port of the second attachment circuit (AC2).
AC2-Customer Facing UNI—Customer-facing UNI port of the second attachment circuit (AC2).
•![]() AC2-Loopback IP Address—Loop back address for the second attachment circuit (AC2).
AC2-Loopback IP Address—Loop back address for the second attachment circuit (AC2).
•![]() AC2-STP Shutdown Threshold—Spanning Tree Protocol shutdown threshold for the second attachment circuit (AC2).
AC2-STP Shutdown Threshold—Spanning Tree Protocol shutdown threshold for the second attachment circuit (AC2).
•![]() AC2-VTP Shutdown Threshold—VLAN Trunk Protocol shutdown threshold for the second attachment circuit (AC2).
AC2-VTP Shutdown Threshold—VLAN Trunk Protocol shutdown threshold for the second attachment circuit (AC2).
•![]() AC2-CDP Shutdown Threshold—Cisco Discovery Protocol shutdown threshold for the second attachment circuit (AC2).
AC2-CDP Shutdown Threshold—Cisco Discovery Protocol shutdown threshold for the second attachment circuit (AC2).
•![]() AC2-STP Drop Threshold—Spanning Tree Protocol drop threshold for the second attachment circuit (AC2).
AC2-STP Drop Threshold—Spanning Tree Protocol drop threshold for the second attachment circuit (AC2).
•![]() AC2-CDP Drop Threshold—Cisco Discovery Protocol drop threshold for the second attachment circuit.
AC2-CDP Drop Threshold—Cisco Discovery Protocol drop threshold for the second attachment circuit.
•![]() AC2-VTP Drop Threshold—VLAN Trunk Protocol drop threshold for the second attachment circuit (AC2).
AC2-VTP Drop Threshold—VLAN Trunk Protocol drop threshold for the second attachment circuit (AC2).
•![]() AC2-UNI Recovery Interval—Recovery interval of the UNI port for the second attachment circuit (AC2).
AC2-UNI Recovery Interval—Recovery interval of the UNI port for the second attachment circuit (AC2).
•![]() AC2-UNI Speed—UNI port speed for the second attachment circuit (AC2).
AC2-UNI Speed—UNI port speed for the second attachment circuit (AC2).
•![]() AC2-UNI Shutdown—Shutdown status of the UNI port for the second attachment circuit (AC2).
AC2-UNI Shutdown—Shutdown status of the UNI port for the second attachment circuit (AC2).
•![]() AC2-UNI PortSecurity—Status of UNI port security for the second attachment circuit (AC2).
AC2-UNI PortSecurity—Status of UNI port security for the second attachment circuit (AC2).
•![]() AC2-UNI Duplex—Duplex status (none, full, half, or auto) of the UNI port for the second attachment circuit (AC2).
AC2-UNI Duplex—Duplex status (none, full, half, or auto) of the UNI port for the second attachment circuit (AC2).
•![]() AC2-Maximum MAC Address—Maximum MAC addresses allowed on the UNI port for the second attachment circuit (AC2).
AC2-Maximum MAC Address—Maximum MAC addresses allowed on the UNI port for the second attachment circuit (AC2).
•![]() AC2-UNI Aging—Length of time, in seconds, that MAC addresses can stay in the UNI port security table for the second attachment circuit (AC2).
AC2-UNI Aging—Length of time, in seconds, that MAC addresses can stay in the UNI port security table for the second attachment circuit (AC2).
L2 PE Service Report
The L2 PE Service report allows you to choose PEs and display their roles (for example, N-PE, U-PE or PE-AGG) and L2-related services that are running on them.
Click the L2 PE Service Report icon to bring up the window for this report.
Filter Values:
•![]() PE Role—PE device role (N-PE, U-PE, or PE-AGG).
PE Role—PE device role (N-PE, U-PE, or PE-AGG).
•![]() PE Name—PE device name.
PE Name—PE device name.
Output Values:
•![]() PE Role—PE device role (N-PE, U-PE, or PE-AGG).
PE Role—PE device role (N-PE, U-PE, or PE-AGG).
•![]() PE Name—PE device name.
PE Name—PE device name.
•![]() SR ID—Service request identification number.
SR ID—Service request identification number.
•![]() SR Job ID—Service request job identification number.
SR Job ID—Service request job identification number.
•![]() SR State—Service request state.
SR State—Service request state.
Note ![]() The SR State output does not list service requests in the CLOSED state. Service requests in other states are listed, as determined by the filter values.
The SR State output does not list service requests in the CLOSED state. Service requests in other states are listed, as determined by the filter values.
•![]() Service Type—Type of service.
Service Type—Type of service.
L2 VPN Report
The L2 VPN Report provides a way to track a VLAN ID and/or VC ID back to the VPN and customer without having to iterate through every link and every VPN service. Given a VLAN ID or VC ID, the respective customer and VPN details are displayed in the report.
Click the L2 VPN Report icon to bring up the window for this report.
Filter Values:
•![]() VLAN ID—VLAN identification number.
VLAN ID—VLAN identification number.
•![]() VC ID—Virtual circuit identification number.
VC ID—Virtual circuit identification number.
•![]() Customer Name—Name of the customer.
Customer Name—Name of the customer.
•![]() Access Domain—Access domain name.
Access Domain—Access domain name.
Output Values:
•![]() VLAN ID—VLAN identification number.
VLAN ID—VLAN identification number.
•![]() VC ID—Virtual circuit identification number.
VC ID—Virtual circuit identification number.
•![]() SR Job ID—Service request job identification number
SR Job ID—Service request job identification number
•![]() VPN—Name of the VPN.
VPN—Name of the VPN.
•![]() Customer Name—Name of the customer.
Customer Name—Name of the customer.
•![]() Service Type—Type of service.
Service Type—Type of service.
•![]() Access Domain—Access domain name.
Access Domain—Access domain name.
•![]() Provider Name—Name of the provider.
Provider Name—Name of the provider.
VPLS Attachment Circuit Report
The VPLS Attachment circuit report displays details of attachment circuits for a given customer VPN.
Click the VPLS Attachment Circuit Report icon to bring up the window for this report.
Filter Values:
•![]() SR ID—Service request identification number.
SR ID—Service request identification number.
•![]() SR Job ID—Service request job identification number.
SR Job ID—Service request job identification number.
•![]() SR State—Service request state. Values can be:
SR State—Service request state. Values can be:
–![]() BROKEN
BROKEN
–![]() DEPLOYED
DEPLOYED
–![]() FAILED_AUDIT
FAILED_AUDIT
–![]() FAILED_DEPLOY
FAILED_DEPLOY
–![]() FUNCTIONAL
FUNCTIONAL
–![]() INVALID
INVALID
–![]() LOST
LOST
–![]() PENDING
PENDING
–![]() REQUESTED
REQUESTED
–![]() WAIT_DEPLOY
WAIT_DEPLOY
•![]() Customer Name—Name of the customer.
Customer Name—Name of the customer.
•![]() VPN—Name of the VPN.
VPN—Name of the VPN.
•![]() Service Type—Type of service. Values can be:
Service Type—Type of service. Values can be:
–![]() VPLS_ERS
VPLS_ERS
–![]() VPLS_ERS_NO_CE
VPLS_ERS_NO_CE
–![]() VPLS_EWS
VPLS_EWS
–![]() VPLS_EWS_NO_CE
VPLS_EWS_NO_CE
•![]() VLAN ID—VLAN identification number.
VLAN ID—VLAN identification number.
•![]() AccessDomain—Access domain name.
AccessDomain—Access domain name.
Output Values:
•![]() VPLS Link ID—VPLS link identification number.
VPLS Link ID—VPLS link identification number.
•![]() SR ID—Service request identification number
SR ID—Service request identification number
•![]() SR Job ID—Service request job identification number.
SR Job ID—Service request job identification number.
•![]() SR State—Service request state.
SR State—Service request state.
Note ![]() The SR State output does not list service requests in the CLOSED state. Service requests in other states are listed, as determined by the filter values.
The SR State output does not list service requests in the CLOSED state. Service requests in other states are listed, as determined by the filter values.
•![]() Customer Name—Name of the customer.
Customer Name—Name of the customer.
•![]() VPN—Name of the VPN.
VPN—Name of the VPN.
•![]() Service Type—Type of service.
Service Type—Type of service.
•![]() VLAN ID—VLAN identification number.
VLAN ID—VLAN identification number.
•![]() Policy Name—Name of the VPLS policy.
Policy Name—Name of the VPLS policy.
•![]() VFI Interface—Virtual forwarding interface name.
VFI Interface—Virtual forwarding interface name.
•![]() Customer Facing UNI—Customer-facing UNI port.
Customer Facing UNI—Customer-facing UNI port.
•![]() AccessDomain—Access domain name.
AccessDomain—Access domain name.
•![]() NPC—Named physical circuit.
NPC—Named physical circuit.
•![]() UNI Port—UNI port.
UNI Port—UNI port.
•![]() UNI Shutdown—Shutdown status of the UNI port.
UNI Shutdown—Shutdown status of the UNI port.
•![]() UNI Aging—Length of time, in seconds, that MAC addresses can stay in the UNI port security table.
UNI Aging—Length of time, in seconds, that MAC addresses can stay in the UNI port security table.
•![]() UNI Speed—UNI port speed.
UNI Speed—UNI port speed.
•![]() UNI Duplex—Duplex status (none, full, half, or auto) of the UNI port.
UNI Duplex—Duplex status (none, full, half, or auto) of the UNI port.
•![]() Maximum MAC Address—Maximum MAC addresses allowed on the UNI port.
Maximum MAC Address—Maximum MAC addresses allowed on the UNI port.
•![]() CDP Shutdown Threshold—Cisco Discovery Protocol shutdown threshold (in packets/second) on the UNI port.
CDP Shutdown Threshold—Cisco Discovery Protocol shutdown threshold (in packets/second) on the UNI port.
•![]() STP Shutdown Threshold—Spanning Tree Protocol shutdown threshold (in packets/second) on the UNI port.
STP Shutdown Threshold—Spanning Tree Protocol shutdown threshold (in packets/second) on the UNI port.
•![]() VTP Shutdown Threshold—VLAN Trunk Protocol shutdown threshold (in packets/second) on the UNI port.
VTP Shutdown Threshold—VLAN Trunk Protocol shutdown threshold (in packets/second) on the UNI port.
•![]() CDP Drop Threshold—Cisco Discovery Protocol drop threshold (in packets/second) on the UNI port.
CDP Drop Threshold—Cisco Discovery Protocol drop threshold (in packets/second) on the UNI port.
•![]() VTP Drop Threshold—VLAN Trunk Protocol drop threshold (in packets/second) on the UNI port.
VTP Drop Threshold—VLAN Trunk Protocol drop threshold (in packets/second) on the UNI port.
•![]() STP Drop Threshold—Spanning Tree Protocol drop threshold (in packets/second) on the UNI port.
STP Drop Threshold—Spanning Tree Protocol drop threshold (in packets/second) on the UNI port.
•![]() Recovery Interval—Recovery interval (in seconds) of the UNI port.
Recovery Interval—Recovery interval (in seconds) of the UNI port.
VPLS PE Service Report
The VPLS PE Service report allows you to choose PEs and display their roles (for example, N-PE, U-PE or PE-AGG) and the VPLS services that are running on them.
Click the VPLS PE Service Report icon to bring up the window for this report.
Filter Values:
•![]() PE Role—PE device role (N-PE, U-PE, or PE-AGG).
PE Role—PE device role (N-PE, U-PE, or PE-AGG).
•![]() PE Name—PE device name.
PE Name—PE device name.
Output Values:
•![]() PE Role—PE device role (N-PE, U-PE, or PE-AGG).
PE Role—PE device role (N-PE, U-PE, or PE-AGG).
•![]() PE Name—PE device name.
PE Name—PE device name.
•![]() SR ID—Service request identification number.
SR ID—Service request identification number.
•![]() SR Job ID—Service request job identification number.
SR Job ID—Service request job identification number.
•![]() Service Type—Type of service.
Service Type—Type of service.
•![]() SR State—Service request state.
SR State—Service request state.
Note ![]() The SR State output does not list service requests in the CLOSED state. Service requests in other states are listed, as determined by the filter values.
The SR State output does not list service requests in the CLOSED state. Service requests in other states are listed, as determined by the filter values.
VPLS VPN Report
The VPLS VPN report provides a way to track a VLAN ID and/or VFI Name back to the VPN and customer without having to iterate through every link and every VPN service. Given a VLAN ID or VFI name, the respective customer and VPN details are displayed in the report.
Click the VPLS VPN Report icon to bring up the window for this report.
Filter Values:
•![]() VLAN ID—VLAN identification number.
VLAN ID—VLAN identification number.
•![]() Customer Name—Name of the customer.
Customer Name—Name of the customer.
•![]() VFI Name—Virtual forwarding interface name.
VFI Name—Virtual forwarding interface name.
•![]() Access Domain—Access domain name.
Access Domain—Access domain name.
Output Values:
•![]() VLAN ID—VLAN identification number.
VLAN ID—VLAN identification number.
•![]() SR Job ID—Service request job identification number.
SR Job ID—Service request job identification number.
•![]() VPN—Name of the VPN.
VPN—Name of the VPN.
•![]() Customer Name—Name of the customer.
Customer Name—Name of the customer.
•![]() Service Type—Type of service.
Service Type—Type of service.
•![]() VFI Name—Virtual forwarding interface name.
VFI Name—Virtual forwarding interface name.
•![]() Access Domain—Access domain name.
Access Domain—Access domain name.
•![]() Provider Name—Name of the provider.
Provider Name—Name of the provider.
Creating Custom L2 and VPLS Reports
The reports listed in the Prime Fulfillment GUI in the L2 folder are derived from an underlying configuration file. The file is in XML format. You can access the file in the following location:
$ISC_HOME/resources/nbi/reports/ISC/l2_report.xml
See Reports for details on how to modify report configuration files to create custom reports.
Generating MPLS Reports
The Prime Fulfillment reporting GUI is used across multiple Prime Fulfillment modules, including MPLS. The rest of this chapter provides information about the MPLS reports available in ISC.
This section provides information on generating MPLS reports. It contains the following sections:
•![]() MPLS Service Request Report - 6VPE
MPLS Service Request Report - 6VPE
•![]() 6VPE Supported Devices Report
6VPE Supported Devices Report
Accessing MPLS Reports
To access MPLS reports, perform the following steps:
Step 1 ![]() Log into Prime Fulfillment.
Log into Prime Fulfillment.
Step 2 ![]() Go to: Monitoring > Reports.
Go to: Monitoring > Reports.
Step 3 ![]() Click on the MPLS folder to display the available MPLS reports.
Click on the MPLS folder to display the available MPLS reports.
The Reports window appears, as shown in Figure 10-15.
Figure 10-15 Reports List
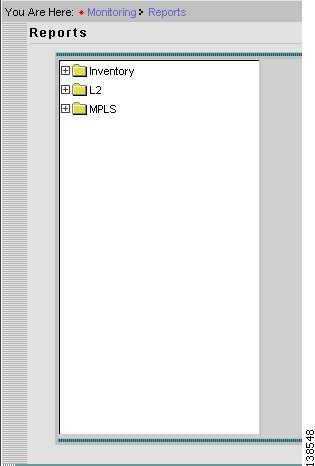
Step 4 ![]() From the reports listed under MPLS in the left navigation tree, click on the desired report to bring up the window associated with that report.
From the reports listed under MPLS in the left navigation tree, click on the desired report to bring up the window associated with that report.
Note ![]() Several sample reports are provided in the MPLS reports folder. These reports begin with the title SAMPLE-. These reports are provided for informational purposes only. They are untested and unsupported. You might want to use them, along with the supported reports, as a basis for creating your own custom reports. See Creating Custom Reports, for information on custom reports.
Several sample reports are provided in the MPLS reports folder. These reports begin with the title SAMPLE-. These reports are provided for informational purposes only. They are untested and unsupported. You might want to use them, along with the supported reports, as a basis for creating your own custom reports. See Creating Custom Reports, for information on custom reports.
Running Reports
To run the report, click View in the lower right corner of the report window. This generates the report output. An example of an MPLS service request report output.
In the current release of ISC, the reports GUI supports output in tabular format. The output is listed in columns, which are derived form the outputs you selected in the reports window.
Each row (or record) represents one match of the search criteria you set using the filter fields in the reports window.
The column heading with a triangle icon is the output that the records are sorted by. By clicking on any column heading, you can toggle between and ascending and descend sort order. To sort on another output value, click on the heading for that value.
MPLS PE Service Report
The MPLS PE Service report allows you to choose PEs and display their roles (for example, N-PE, U-PE or PE-AGG) and MPLS-related services that are running on them.
Click the MPLS Service Report icon to bring up the window for this report, as shown in Figure 10-16.
Figure 10-16 MPLS PE Service Report
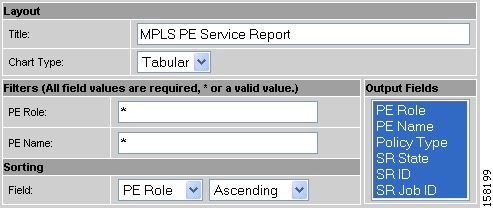
Filter Values
•![]() PE Role—PE device role (N-PE, U-PE, or PE-AGG).
PE Role—PE device role (N-PE, U-PE, or PE-AGG).
•![]() PE Name—PE device name.
PE Name—PE device name.
Output Values
•![]() PE Role—List by PE device role (N-PE, U-PE, or PE-AGG).
PE Role—List by PE device role (N-PE, U-PE, or PE-AGG).
•![]() PE Name—List by PE device name.
PE Name—List by PE device name.
•![]() Policy Type—List by type of Policy.
Policy Type—List by type of Policy.
•![]() SR State—List by service request state (see Service Request States).
SR State—List by service request state (see Service Request States).
Note ![]() The SR State output does not list service requests in the CLOSED state. Service requests in other states are listed, as determined by the filter values.
The SR State output does not list service requests in the CLOSED state. Service requests in other states are listed, as determined by the filter values.
•![]() SR ID—List by service request ID.
SR ID—List by service request ID.
•![]() SR Job ID—List by service request job ID.
SR Job ID—List by service request job ID.
MPLS Service Request Report
The MPLS service request report feature allows you to list service requests as related to PE, CE, VPN, SR ID, SR STATE.
Click the MPLS Service Request Report icon to bring up the window for this report, as shown in Figure 10-17.
Figure 10-17 MPLS Service Request Report
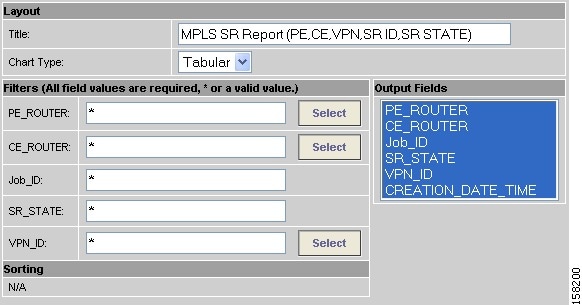
Filter Values
•![]() PE ROUTER—Choose some or all (*) PE routers.
PE ROUTER—Choose some or all (*) PE routers.
•![]() CE ROUTER—Choose some or all (*) CE routers.
CE ROUTER—Choose some or all (*) CE routers.
•![]() Job ID—Service request job IDs.
Job ID—Service request job IDs.
•![]() SR STATE—Service request states (see Service Request States).
SR STATE—Service request states (see Service Request States).
•![]() VPN ID—Choose some or all (*) VPNs by ID.
VPN ID—Choose some or all (*) VPNs by ID.
Output Filters
•![]() PE ROUTER—Show PE routers.
PE ROUTER—Show PE routers.
•![]() CE ROUTER—Show CE routers.
CE ROUTER—Show CE routers.
•![]() Job ID—List by Job ID.
Job ID—List by Job ID.
•![]() SR STATE—Service request states (see Service Request States).
SR STATE—Service request states (see Service Request States).
Note ![]() The SR State output does not list service requests in the CLOSED state. Service requests in other states are listed, as determined by the filter values.
The SR State output does not list service requests in the CLOSED state. Service requests in other states are listed, as determined by the filter values.
•![]() VPN ID—List by VPN ID.
VPN ID—List by VPN ID.
•![]() CREATION DATE TIME—List by date and time report created.
CREATION DATE TIME—List by date and time report created.
MPLS Service Request Report - 6VPE
The MPLS Service Request - 6VPE report feature allows you to list service requests as related to PE, CE, VPN, SR ID, SR STATE.
Click the MPLS Service Request Report - 6VPE icon to bring up the window for this report, as shown in Figure 10-17.
Figure 10-18 MPLS Service Request Report - 6VPE
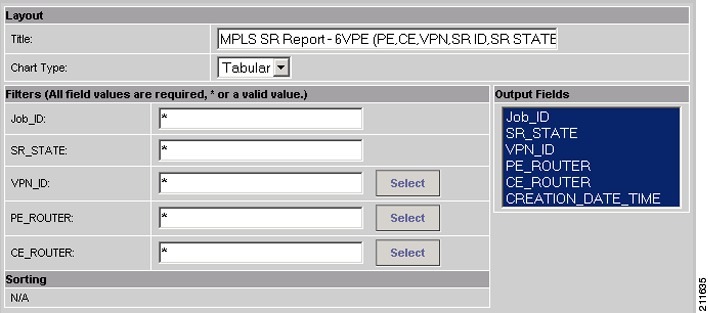
Filter Values
•![]() Job ID—Service request job IDs.
Job ID—Service request job IDs.
•![]() SR STATE—Service request states (see Service Request States).
SR STATE—Service request states (see Service Request States).
•![]() VPN ID—Choose some or all (*) VPNs by ID.
VPN ID—Choose some or all (*) VPNs by ID.
•![]() PE ROUTER—Choose some or all (*) PE routers.
PE ROUTER—Choose some or all (*) PE routers.
•![]() CE ROUTER—Choose some or all (*) CE routers.
CE ROUTER—Choose some or all (*) CE routers.
Output Filters
•![]() Job ID—List by Job ID.
Job ID—List by Job ID.
•![]() SR STATE—Service request states (see Service Request States).
SR STATE—Service request states (see Service Request States).
Note ![]() The SR State output does not list service requests in the CLOSED state. Service requests in other states are listed, as determined by the filter values.
The SR State output does not list service requests in the CLOSED state. Service requests in other states are listed, as determined by the filter values.
•![]() VPN ID—List by VPN ID.
VPN ID—List by VPN ID.
•![]() PE ROUTER—Show PE routers.
PE ROUTER—Show PE routers.
•![]() CE ROUTER—Show CE routers.
CE ROUTER—Show CE routers.
•![]() CREATION DATE TIME—List by date and time report created.
CREATION DATE TIME—List by date and time report created.
6VPE Supported Devices Report
Note ![]() In the Prime Fulfillment GUI, this report is located under Monitoring > Reports > Inventory.
In the Prime Fulfillment GUI, this report is located under Monitoring > Reports > Inventory.
Click the 6VPE Supported Devices Report icon to bring up the window for this report, as shown in Figure 10-17.
Figure 10-19 6VPE Supported Devices Report
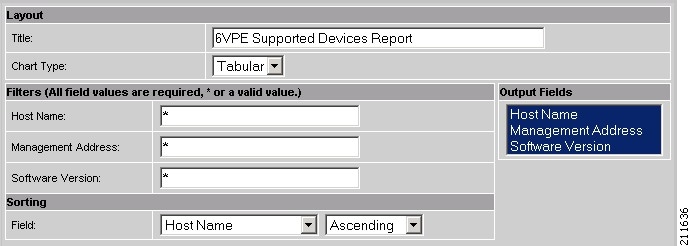
Filter Values
•![]() Host Name—Hostname.
Host Name—Hostname.
•![]() Management Address—Management address.
Management Address—Management address.
•![]() Software Version—Software version.
Software Version—Software version.
Output Filters
•![]() Host Name—Hostname.
Host Name—Hostname.
•![]() Management Address—Management address.
Management Address—Management address.
•![]() Software Version—Software version.
Software Version—Software version.
Creating Custom Reports
The reports listed in the Prime Fulfillment GUI in the MPLS folder are derived from an underlying configuration file. The file is in XML format. You can access the file in the following location:
$ISC_HOME/resources/nbi/reports/ISC/mpls_report.xml
Generating TEM Reports and Logs
All deployment and collection tasks are monitored and the details of the tasks are logged. The information can be viewed using the task monitoring pages.
This chapter includes the following sections:
–![]() Logs Created from Task Manager
Logs Created from Task Manager
TE Task Logs
The TE task logs are used to view the result of running one or more TE tasks. Different task logs are generated by different events:
•![]() SR deployment logs
SR deployment logs
•![]() Logs generated by tasks issued from the Task Manager, such as:
Logs generated by tasks issued from the Task Manager, such as:
–![]() TE Discovery
TE Discovery
–![]() TE Functional Audit
TE Functional Audit
–![]() TE Interface Performance.
TE Interface Performance.
SR Deployment Logs
When any service request is deployed, whether a managed or unmanaged primary tunnel or a backup tunnel, a log is generated. For tunnel SRs, deployment takes place in multiple phases depending on the type of SR and the task logs are created similarly:
•![]() Primary tunnel SR—a three-phase logging process corresponding to a three-phase deployment
Primary tunnel SR—a three-phase logging process corresponding to a three-phase deployment
•![]() Protection SR—a two-phase logging process corresponding to a two-phase deployment
Protection SR—a two-phase logging process corresponding to a two-phase deployment
In addition to the deployment logs, a ConfigAudit log is created regardless of the type of SR deployment, providing the deployment was successful.
Logs Created from Task Manager
Specific instructions for how to generate and view a task log for a TE Discovery task are found in Task Logs.
Instructions for how to generate and view a task log for the TE Functional Audit and TE Interface Performance tasks are found in Creating a TE Task.
Viewing a Task Log
A task log can be accessed from two different locations:
•![]() The Tasks window
The Tasks window
•![]() The Service Requests window.
The Service Requests window.
From the Tasks Window
To view the task log for a TE task, you need to:
1. ![]() Access the Task Logs window.
Access the Task Logs window.
2. ![]() Select the desired log and open it.
Select the desired log and open it.
To view the task logs, use the following steps. A task log from the deployment of a managed primary tunnel has been used as an example.
Step 1 ![]() Choose Operate > Task Logs.
Choose Operate > Task Logs.
The Task Logs window appears.
The Task Logs window includes the following:
•![]() Runtime Task Name—Automatically attributed task name specifying when the runtime task was created.
Runtime Task Name—Automatically attributed task name specifying when the runtime task was created.
•![]() Action—Type of task, for example TE Discovery, TE Functional Audit, or TE Interface Performance.
Action—Type of task, for example TE Discovery, TE Functional Audit, or TE Interface Performance.
•![]() Start Time—The date and time when the runtime task was started.
Start Time—The date and time when the runtime task was started.
•![]() End Time —The date and time when the runtime task ended.
End Time —The date and time when the runtime task ended.
•![]() Status—Indicates the present status of the runtime task.
Status—Indicates the present status of the runtime task.
Step 2 ![]() Select a Task Log for viewing.
Select a Task Log for viewing.
A task that has been scheduled for multiple runs might have multiple instances to view.
Step 3 ![]() Click the desired task in the Action column.
Click the desired task in the Action column.
The corresponding Task Log window appears. The GUI elements in this window are also found in the Service Request Manager window.
The logged messages are shown in a table. This includes the time the log message was created and the severity level assigned to the log message.
There is a filter setting for the logging, which defaults to SEVERE. This means that only SEVERE messages in the log are shown. There are several different filter settings that can be selected according to the desired level of detail. To change the filter level, select the one that is required and click Filter.
How the log is structured depends on the type of task that was run.
Step 4 ![]() Click Return to Logs to close the log window.
Click Return to Logs to close the log window.
This takes you back to the main Task Logs window.
Step 5 ![]() To see the task SR, which in some cases is associated with a particular task log, select the desired task log and click the Service Requests button.
To see the task SR, which in some cases is associated with a particular task log, select the desired task log and click the Service Requests button.
The Task SRs window appears.
From the Service Requests Window
To access the logs from the Service Requests window:
Step 1 ![]() Choose Operate > Service Request Manager.
Choose Operate > Service Request Manager.
Step 2 ![]() Select a service request (only one).
Select a service request (only one).
Step 3 ![]() Click the Status button and select Logs.
Click the Status button and select Logs.
Step 4 ![]() Select the log to view and click View Log.
Select the log to view and click View Log.
The Task Log window appears.
Step 5 ![]() Select the log level from the drop-down menu and click Filter.
Select the log level from the drop-down menu and click Filter.
The log levels are All, Severe, Warning, Info, Config, Fine, Finer, and Finest.
TE Performance Reports
A TE Performance Report is created when you run a TE Interface Performance task as described in Creating a TE Interface Performance Task.
It shows the traffic data collected from the TE Interface Performance task for selected tunnels and/or links. The TE Interface Performance task can run multiple times.
To view a TE Performance Report, use the following steps:
Step 1 ![]() Choose Monitoring > TE Performance Report.
Choose Monitoring > TE Performance Report.
The TE Performance Report Table appears.
The TE Performance Report Table window includes the following GUI elements:
•![]() Report table—The table shows a list of Interface Performance tasks:
Report table—The table shows a list of Interface Performance tasks:
–![]() Start Time—The date and time when the runtime task was started.
Start Time—The date and time when the runtime task was started.
–![]() End Time—The date and time when the runtime task ended.
End Time—The date and time when the runtime task ended.
–![]() Device Name—Name of the device.
Device Name—Name of the device.
–![]() Interface Name—IP addresses of the interfaces on the link.
Interface Name—IP addresses of the interfaces on the link.
–![]() Octets In—Number of inbound octets of traffic.
Octets In—Number of inbound octets of traffic.
–![]() Octets Out—Number of outbound octets of traffic.
Octets Out—Number of outbound octets of traffic.
–![]() Speed—Speed of the interface.
Speed—Speed of the interface.
–![]() Util In—Interface utilization for inbound traffic.
Util In—Interface utilization for inbound traffic.
–![]() Util Out—Interface utilization for outbound traffic.
Util Out—Interface utilization for outbound traffic.
•![]() Reconcile Data—When an Interface Performance task has been run multiple times on an interface, you can choose to reconcile the data according to the following criteria:
Reconcile Data—When an Interface Performance task has been run multiple times on an interface, you can choose to reconcile the data according to the following criteria:
–![]() Peak—Select the highest interface utilization.
Peak—Select the highest interface utilization.
–![]() Valley—Select the lowest interface utilization.
Valley—Select the lowest interface utilization.
–![]() Average—Select the average interface utilization.
Average—Select the average interface utilization.
–![]() First—Select the first occurrence of interface utilization.
First—Select the first occurrence of interface utilization.
 Feedback