Monitoring Cisco NFVI Performance

The following topics tell you how to display logs to monitor Cisco VIM performance.

Logging and Monitoring in Cisco NFVI

Cisco VIM uses a combination of open source tools to collect and monitor the Cisco OpenStack services including Elasticsearch, Fluentd, and the Kibana dashboard (EFK).

In VIM, we have moved our platform to use Fluentd, instead of logstash. However, to maintain backwards compatibility, the code, and documentation refers to ELK, instead of EFK at various places. In VIM, these two acronyms are interchangeable, however it refers to the presence of EFK in the offering. OpenStack services that followed by EFK include:

  • MariaDB—A relational database management system which is based on MySQL. All the OpenStack components store their data in MariaDB.

  • HAProxy—HAProxy is a free open source software that provides a high-availability load balancer, and proxy server for TCP and HTTP-based applications that spreads requests across multiple servers.

  • Keystone—Keystone is an OpenStack project that provides identity, token, catalog, and policy services for use specifically by projects in the OpenStack.

  • Glance—An OpenStack project that allows you to upload and discover data assets that are meant for use with other services.

  • Neutron—An OpenStack project that provides the network connectivity between interface devices, such as vNICs, managed by other OpenStack services, such as Nova.

  • Nova—An OpenStack project that is designed to provide massively scalable, on demand, self-service access to compute resources.

  • HTTP—The Apache HTTP server Project, an effort to develop and maintain an open-source HTTP server.

  • Cinder—An OpenStack block storage service that is designed to present storage resources to the users that are consumed by the OpenStack compute project (Nova).

  • Memcached—A general purpose distributed memory caching system.

  • CloudPulse—Is an OpenStack tool that checks the health of the cloud. CloudPulse includes operator and end-point tests.

  • Heat—The main OpenStack Orchestration program. Heat implements an orchestration engine to launch multiple composite cloud applications that is based on text file templates.

  • Other OpenStack services—RabbitMQ, Ceph, Open vSwitch, Linux bridge, Neutron VTS (optional), and others.

  • VMTP—Integrated control and data plane log for testing the cloud.

  • NFVBench—Network performance benchmarking tool.

A Fluentd container resides on each control, compute, and storage nodes. They forward log to the Fluentd-aggr server residing on the management node.

The following figure shows a high-level schematic of the Fluent service assurance architecture.

Figure 1. EFK Service Assurance Architecture

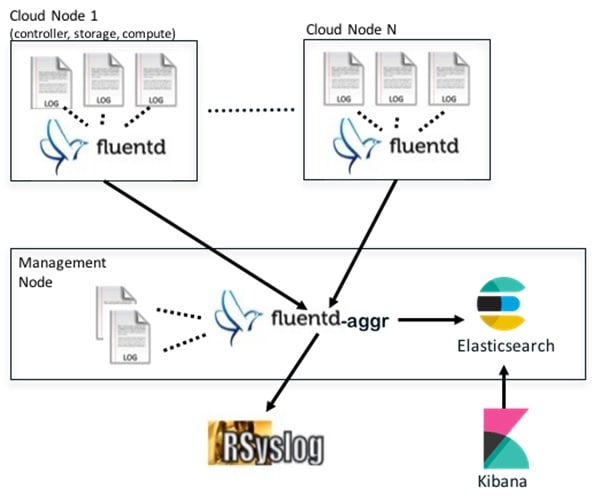
The EFK flow includes:

  • Fluentd extracts the relevant data from the logs and tags them so that Kibana can use it later to display useful information about those logs.
  • Fluentd sends the logs from all the compute, controller, and storage nodes to the Fluentd-aggr server on the management node.
  • Fluentd-aggr in the management node sends the structured logs into the Elasticsearch database.
  • Elasticsearch stores the data, indexes it, and supports fast queries against a large amount of log data.
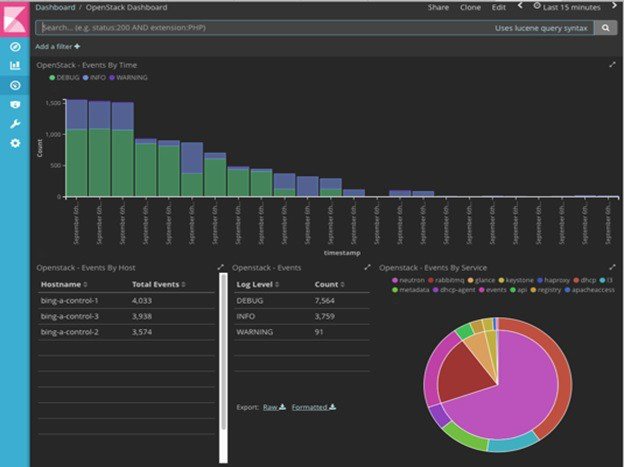
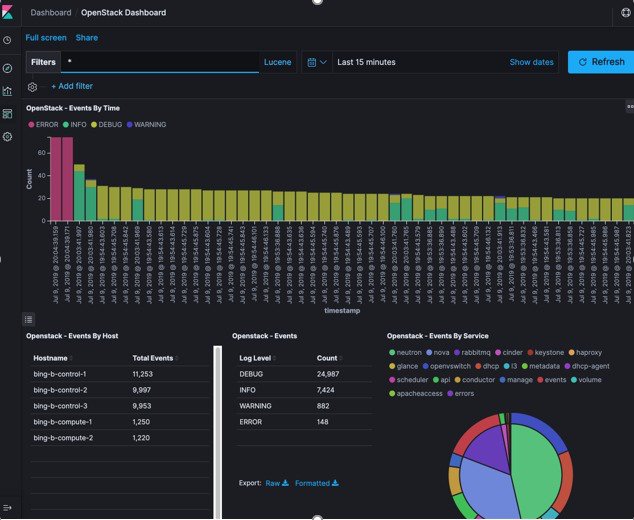
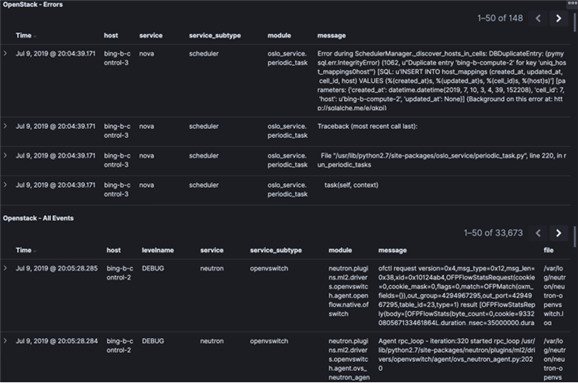
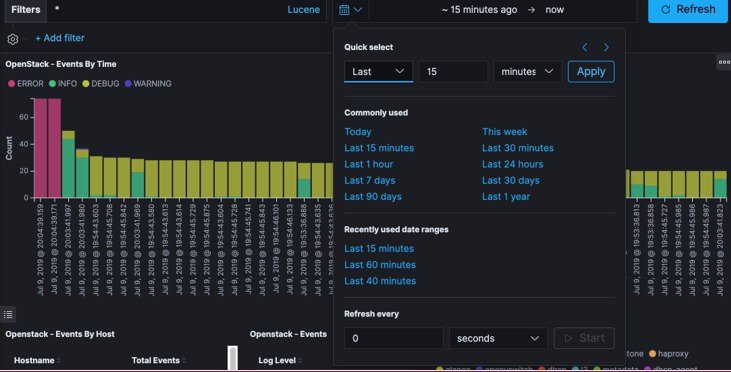
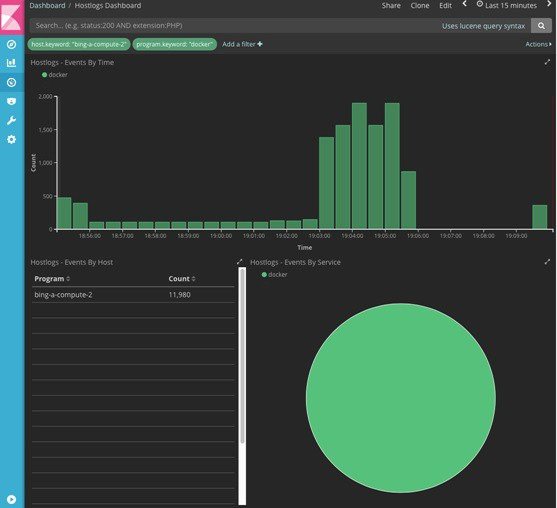
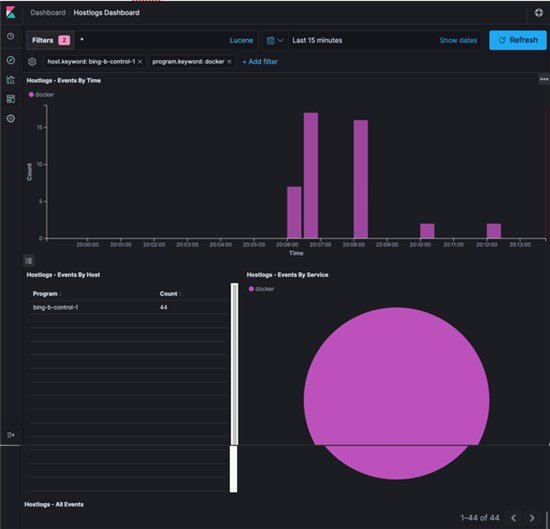
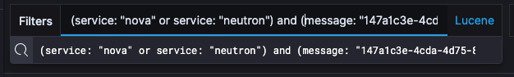
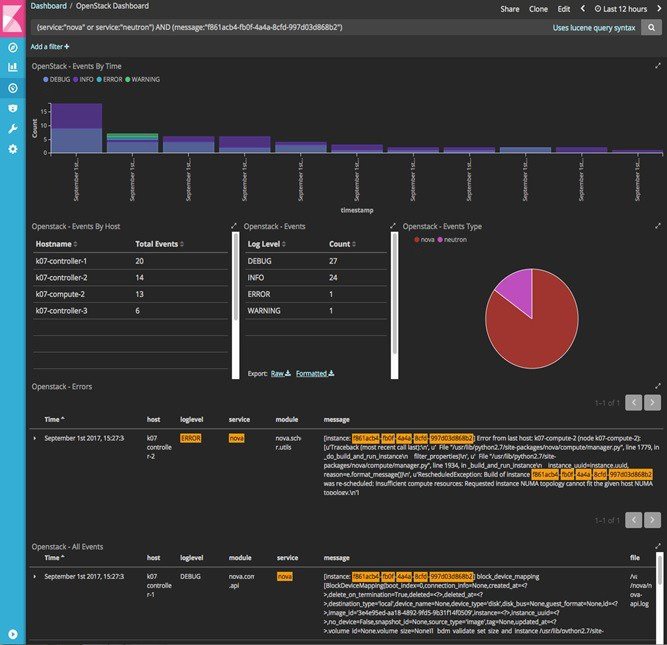
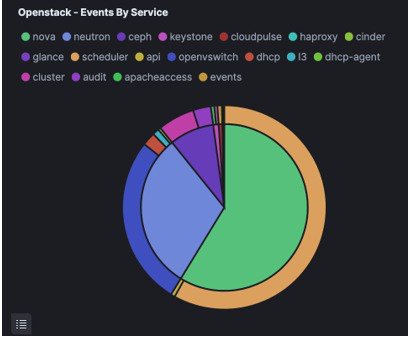
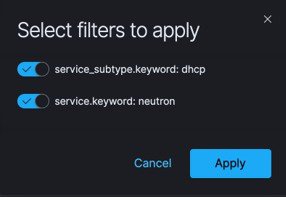
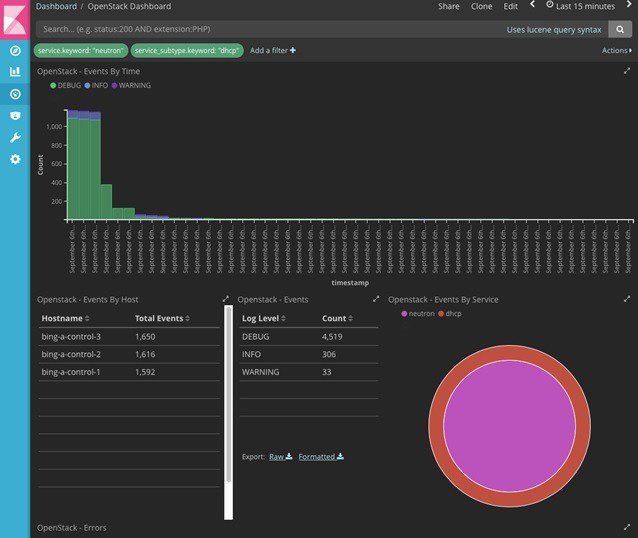
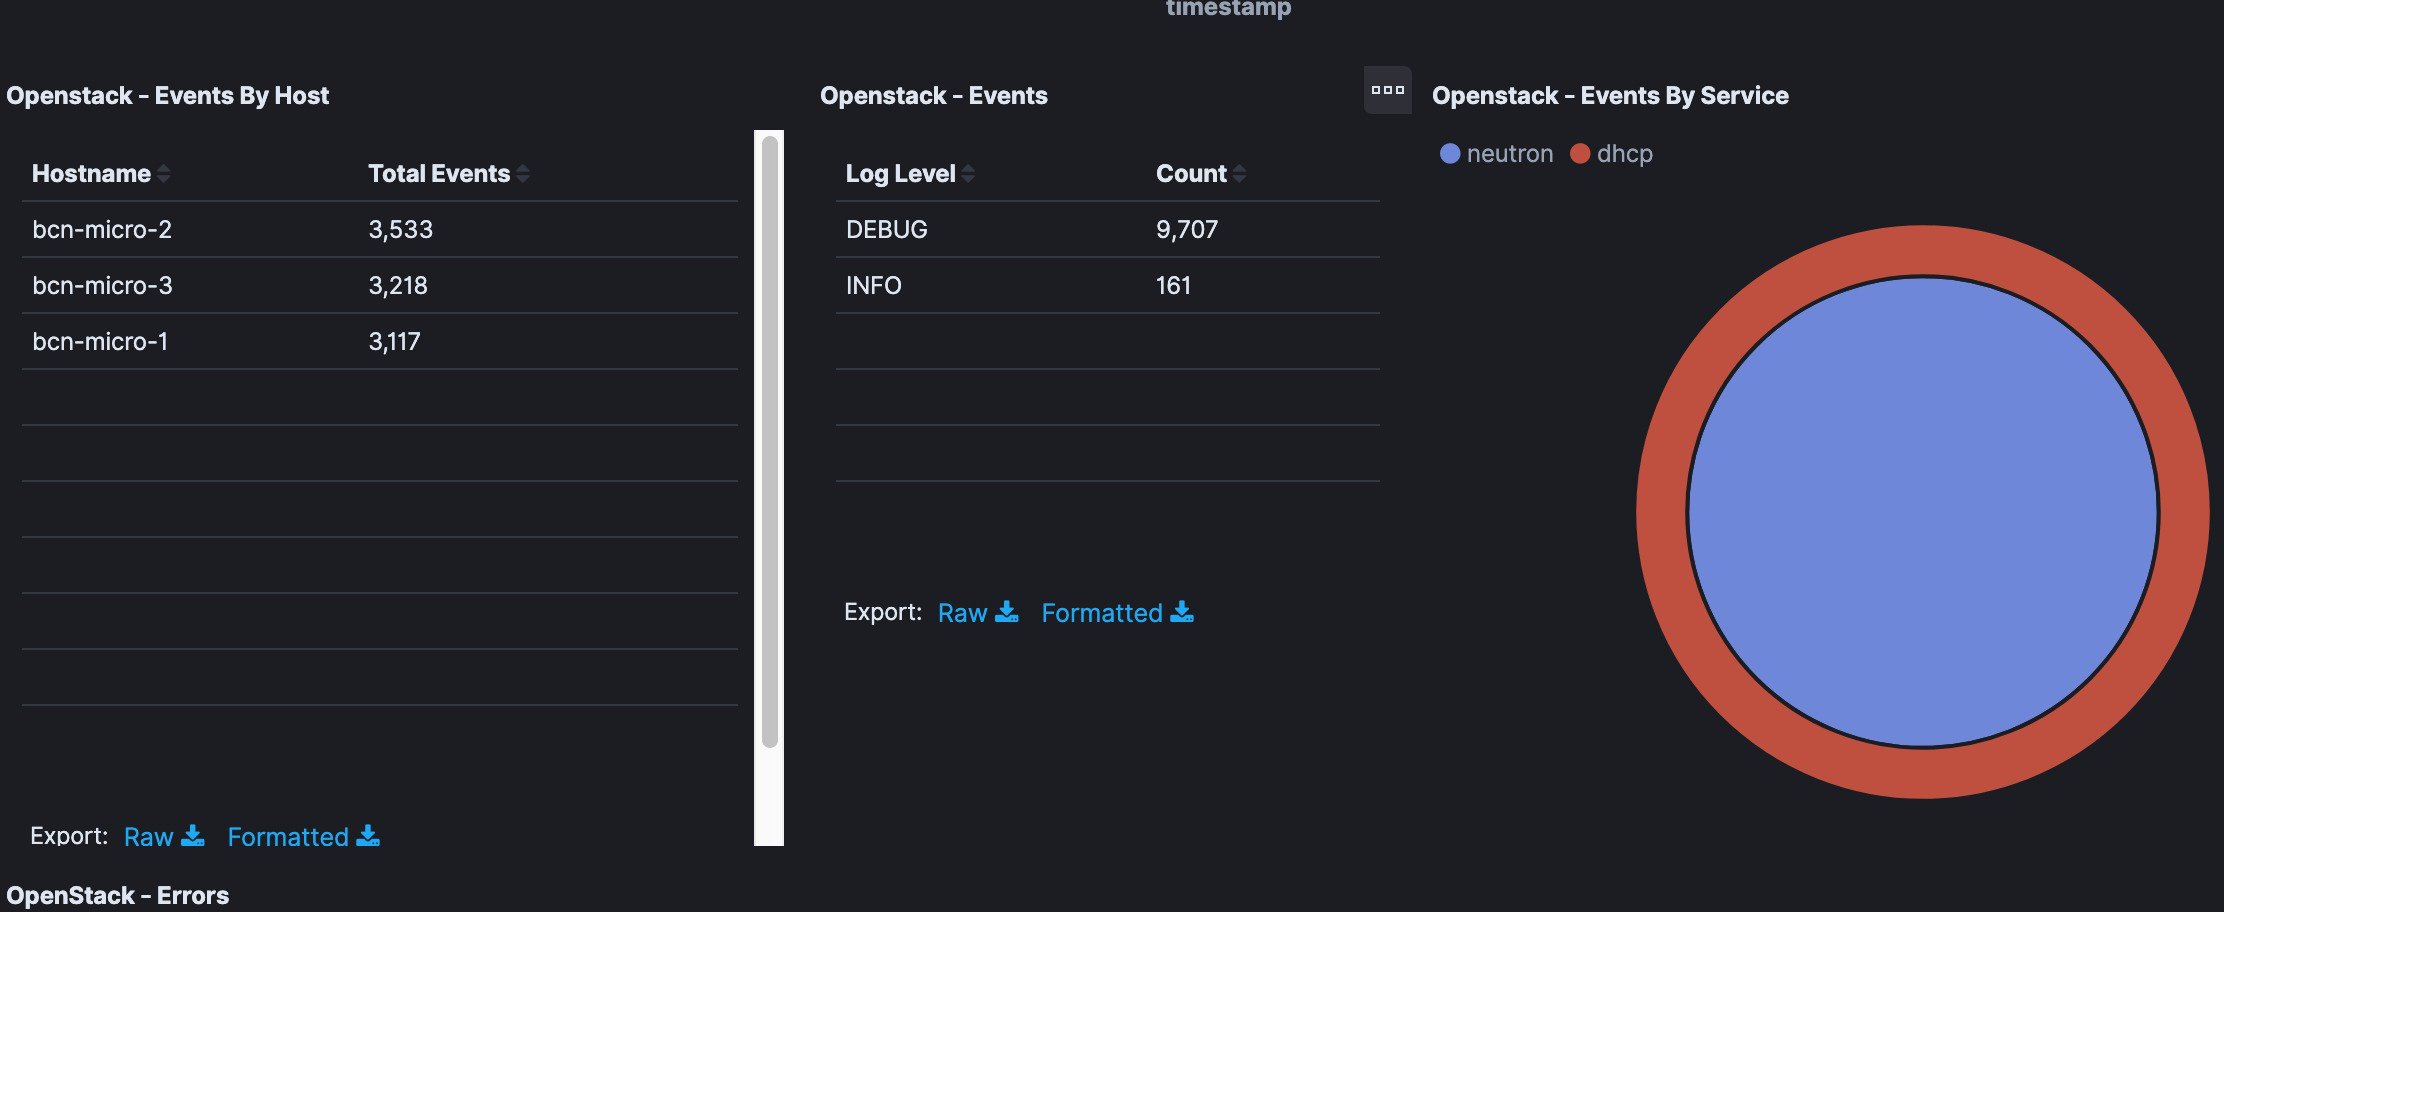
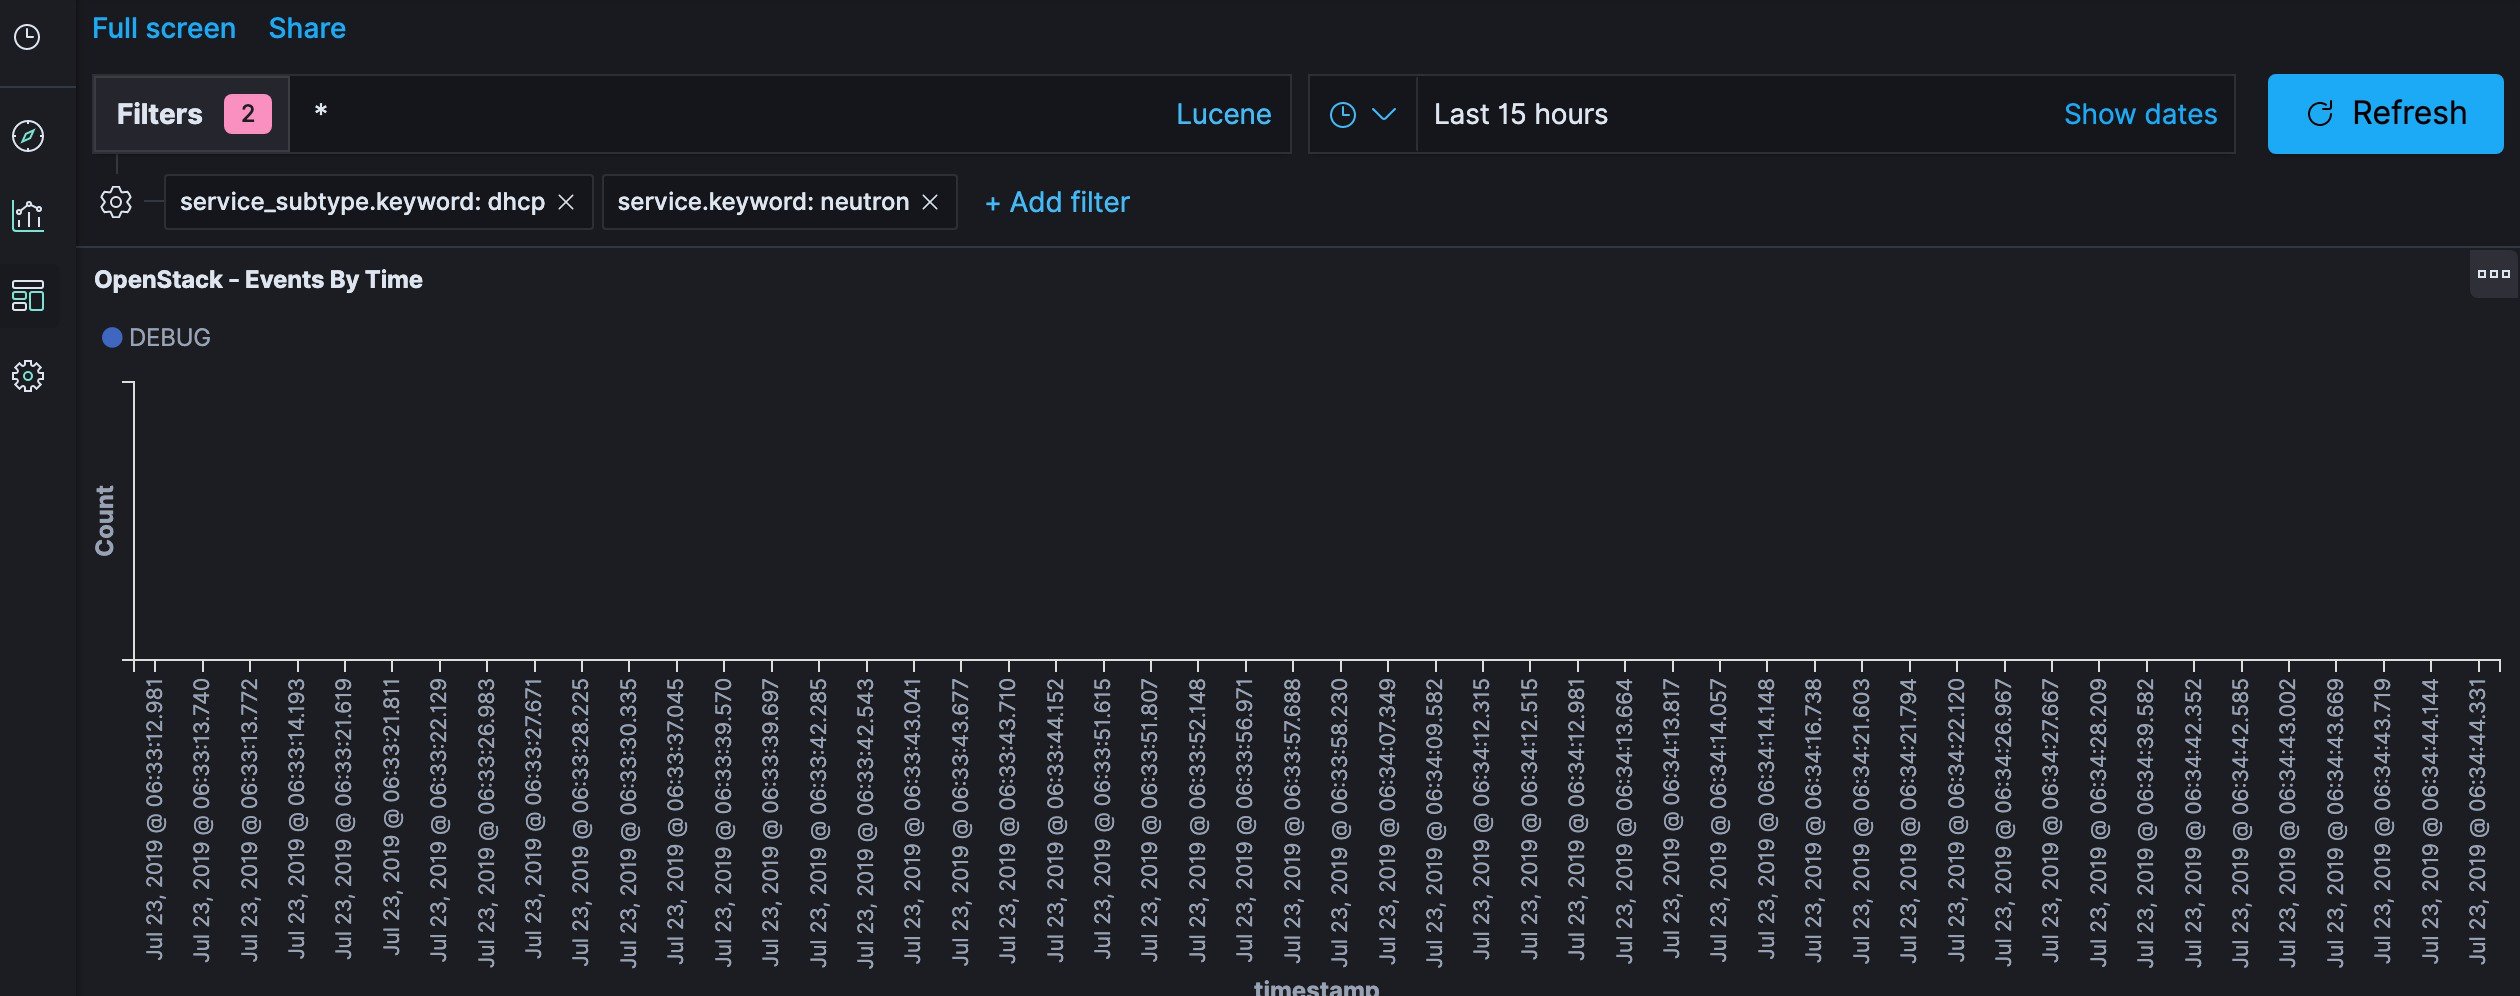
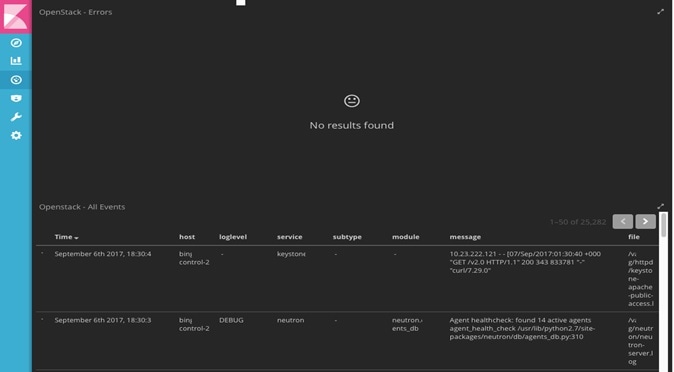
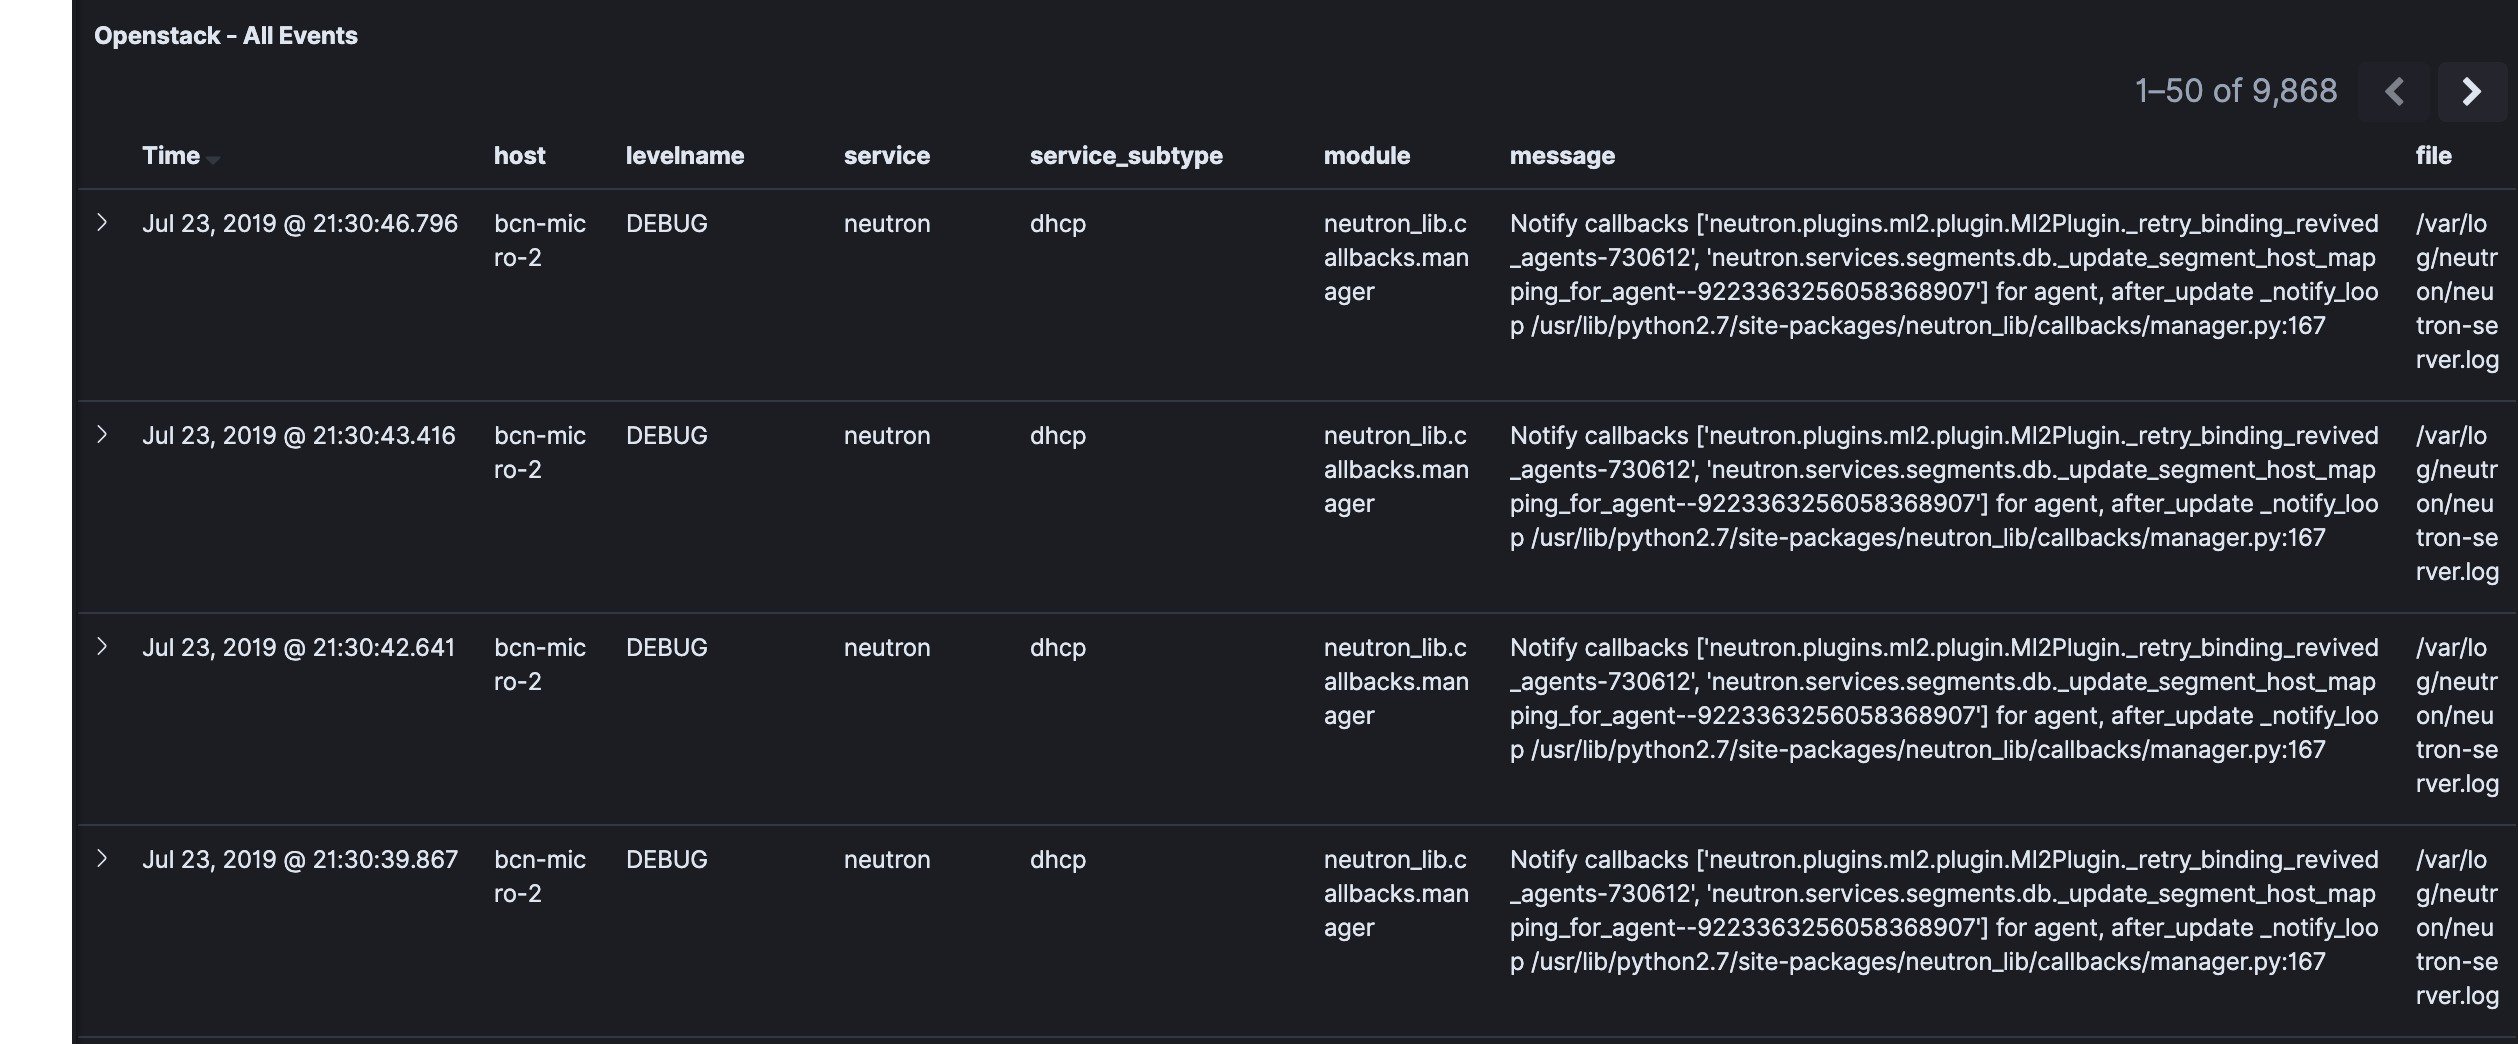
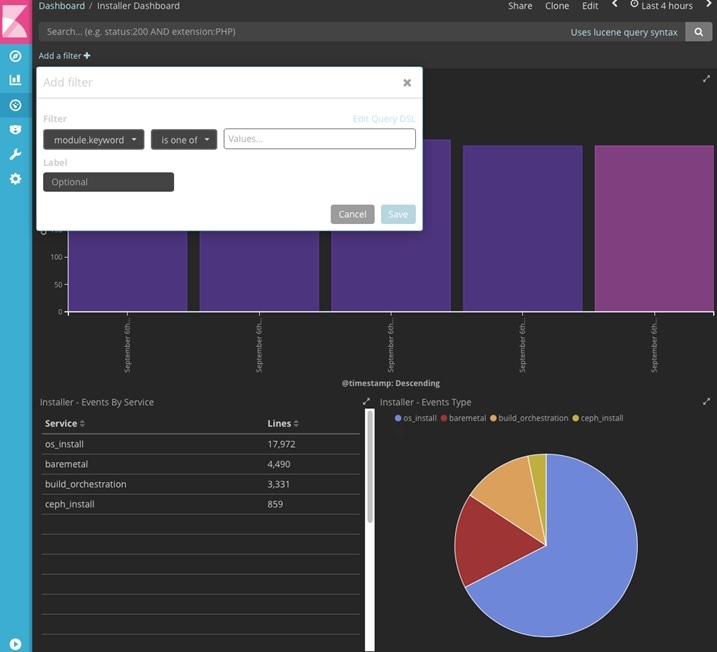
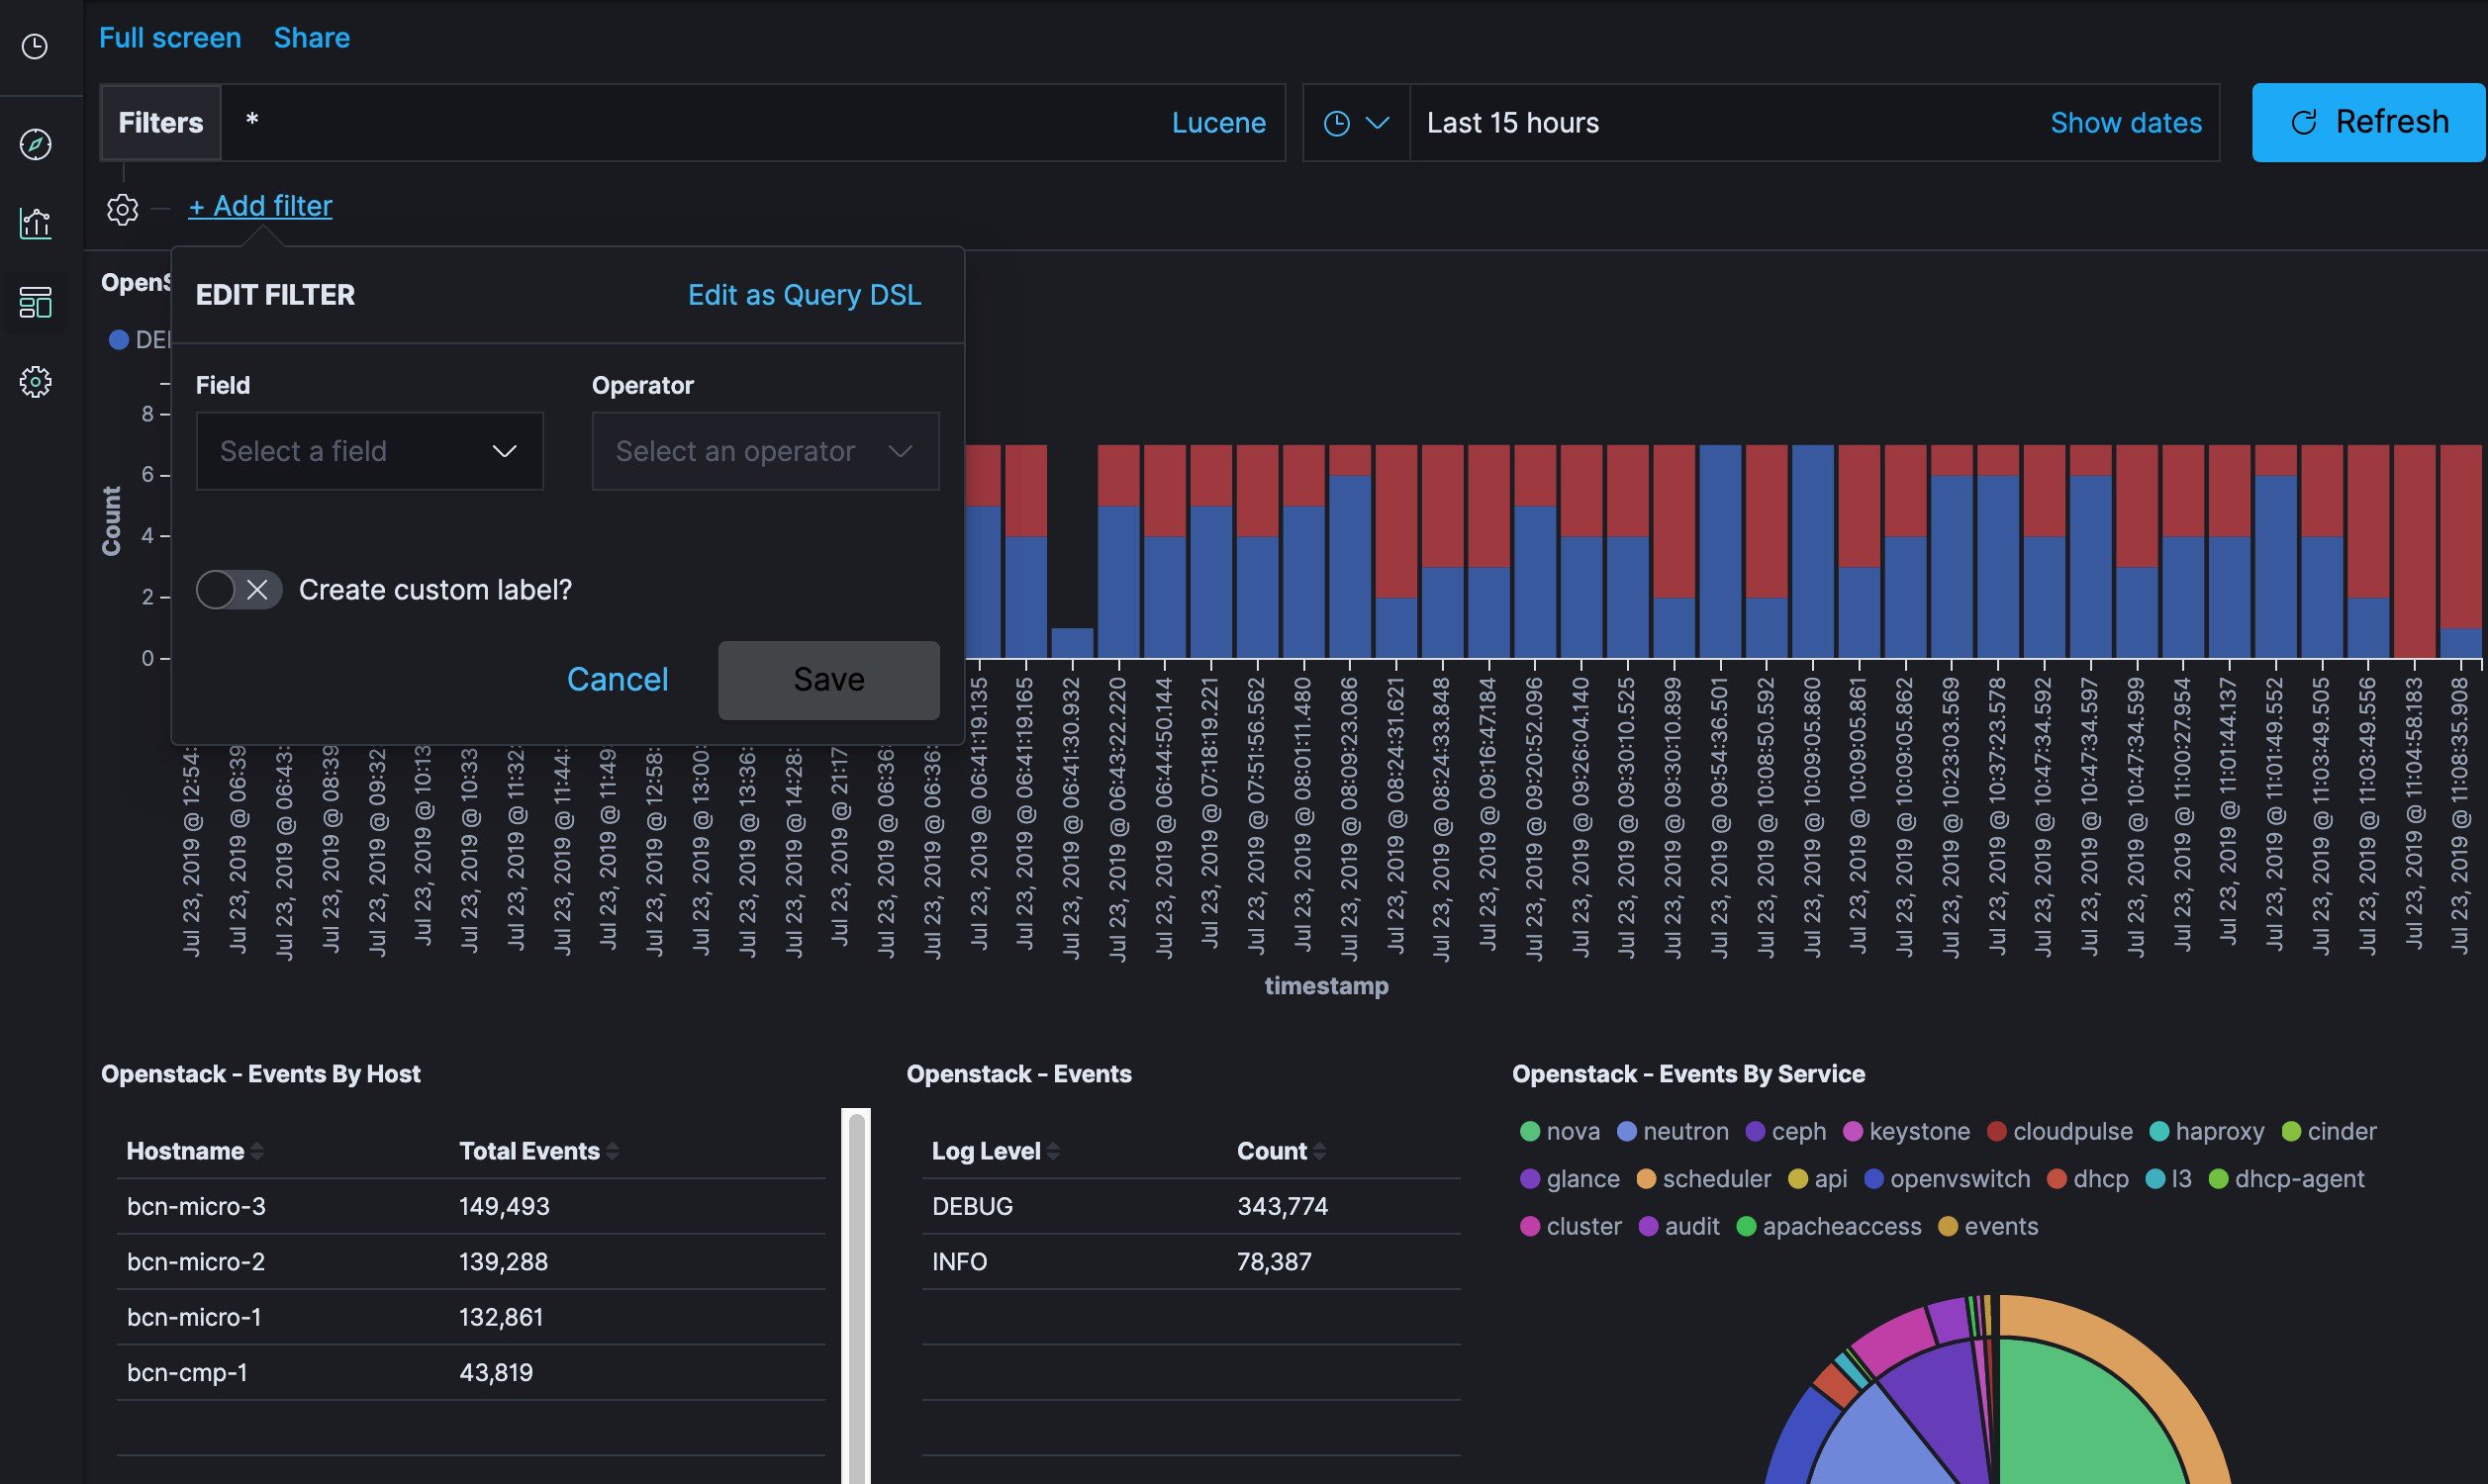
  • Kibana visualizes the data that is stored in Elasticsearch using a custom dashboard. You can also add filters to the data to visualize interesting fragments of the log data.

Displaying Cisco VIM Log Files Using the CLI

Cisco VIM log file location depends on the node and log type. Installer logs are found in the management node under the /var/log/mercury/<install_uuid>/ directory. The last 20 log directories are tarred and kept in this directory. These files contain logs related to bootstrap, build orchestration, baremetal, common setup, and OpenStack orchestration.

If the installer fails, look at the last tar.gz file for logs, for example:

[root@mgmtnode mercury]# ls -lrt
total 20
drwxr-xr-x. 2 root root   80 Jul 19 23:42 573f2b7f-4463-4bfa-b57f-98a4a769aced
drwxr-xr-x. 2 root root 4096 Jul 20 03:29 installer
drwxr-xr-x. 2 root root   79 Jul 20 03:29 e9117bc5-544c-4bda-98d5-65bffa56a18f
drwxr-xr-x. 2 root root   79 Jul 20 04:54 36cdf8b5-7a35-4e7e-bb79-0cfb1987f550
drwxr-xr-x. 2 root root   79 Jul 20 04:55 bd739014-fdf1-494e-adc0-98b1fba510bc
drwxr-xr-x. 2 root root   79 Jul 20 04:55 e91c4a6c-ae92-4fef-8f7c-cafa9f5dc1a3
drwxr-xr-x. 2 root root   79 Jul 20 04:58 1962b2ba-ff15-47a6-b292-25b7fb84cd28
drwxr-xr-x. 2 root root   79 Jul 20 04:59 d881d453-f6a0-448e-8873-a7c51d8cc442
drwxr-xr-x. 2 root root   78 Jul 20 05:04 187a15b6-d425-46a8-a4a2-e78b65e008b6
drwxr-xr-x. 2 root root 4096 Jul 20 06:47 d0346cdd-5af6-4058-be86-1330f7ae09d1
drwxr-xr-x. 2 root root   79 Jul 20 17:09 f85c8c6c-32c9-44a8-b649-b63fdb11a79a
drwxr-xr-x. 2 root root   67 Jul 20 18:09 179ed182-17e4-4f1f-a44d-a3b6c16cf323
drwxr-xr-x. 2 root root   68 Jul 20 18:13 426cb05f-b1ee-43ce-862d-5bb4049cc957
drwxr-xr-x. 2 root root   68 Jul 20 18:13 1d2eec9d-f4d8-4325-9eb1-7d96d23e30fc
drwxr-xr-x. 2 root root   68 Jul 20 18:13 02f62a2f-3f59-46a7-9f5f-1656b8721512
drwxr-xr-x. 2 root root   68 Jul 20 18:14 c7417be9-473e-49da-b6d0-d1ab8fb4b1fc
drwxr-xr-x. 2 root root   68 Jul 20 18:17 b4d2077b-c7a9-46e7-9d39-d1281fba9baf
drwxr-xr-x. 2 root root   68 Jul 20 18:35 21972890-3d45-4642-b41d-c5fadfeba21a
drwxr-xr-x. 2 root root   80 Jul 20 19:17 d8b1b54c-7fc1-4ea6-83a5-0e56ff3b67a8
drwxr-xr-x. 2 root root   80 Jul 20 19:17 23a3cc35-4392-40bf-91e6-65c62d973753
drwxr-xr-x. 2 root root   80 Jul 20 19:17 7e831ef9-c932-4b89-8c81-33a45ad82b89
drwxr-xr-x. 2 root root   80 Jul 20 19:18 49ea0917-f9f4-4f5d-82d9-b86570a02dad
drwxr-xr-x. 2 root root   80 Jul 20 19:18 21589a61-5893-4e30-a70e-55ad0dc2e93f
drwxr-xr-x. 2 root root   80 Jul 20 19:22 6ae6d136-7f87-4fc8-92b8-64cd542495bf
drwxr-xr-x. 2 root root 4096 Jul 20 19:46 1c6f4547-c57d-4dcc-a405-ec509306ee25
drwxr-xr-x. 2 root root   68 Jul 20 21:20 c6dcc98d-b45b-4904-a217-d25001275c85
drwxr-xr-x. 2 root root   68 Jul 20 21:40 ee58d5d6-8b61-4431-9f7f-8cab2c331637
drwxr-xr-x. 2 root root 4096 Jul 20 22:06 243cb0f8-5169-430d-a5d8-48008a00d5c7
drwxr-xr-x. 2 root root 4096 Jul 20 22:16 188d53da-f129-46d9-87b7-c876b1aea70c

Cisco VIM autobackup logs are found in the following location:

# CVIM autobackup logs (auto-backup enabled by default)
/var/log/mercury/autobackup_3.2.x_2019-03-19_15-11-10.log

# cobbler apache log (may be needed for PXE troubleshooting)
/var/log/cobblerhttpd/access_log
/var/log/cobblerhttpd/error_log

# VMTP logs
/var/log/vmtp/vmtp.log

Cisco VIM RestAPI log location

# CVIM RestAPI logs
/var/log/mercury_restapi/restapi.log

# CIM RestAPI apache logs (TCP port 8445)
/var/log/httpd/mercury_access.log
/var/log/httpd/mercury_error.log
 
# CIM RestAPI log-directory logs (TCP port 8008)
/var/log/httpd/access_log
/var/log/httpd/error_log

EFK log location

# Elasticsearch-fluentd-Kibana
/var/log/elasticsearch/
/var/log/fluentd-aggr/
/var/log/kibana/
/var/log/curator/
# HAProxy TLS certificate expiration check
/var/log/curator/certchecker.log

Viewing Cisco VIM Logs

# list logs sorted reverse on time
ls -lrt /var/log/mercury/
# untar logs
tar xvzf /var/log/mercury/<UUID>/mercury_install_2018-3-20_10-2.tar.gz -C /tmp/

Cisco VIM Configuration Files

# example configuration files
/root/openstack-configs/setup_data.yaml.B_Series_EXAMPLE
/root/openstack-configs/setup_data.yaml.C_Series_EXAMPLE

# system maintained setup files - do not modify directly
# always supply user copy of setup_data.yaml
# when using ciscovim client
/root/openstack-configs/setup_data.yaml

# system inventory in pretty format
/root/openstack-configs/mercury_servers_info

# passwords store
/root/openstack-configs/secrets.yaml

# openstack configuration file
/root/openstack-configs/openstack_config.yaml

# RestAPI password
/opt/cisco/ui_config.json

# Insight password
/opt/cisco/insight/secrets.yaml

Enabling debug logs for certain OpenStack Services

# openstack config file
/root/openstack-configs/openstack_config.yaml

# help
ciscovim help

# list openstack keys
ciscovim list-openstack-configs

# help on reconfigure sub-command
ciscovim help reconfigure

# how to execute subcommand, example below
# important note: reconfigure requires a maintenance window
ciscovim reconfigure --setopenstackconfig KEYSTONE_DEBUG_LOGGING,CINDER_DEBUG_LOGGING

On controller and compute nodes, all services are run within their respective Docker™ containers.

To list the Docker containers in the node, execute the following:

[root@control-server-2 ~]# docker ps -a
CONTAINER ID        IMAGE                                                          COMMAND                  CREATED          STATUS          PORTS      NAMES
258b2ca1d46a        172.31.228.164:5000/mercury-rhel7-osp8/nova-scheduler:4780     "/usr/bin/my_init /no"   25 minutes ago   Up 25 minutes              novascheduler_4780
ffe70809bbe0        172.31.228.164:5000/mercury-rhel7-osp8/nova-novncproxy:4780    "/usr/bin/my_init /st"   25 minutes ago   Up 25 minutes              novanovncproxy_4780
12b92bcb9dc0        172.31.228.164:5000/mercury-rhel7-osp8/nova-consoleauth:4780   "/usr/bin/my_init /st"   26 minutes ago   Up 26 minutes                                   


……
novaconsoleauth_4780
7295596f5167        172.31.228.164:5000/mercury-rhel7-osp8/nova-api:4780            "/usr/bin/my_init /no"   27 minutes ago   Up 27 minutes              novaapi_4780

To view the Docker logs of any container, execute the following on the corresponding host:

ls –l /var/log/<service_name>/<log_filename>
e.g. ls -l /var/log/keystone/keystone.log

To get into a specific container, execute the following commands:

[root@control-server-2 ~]# alias | grep container
     root@control-server-2 ~]# source /root/.bashrc
#execute the alias:
	 [root@control-server-2 ~]# novaapi
novaapi_4761 [nova@control-server-2 /]$
	novaapi_4761 [nova@control-server-2 /]$ exit
exit

If the Docker status indicates a container is down (based on output of “docker ps –a”), collect the Docker service logs as well:

cd /etc/systemd/system/multi-user.target.wants/
ls docker* # get the corresponding service name from the output
systemctl status <service_name> -n 1000 > /root/filename # redirects the output to the file

For storage nodes running Ceph, execute the following to check the cluster status:

ceph –v # on monitor nodes (controller), show’s ceph version

ceph –s # on monitor nodes (controller), show cluster status

ceph osd lspools #on monitor nodes (controller),list pools

ceph mon stat # summarize monitor status

ceph-disk list # on OSD / storage nodes; List disks, partitions, and Ceph OSDs

rbd list images # on monitor nodes (controller); dump list of image snapshots

rbd list volumes # on monitor nodes (controller); dump list of volumes

Logging Into Kibana Dashboard

Kibana is an open source data visualization platform that is used to explore Cisco VIM logs.

To log into the Kibana dashboard:

Procedure


Step 1

Using a terminal client, use SSH to log into your management node and enter the password to login.

The following command shows the management node has an IP address of 17.0.0.2:

# ssh root@17.0.0.2
root@17.0.0.2's password
Step 2

To obtain the password, check whether VAULT feature is enabled. If it is enabled, refer to the Vault section, otherwise locate the line containing KIBANA_PASSWORD in /root/installer-{tag id}/openstack-configs/secrets.yaml during SSH terminal session. Note the value of the KIBANA_PASSWORD as it is used in Step 4.

cat /root/installer-{tag-id}/openstack-configs/secrets.yaml
...
KIBANA_PASSWORD: <note this value>
...
Step 3

Navigate to the http://<management_node_ip_address>:5601.

Note 

Kibana uses the HTTPS + TLS to provide a secure connection between the browser and the Kibana service.

By default Kibana uses the certificate located at /var/www/mercury/mercury.<crt|key> or you can provide your own certificates in /root/openstack-configs/ directory (using the same mercury.<crt|key> file names).

Note 
If you are accessing Kibana for the first time, by default it shows self-signed certificate. Some browsers display the warning message Your connection is not private. Click Proceed to access the Kibana link. A window dialog box appears.
Step 4

Enter the Username and Password:


User Name: admin

Password: <value of ELK_PASSWORD from Step 2>. The Kibana dashboard appears which displays the Cisco VIM service and installer logs.

Step 5

Choose the desired dashboard from the list.

Note 
Ensure that you do not use Management option on the left side.
Figure 2. Lists of Dashboards


The following are the list of dashboards:

  • Hostlogs Dashboard: Provides log information of the system for the cloud nodes. This displays entries from the host logs-* index in Elasticsearch. It contains the log from /var/log/messages file on each server.

  • Installer Dashboard: Provides information about the management node and the installation process. It can only read uncompressed files. Hence, it reads the files prior to the cloud installation. This displays entries from the installer-* index in Elasticsearch.

  • OpenStack Dashboard: (openstack-* index) Provides log information about all the OpenStack processes. This displays entries from the openstack-* index in Elasticsearch.

  • VMTP Dashboard: Provides log information about the VMTP runs performed against the cloud. It displays entries from the vmtp-* index in Elasticsearch

For example, if you click OpenStack Dashboard link, the following screen appears.

Figure 3. OpenStack Dashboard


You can switch on from one dashboard to another by selecting the appropriate dashboard from the right top bar menu.

All dashboards have generic and specific fields.

The generic ones are:

  • Title: It is seen at the top left of the page. Ite shows which dashboard is being displayed. For example: OpenStack Dashboard.

  • Filter bar : It is an input field where you can enter a query in the Lucene syntax format to filter the logs by specific fields (which depend on the fields for the index being selected).

  • Time bar: Time is seen at the top right of the page. Time indicates the time schedule for the log information. You can modify the time to indicate absolute, relative time in the past or specify automatically refresh rates.

  • Add a filter tab: Use this tab to introduce filters graphically.

For more information on using Kibana, see the Kibana documentation (Version 7.2).

Cisco VIM stores the OpenStack logs in Elasticsearch. The Elasticsearch snapshots all the indices (where the data is stored) which are rotated on a periodic basis. You may not see the older data in Kibana if the data is rotated out and/or deleted.

Logs keep being visualized in Kibana as they are being updated in Elasticsearch on the Discover tab. To debug something on kibana, you can program the Kibana dashboard to auto-refresh at specific intervals (by default is off). To enable auto-refresh, click the Calendar drawing at the top right corner of the dashboard and program on Refresh every with desired value. Configure the desired value by clicking the Start and Auto-refresh.

Figure 4. Auto-Refresh


Once you program a Auto-refresh, the Calendar drawing is replaced by a Clock. Then you can click Stop button on the top navigator bar to pause the refreshing of logs events. You can also select intervals that you want to see the logs from.


Also you can select an absolute or relative interval:


  1. Few examples on usage of filters in Openstack dashboard to gather useful information

      • On the Hostlogs Dashboard, in the Events by Host panel, choose a hostname and click the + or - symbol that appears close to the hostname to include or exclude that server from the filter. Then, click the desired slice on the Events By Service panel to add the docker service to the section.

      • Under the Filter field, you see included sections in green and excluded sections in red.

        Figure 5. Hostlogs Dashboard


  2. To know the log events in the Openstack for a given VM by writing the filter directly on the Search field:

    Note 
    The uuid of the VM is identified by executing openstack nova list or looking at the horizon website.
    • Write the Lucene query (service: nova and service: neutron and message:<uuid>) in the Search field which is on top of the Dashboard. <uuid> is the number got from Horizon or nova list for the identifier of the instance VM.

      Figure 6. Search Query Page


    • For example, if the user wants to know the DHCP events of the Openstack Neutron add filters by clicking outer circle of pie chart::

      • On the OpenStack Dashboard, the Openstack - Events By Service panel has a pie chart with the inner section for the services and the outer sections for the service_subtypes. To add filters for selecting all the events in a service (for example, neutron), click on the inner section of the pie. To add filters for selecting the service_subtypes (for example, dhcp), click on the outer circle of the pie.
        Figure 7. Events by Service


      • In the following window, click on Apply:


      • You can scroll down the OpenStack Dashboard to see the OpenStack - Errors and the OpenStack - Events panel.. The OpenStack - Errors panel displays the error messages. If there are no errors, the No results found message is displayed.
      • Without knowing the Lucene Syntax, you can set the filter criteria in the Search field using the Add a filter + option.

        Following are the steps to add a filter:

        • Click Add a filter (+).

        • Set the filter criteria by choosing appropriate label and operators from the drop-down lists, and entering keywords and click Save.

        Figure 8. Add Filters Page


Set the filter criteria by choosing appropriate label and operators from the drop-down lists, and entering keywords.

Figure 9. Choosing Appropriate Labels


Rotation of the Cisco VIM Logs

Cisco VIM stores all logs in Elasticsearch. Elasticsearch indices are rotated on a periodic basis to prevent the disk space overflow by creating snapshots. The following lists show the Snapshots that are defined in openstack_config.yaml:

# vi ~/openstack-configs/openstack_config.yaml
…
# Elk rotation parameters
elk_rotation_frequency: "monthly"  # Available: "daily", "weekly", "fortnightly", "monthly"
elk_rotation_size: 2               # Unit is in Gigabytes (float is allowed)
elk_rotation_del_older: 10         # Delete older than 10 units (where units depends on the value set on elk_rotation_frequency)
…

You can change the frequency of the rotation by changing the values. For more information on how to set the Elasticsearch parameters through VIM API or CLI, refer to the section Reconfiguring Passwords and OpenStack Configurations.

Cisco VIM uses the open source Elasticsearch Curator tool to manage the Elasticsearch indices and snapshots. For more information about Elasticsearch handles snapshots, look at the official information on Elastic.co (Version 5.4) https://www.elastic.co/guide/en/elasticsearch/client/curator/5.4/index.html.

Snapshot Manager Tool for Elasticsearch

The snapshot_mgr.sh tool wraps up the Elasticsearch Curator APIs. This tool helps you to access the snapshots of the logs that are maintained by the Elasticsearch.

Run the following command to view the snapshot logs which is in the tools directory of the installer.

# ./tools/snapshot_mgr.py --help
usage: snapshot_mgr.py [options]

Snapshot Manager handles snapshot logs maintained by Elasticsearch

optional arguments:
  -h, --help            show this help message and exit
  --list                display all snapshots in Elasticsearch
  --display GET_SS      get details of the snapshot called <GET_SS>
  --create              create a snapshot
  --restore RESTORE_SS  restore snapshot named <RESTORE_SS>
  --delete DELETE_SS    delete the snapshot called <DELETE_SS>
  --autodelete threshold_warning threshold_low threshold_high
                        autodelete snapshots until reach a disk space
                        threshold

Snapshot list gives you the details of the snapshot performed on the system like the UUID, the name the snapshot, end time of the snapshot, the state and the indices where it was snapshorted:

# ./snapshot_mgr.py --list
+------------------------+------------------------+---------------------+---------+-----------------------------------------------------------------------------------------------------------------------------------+----------+
|          uuid          |     snapshot_name      | time_snapshot_ended |  state  | indices_snapshoted                                                                                                                | failures |
+------------------------+------------------------+---------------------+---------+-----------------------------------------------------------------------------------------------------------------------------------+----------+
| 6WGVUnKjQbGtZYzfC0yeEg | curator-20180304140002 | 2018-03-04 14:00:04 | SUCCESS | hostlogs-2018.03.02                                                                                                               |    -     |
| U4IVWJNnQW6PdFWxpRUc-A | curator-20180304150001 | 2018-03-04 15:00:04 | SUCCESS | hostlogs-2018.03.03                                                                                                               |    -     |
| 5RxDuhnETC6TW4XSPDNZlw | curator-20180304160001 | 2018-03-04 16:00:24 | SUCCESS | installer-2018.03.03, installer-2018.03.01, installer-2018.03.02, openstack-2018.03.02, hostlogs-2018.03.04, installer-2018.03.04 |    -     |
| k2gZYwLeRPO98bJZslI2pw | curator-20180305040002 | 2018-03-05 04:00:32 | SUCCESS | openstack-2018.03.03, hostlogs-2018.03.04, installer-2018.03.04                                                                   |    -     |
+------------------------+------------------------+---------------------+---------+-----------------------------------------------------------------------------------------------------------------------------------+----------+

To view the details of the individual snapshot run the display option command.:

# ./tools/snapshot_mgr.py --display curator-20180304140002
{ 'duration_in_millis': 1944,
  'end_time': '2018-03-04T14:00:04.019Z',
  'end_time_in_millis': 1520172004019,
  'failures': [],
  'indices': ['hostlogs-2018.03.02'],
  'shards': { 'failed': 0, 'successful': 5, 'total': 5},
  'snapshot': 'curator-20180304140002',
  'start_time': '2018-03-04T14:00:02.075Z',
  'start_time_in_millis': 1520172002075,
  'state': 'SUCCESS',
  'uuid': '6WGVUnKjQbGtZYzfC0yeEg',
  'version': '6.0.0',
  'version_id': 6000099}

To create a snapshot run the following command:

# ./tools/snapshot_mgr.py --create
Executing: curl PUT http://localhost:9200/_snapshot/es_backup/3a9b90c2979b46bf9c7b3f9223074d5d?wait_for_completion=true -d 
{'indices': 'installer-*,hostlogs-*,openstack-*,vmtp-*', 'ignore_unavailable': 'true', 'include_global_state': 'false'}
Response: {u'snapshot': {u'uuid': u'BSznQj1SQ9mjxxk9swTirQ', u'duration_in_millis': 46496, u'start_time':
 u'2018-03-06T16:37:49.774Z', u'shards': {u'successful': 35, u'failed': 0, u'total': 35}, u'version_id': 6000099,
 u'end_time_in_millis': 1520354316270, u'state': u'SUCCESS', u'version': u'6.0.0',
 u'snapshot': u'3a9b90c2979b46bf9c7b3f9223074d5d', u'end_time': u'2018-03-06T16:38:36.270Z',
 u'indices': [u'installer-2018.03.06', u'vmtp-2018.03.02', u'hostlogs-2018.03.06', u'hostlogs-2018.03.05',
 u'installer-2018.03.05', u'openstack-2018.03.05', u'openstack-2018.03.06'],
 u'failures': [], u'start_time_in_millis': 1520354269774}}

Run the following command to delete a snapshot:

# ./tools/snapshot_mgr.py --delete 3a9b90c2979b46bf9c7b3f9223074d5d
Executing: curl DELETE http://localhost:9200/_snapshot/es_backup/3a9b90c2979b46bf9c7b3f9223074d5d -d None
Response: {u'acknowledged': True}

Restore the indices of a snapshot back to the Elasticsearch database by using the restore option. Run the following command to restore:

# ./snapshot_mgr.py --restore curator-20180306050001
Executing: curl POST http://localhost:9200/hostlogs-2018.03.04,installer-2018.03.05,installer-2018.03.04,
openstack-2018.03.04,hostlogs-2018.03.05,openstack-2018.03.02/_close -d None

Remote NFS Backup for Elasticsearch Snapshots

Cisco VIM 2.4, supports remote NFS backup of the Elasticsearch snapshots. This allows you to empty the disk space in the Elasticsearch snapshots. You can use the snapshot manager tool to manually create, list, show, and delete snapshots.

Remote NFS backup of the Elasticsearch snapshots.feature can be configured by adding the following section to the setup_data.yaml configuration file:


  ES_REMOTE_BACKUP:   # Set if Elasticsearch backups can use a remote host
   service: 'NFS'    # Set if an remote NFS server is used
   remote_host: <ip_addr>   # IP of the NFS server
   remote_path: /root/es_remote  # Path to location of the backups in the remote server

Important considerations about the remote NFS directory on the remote server (specified by the remote_path config option):

  • This directory allows the elasticsearch user (pid number 2020) and group mercury (pid 500) to read, and write. Otherwise, Curator cannot copy the snapshots to the remote NFS directory.

  • It is good if the folder is empty and is used only by Cisco VIM.

  • Cisco VIM does not delete the information in this directory after unbootstrap.

You can enable or disable this feature by running reconfigure. Also it can change the remote_host ip or the remote_path by doing reconfigure.

Network Performance Test with NFVBench

NFVBench is a network performance benchmarking tool integrated with Cisco VIM. For more details, refer to NFVBench section of Chapter 1 in the admin guide for details.

Cisco VIM MON Inventory Discovery API usage

API Client

Inventory_Discovery API is running, by default, on TCP port 8747 on the Cisco VIM management node.

Tools offered on the management node for use by pod administrators are:

  1. API client: Available at / /var/lib/calipso/calipso_client.py

  2. Data replication client: Available at /var/lib/calipso/calipso_replication_client.py

The API client provides options to interact with the Inventory API on any Cisco VIM pod. The API client provides options to interact with the Inventory API on any Cisco VIM pod.

On the Cisco VIM management node, aliases are available for both clients that run with calipso_client and calipso_replication_client. You can use them on desktop and any Cisco VIM node, if the following pre-requisites are met:

  • python 2.7 or 3.5

  • python requests

Any common REST query tool can be used against the Inventory_Discovery API, like curl, postman, httpie, and so on.

As the client source code is available, you can use it to understand the API and build similar client using other languages. The main library used is ‘requests’ which can be obtained for more capabilities from https://pypi.org/project/requests/

Running calipso_client --help provides details of the options available with API client.

Listed below are the key parameters of the tool:

  • api_server API_SERVER - FQDN or IP address of the API Serve (default=localhost)

  • api_port API_PORT - TCP Port exposed on the API Server (default=8747)

  • api_password API_PASSWORD - API password (secret) used by the API Server (default=calipso_default)

  • environment ENVIRONMENT - specify environment (pod) name configured on the API server (default=None)

  • scan SCAN - actively discover the specific cloud environme -options: NOW/HOURLY/DAILY/WEEKLY/MONTHLY/YEARLY (default=None)

  • method METHOD - method to use on the API server - options: get/post/delete/put (default=None)

  • endpoint ENDPOINT - endpoint url extension to use on the API server - options: see API documentation for endpoints (default=None)

  • payload PAYLOAD - 'dict' string with parameters to send to the API - options: see API documentation per endpoint (default=None)

  • page PAGE - a page number for retrieval (default=0)

  • page_size PAGE_SIZE - a number of total objects listed per page (default=1000)

  • version-get a reply back with calipso_client version.

The default parameters for api_server and api_port are used for cases where the client is used on the same management node where the API server is running, in other cases more specifics are needed.


Note

Environment name is used to describe the 'cloud facility endpoints, managed by a specific entity', the reason for using this naming convention is intention to support multiple cloud types.


api_password is obtained through Cisco VIM secrets, either through cat /root/openstack-configs/secrets.yaml | grep CALIPSO_API_SERVICE_PWD cat /root/openstack-configs/secrets.yaml or when VAULT is used in setup_data, then retrieve using vault api:

  1. Get vault data: source /var/lib/calipso/calipso_config (vault token is rendered in calipso_config in place of passwords if vault is defined)

  2. Fetch Mongo password: curl http://$MGMT_IP:8200/v1/secret/data/cvim-secrets/CALIPSO_MONGO_SERVICE_PWD -H "X-Vault-Token: $VAULT_TOKEN"

Environments

The first parameter that must be configured on the API server is an 'environment_config' that holds all the parameters forattributes of an 'environment'.

Environment_config is mandatory step before any scan discovery request can be made. The Environment is a generic cloud facility (of many types) to be discovered by the scanning server. In CVIM the Environment definition holds all the configurations needed to interact with the cloud and discover it's content, for example the API endpoints, the admin passwords, the DB passwords, the SSH passwords/keys, the Message-BUS access url and credentials etc.

To obtain the list of environments available on a specific API server use the examples below (using curl or calipso_client).:

The x-token is grabbed per session, allowing one-time password for secure communication with the server, any 'FQDN' or IP for API server can be used:

Token request using curl:

request:

curl -i -H "Content-Type: application/json" -H "Accept: application/json" 
-X POST -d '{"auth": {"methods": ["credentials"],
"credentials": {"username": "calipso","password": "<CALIPSO_API_SERVICE_PWD> "}}}'
 http://localhost:8747/auth/tokens 

response:

{"issued_at": "2019-06-17T09:13:17.388124", "method": "credentials", "expires_at": 
"2019-06-18T09:13:17.388124", 
"token": "a1fcff2023894061898a80fea6d5dd52", "_id": "5d0759ad6d07b1001214934b"}

As the underlying data is always json, it is recommended that each request has those two headers: Content-Type application/json and Accept application/json.

Post request requires data in json format (-d in curl), Get requests need to include attributes in the url.

For the duration of the session ('expires_at' is returned) the value of the 'token' mustbe used for all requests to the API server in a X-Auth-Token header, for example:

Environment request using curl:

request:

curl -i -H "Content-Type: application/json" -H "Accept: application/json" -H 
"X-Auth-Token: a7d13511ad44406281362d18366d99fc" -X 
GET http://localhost:8747/environment_configs

response:

{"environment_configs": [{"name": "cvim-cloud", "distribution": "Mercury"}]}

In the above example, GET is used ands url includes the values in case of the endpoint of /environment_configs.

The calipso_client handles all security needs automatically per request, and defaults to 'localhost' with default port and default username. You can give the API secret in a single call to get the same response

Environment request using calipso_client:

request:

calipso_client --api_server <br_api_mgmt_node> --api_password <CALIPSO_API_SERVICE_PWD> --method get --endpoint environment_configs

response:

{"environment_configs": [{"name": "cvim-cloud", "distribution": "Mercury"}"}]}

Once the name of the environment is known, you can make a SCAN request to discover cloud content.

Scans

Discovering the details (inventory and dependencies) of a specific environment is handled through scan requests, scan requests can be made once (automated as needed)

or can be scheduled in-advance through scheduled scan request.

A prerequisite for any scan request is the existent of an environment_config (see validations above).

It is advised to kick off a Scan request once some configurations (instances, flavors, networks etc) has been made on the OpenStack environment.

Scan request and a successfully completed scan with full discovery is a mandatory step before any other query can be made against the underlying data .

Here is an example of a one-time scan request, note that specifying an environment parameter is mandatory for scan request:

Scan environment with calipso_client

Scan can take a while, depending on the size of the customer deployed resources on the OpenStack environment, if scan_status returns errors this needs to be debugged in the calipso_scan container (hint: look at the logs).

When scan_status is 'completed' and all Inventory, Links and Cliques has been discovered, the API can now be further used to grab data for analysis.

Scan can also be scheduled in advance, here is an example of a scheduled scan request:

Scheduled-scan environment with calipso client

request:

calipso_client --api_password <CALIPSO_API_SERVICE_PWD> --environment cvim-cloud --scan WEEKLY

response:

Scheduled scan at: 2019-06-24T12:49:35.332000
Submitted at: 2019-06-17T05:49:34.426000
Scan frequency: WEEKLY

For scheduled-scan the reply above provides details about the submitted time and the time of the next scheduled scan, the scan will be repeated at the frequency defined in the request.

To watch the details of any previously submitted scan request, use the /scans or /scheduled_scans as endpoint for the request, also environment name is mandatory to get scans per that environment:

Get historical scan and scheduled scans with calipso_client

request:

calipso_client --api_password <CALIPSO_API_SERVICE_PWD>  
--method get --endpoint scans --environment cvim-cloud

response

{
    "scans": [
        {
            "environment": "cvim-cloud", 
            "id": "5cdd9d7c6d07b10013ade7f2", 
            "status": "completed"
        }, 
        {
            "environment": "cvim-cloud", 
            "id": "5cddb2726d07b10013ade7ff", 
            "status": "completed"
        }, 
        {
            "environment": "cvim-cloud", 
            "id": "5cdff1476d07b10013ade80f", 
            "status": "running"
        }, 
    ]
}

request:

calipso_client --api_password <CALIPSO_API_SERVICE_PWD>  --method get --endpoint scheduled_scans --environment cvim-cloud
 
response:
{
    "scheduled_scans": [
        {
            "environment": "cvim-cloud", 
            "freq": "WEEKLY", 
            "id": "5ce2f78e6d07b10013ade824", 
            "scheduled_timestamp": "2019-06-17T18:53:04.519000"
        }, 
        {
            "environment": "cvim-cloud", 
            "freq": "WEEKLY", 
            "id": "5d078c5e6d07b10012149382", 
            "scheduled_timestamp": "2019-06-24T12:49:35.332000"
        }, 
        {
            "environment": "cvim-cloud", 
            "freq": "WEEKLY", 
            "id": "5d078f3a6d07b10012149385", 
            "scheduled_timestamp": "2019-06-24T13:01:46.794000"
        }
    ]
}

Note

The developer needs to make sure schedules are well known and there are not too many overlapping or too frequent scans running against the same pod, during scan the data is cleared by default and scan can take some time.


Paging

Each Inventory Discovery API server may hold many objects, depending on the customer deployment this can get quite large.

A mechanism of paging is available for all API queries to the server, supporting page number and page size, and engineer can use this mechanism to request a certain page from a big list of items on the server and request total number of items to be listed per page (page_size).

Here is an example of request using paging, this example runs against the scans endpoint:

request:

calipso_client --
api_password <CALIPSO_API_SERVICE_PWD>--method get --
endpoint scans --environment cvim-cloud --page 0 --page_size 1

response:

{
    "scans": [
        {
            "environment": "cvim-cloud", 
            "id": "5cdd9d7c6d07b10013ade7f2", 
            "status": "completed"
        }
    ]
}

request:

request:
calipso_client --api_password <CALIPSO_API_SERVICE_PWD>--method get --
endpoint scans --environment cvim-cloud --page 0 --page_size 2

response:


{
    "scans": [
        {
            "environment": "cvim-cloud", 
            "id": "5cdd9d7c6d07b10013ade7f2", 
            "status": "completed"
        }, 
        {
            "environment": "cvim-cloud", 
            "id": "5cddb2726d07b10013ade7ff", 
            "status": "completed"
        }
    ]
}

Inventory

Each Inventory Discovery API server runs on a specific pod/environment and holds the latest scan results for all objects and resources on that specific environment in the mongoDB 'calipso' in a special collection called 'inventory'.

Query for inventory collection requires specifying an environment name and the common 'get' method.

The first logical query would be getting a list of all objects in that environment of a specific 'type'.

The list of supported object types can be grabbed from constants, here is the latest output for 3.4 release, with embedded explanations for the different types:

request:

calipso_client --api_password <CALIPSO_API_SERVICE_PWD>--method 
get --endpoint constants --payload "{'name': 'object_types'}"

response:

request:
calipso_client --api_password <CALIPSO_API_SERVICE_PWD>--method get --endpoint constants --payload "{'name': 'object_types'}"

response:
{
    "_id": "5cdd5f92bac311001dfbdbca", 
    "data": [
        {
            "label": "vnic",       --> virtual NIC attached to a VM or a Namespace (ex: tap interface, virtualEthernet interface)
            "value": "vnic"
        }, 
        {
            "label": "vconnector",   --> Local Bridge connecting VMs running inside the same node )ex: linux_bridge , bridge_domain)
            "value": "vconnector"
        }, 
        {
            "label": "vedge",   --> The device connecting VMs running inside a node to the physical network (ex: VPP, OVS, SR-IOV)
            "value": "vedge"
        }, 
        {
            "label": "instance",   --> VM
            "value": "instance"
        }, 
        {
            "label": "container",   --> Container
            "value": "container"
        }, 
        {
            "label": "pod",  --> K8s Pod
            "value": "pod"
        }, 
        {
            "label": "vservice",   --> a Namespace, a process/device providing networking services 
(ex: DHCP, Router, Proxy)
            "value": "vservice"
        }, 
        {
            "label": "host_pnic",   --> physical NIC on a node/host
            "value": "host_pnic"
        }, 
        {
            "label": "switch_pnic",   --> physical NIC on a switch
            "value": "switch_pnic"
        }, 
        {
            "label": "network",   --> the logical representation of an end-to-end communication , 
like an OpenStack network
            "value": "network"
        }, 
        {
            "label": "switch",   --> physical switching device
            "value": "switch"
        }, 
        {
            "label": "port",   --> endpoint on a network
            "value": "port"
        }, 
        {
            "label": "otep",   --> overlay tunneling endpoint, of many types (gre, vxlan, geneve etc ...)
            "value": "otep"
        }, 
        {
            "label": "agent",   --> a process running on a host for control (ex: ovs agent, dhcp agent etc)
            "value": "agent"
        }, 
        {
            "label": "host",  --> the node, physical server (or VM in nested environments)
            "value": "host"
        }, 
        {
            "label": "project",   --> openstack's tenant 
            "value": "project"
        }
    ], 
    "id": "5cdd5f92bac311001dfbdbca", 
    "name": "object_types"
}

Querying for object details

To query the MongoDB for objects you need the following information:

  • type of the specific object

  • specific id of the object

The list of available objects of certain type with their names, ids and some generic attributes can be listed by query to inventory endpoint for a paged list of certain object type, for example here we look for instances, 5 per page:

request:

calipso_client --api_password <CALIPSO_API_SERVICE_PWD>--environment cvim-cloud 
--method get --endpoint inventory --page_size 5 --payload "{'type': 'instance'}"

response:

{
    "objects": [
        {
            "environment": "cvim-cloud", 
            "id": "3959f44c-5e76-4648-a8b7-86039f6f9372", 
            "name": "gold-vm-1", 
            "name_path": "/cvim-cloud/Regions/RegionOne/Availability Zones/aio-zone/cloud-aio-2/
Instances/gold-vm-1", 
            "type": "instance"
        }, 
        {
            "environment": "cvim-cloud", 
            "id": "5a3cb117-714a-4086-a414-c162dab583cc", 
            "name": "gold-vm-4", 
            "name_path": "/cvim-cloud/Regions/RegionOne/Availability Zones/aio-zone/cloud-aio-2/
Instances/gold-vm-4", 
            "type": "instance"
        }
    ]

All objects in the API have a unique id, this id is listed in the query for any object type list, this should then be used to grab the more detailed data available for specific object, for example:

request:

calipso_client --api_password <CALIPSO_API_SERVICE_PWD>--environment cvim-cloud --method get --endpoint 
inventory --payload "{'id': 'fb7cb28a-08aa-497e-9d70-5dae755c18a2'}"

response:

{
    "_id": "5d078b2184c6929f454701d8", 
    "accessIPv4": "", 
    "accessIPv6": "", 
    "addresses": {
        "flat-network": [
            {
                "OS-EXT-IPS-MAC:mac_addr": "fa:16:3e:db:29:4a", 
                "OS-EXT-IPS:type": "fixed", 
                "addr": "192.168.90.4", 
                "version": 4
            }
        ]
    }, 
    Etc….etc….
                    "revision_number": 0, 
                    "security_group_id": "ce305d1f-4d02-4759-89b7-a5f92446bb8d", 
                    "tags": [], 
                    "tenant_id": "c7488606a2ac40ccbd79172ba1ae8b93", 
                    "updated_at": "2019-05-16T14:29:13Z"
                }
            ], 
            "tags": [], 
            "tenant_id": "c7488606a2ac40ccbd79172ba1ae8b93", 
            "updated_at": "2019-05-16T14:29:13Z"
        }
    }, 
    "show_in_tree": true, 
    "task_state": null, 
    "tenant_id": "c7488606a2ac40ccbd79172ba1ae8b93", 
    "terminated_at": null, 
    "type": "instance", 
    "user_id": "5d0068c060d146789c3bbaf085e573ed", 
    "uuid": "fb7cb28a-08aa-497e-9d70-5dae755c18a2", 
    "vm_state": "active", 
    "volumes_attached": []
}

Inventory is offering dat discovered from OpenStack APIs , Databases and also from host-level CLI commands.

Links

Links represent relationships, a certain connection between specific object and another object, for example an instance connected to it's vnic or a host_pnic connected to a network.

Each Inventory Discovery API server runs on a specific pod/environment and holds the latest scan results for all links on that specific environment in the mongoDB 'calipso' in a special collection called 'links'.

Query for links collection requires specifying an environment name and the common 'get' method.

The first logical query would be getting a list of all links in that environment of a specific 'link_type'.

The list of supported link_types can be grabbed from constants, here is the latest output for 3.4 release, with embedded explanations for the different types:

request:

calipso_client --api_password <CALIPSO_API_SERVICE_PWD>--method get --
endpoint constants --payload "{'name': 'link_types'}"
response:
{ 
    "data": [
        {
            "label": "instance-vnic", 
            "value": "instance-vnic"
        }, 
        {
            "label": "vnic-instance", 
            "value": "vnic-instance"
        }, 
        {
            "label": "vnic-vconnector", 
            "value": "vnic-vconnector"
        }, 
        }, etc ..etc ..
        {
            "label": "host_pnic-switch_pnic", 
            "value": "host_pnic-switch_pnic"
Etc…etc..
    "id": "5cdd5f92bac311001dfbdbc7", 
    "name": "link_types"
}

Querying for link details

To query the MongoDB for links you need the following information:

  • link_type of the specific link

  • specific id of the link

The list of available links of a certain type with their names, ids and some generic attributes can be listed by query to links endpoint for a paged list of certain link type, for example here we look for instance-vnic links, 5 per page:

request:

calipso_client --api_password <CALIPSO_API_SERVICE_PWD>--environment cvim-cloud --method get --
endpoint links --
page_size 5 --payload "{'link_type': 'instance-vnic'}"
response:
{
    "links": [
        {
            "environment": "cvim-cloud", 
            "host": "cloud-aio-2", 
            "id": "5d078b4184c6929f454705a3", 
            "link_name": "flat-network", 
            "link_type": "instance-vnic"
        }, 
        {
            "environment": "cvim-cloud", 
            "host": "cloud-aio-2", 
            "id": "5d078b4184c6929f454705a8", 
            "link_name": "flat-network", 
            "link_type": "instance-vnic"
        }, 
Etc…etc…
}

Connectivity Analysis

All links in the API have a unique id, this id is listed in the query for any link type list, this should then be used to grab the more detailed data available for specific link, for example:

request:

request:
calipso_client --api_password <CALIPSO_API_SERVICE_PWD>--environment cvim-cloud --
method get --endpoint links --payload "{'id': '5d078b4184c6929f454705b2'}"

response:
{
    "attributes": {
        "network": "12772133-b894-4a06-8cfb-1f01154721f1"
    }, 
    "environment": "cvim-cloud", 
    "host": "cloud-aio-1", 
    "id": "5d078b4184c6929f454705b2", 
    "implicit": false, 
    "link_name": "flat-network", 
    "link_type": "instance-vnic", 
    "link_weight": 0, 
    "source": "5d078b2184c6929f454701d8", 
    "source_id": "fb7cb28a-08aa-497e-9d70-5dae755c18a2", 
    "source_label": "", 
    "state": "up", 
    "target": "5d078b3a84c6929f45470404", 
    "target_id": "cloud-aio-1-gold-vm-2-vhostuser-fa:16:3e:db:29:4a", 
    "target_label": ""
}}

Response is always a JSON and can be filtered by any means, including grep on command line.

One important detail on any link is whether or not it is 'implicit' (implicit means it is analyzed after discovery for end-to-end dependency, explicit means it is discovered from real-time data on the objects).

Each link have a 'target_id' and a 'source_id' which represents the 'ids' of certain objects on the inventory collection and can each be grabbed from inventory as explained above on the 'inventory' section.

Cliques

Cliques represent a more complex concept for analysis purposes : dependencies for a certain object.

The object is a 'focal_point' (object of interest) and it refers to an array of links all representing the dependency tree (or topology tree) for that specific object, for example an instance connected to it's vnic, then to a bridge, then to ovs, then to vxaln, then to host_pnic etc.

Each Inventory Discovery API server runs on a specific pod/environment and holds the latest scan results for all cliques and their resources on that specific environment in the mongoDB 'calipso' in a special collection called 'cliques'.

Query for cliques collection requires specifying an environment name and the common 'get' method.

The first logical query would be getting a list of all clique_types in that environment for each specific 'focal_point_type'.

Clique_types are specific for cloud type, meaning it depends on attributes like the distribution type, the type_driver and mechanism_driver in use etc.

When analyzing the data for cliques, a match is made between the attributes of the below clique_types (for example - the distribution value) and the value on the specific environment_config (see environment section above).

The list of supported clique types can be grabbed from a specific endpoint called clique_types, here is the latest output for 3.4 release, with embedded explanations for the different types:

request:
calipso_client --api_password <CALIPSO_API_SERVICE_PWD>--method 
get --endpoint clique_types

response:

request:
calipso_client --api_password <CALIPSO_API_SERVICE_PWD>--method get --endpoint clique_types

response:
{
    "clique_types": [
        {
            "environment": "ANY",              --> this list of links for this focal_point_type will be used if a more specific one is not matched 
            "focal_point_type": "instance",    --> this object type (instance) will depend on the below list of link_types
            "id": "5cdd5f92bac311001dfbdbaa", 
            "link_types": [
                "instance-vnic", 
                "vnic-vconnector", 
                "vconnector-vedge", 
                "vedge-otep", 
                "otep-vconnector", 
                "vconnector-host_pnic", 
                "host_pnic-network"
            ], 
            "name": "instance"
        }, 
        {
            "environment": "ANY",              --> this list of links for this focal_point_type will be used if a more specific one is not matched
            "focal_point_type": "vservice",    -> this object type (vservice) will depend on the below list of link_types
            "id": "5cdd5f92bac311001dfbdbab", 
            "link_types": [
                "vservice-vnic", 
                "vnic-vedge", 
                "vedge-otep", 
                "otep-vconnector", 
                "vconnector-host_pnic", 
                "host_pnic-network"
            ], 
            "name": "vservice"
        }
        {
            "distribution": "Mercury",      --> for a more specific distribution of this type (Mercury) the below links will be used for this focal_point_type
            "environment": "", 
            "focal_point_type": "instance",   
            "id": "5cdd5f92bac311001dfbdbb2", 
            "link_types": [
                "instance-vnic", 
                "vnic-vconnector", 
                "vconnector-vedge", 
                "vedge-host_pnic", 
                "host_pnic-network"
            ], 
            "name": "instance_vconnector_clique"
        }, 
        {
            "distribution": "Mercury", 
            "environment": "", 
            "focal_point_type": "vservice", 
            "id": "5cdd5f92bac311001dfbdbb3", 
            "link_types": [
                "vservice-vnic", 
                "vnic-vconnector", 
                "vconnector-vedge", 
                "vedge-host_pnic", 
                "host_pnic-network"
            ], 
            "name": "vservice_vedge_clique"
        }, 
        {
            "distribution": "Mercury", 
            "environment": "", 
            "focal_point_type": "network", 
            "id": "5cdd5f92bac311001dfbdbb4", 
            "link_types": [
                "network-host_pnic", 
                "host_pnic-vedge", 
                "vedge-vconnector", 
                "vedge-vnic", 
                "vconnector-vnic", 
                "vnic-instance", 
                "vnic-vservice"
            ], 
            "name": "network"
        }, etc…etc…
        }
    ]
}

Querying for clique details

To query the MongoDB for cliques you need the following information:

  • focal_point_type for the specific clique

  • specific focal_point_object_id of the clique

  • id of the specific clique

The actual logical flow of getting full clique details is listed further below in this section:

The list of available cliques with the specific focal_point ids and some generic attributes can be listed by query to cliques endpoint for a paged list of certain clique type, for example here we look for instance as focal_point, and list 5 per page:

request:

calipso_client --api_password <CALIPSO_API_SERVICE_PWD>--method get --
endpoint cliques --environment cvim-cloud --payload 
"{'focal_point_type': 'instance'}" --page_size 5

response:

{
    "clique_types": [
        {
            "environment": "ANY",              --> this list of links for this focal_point_type will be used if a more specific one is not matched 
            "focal_point_type": "instance",    --> this object type (instance) will depend on the below list of link_types
            "id": "5cdd5f92bac311001dfbdbaa", 
            "link_types": [
                "instance-vnic", 
                "vnic-vconnector", 
                "vconnector-vedge", 
                "vedge-otep", 
                "otep-vconnector", 
                "vconnector-host_pnic", 
                "host_pnic-network"
            ], 
            "name": "instance"
        }, 
        {
            "environment": "ANY",              --> this list of links for this focal_point_type will be used if a more specific one is not matched
            "focal_point_type": "vservice",    -> this object type (vservice) will depend on the below list of link_types
            "id": "5cdd5f92bac311001dfbdbab", 
            "link_types": [
                "vservice-vnic", 
                "vnic-vedge", 
                "vedge-otep", 
                "otep-vconnector", 
                "vconnector-host_pnic", 
                "host_pnic-network"
            ], 
            "name": "vservice"
        }
        {
            "distribution": "Mercury",      --> for a more specific distribution of this type (Mercury) the below links will be used for this focal_point_type
            "environment": "", 
            "focal_point_type": "instance",   
            "id": "5cdd5f92bac311001dfbdbb2", 
            "link_types": [
                "instance-vnic", 
                "vnic-vconnector", 
                "vconnector-vedge", 
                "vedge-host_pnic", 
                "host_pnic-network"
            ], 
            "name": "instance_vconnector_clique"
        }, 
        {
            "distribution": "Mercury", 
            "environment": "", 
            "focal_point_type": "vservice", 
            "id": "5cdd5f92bac311001dfbdbb3", 
            "link_types": [
                "vservice-vnic", 
                "vnic-vconnector", 
                "vconnector-vedge", 
                "vedge-host_pnic", 
                "host_pnic-network"
            ], 
            "name": "vservice_vedge_clique"
        }, 
        {
            "distribution": "Mercury", 
            "environment": "", 
            "focal_point_type": "network", 
            "id": "5cdd5f92bac311001dfbdbb4", 
            "link_types": [
                "network-host_pnic", 
                "host_pnic-vedge", 
                "vedge-vconnector", 
                "vedge-vnic", 
                "vconnector-vnic", 
                "vnic-instance", 
                "vnic-vservice"
            ], 
            "name": "network"
        }, etc…etc…
        }
    ]

Collections Scheme

While not restricted to any specific scheme, each object, based on its type, can hold lots of attributes, specific to its technology domain, but several attributes are mandatory on the server, for accuracy, analysis and UI/Front-End common requirements.

The following main collections are always deployed with the DB for Inventory Discovery:

  • api_tokens - not exposed externally, used to hold session tokens for interaction with the DB

  • attributes_for_hover_on_data - not exposed externally, used for UI to control the display of specific attributes from a specific object

  • clique_constraints - not exposed externally, defined the depth of the topology discovery (see 'constraints' in clique attributes)

  • clique_types - exposed externally, defines the type of topology / dependency tree available on each specific cloud / environment type

  • cliques - exposed externally, holds the details of each dependency tree for each object in the inventory

  • connection_tests - not exposed externally, holds the requests for testing a connection to API endpoints, DBs and CLI on hosts

  • constants - exposed externally, holds the list of all supported objects and thier attributes for the different clouds

  • environment_options - not exposed externally, holds lists of all supported environment configurations usedby UI

  • environments_config - exposed externally, the real time details of how to interact and communicate with a specific cloud / environment

  • inventory - exposed externally, holds the list of all object discovered in real time from the cloud environment

  • link_types - exposed externally, holds the list of all supported link types

  • links - exposed externally, holds the list of all links discovered in real time from the cloud environment

  • messages - exposed externally, holds the list of all messages and events discovered in real time from the cloud environment

  • monitoring_config - not exposed externally, holds the list of actual monitoring configurations for the different clouds

  • monitoring_config_templates - not exposed externally, holds the list of supported monitoring configurations templates for the different clouds

  • network_agent_types - not exposed externally, holds the list of all supported network agents (per cloud release)

  • roles - not exposed externally, used for role definitions for RBAC to access the system with LDAP or Internal

  • scans - exposed externally, holds the list of requested scans to discover, per cloud environment

  • scheduled_scans - exposed externally, holds the list of requested scheduled scans to discover, per cloud environment

  • statistics - not exposed externally, holds the list of metrics and statistics over time for sensu with TSDB cases

  • supported_environments - not exposed externally, holds the list of all supported variances for the different clouds (distributions, type_drivers etc)

  • user_settings - not exposed externally, used for user authorization definitions for RBAC to access the system with LDAP or Internal

  • users - not exposed externally, used for user definitions for RBAC to access the system with LDAP or Internal

Mandatory attributes for inventory object

The following attributes are mandatory per colection, while each object, linkd and clique based on it's type have many more additional attributes:

  • Mandatory attributes for inventory objects

  • environment - name of cloud environment where this object was discovered

  • id - unique identification across all the inventory

  • type - specific type of the object (ex: instance, switch, host etc)

  • name and object_name - none-unique identification as name and per-environment unique name as object_name

  • show_in_tree - boolean , if object needs to be presented in a tree

  • name_path - clear placement in the herarchical tree, per environment/cloud type, based on names

  • id_path - clear placement in the herarchical tree, per environment/cloud type, based on ids

  • parent - name of the parent object (like instances under a certain host, ports under a certain network, containers under a certain pod etc)

  • parent_id - id of the parent object

  • parent_type - object type of the parent object

  • launched_at - when this object was discovered last

  • created_at - when this object was created

  • state - for monitoring purposes, several values apply per type

  • host/switch - (one of which mandatory) - physical device that runs this object (more attributes apply for nested environments)

Mandatory attributes for links

  • environment - name of cloud environment where this link was discovered

  • id - unique identification across all the links

  • link_type - specific link type of the link (ex: instance-vnic, switch_pnic-host_pnic etc) per supported link_types in constants

  • link_name - per-environment unique name for the link

  • state - for monitoring purposes, several values apply per type

  • source_id - id of the source object of this link

  • link_weight - level of importance per clique, defaults to 0

  • implicit - boolean value, represent if link is real-time discovered per data presented in inventory or analyzed through other links

  • host/switch - (one of which mandatory) - physical device that runs this link (more attributes apply for nested environments

Mandatory attributes for cliques

  • environment - name of cloud environment where this link was discovered

  • id - unique identification across all the links

  • focal_point - mongoDB id of the specific 'object of intrest' that is the source of the listed links (ex: instance is a start of a list of links: instance-vnic, vnic-vconnector etc) per supported clique_types

  • focal_point_object_id - inventory id of the specific focal_point on the inventory

  • nodes - all the objects that are part of the clqiue (for UI graphing purposes)

  • links - all the links that are part of the clqiue (for UI graphing purposes)

  • clique_type - the type of the clique, per the supported clique_types

  • links_detailed - all details per link

  • constraints - which object type is the final 'depth' (lowest, last) object in the specific topology tree