- Overview
- Getting Started
- Monitoring and Analyzing Traffic
- Capturing and Decoding Packets
- Performing User and System Administration
- Understanding NAM Deployment
- Customizing Cisco Prime NAM
- Understanding Prime NAM Traffic Sources
- Configuring NAM Security
- Understanding Prime NAM Behavior Reference
- GUI Field Descriptions
- Troubleshooting Network and NAM Issues
NAM Deployment
This guide describes some usage cases on how to deploy NAM in your networks. It contains details on network performance management as well as usage scenarios for the Cisco Prime Network Analysis Module Software.
To view which release versions run on the supported NAM platforms, see the NAM Compatibility Matrix.
The use cases focus on a specific need to be addressed or a problem to be solved. Each scenario takes into account the deployment considerations discussed in Overview and then uses one or more of NAM’s features to meet the need or solve the problem. The goal of these use cases is to provide real-world examples. These examples discuss best practices and approaches to effective NAM deployment and are grouped into several categories.
This guide contains the following sections:
- Deploying in the Data Center
- Deploying in a Campus Environment
- Deploying in the Branch
- General Usage Scenarios
- NAM Integrations with Monitoring and Reporting Applications

Note Some of the graphics represented in this section may be different than what you see on the screen. These illustrations are for examples only.
Deployment Examples
- Using NAM to Monitor VoIP Quality
- Auto-Discovery Capabilities of NAM
- Creating Custom Applications
- Integrating NAM with Prime Infrastructure
- Integrating NAM with Third Party Reporting Tools
Using NAM to Monitor VoIP Quality
Voice quality analysis has been significantly enhanced in Cisco NAM. The software is now capable of accurately measuring voice quality by using the industry-standard MOS algorithm. Call quality measurements are computed every 1 minute and made available through the GUI. Note that the voice-related screens on the NAM GUI are significantly different from previous releases. Changes have been made to provide useful information quickly and automatically, while allowing easy navigation to details.
Deployment: NAM deployments for voice quality analysis require that NAM be able to monitor VoIP packets from the calling phone to the called phone. The branch edge location in the network provides visibility into all calls entering and leaving the branch; similarly a campus edge location monitors calls crossing the campus boundary. Often, the distribution layer is a good location to deploy NAMs for this purpose, especially if specific phones or particular portions of the network are to be monitored. For example, a new Multi protocol Label Switching (MPLS) link is being piloted and three buildings that are part of Company X's headquarters are part of the pilot. In order to monitor voice quality for those three buildings, a NAM could be deployed at the distribution Catalyst 6500 that serves those users.
Note The data center is typically not an appropriate location for RTP stream analysis because calls will seldom go through the data center. However, the data center is a good location to monitor signaling messages between phones and Cisco Unified Communications Manager. NAM decodes signaling messages to track call history, caller names, phone numbers, and other relevant call details.
Use the following steps to monitor the network to make sure that call quality is good. If quality issues appear, isolate and troubleshoot the problem rapidly.
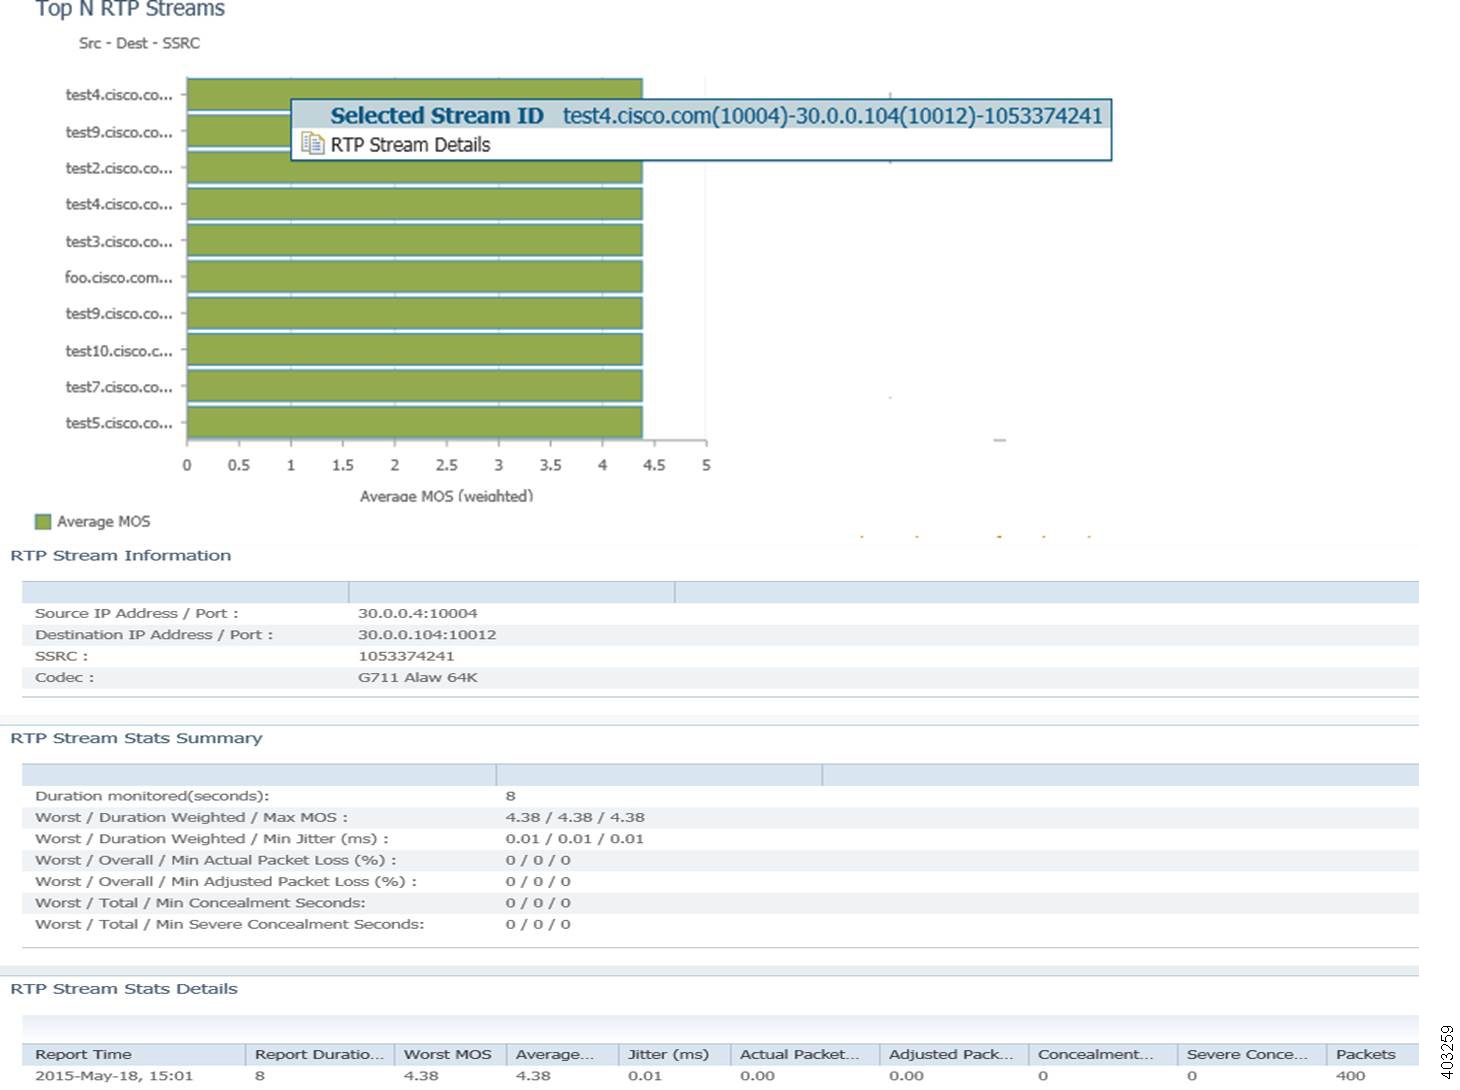
Step 1 View RTP Streams using the menu selection Analyze > Media . This chart indicates current voice quality of all RTP streams being monitored. MOS values range from 1 to 5, where 1 is poor and 5 is excellent (see the legend for a breakdown into categories-Poor, Fair, Good and Excellent). The figure below displays the Top N RTP Source and Destination endpoints. Notice that there are calls that are in the poor range.
Step 2 To isolate calls that had a poor MOS, scroll down to Top N RTP Streams and click on the chart to drill down into the RTP Stream Details. See Figure 6-1.
Figure 6-1 Top N RTP Streams by MOS
Step 3 With the endpoints’ IP addresses, you can look at the network topology to identify where in the network the 50.5.10.38 subnet is located. For the purposes of this use case, this subnet is in Building 3 of the main campus. You know that the Building 3 distribution switch has a NAM located in it.
Navigate to that NAM and go to the menu selection Analyze > Managed Device > Interface . This page lists all interfaces and errors or discards on each interface. Look up the link that leaves Building 3 and connects to the core. That interface is likely the source of the packet loss. Check the interface for faults and fix as needed.
See Analyzing Traffic, RTP Streams and Setting Voice Signaling Thresholds.
Auto-Discovery Capabilities of NAM
Auto-discovery data source is enabled by default for ERSPAN and NetFlow that are sent from remote device to NAM management port. NAM user has the option to disable any of the three auto-discovery. When auto-discovery is enabled, NAM automatically creates ERSPAN data source and NetFlow data source based on the data type being received at the NAM management interface.
Creating Custom Applications
NAM identifies applications/protocols based on the TCP/UDP port number, so if there are applications using custom ports, the NAM can be configured to identify those applications by name instead of the port.
Integrating NAM with Prime Infrastructure
Cisco Prime supports integrated lifecycle management of networks, services, and endpoints for Cisco borderless network, data center, and collaboration architectures with end-to-end assurance. You can use Cisco Prime Infrastructure to centrally manage the Cisco Prime NAM platforms such as the NAM appliance to track inventory, view configurations, and perform image and fault management. Prime Infrastructure also rolls up the performance intelligence from NAMs deployed across the network into a consolidated dashboard.
The following overview describes the steps to complete in Prime Infrastructure to set up NAM to view multiple NAMs on your dashboard. For details steps, see the Prime Infrastructure User Guide on Cisco.com.
Step 1 Ensure you configure NTP and DNS for all the NAMs in your network. You can now configure those without going to the CLI or logging in to the individual NAM web GUI. Use the Cisco Prime Infrastructure Device Work Center to perform this task. For detailed steps, see your Prime Infrastructure product documentation.
Step 2 Add the NAM HTTPS credentials from the Prime Infrastructure’s Device Work Center Edit Device window so that Prime Infrastructure can retrieve data from them. You must add them only after the discovery process is complete or the modules have been added to the Prime Infrastructure inventory.
If you have licensed Assurance features, most Assurance features depend on NAM data to work so this is a required step.
You can repeat this task for all NAMs from which you want Prime Infrastructure to collect data.
Step 3 To ensure that you can collect data from your NAMs using Prime Assurance, you must enable NAM data collection and configure your NetFlow-enabled switches, routers, and other devices (ISR/ASR) to export this data to Prime Infrastructure. You can do this for each discovered or added NAM, or for all NAMs at the same time.
Step 4 To manage and troubleshoot a network problem such as a suspected network attack, you can use multiple NAMs to create packet captures, save them as files, and then decode them to inspect the suspicious traffic.
For other troubleshooting tips on how to use NAM with Prime Infrastructure, see the Prime Infrastructure User Guide. For application developers who want to use the NAM REST API to connect with Prime NAM, ask your Cisco representative about using the Cisco Prime Network Analysis Module REST API.
Integrating NAM with Third Party Reporting Tools
Prime NAM integrates with the CA NetQoS SuperAgent for the purpose of aggregating Application Response Times. Prime NAM also integrates with CompuWare Vantage and InfoVista 5View for Host, Conversation, RTP, and Response Time.
Ask your Cisco representative about the NAM API Programmer’s Guide to find out more about the NAM Northbound Interface, also referred to as the REST API (Application Programming Interface). The API enables you to provision Prime NAM and extract performance data.
You can write your own scripts based on the Prime NAM Northbound API, but you must perform some setup in the GUI.
For details on what data can be collected, see Using Response Time Summary.
Monitoring
- Using NAM to Monitor QoS/DiffServ (DSCP)
- Using NAM for Historical Trends via Interactive Report
- Using NAM to Evaluate Application-Level Performance Monitoring for TCP-Interactive Applications
- Using NAM to Evaluate Application-Level Performance Monitoring for UDP Real-Time Applications
- Troubleshooting
Using NAM to Monitor QoS/DiffServ (DSCP)
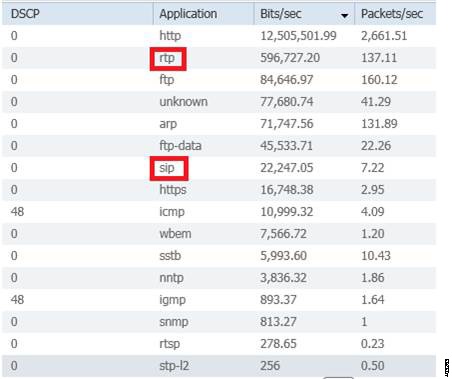
Differentiated Services (DiffServ) provides insight into how traffic is being classified by QoS and detects incorrectly marked or unauthorized traffic. The NAM identifies the application/protocol based on the type of service (ToS) bits setting. The administrator can configure DSCP Groups or use the ones provided. The voice template can be used to monitor whether voice traffic is marked properly. Figure 6-3 displays the DiffServ application statistics for all DSCP value. Looking at this, you will notice that RTP and Session Initiation Protocol (SIP) are listed, which indicates that they are not being correctly marked throughout its path.
In the following scenario, IT has deployed QoS to prioritize VoIP traffic to improve voice quality across the network. The NAMs are deployed in the data center and branches and utilized to monitor the DSCP to validate QoS policies.
Step 1 Choose Setup > Network > DSCP Groups to display the default groups.
Step 2 Choose Administration > System > Preferences to turn the IP TOS Flow Key on. Use caution since this option affects ART and other flow-based traffic. See Table D-71 for details.
Step 3 Choose Analyze > Traffic > DSCP to find any misclassified traffic. In Figure 6-2, the RTP protocol is displayed for ToS0 classification.

Step 4 Click on the All DSCP button to view all DSCP and applications.
Step 5 In Figure 6-3, RTP and SIP are highlighted. The protocols are listed for DSCP 0, which is incorrect since the standard classification for voice traffic is DSCP 46 and 24. This means that some of the voice traffic is misclassified on the network. You can also view the branch NAMs to investigate whether voice traffic is being misclassified.
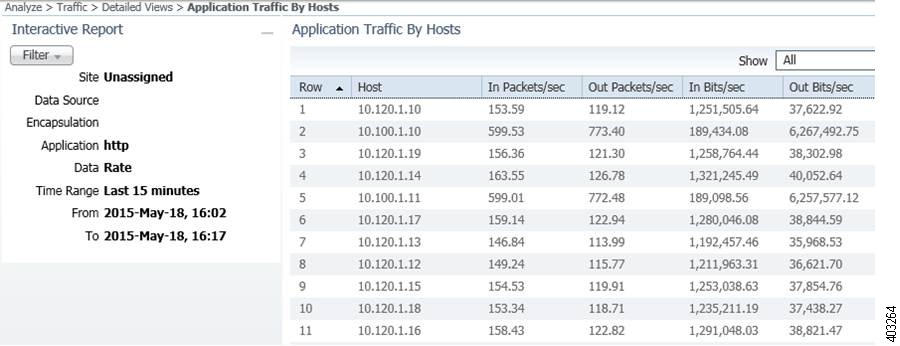
Step 6 Left-click on the RTP graph and select Application Traffic by Host to display the clients using those protocols. This helps to troubleshoot why RTP or SIP traffic from these clients is not marked correctly. As shown in Figure 6-4, the NAM displays the IP addresses of the phones using those protocols. This helps you review the QoS policy implemented on the routers and switches between the clients.
Using NAM for Historical Trends via Interactive Report
Historical trending is an important component of network performance management. While real-time analysis provides information about events, historical trending provides visibility into event sequences. Such sequences offer valuable information about various aspects of the network such as changes in network traffic behavior, anomalies and unusual activities, and network usage in peak times versus low times. It is also helpful in planning future network upgrades, application roll outs, and hardware buildouts. Here are some things to take note of regarding NAM’s historical trending capabilities:
- Use the Interactive Report > Filter button (located on the left side of the NAM window) to look at short term and long term trends by changing the Time Range. The interactive reports can be exported or the filter setting saved for quick view in the future. The exported data can be sent via e-mail in CSV or PDF format.
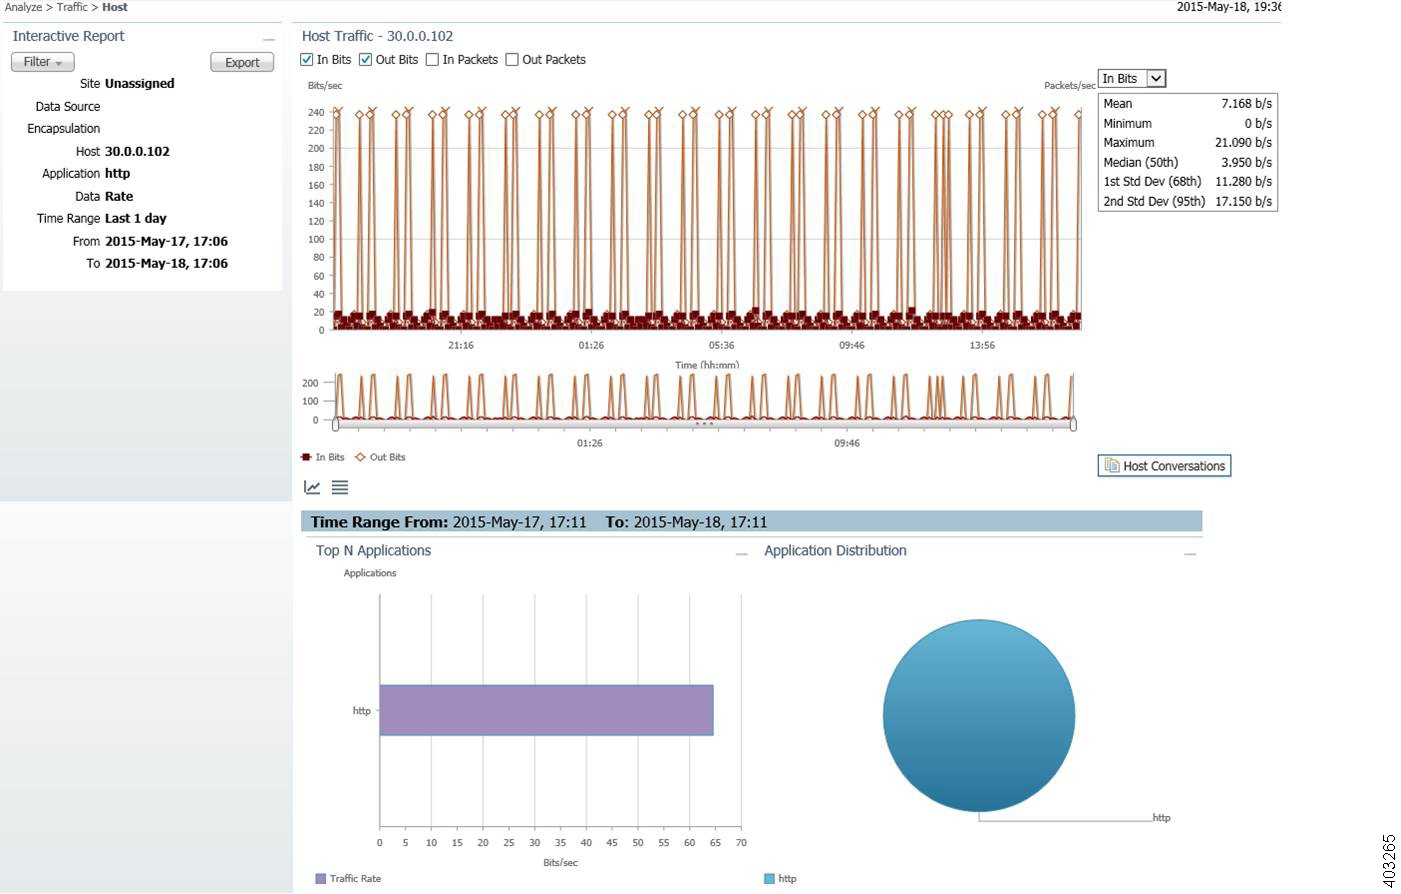
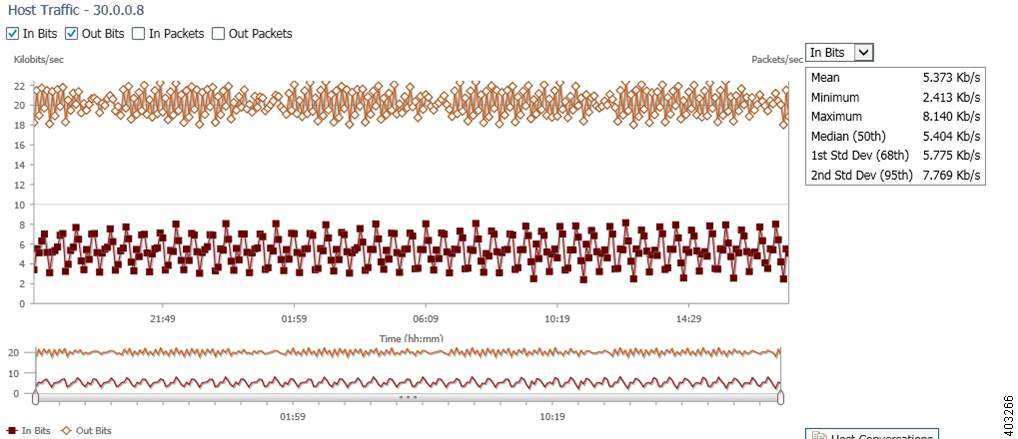
- Figure 6-5 displays host traffic for the last day, and using the middle graph you can zoom down to the required time range to view what other application this host is using.
Figure 6-5 Host Traffic for Last 1 Day
In the following deployment scenario, you will predict the capacity needed for a new branch build out due in six months by studying the usage of an existing branch office of a similar size. To deploy a NAM located in the branch router (ISR) of the existing branch:
Step 1 Start capturing traffic rates between the branch and the data center. View the traffic for the last month from Interactive Report > Filter > Time Range > Custom (enter a date covering a month).
Step 2 Open a conversation report from today and find a stream that has a mildly increasing trend but is unable to confirm the rate at which it is increasing (see Figure 6-6).
Figure 6-6 A Stream with a Mildly Increasing Trend
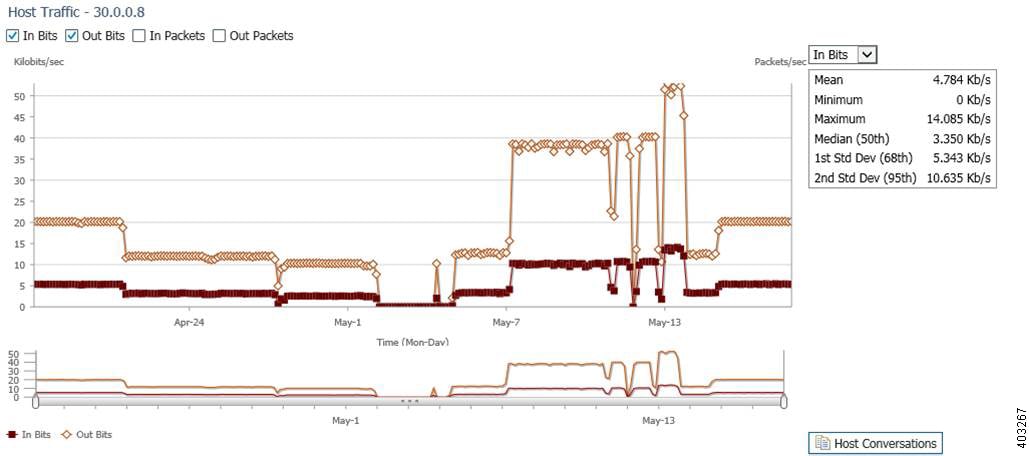
Step 3 Change the Time Range dynamically in the Interactive Report to study the trend with a granularity of one month. You may find that the pattern does show periodic increases (see Figure 6-7). You are then able to conclude that the ISP link needed at the new site would be similar, and so a standard T1 line would be more than sufficient for the needs of the new remote office.
Figure 6-7 The Trend Shown with a Granularity of 1 Month
Studying historical trends is a valuable exercise in planning and creating baselines in a network. Monitor and trend on business critical applications and servers. These trends should provide handy information in a variety of day-to-day decisions.
Using NAM to Evaluate Application-Level Performance Monitoring for TCP-Interactive Applications
Application Performance Response Time Analysis provides up to 45 metrics. You can configure thresholds based on many of these metrics, and receive an alert when the thresholds are passed. Thresholds should be set for critical applications or servers using Average Server Response Time, or Average Transaction Time, or Average Network Time and Average Server Network Time. These thresholds will help identify where the problem lies in the application performance, and show whether the problem is a server or network issue. Depending on the alarm, you can access the NAM to see the applications and clients accessing the server, or to check the devices in the traffic path monitoring device and interface utilization.
See Application Response Time.
See Defining Thresholds.
Using NAM to Evaluate Application-Level Performance Monitoring for UDP Real-Time Applications
The NAM monitors and analyzes RTP streams and voice calls statistics by intercepting the data collected by endpoints. So, when a phone call ends, the endpoints calculate the information and send it to the Unified Communications Manager (aka the Call Manager), the NAM collects the data (as log as it is along that path).
NAM uses the voice call statistics from the endpoint with the RTP stream to correlate the phone number with the IP address of the endpoint. Alerts are sent based on analysis of the RTP streams for MOS, Jitter, and Packet Loss.
To use NAM to monitor the application-level performance for UDP real-time applications:
Step 1 Set up thresholds to focus on which types of performance metrics you want to monitor at Setup > Alarms > Thresholds .
Step 2 View voice signaling/RTP traffic at Analyze > Media > RTP Streams or Analyze > Media > Voice Call Statistics .
See Analyzing Traffic, RTP Streams.
Troubleshooting
Using NAM for Problem Isolation
The alarm details (found in the Cisco Prime Network Analysis Module Software under Monitor > Overview > Alarm Summary ) provides information you can use to drill down on the threshold that was violated. You may also receive this alarm in e-mail ( Setup > Alarms > E-mail ). An example of the alarm is:
2013 SEPT 28 9:17:0:Application:Exceeded rising value(1000);packets;60653;Site(San Jose), Application)
After receiving this alarm, you can access the NAM GUI to view the application in your specific site to determine why there was a spike. Click on Analyze > Traffic > Application ; in the Interactive Report window on the left, change Site to “San Jose,” Application to “HTTP,” and Time Range to the range when the alert was received. This will display all the hosts using this protocol. You can see the Top hosts and verify there are no unauthorized hosts accessing this application. You can also access Analyze > Traffic > Host to view which conversations are chatty, and therefore causing the increase traffic for this application.
If the alarm is for an Application Response Time issue, you can access Monitor > Response Time Summary or Analyze > Response Time > Application to drill down on what hosts are accessing the application. Identify the application server and view what other applications are hosted and all the clients accessing that server.
See Monitor: Using Response Time Summary.
See Analyze: Measuring Response Time.
Using NAM for SmartGrid Visibility
The NAM will not recognize the IEC 60870 protocol out of the box (this is one of the main protocols used by power distribution companies). You will have to add a custom protocol, because it is a specific port you will be using. When you choose Setup > Classification > Application Configuration , you will see all hosts using that application. It will be identified as a Telnet application.
 Feedback