- Overview
- Getting Started
- Monitoring and Analyzing Traffic
- Capturing and Decoding Packets
- Performing User and System Administration
- Understanding NAM Deployment
- Customizing Cisco Prime NAM
- Understanding Prime NAM Traffic Sources
- Configuring NAM Security
- Understanding Prime NAM Behavior Reference
- GUI Field Descriptions
- Troubleshooting Network and NAM Issues
- How To Make Dashboards Work for You
- Troubleshooting Application Slowness
- Using Traffic Summary
- Using Response Time Summary
- Using Site Summary
- Using Alarm Summary
- Using Transaction Summary
- Analyzing Traffic
- Analyzing Site Traffic
- Analyzing Application Traffic
- Analyzing Host Traffic
- NetFlow Interface Traffic Analysis
- DSCP
- Encapsulation
- URL Hits
- Detailed Traffic Analysis Views
- Sites Detailed Views
- Site Conversations Detailed Views
- Applications Detailed Views
- Application Groups Detailed Views
- Application Traffic By Hosts Detailed Views
- Top Application Traffic Detailed Views
- Hosts Detailed Views
- Host Conversations Detailed Views
- Encapsulations Detailed Views
- DCSPs Detailed Views
- About Analyze Traffic Charts
- Measuring Response Time
- Application Response Time
- Network Response Time
- Server Response Time
- Client Response Time
- Client-Server Response Time
- Application Response Time Distribution
- Network Response Time Distribution
- Server Response Time Distribution
- Client Response Time Distribution
- Client-Server Response Time Distribution
- Server Application Responses
- Server Application Transactions
- Server Network Responses
- Client-Server Application Responses
- Client-Server Application Transactions
- Client-Server Network Responses
- Analyzing Device Interface and Health Data
- 802.1X/EAP Transaction Details
- ARP Transaction Details
- DHCP Transaction Details
- DNS Transaction Details
- FTP Transaction Details
- HTTP Transaction Details
- ICMP Transaction Details
- Kerberos Transaction Details
- LDAP Transaction Details
- RADIUS Transaction Details
- SMB Authentication Transaction Details
- Analyzing TLS Transaction Details
Monitoring and Analyzing Traffic
Cisco Prime Network Analysis Module provides several dashboards and tools to help you monitor and analyze your network traffic data. Prime NAM starts collecting data once it is up running and network data packets are sent to its data port(s). You can view the monitor dashboard, analyze traffic using various views, troubleshoot suspicious traffic using the capture tool, and decode capture sessions without any additional configuration on your part.
This provides information about monitoring your network traffic and analyzing the information presented.
This contains the following sections:
- How To Make Dashboards Work for You
- Troubleshooting Application Slowness
- Using Traffic Summary
- Using Response Time Summary
- Using Site Summary
- Using Alarm Summary
- Analyzing Traffic
- Measuring Response Time
- Analyzing Device Interface and Health Data
- Analyzing Media
- Using the NAM Application Programming Interface
If you want to customize Prime NAM to use more advanced configurations such as sites and filtering, see Customizing Cisco Prime NAM.
How To Make Dashboards Work for You
You can view traffic in a summary view (available from the Monitor menu) which you can then further analyze using the more in-depth analysis view (available from the Analyze menu).
The Monitor dashboards allow you to view graphic depictions of network traffic, application performance, site performance, alarms and transactions at a glance. From there, you can isolate one area, for example an application with response time issues, and then drill down to the Analyze dashboard for further investigation.
The following are some of the configuration tasks that enhance NAMs ability to provide more traffic details on dashboards:
- Turn on deep application classification to identify applications regardless of the ports on which the applications may be running. To enable deep packet inspection, see Adding More Detail into Dashboard and Application Reports. For example on how to troubleshoot using deep packet inspection, see Troubleshooting Application Slowness.
- To understand how to use filters to easily find information and significantly change what you view in the dashboards, see Filtering Traffic for Viewing on the Dashboards and Filtering Data Using Global Search.
- To make your custom application traffic more visible on the dashboards and reports, add HTTP URL or Server IP/Port definitions. See Creating Deeper Visibility Into Application Traffic
For more details about when or why to use specific dashboards, see How Do I Solve My Problem?.
How Do I Solve My Problem?
This section includes a table that provides various problems you can solve with specific dashboards, as well as what details you might want to know and what dashboards are associated with that data.
NAM detects and computes Mean Opinion Scores (MOSs) for VoIP calls transported through Real Time Protocol (RTP) streams. |
Using Site Summary see Top N Sites by Average MOS and RTP Streams |
|
Filtering Traffic for Viewing on the Dashboards and Filtering Data Using Global Search |
||
Use various filters to select what gets added in your captures. |
||
View Analyze > Managed Device > Interface to see list of all interfaces and errors or discards on each interface. |
||
I’m seeing a lot of unexpected or excessive applications traffic |
This may be tied to the occurrence of multiple Unknown applications (for example, video traffic). |
|
Your traffic visibility into your application can be improved by adding your custom application details so it can be classified. |
||
Troubleshooting Application Slowness
This section contains a sample workflow that describes one way to use Prime NAM to help troubleshoot common network slowness.
This example concentrates on how to troubleshoot application performance issues that stem from using common server applications (such as HTTP or Sharepoint).

Tip This case applies to any instance where an application latency is caused by a network delay.
NAM assumes that your system time is synchronized. If you do not have the time synchronized between the NAM and the standard time source outside the NAM, then you may see either incorrect data or no data. If you suspect inaccurate timestamps, you need to set up the System Time so that NAM data presentation is accurate. For instructions on how to set system time by choosing Administration > System > System Time , see Synchronizing Your System Time.
To determine what may be causing network slowness for the remote desktop users:
Step 1 To see Layer 7 application details, ensure deep packet inspection is enabled. This is the system default on new installations. To confirm this setting, choose Setup > Classification > Applications Settings and ensure that the Deep Packet Inspection check box is selected. For more information, see Adding More Detail into Dashboard and Application Reports.
Step 2 Choose Analyze > Traffic > Application in order to find the network devices that use a specific protocol or application.
a. In the Interactive Report Filter select the name of your application (for example, Sharepoint) as the Application option in order to collect network traffic details for that application only. If you do not see your application, you may need to download the latest protocol pack.
b. You can also customize the time range to ensure that your data collection provides enough data or focuses on specific points of time that have heavy traffic.
If you do not see any data, select a different time range in the filter and submit the search again in order to locate the surge traffic.
Step 3 Use the zoom/pan chart slider at the bottom of the Application Traffic chart in order to focus in on those details that are most important to you.
Focus on the traffic surges in the chart in order to identify the participating servers and the remote clients.
Step 4 Use the Top Hosts Traffic In and Out charts in order to drill down for more bandwidth details.
a. Select the server with the most traffic and review the maximum and average bandwidth used by your application in order to pinpoint the source of the issue.
For the select server, assess the amount of traffic in order to view:
– Conversations by individual users
Step 5 Assess if there is enough capacity on the link connecting the site to the data center in order to determine if this might be part of the problem. Since this is out of this product’s scope, we recommend you use other applications to perform this task.
Step 6 If your network capacity is limited, for example, a 256 Kbps link shared across multiple applications and there is a requirement to support multiple clients, consider the following options:
Using Traffic Summary
The Traffic Summary Dashboard allows you to view the Top N Applications, Top N Application Groups, Top N Hosts (In and Out), IP Distribution, Top N DSCP, and Top N Encapsulations being monitored on your network. It provides automatic monitoring of traffic from all potential data sources (for example, SPAN and NetFlow). You can get to the Traffic Summary Dashboard by going to Monitor > Overview > Traffic Summary .
You can use the Interactive Report on the left to filter the information for a particular Site, Data Source, encapsulations, or reporting time distribution. You can specify just one type of criteria and leave the others blank, or specify all of them. You can also choose to view the rate or cumulative data from the Interactive Report. To set a system preference for bytes instead of bits, go to Administration > System > Preferences .

Note If data sources have been aggregated into one source on the Setup > Traffic > NAM Data Sources page, you will want to select the first aggregated source entry as the Data Source filter.
When you log into Prime NAM for the first time, the default view will be the Traffic Summary dashboard, and the top data source is selected by default.
Table 3-1 provides an at-a-glance summary of the Traffic Summary dashboard. For each chart described below, you can left-click on any colored bar to get to a context menu, with which you can get more detailed information about that item. You can also place your cursor over the colored bar to see the number of bits per second collected or the total bits over the last time interval. To toggle your view from chart to table, select the icon under the table.
View top application traffic rate or traffic volume, based on the Interactive Report filter selection (data rate or cumulative, respectively) |
This chart reports application-level (L7 payload) bits. If you left-click on a colored bar and choose Capture from the context menu, you can start a capture on this data (see Capturing and Decoding Packets for more information). You can also select other options to view various application traffic details. See Analyzing Application Traffic. |
|
In the Interactive Report, you can select either rate or volume , where rate is the bits per second, and cumulative is the total number of bits. |
||
To get more specific details about the host activity, left-click on the colored bar and make a selection. If you left-click on a colored bar, you can select additional options for host activity data. See Analyzing Host Traffic. |
||
Shows the percentages of bits being distributed to different IP protocols (for example, IPv4 TCP). |
||
For more detail, hover over the colored bar or left-click to select Details option. See DSCP |
||
In the Interactive Report, you can select a Data Source and filter specific encapsulation protocols from within this chart (including OTV, VxLAN, LISP, and others). You can also narrow your data by filtering on certain time ranges. The default time range is 15 minutes. See Encapsulation. |
Tip To change from bits to bytes, choose Administration > System > Preferences and change the Data displayed in selection.
To see a chart in table format, use the Show Chart/Show Table toggle buttons on the bottom left corner of the chart.
When viewing the data as a Grid, the numbers are formatted according to what you have configured in Administration > System > Preferences . On that page, you can also configure the number of Top N entries you would like to display.
Using Response Time Summary
The NAM software provides response time measurements and various user-experience-related metrics, which are computed by monitoring and time-stamping packets sent from the user to the server providing services. These Application Response Time Metrics are available to view under the Response Time Summary Dashboard ( Monitor > Overview > Response Time Summary ).
After the NAM is started, these metrics will begin to populate automatically. When you first navigate to Response Time Summary dashboard, the top data source is selected by default. This dashboard shows you performance statistics for site, data source, encapsulation, and a specific amount of time.
Use the Interactive Report window on the left side of the window to change the parameters for the information displayed. To see a chart in table format, use the Show Chart / Show Table toggle button on the bottom right corner of the chart.
The dashboard charts will show you the following information:
This chart displays the server response times for the applications in the site, data traffic source, VLAN, or site clients or servers you selected in the Interactive Report window. For example, selecting http would show you the average response time of HTTP servers seen in the traffic category you have selected in the Interactive Report window. The data displays in microseconds (μ), milliseconds, or seconds depending on your preference settings.
This chart displays the top network time between the client site and the server site in the category you selected. The data displays in microseconds (μ), milliseconds, or seconds depending on your preference settings.
This chart allows you to see how well servers perform, by showing you the server that has the longest response time (the item appearing at the top). The data displays in microseconds.
This chart displays the total bits or rate of traffic for the top servers. You can choose to display NAM data in either Bits or Bytes in the Preferences (accessed by choosing Administration > System > Preferences ).
This chart displays the transaction time per client. The client with the highest response time appears on top. The data displays in microseconds (μ), milliseconds, or seconds depending on your preference settings.
This chart displays the total bits or rate of traffic for the top clients.
Using Site Summary
The Site Summary Dashboard (accessed by choosing Monitor > Overview > Site Summary ) shows you information about the sites in your network. You can use the Interactive Report on the left side of the window to change the information displayed. For more information about sites, see Configuring Sites.
The charts displayed on the Site Summary dashboard are:
This chart shows the average transaction time by site.
This chart shows top site to site traffic.
This chart shows sites that have the highest average Mean Opinion Score (MOS).
MOS normally ranges from 1-5, denoting the perceived quality of the transmission, where 1 is the lowest perceived quality, and 5 is the highest perceived quality measurement. The MOS is weighted depending on the duration.
This chart shows the sites that have the most traffic (which are the most active). It is a total of all the traffic sent or received for hosts that belong to the particular site, which means that this traffic includes intra-site traffic as well.
To see any of the charts in table format, use the Show Chart / Show Table toggle button on the bottom left corner of the chart.
Using Alarm Summary
The Alarm Summary Dashboard (accessed by choosing Monitor > Overview > Alarm Summary ) will show you the top alarms occurring in the network.
To display network traffic information for a particular amount of time, use the Interactive Report on the left side of the window. The Severity Selector in the Interactive Report allows you to choose to view high severity alarms only, low severity alarms only, or both high and low severity alarms (these settings are configured under Setup > Alarms > Thresholds ). You can also choose the desired amount of time from the Time Range drop-down menu, or you can customize the time range.
On any chart on the Alarm Summary Dashboard, you can click on a colored bar to see the Context menu, with which you can get more information.
If you do not set any alarms or thresholds, the Alarm Summary Dashboard will not display any data. For information on setting up alarms and thresholds, see Setting Up Alarms and Alarm Thresholds.
You could see a count of two alarms for the same occurrence if:
- both the source and the destination are in the same site in the Top N Site - Host Pair chart.
- both the source and the destination are in the same site in the Top N Site chart.
- both the source and the destination are in the same site using the same application in the Top N Site - Application Pair chart.
Note You will not have any data in Top N Site - Application and Top N Application if there is no threshold configured that involves an application (for example: Response Time threshold or Application threshold).
NetFlow Interface alarms are not related to any site; therefore, they will not appear on the four colored site alarm charts on the Alarm Summary dashboard. Instead, the New Alarms Raised and Last 50 Alarms tables at the bottom of this window will contain NetFlow Interface alarms raised.
The five charts displayed on the Alarm Summary dashboard are:
This chart lists the top sites that have the most alarm triggers during the selected time range. The number of sites displayed is based on the maximum number you set in preferences. If no thresholds are configured, this chart contains no data. The number on the bottom of the chart is the alarm count.
You can configure thresholds under Setup > Alarms > Thresholds . You can configure the Top N entries under Administration > System > Preferences .
This chart shows the number of alarm messages during the selected time range that are triggered for Hosts across all sites, by the Site - Host Pair.
This chart shows the number of alarms during the selected time range for Applications across all sites.
This chart shows the most alarm triggers during the selected time range by the application and site pair.
The New Alarms Raised table shows you all alarms that occurred during the interval selected in the Interactive Report window. Some alarms may have been triggered outside of the time period, but may still be occurring.
The Last 50 Alarms table shows you the alarms that occurred during the interval selected in the Interactive Report window. Some alarms may have been triggered outside of the time period, but may still be occurring. See Table D-48 .
Click All Alarms to display a separate window, which shows all the alarms from that particular time interval.
You can also use the Filter button, both in this window and the All Alarms window, to display only alarms that meet the criteria you enter.
Utilizing Sites to Create a Geographically- or Organizationally-Familiar Deployment
In Prime NAM you can define a site, which enables you to aggregate and organize performance statistics. If you want to limit the view of your network analysis data to a specific city, a specific building, or even a specific floor of a building, you can use the sites function.
Figure 3-1 shows a centralized NAM deployment analyzing multiple data sources from different locations in the network.
Figure 3-1 Site Level Aggregation
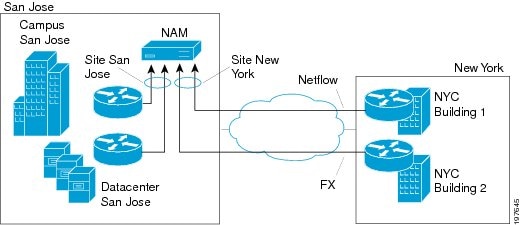
For this deployment, multiple sites can be created such as SanJose-Campus, SanJose-Datacenter, and NewYork-NetFlow-Bldg1. The data that does not match the site configuration will be displayed in the Default site called Unassigned site. This helps to isolate the view and information for monitoring and troubleshooting so you can drill down to the specific area of interest.
You can also include multiple types of data sources in the site definition, and you can then get an aggregated view of all network traffic.
The predefined Unassigned Site makes it easy to bring up a NAM without having to configure user-defined sites. Hosts that do not belong to any user-defined site will automatically belong to the Unassigned Site.
You can create, view, or edit your sites by selecting Setup > Network > Sites . Unassigned sites cannot be changed.
The interactive dashboard can be used to drill down into either San Jose or New York sites to see Top applications, hosts, Encapsulations, DSCP, and application response time.
From each of the charts in the dashboard, you can access the context menu to further drill down to analyze data such as detailed application, host, and conversation traffic.
Using Transaction Summary
The Transaction Summary Dashboard, accessible from the Monitor / Overview / Transaction Summary page, allows you to monitor and analyze the following protocol transactions:
This dashboard page shows high level data on the protocols transactions in either a pie chart view (default) or a table view. You can toggle between the two views by selecting either the Show Chart or the Show Table button on the bottom left of each protocol box.
The Analyze / Transaction / * dashboard pages show protocol transactions over time and the same high-level pie chart or table view as shown on the Transaction Summary page. For more details, see the subsections of the Analyzing Transactions section below.
Detailed Views pages show the protocol transactions at the most detailed level. You can access this page by selecting the Details button for each protocol displayed on the Monitor / Overview / Transaction Summary page or on any of the Analyze / Transaction / * dashboard pages.
Analyzing Traffic
Prime NAM offers many ways to analyze your network traffic data using graphs, charts, and detailed views.
Use the links below to locate information about:
- Analyzing Site Traffic
- Analyzing Application Traffic
- Analyzing Host Traffic
- NetFlow Interface Traffic Analysis
- DSCP
- Encapsulation
- URL Hits
- Detailed Traffic Analysis Views
- About Analyze Traffic Charts
Analyzing Site Traffic
To show you the traffic level for a given site over a selected period of time:
Step 1 Choose Analyze > Traffic > Site .
Step 2 To change the data to see the top application traffic coming into a specific site, out of a specific site, or all traffic within, coming in and moving out of that site, use the traffic selector buttons.
Step 3 To see site conversations about the conversation between sites to pinpoint specific applications or sites, select the Site Conversations button and choose filters from the Interactive Report to further pinpoint an application, data source, or time frame in question.
Step 4 To view top applications transmitting and receiving traffic for the selected time period and drill down to collect more data utilizing capture data, real-time graphs, and application group detail), left click the Top N Application dashboard.
Step 5 To see the criteria by which the NAM classifies the amount of application traffic on this site over this period of time, use the view Application Distribution graph. Hover over graph parts to view detailed information on speed and percentages or left-click a graph element for other menu options.
Analyzing Application Traffic
To show you the traffic level for a given application over a selected period of time:
Step 1 Choose Analyze > Traffic > Application .
Step 2 To see data for a different time interval (when
No data for select time interval displays
), click
Filter
on the Interactive Report, and expand the time range to allow more data to be viewed.
Step 3 To focus in on a spike or area of interest, use the slider under the Application Traffic graph. Hover over the data points to see specific traffic details.
Step 4 To see top application traffic details, click Top Application Traffic and choose filters from the Interactive Report to further pinpoint a data source, encapsulation method, or time frame in question.
Step 5 To view top hosts transmitting and receiving traffic for the selected time period and drill down to collect more data utilizing capture data, real-time graphs, and application group detail), left-click a Top N Hosts graph element and select a specific task.
Step 6 For example, select Hosts Detail to see the All Hosts window and the detailed information about all hosts. Table D-46 describes the fields in this window.
Step 7 To show the criteria by which the NAM classifies packets as that application, select one of the options under the Application Configuration. This is typically a list of TCP and/or UDP ports that identify the application. Some applications are identified by heuristic or other state-based algorithms. You can select Configure Application to configure specific applications in your network. For detailed instructions, see Creating Deeper Visibility Into Application Traffic.
Analyzing Host Traffic
The Host Traffic Analysis window will show you at a quick glance the input and output of a particular host over a specified time range. It is available under the menu option Analyze > Traffic > Host . It will show you:
Applications Detail
On the Top N Applications chart, you can left-click a colored bar to get the context menu, and choose Applications Detail to see the All Applications window and the detailed information about all applications. You can also choose Analyze Host Traffic from the context menu to see the host dashboard and analyze the host traffic for the selected application using Over Time chart. Table D-39 describes the fields in the Applications Detail window.
NetFlow Interface Traffic Analysis
To view data collected for individual interfaces on a switch or router that is exporting NetFlow packets to the NAM, use the NetFlow Interface Analysis page. The displayed information represents the total data collected since the collection was created, or since the NAM was restarted.
1. Ensure Auto-create is enabled for the NetFlow Data Export (NDE) data source. Once NDE data is sent to the NAM, an NDE data source is created.
2. Edit the NDE data source to enter SNMP credential information that allows the NAM to properly query the router/switch interface information. Go to Setup > Traffic > NAM Data Sources. For more information, see Creating NetFlow Data Sources Using the Web GUI or Creating NetFlow Data Sources Using the CLI
3. Go to NetFlow Interface Capacity page ( Setup > Network > NDE Interface Capacity ) to ensure all information is populated.
To view NetFlow Interface Analysis:
Step 1 Choose Analyze > Traffic > NDE Interface . The default view is Interface View.
Step 2 Select an interface from the Interface Selector to see traffic in the charts. Click the arrow icon to the left of the NetFlow data source name to display all interfaces, and then select an interface to see data for that interface.
When you go to the Group View tab, you see all interfaces and NetFlow data sources grouped into two static groups. You can select combinations of interfaces from each group and click Submit , and the charts on the right will sum up the metrics and display them for each group.
Note If the charts show no data, and you see a message “Interface needs to be selected,” you have not yet chosen an interface.
NetFlow flow record must include source/destination addresses, source destination ports, protocol, input and output SNMP interface if-indices, octet count, and packet count. NAM discards flow records that do not meet this requirement.
NetFlow only takes into account of IP and its payload. Anything that is before the IP layer will not be counted toward the packet and octet count.
Once you have chosen the interface, you will see the following charts populated:
- Interface Traffic (Ingress % Utilization and Egress % Utilization)
- Top N Applications - Ingress
- Top N Applications - Egress
- Top N Hosts - Ingress
- Top N Hosts - Egress
- Top N DSCP Aggr - Ingress
- Top N DSCP Aggr - Egress
The interface speed can be entered manually through the Interface capacity table, or it can be auto configured if the SNMP settings for the NetFlow device are entered in data source table.
DSCP Detail
On the Top N DSCP Aggr - Ingress and Top N DSCP Aggr - Egress chart, left-click a colored bar to get the context menu. Choose DSCP Detail to see the All DSCP window. You can also get to this window by choosing Analyze > Traffic > DSCP Traffic from the menu and clicking the All DSCPs button on the right.
Table D-45 describes the fields in the All DSCP window.
DSCP
Differentiated services monitoring (DiffServ) is designed to monitor the network traffic usage of differentiated services code point (DSCP) values.
To monitor DSCP groups, you must configure at least one aggregation profile and one or more aggregation groups associated with each profile. For more information on configuring an aggregation profile, see Configuring DSCP Groups.
You can monitor the DSCP information by going to Analyze > Traffic > DSCP . The data provided to you includes:
Encapsulation
You can analyze the encapsulation traffic collected by Prime NAM (for setup, see Filtering Encapsulations). This section contains the following use cases:
- Viewing Collected Encapsulation Data—see Viewing Collected URLs
- Filtering Various Encapsulations—see Filtering a URL Collection List
URL Hits
You can analyze the URLs collected by the NAM (for setup, see Configuring URL Collections).
The URL hits helps you to determine the URLs that are used in the network and then see what applications are affiliated with those URLs.
Viewing Collected URLs
To view collected URLs and optionally create URL-based custom applications,follow these steps:
Step 1 Choose Analyze > Traffic > URL Hits .
The URL Hits Window displays the collected URLs.
Note Only one URL collection can be active at one time. The data source is for information only.
Step 2 To create a URL-based custom application, click Create URL-Based Application.
For details on the URL-Based Applications window, see Table D-30 .
Filtering a URL Collection List
To filter a URL collection list:
Step 1 From the drop-down list in the URLs Window ( Analyze > Traffic > URL Hits) , choose which part of the URL to filter:
Step 3 Click Filter to apply the filter.
Note To remove any display filter and show all URLs collected, click Clear.
Detailed Traffic Analysis Views
Prime NAM offers several detailed traffic analysis views which allow you to analyze the following data:
- Sites Detailed Views
- Site Conversations Detailed Views
- Applications Detailed Views
- Application Groups Detailed Views
- Application Traffic By Hosts Detailed Views
- Top Application Traffic Detailed Views
- Hosts Detailed Views
- Host Conversations Detailed Views
- Encapsulations Detailed Views
- DCSPs Detailed Views
Sites Detailed Views
Displays data for each site (including all unassigned sites) and see packet per second and bits per second details. Use the Interactive report filter to pinpoint specific attributes. There are no filter time limits for this data.
Site Conversations Detailed Views
Displays site traffic for all or selected sites. To pinpoint site traffic data between two devices, select the Interactive Report Filter.
Applications Detailed Views
To view the All Applications window and the detailed information about all application and filter on specific applications or other filter attributes, use the Interactive Report filter.
Application Groups Detailed Views
To see the All Application Groups window and the detailed information about all application groups, left-click a colored bar on the Top N Application Groups chart to get the context menu, and choose Applications Groups Detail . Table D-40 describes the fields in the All Applications window.
Application Traffic By Hosts Detailed Views
Shows the traffic for a given application broken out by individual hosts using the application. You may specify the time period to view, as well as the application, site (optional), data source (optional), and VLAN (optional).
The NAM only supports a maximum Time Range of one hour filter for the Host Conversations, RTP Streams, Voice Calls Statistics, Calls Table, and RTP Conversations.
Top Application Traffic Detailed Views
Shows the top applications by traffic rate over a selected time and for the specified site and/or data source.
Top Application Traffic Detailed Views shows you all of the applications that have been running for the time period interval. The color-coded legend shows you what the applications are running.
The Display Other check box (which is underneath the Top Application Traffic heading) corresponds to the data for the applications not in the N list. If you check this check box, the chart will display the Other data in addition to the data for the N number of applications.
If you place your cursor over any of the data points, you will get more details about the exact values for each of the applications that are running.
Hosts Detailed Views
Shows the input and output of a particular host over time. Use the Filter button in the Interactive Report (left side of the window) to change the parameters of the information displayed.
Host Conversations Detailed Views
Shows detailed lists of all the conversations for a particular host.
You can view the following data:
- A table of hosts that sends and receives packets to the selected host, along with application, encapsulation, and traffic rate information.
- A breakout of application usage for the selected host. You can view the application usage table, when you select the required host from the filter only.
- A Top N Application Traffic Stacked Chart for the selected hosts. The application usage table is replaced with this chart, when you select both the required and optional hosts from the filter.
Use the Filter button in the Interactive Report (left side of the window) to change the parameters of the information displayed.
The NAM only supports a maximum time range of one hour filter for the Host Conversations, RTP Streams, Voice Calls Statistics, Calls Table, and RTP Conversations.
Encapsulations Detailed Views
To show a detailed analysis of the various encapsulation layers, bits, and packet data, choose Analyze > Traffic > Detailed Vie ws > Encapsulations .
Use the Filter button in the Interactive Report to change the information displayed and target data.
DCSPs Detailed Views
The DSCP detailed views show a detailed analysis of all the network traffic usage of differentiated services code point (DSCP) values, choose Analyze > Traffic > Detailed Vie ws > DSCPs .
Use the Filter button in the Interactive Report to change the information displayed and target data.
For details about setting your TOS key and the implications of doing so, see Customizing System Preferences.
About Analyze Traffic Charts
The charts available under the Analyze menu show statistics that occur over time. You can use the Zoom/Pan feature, with which you can drag the beginning or end to change the time interval or distribution.
The time interval change on the zoom/pan chart will affect the data presented in the charts in the bottom of the window. The zoom/pan time interval also affects the drill down navigations; if the zoom/pan interval is modified, the context menu drill downs from that dashboard will use the zoom/pan time interval.
Note In a bar chart which you can zoom/pan, each block represents data collected during the previous interval (the time stamp displayed at the bottom of each block is the end of the time range). Therefore, you may have to drag the zoom/pan one block further than expected to get the desired data to populate in the charts in the bottom of the window.
Measuring Response Time
The NAM monitors TCP packet flow between client and server, and measures response time data to provide more visibility into application response times (ART) and network latency. Prime NAM response time monitoring provides end-to-end response times to help you locate possible network and application delays.
Note Cisco Prime Network Analysis Module software supports IPV4 and IPv6 for response time monitoring.
NAM application response time requires both way TCP connections. In general, it is best to SPAN the physical interface with BOTH direction. If VLAN is desired, use either RX or TX. See the SPAN source product documents for SPAN limitations.
You can set up the NAM to measure network time, client response time, server response time, and the total transaction time to improve application performance. Figure 3-2 shows the various points in network packet flow where the NAM gathers data and the trip times you can monitor. This is one example that represents only a subset of measurements.
Figure 3-2 NAM Application Response Time Measurements

Figure 3-3 shows a representation of total transaction time as opposed to application response time.
Figure 3-3 Transaction Time versus Response Time Measurements
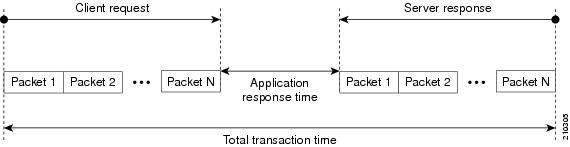
Table D-41 lists and describes the ART metrics measured by Cisco Prime Network Analysis Module.
Application Response Time Metrics are available on the response Response Time Summary Dashboard ( Monitor > Response Time Summary ), which allows you to see a summary view of the data.
To analyze Response Time data over time, use the following selections that fall under the Response Time window:
- Application Response Time
- Network Response Time
- Server Response Time
- Client Response Time
- Client-Server Response Time
To view the detailed lists for the response events, choose Analyze > Response Time > Detailed Views . This section covers the following topics:
- Application Response Time Distribution
- Network Response Time Distribution
- Server Response Time Distribution
- Client Response Time Distribution
- Client-Server Response Time Distribution
- Server Application Responses
- Server Application Transactions
- Server Network Responses
- Client-Server Application Responses
- Client-Server Application Transactions
- Client-Server Network Responses
Application Response Time
The Application Analysis window allows you to view the performance of a particular application over time. The ART can be accessed by choosing Analyze > Response Time > Application.
The Transaction Time chart shows you the average total transaction time for the application you have selected and contains the following three components:
The Other Metrics chart allows you to see information over time after you have selected the desired metrics from the Metric Group 1 and Metric Group 2 drop-down.
Next are the Top Clients and Top Servers charts. These show you the clients and servers with the most bits of traffic for the chosen application.
Note You can choose to display NAM data in either Bits or Bytes in Administration > System > Preferences.
Application Response Time Distribution bar chart shows the response of the chosen application for various time distribution range. To drill down for further response time distribution analysis, click Application Response Time Distribution from the context menu of the bar chart. The average total transaction time, top clients and servers for the selected distribution range is displayed.
Network Response Time
After you have selected a client site and a server site, the Network Response Time chart shows you the transaction time of the network link between the client site and server site. You can access the Network Response Time by choosing Analyze > Response Time > Network.
Note If you do not specify any application, the chart shows the network time instead of transaction time.
The Other Metrics chart allows you to see information about the network link between sites, after you have selected the desired metrics from the Metric Group 1 and Metric Group 2 drop-down.
The Top Clients and Top Servers charts show you the top clients and servers that are communicating through the network link (in bits or bytes).
The Network Response Time Distribution bar chart shows the response of the network link between the chosen client and server sites, for various time distribution range. To drill down for further response time distribution analysis, click Network Response Time Distribution from the context menu of the bar chart. The average total transaction time, top clients and servers for the selected distribution range is displayed.
Server Response Time
You can choose the Client Site and Server Site from the Interactive Report, and enter the IP address for the server that you want to analyze. The Total Transaction Time Composition chart displays the network time, server response time, data time, and the transaction time.
The Other Metrics chart allows you to see information about the server performance after you have selected the desired metrics from the Metric Group 1 and Metric Group 2 drop-down.
Top Client shows you top client talking to the server you have selected; Server Top Clients Sites shows the top client sites (traffic bits).
Note You can choose to display NAM data in either Bits or Bytes in Administration > System > Preferences.
The Server Response Time Distribution bar chart shows the response of the chosen server for various time distribution range. To drill down for further response time distribution analysis, click Server Response Time Distribution from the context menu of the bar chart. The average total transaction time, server’s top clients and server’s top client sites for the selected distribution range is displayed.
Client Response Time
You can analyze the transaction time of that client in the Total Transaction Time Composition chart, after entering the client IP address and application in the Interactive Report Filter.
The Other Metrics chart allows you to see client performance over time after you have selected the desired metrics from the Metric Group 1 and Metric Group 2 drop-down.
The Clients Top Applications chart show you the applications being used the most by the client selected, and the Top Servers chart show you the servers being used most by the client.
The Client Response Time Distribution bar chart shows the response of the chosen client for various time distribution range. To drill down for further response time distribution analysis, click Client Response Time Distribution from the context menu of the bar chart. The average total transaction time, client’s top applications and client’s top servers for the selected distribution range is displayed.
Client-Server Response Time
You can analyze the transaction times between the client and server you have selected in the chart, after entering the client IP address and application in the Interactive Report Filter.
The Other Metrics chart allows you to see Client-Server transaction information after you have selected the desired metrics from the Metric Group 1 and Metric Group 2 drop-down.
The Client-Server Response Time Distribution bar chart shows the response of the chosen client and server for various time distribution range. To drill down for further response time distribution analysis, click Client-Server Response Time Distribution from the context menu of the bar chart. The average total transaction time for the selected distribution range is displayed.
Application Response Time Distribution
You can choose Analyze > Response Time > Detailed Views > Application Response Time Distribution to display the Application Response Time Distribution window.
From the Interactive Report filter, select the application and the distribution range. The average total transaction time, top clients and servers for the selected distribution range is displayed.
Network Response Time Distribution
You can choose Analyze > Response Time > Detailed Views > Network Response Time Distribution to display the Network Response Time Distribution window .
From the Interactive Report filter, select the client site, server site and the distribution range. The average total transaction time, top clients and servers for the selected distribution range is displayed. This distribution helps you to identify the problematic transactions and the associated client and server.
Server Response Time Distribution
You can choose Analyze > Response Time > Detailed Views > Server Response Time Distribution to display the Server Response Time Distribution window.
In the Interactive Report filter, enter the IP address for the server that you want to analyze, and select the distribution range. The average total transaction time, server’s top clients and server’s top client sites for the selected distribution range is displayed.
Client Response Time Distribution
You can choose Analyze > Response Time > Detailed Views > Client Response Time Distribution to display the Client Response Time Distribution window.
In the Interactive Report filter, enter the IP address for the client that you want to analyze, and select the distribution range. The average total transaction time, client’s top applications and client’s top servers for the selected distribution range is displayed.
Client-Server Response Time Distribution
You can choose Analyze > Response Time > Detailed Views > Client-Server Response Time Distribution to display the Client-Server Response Time Distribution window.
In the Interactive Report filter, enter the IP address of the client and server that you want to analyze, and select the distribution range. The average total transaction time for the selected distribution range is displayed.
Server Application Responses
You can choose Analyze > Response Time > Detailed Views > Server Application Responses to display the Server Application Responses window.
If you click on a row of data, you can then choose Response Time Details to see more information.
Table D-49 provides definitions of each field of the Server Application Responses window.
Server Application Transactions
You can choose Analyze > Response Time > Detailed Views > Server Application Transactions to display the Server Application Transaction window.
The Server Application Transactions window provides a summary of the server application transaction response times (ART) per server application displaying the server IP address, application used, and minimum, average, and maximum response times for the following:
Note NAM uses the TCP three-way handshake to calculate network delay. If there are no new TCP connections during the polling interval, the NAM GUI displays a dash (-) for the delay value indicating there is no delay data for that interval.
Table D-50 provides definitions of each field of the Server Application Transactions window.
Server Network Responses
You can choose Analyze > Response Time > Detailed Views > Server Network Responses to display the Server Network Responses window. The Server Network Responses window shows the network connectivity and responsiveness between the server and the switch.
Note NAM uses the TCP three-way handshake to calculate network delay. If there are no new TCP connections during the polling interval, the NAM GUI displays a dash (-) for the delay value indicating there is no delay data for that interval.
Table D-51 provides definitions of each field of the Server Network Response Times window.
Client-Server Application Responses
To view the Client-Server Application Responses window, choose Analyze > Response Time > Detailed Views > Client-Server Application Responses .
The Client-Server Application Responses window displays. Table D-42 provides definitions of each field of the Client-Server Application Responses window.
Note NAM uses the TCP three-way handshake to calculate network delay. If there are no new TCP connections during the polling interval, the NAM GUI displays a dash (-) for the delay value indicating there is no delay data for that interval.
Client-Server Application Transactions
The Client-Server Application Transactions window provides a summary of the server application transaction response times (ART) per server application displaying the server IP address, application used, and minimum, average, and maximum response times for the following:
Note NAM uses the TCP three-way handshake to calculate network delay. If there are no new TCP connections during the polling interval, the NAM GUI displays a dash (-) for the delay value indicating there is no delay data for that interval.
The Client-Server Application Transaction window displays when you click Analyze > Response Time > Detailed Views > Client-Server Application Transactions . You can also view the TopN Chart to view the most active network.
Table D-43 provides definitions of each field of the Client-Server Application Transactions window.
Client-Server Network Responses
The Client-Server Network Responses window shows information about network connectivity (also known as network flight time) between servers and clients.
To view the Client-Server Network Responses window, choose Analyze > Response Time > Detailed Views > Client-Server Network Responses .
NAM uses the TCP three-way handshake to calculate network delay. If there are no new TCP connections during the polling interval, the NAM GUI displays a dash (-) for the delay value indicating there is no delay data for that interval.
Table D-44 describes the fields of the Server-Client Network Response Time window.
Analyzing Device Interface and Health Data
You can view interface information and system health data using the Analyze > Managed Device window. The menu selections for analyzing Managed Devices are:
Viewing Interface Information
You can view the following interface information:
To view the packet distribution details on the interfaces, choose Analyze > Managed Device > Interface . The Interfaces Stats table displays and shows the total packet distribution on all interfaces. Depending on the interface chosen, the chart below the Interfaces Stats table refreshes with that information.
Use the Interactive Report and the Filter button on the left to change the time range displayed.
The Discards and Errors are measured in packets per second. When you select a VDC below the Interactive Report, the main interface screen will be updated with interfaces that belong to the VDC. When NAM is not in RISE environment, the VDC selector will not be displayed.
Interface Statistics Over Time
When you select an interface in the Interface Statistics Table, the statistics for that interface updates in the graph below the Interface Statistics Table.
You can check the check boxes for the information you would like to display in the graph:
- Bits: In Bits, Out Bits
- Packets: In Packets (inUcastPkts + inNUcastPkts), Out Packets (outUcastPkts + outNUcastPkts)
- Discards: In Discards, Out Discards
- Errors: In Errors, Out Errors
Note You can choose to display NAM data in either Bits or Bytes in Administration > System > Preferences.
Viewing Health Data
You can use the NAM to view system health data of the connected switch or router. To view system health data collected for the switch or router, choose Analyze > Managed Device > Health from the menu.
For more details on the options available in each windows, see:
Note The Viewing Health Data section applies to all NAM platforms except the NAM-NX1 and NAM in RISE environment.
Switch Health Options
For a switch, the Health window is displayed with a drop-down menu that provides the following options:
Chassis Health
The Chassis Health window displays two real-time graphs:
The Health window also displays a matrix with the following information:
Chassis Information
describes the Chassis Information window. Table 3-3
Crossbar Switching Fabric
Table 3-4 describes the Crossbar Switching Fabric information.
Ternary Content Addressable Memory Information
Shows the Ternary Content Addressable Memory (TCAM) usage information. Table 3-5 lists and describes the TCAM information.
Router Health Options
If your device is a router, the Router Health window displays with a drop-down box that provides the following options:
Router Health
The Router Health window displays a real-time graph and information about the health of a router. Table 3-6 describes the contents of the Router Health window.
Router Information
The Router Information window displays router information. Table 3-7 lists and describes the fields of the Router Information window.
Analyzing Media
The Analyzing Media contains the following sections:
- RTP Streams
- Voice Call Statistics
- Video Streams
- Video Channels Statistics
- Calls Table
- RTP Conversation
- Site MOS
- Video Channels Table
- Video Stream Conversations
Understanding the RTP Stream Data
To view RTP stream information, summary statistics on the stream, and per-interval statistics, use the RTP Streams.
This window shows you three pieces of information:
- Source IP Address and Port: IP address and UDP port of the originator of the RTP stream.
- Destination IP Address and Port: IP address and UDP port of the receiver of the RTP stream.
- SSRC: Synchronization source number as it appeared in the RTP header of the RTP stream.
- codec: encoding decoding format of the RTP stream.
The summary includes the information about the RTP stream for the entire duration of RTP stream.
- Duration: duration of the RTP stream. This may not be the entire duration of the stream. It depends on the viewing time interval of the window which launched this RTP stream detail window.
- Worst / Duration Weighted / Max MOS: the lowest score among per-interval reports, the score of all per-interval reports that takes duration into account, and the highest score among per-interval reports of the stream.
Note Duration-weighted is calculated with the following formula:
SUM (per-minute-mos * duration) / SUM (duration)
- Worst / Duration Weighted / Min Jitter: the largest jitter among per-interval reports, the jitter that takes into account of the duration of all per-interval reports, and the smallest jitter values among per-interval reports of the stream.
Note Duration-weighted are used with the following formula:
SUM (per-interval-jitter * duration) / SUM (duration)
- Worst / Overall / Min Actual Packet Loss: Loss percent of RTP packets that are not seen by NAM and RTP packets that arrived beyond the buffer capability of the receiving endpoint. This includes the highest percentile among per-interval reports, the sum of packets loss against total packets of all per-interval reports, and the lowest percentile loss among per-interval reports.
- Worst / Overall / Min Actual Packet Loss: Similar to above, but the percent loss only includes RTP packets that were not seen by the NAM.
- Worst / Total / Min Concealment Seconds: Number of seconds in which NAM detected packet loss during the duration of the stream. This includes lowest concealment seconds among per-interval reports, total concealment seconds of the entire duration of the stream, and highest concealment seconds among per-minute stream reports.
- Severe Concealment Seconds: Similar to above; severe condition is met when the seconds have more than 5 percent loss.
This table shows the per-interval stats calculated by NAM at each interval. The columns of the tables are:
- Report Time: time when the stats were calculated. This is the end time of the interval.
- Report Duration: the stream duration during the report interval.
- Worst MOS: the lowest score of the stream among 3-second MOS score. NAM internally evaluates the MOS value of the stream every 3 seconds. This is the lowest score among them.
- Average MOS: average score of the 3-second score values during the duration of the stream in the interval. This value is used in deriving the Duration Weighted MOS value in NAM.
- Jitter: variation of packet arrival time compare to the expected time.
- Actual Packet Loss percentile: percentile of packets that are not seen by NAM.
- Adjusted Packet Loss percentile: percentile of packets that include the actual packets lost an packets that had arrived too late to get into buffer prior to paying back at the endpoint.
- Concealment Seconds: number of seconds in which the NAM sees packet loss.
- Severe Concealment Seconds: number of seconds in which the NAM detected more 5 percent of packet loss.
- Packets: total packets NAM have seen for the interval.
Monitoring RTP Streams
Use Prime NAM to monitor the network to ensure that call quality is good. If quality issues appear, isolate and troubleshoot the problem rapidly.
Step 1 View RTP Streams using the menu selection Analyze > Media . You can access this from the RTP Conversation table by clicking on a specific stream or from the Call Detail window by clicking on the stream that is associated with the call.
This chart indicates current voice quality of all RTP streams being monitored. MOS values range from 1 to 5, where 1 is poor and 5 is excellent (see the legend for a breakdown into categories-Poor, Fair, Good and Excellent). Use the Top N RTP Streams source and destination endpoints to view whether there are calls that are in the poor range.
Step 2 To isolate calls that have had a poor MOS, scroll down to Top N RTP Streams and click on the chart to drill down into the RTP Stream Details. Note that MOS values for calls below 3.0 might be considered low. You can also look at the other metrics provided in the same row (for example, row one. note the jitter and packet loss rate scores to see if they also result in a low MOS value. This information can help you determine if jitter is the root cause of the poor calls; or if it is instead packet loss somewhere in the network.
Step 3 With the endpoints’ IP addresses, you can look at the network topology to identify where in the network your subnet is located.
Navigate to that NAM and go to the menu selection Analyze > Managed Device > Interface . This page lists all interfaces and errors or discards on each interface. Look up the link that leaves the site in question. That interface is likely the source of the packet loss. Check the interface for faults and fix as needed.
To monitor the RTP streams, choose Analyze > Media > RTP Streams . You can also arrive at this page by:
- From the RTP Conversation table, clicking on a specific stream
- From the Call Detail window, clicking on the stream that is associated with the call
In this window, at least one of the following is required: Site or data source.
The five charts available in this window are:
- RTP Streams : Number of streams that fall in the quality bands of excellent, good, fair, and poor during the selected interval.
- Top N Source Endpoints : Endpoints that generated the lowest duration weighted MOS during the selected interval.
- Top N Destination Endpoints : Endpoints that experienced the lowest duration weighted MOS during the selected interval.
- Top N RTP streams : RTP streams that have the lowest duration weighted MOS during the selected interval.
- Top N RTP streams by Adjusted Packet Loss : RTP streams that have the highest overall adjusted packet loss percent during the selected interval.
Note The RTP analysis feature is not available for network traffic sent to a NAM’s management port via ERSPAN. If ERSPAN traffic is to be sent to NAM, please send to the NAM’s data port(s). You can configure an IP address on each data port to directly receive ERSPAN packets, or you can configure an IP address on the switch port that connects to the NAM’s data port. It is recommended to use the latter.
Voice Call Statistics
To monitor voice quality, choose Analyze > Media > Voice Call Statistics . The charts will provide an overview of voice quality.
- Voice Call Statistics : Number of calls per signaling protocol (SCCP, SIP, MGCP, and H.323) at each interval during the selected interval.
- Top N End Points by Jitter (ms) : Endpoints that have the largest average of endpoint reported jitter during the selected interval.
- Top N End Points by Packet Loss (%) : Endpoints that have the largest average of endpoint reported packet loss during the selected interval.
- Top N Calls by Jitter (ms) : Calls that have the longest endpoint-reported jitter during the selected interval.
- Top N Calls by Packet Loss (%) : Calls that have the most endpoint reported packet loss percent during the selected interval.
Understanding the Video Stream Data
The Video Streams window allows you to view video stream information, summary statistics on the stream, and per-interval statistics. Currently, NAM monitors Video streams over RTP only.
The Video Streams window shows the following information depending on whether it is MPEG-TS stream:
Video Stream Information
Table 3-8 describes the Video Stream Information.
Media Delivery Index Details of Current Stream’s Carrier RTP
The Media Delivery Index (MDI) table displays the details of the MDI statistics at each interval. You can view this MDI table when the video stream is MPEG-TS stream only. Table 3-9 describes the MDI details.
Video Stream of Codec Stats Summary
Table 3-10 describes the codec stats summary of the video stream for the entire duration of the video stream.
Video Stream of Codec Stats Details
The Video Stream of Codec Stats Details show the per-interval stats calculated by NAM at each interval.
Table 3-11 describes the Codec Stats Details.
Monitoring Video Stream Data
To monitor the Video streams, choose Analyze > Media > Video Streams .
The following charts get displayed:
- Video Frames—Number of Video Streams that fall in the quality bands of excellent, good, fair and poor during the selected interval.
- Delay Factor (MDI)—Number of MDI streams whose DF falls in the corresponding quality bands during the selected interval.
- Media Loss Rate (MDI)—Number of MDI streams whose MLR falls in the corresponding quality bands during the selected interval.
- Top N Source End Points—Endpoints that generated the largest frame loss rate during the selected interval.
- Top N Destination End Points—Endpoints that experienced the largest frame loss rate during the selected interval.
- Top N MDI Streams by Delay Factor—MDI streams that have the largest delay factor during the selected interval.
- Top N MDI Streams by Media Loss Rate—MDI streams that have the largest MLR during the selected interval.
Video Channels Statistics
To monitor video quality, choose Analyze > Media > Video Channels Statistics. The Video Channels Statistics charts provide an overview of video channels set up by media control signaling protocols.
The Video Channel Statistics chart shows the number of video streams per signaling protocol (SCCP, SIP, MGCP, H.323, RTSP and IGMP) at each selected intervals. The chart also shows the number of streams setup per protocol per state (Active, Paused, New and Terminated).
Calls Table
The Calls Table shows you calls that the NAM detected by inspecting voice signaling protocols payload. For this table to have data, the NAM must see:
- SCCP protocol—Call Information message of the call.
- SIP protocol—SIP INVITE message of the call. Note that SIP protocol will be detected as per call leg.
- H.323 protocol—Call SETUP of the call.
- MGCP protocol—Create connection message of the call. Note that MGCP will be detected per call leg.
Note SIP and MGCP will be detected per call leg. Each call could be two or more parties. Each party has its own call leg from the call party to control entity; for example, Cisco Unified Communications Manager or MGCP gateway. Any information that is not detected by NAM will be displayed as “-” or blank.
To view the active calls, choose Analyze > Media > Detailed Views > Call Table . The Calls Table and RTP Streams for the Selected Call Table display. These tables show a list of all currently active calls.
Note Some values in the Calls table are not available until the end of the call, and Cisco Unified Communications Manager must be configured to have the IP phones send out the call status and quality information.
Note All calculated metrics in Table D-52, Calls Table, are based on a one minute interval.
Table D-52 provides descriptions of the Calls Table fields.
If you click on a call row in the table, in the RTP Streams for the Selected Call display at the bottom of the page you will see all streams that are associated with the call. It will display the RTP streams that:
- have source address and port matched the call’s calling host address and calling port or called host address and called port
- have destination address and port that matched the call’s calling host address and calling port or called address and called port
Note There is a delay of two minutes of RTP streams statistics. As the result, there may not be any RTP stream information of the call.
The RTP Streams of the Selected Call table shows the overall RTP streams statistics that are calculated by the NAM. You can use this information to compare the views of the call endpoints and the NAM regarding the call quality. The columns of the RTP Stream report are described in Table D-53 .
You can see more detailed information about each RTP stream by selecting the RTP stream and clicking on the RTP Stream Details button. A pop up window will show more detailed information of the stream displayed.
RTP Conversation
To get detailed information about RTP conversations, choose Analyze > Media > Detailed Views > RTP Conversations . This table shows you the overview of RTP streams analyzed by NAM during the selected interval. You can drill down to each stream to get stream statistics, which are analyzed by the NAM at each interval. To get more detailed information, you can:
- Click on the RTP stream for which you want to see more information.
- Click on the “RTP Stream Details” context menu. A pop up window will show you the detailed information of the stream.
The columns of the RTP Conversation tables are described in Table D-58 .
Site MOS
You can use the Mean Opinion Score (MOS) to quantify the perceived level of quality you are receiving in your network voice traffic. This allows you to assess the work of codecs, or algorithms, which compress audio traffic to save on bandwidth utilization but may result in a drop in quality.
You must first set up the software to monitor voice data, then you can view the collected voice data using Analyze > Media > Detailed Views > Site MOS.
Table D-32 contains details on Site MOS scores.
Video Channels Table
The Video Channels Table shows you video channels that are detected by inspecting media control signaling protocols payload. For this table to have data, the NAM must use the below protocols:
- SCCP protocol—Video channels setup by this protocol for a VoIP call with video channel.
- SIP protocol—Video channels setup by this protocol for a VoIP call with video channel.
- H.323 protocol—Video channels setup by this protocol for a VoIP call with video channel.
- MGCP protocol—Video channels setup by this protocol for a VoIP call with video channel.
- RTSP protocol—Video channels setup by RTSP session.
- IGMP protocol—Video channels joined by IGMP/MLD protocol join message.
The Video Channels table columns are described in Table D-54 . Table D-55 , Table D-56 , and Table D-57 .
To view the active video channels setup by media control sessions in network, choose Analyze > Media > Detailed Views > Video Channels Table . You can view the Video Signaling Channel List, Video Stream Conversations, Media Signaling Sessions and RTP Streams for the selected Media Signaling Session. These tables show a list of all currently active videos on the related network.
Note All calculated metrics including stream state in Video Channels Table are based on one minute interval.
If you click on a video channel row in the Video Signaling Channel List table, you will see the following tables:
- Video Stream Conversation Table—Displays the video streams that have destination address and destination port matching with the video channel’s destination address and destination port, along with video channel start and end time.
- Media Signaling Session Table—Displays the media controlling session to setup related video channel. Signaling protocol to setup this video channel should be supported on NAM.
- RTP Streams Table—Displays the RTP streams that have source address and port matching with the media control session’s calling/client host address and calling/client port or called/server host address and called/server port. Also, displays the destination address and port matching with the media control session’s calling/client host address and calling/client port or called/server address and called/server port.
Note There will be a delay of two minutes to display the RTP streams statistics. As a result, there will not be any RTP stream information for the video call.
The RTP streams of the Selected Call table shows the overall RTP streams statistics that are calculated by the NAM. If it is an VoIP call RTP stream, you can use this information to compare the views of the call endpoints to check the call quality. The columns of the RTP Stream report are described in Table D-53 .
You can see more detailed information about each RTP stream by selecting the RTP stream and clicking on the RTP Stream Details button.
Note Video channels setup by supported media controlling protocol will have codec which are not supported by NAM. Such video channels will not have any video conversation to display on NAM.
See section Video Stream Conversations for more details on video conversation.
Video Stream Conversations
To monitor the Video streams, choose Analyze > Media > Video Streams .
The following charts get displayed:
- Video Frames—Number of Video Streams that fall in the quality bands of excellent, good, fair and poor during the selected interval.
- Delay Factor (MDI)—Number of MDI streams whose DF falls in the corresponding quality bands during the selected interval.
- Media Loss Rate (MDI)—Number of MDI streams whose MLR falls in the corresponding quality bands during the selected interval.
- Top N Source End Points—Endpoints that generated the largest frame loss rate during the selected interval.
- Top N Destination End Points—Endpoints that experienced the largest frame loss rate during the selected interval.
- Top N MDI Streams by Delay Factor—MDI streams that have the largest delay factor during the selected interval.
- Top N MDI Streams by Media Loss Rate—MDI streams that have the largest MLR during the selected interval.
The columns of the Video Stream Conversations table is described in Table D-55 .
Analyzing Transactions
This section has details about Analyzing the transactions and covers the following information:
- Analyzing ARP Transactions
- Analyzing DHCP Transactions
- Analyzing DNS Transactions
- Analyzing FTP Transactions
- Analyzing HTTP Transactions
- Analyzing ICMP Transactions
- Analyzing Kerberos Transactions
- Analyzing LDAP Transactions
- Analyzing RADIUS Transactions
- Analyzing SMB Authentication Transactions
Analyzing ARP Transactions
To analyze the ARP Transactions, choose Analyze > Transaction > ARP.
As described in the Using Transaction Summary section, this page displays two chart or table views of the following:
- ARP Response Time: The mean, minimum, maximum, median and standard deviation response times of ARP sessions.
- ARP Session States: Success/Failure distribution for ARP sessions. Select the Details button to see the ARP detailed view.
Use the Show Chart / Show Table buttons at the bottom of each display to switch between the chart/table view.
Analyzing DHCP Transactions
To analyze the DHCP Transactions, choose Analyze > Transaction > DHCP.
As described in the Using Transaction Summary section, this page displays two chart or table views of the following:
- DHCP Response Time: The mean, minimum, maximum, median and standard deviation response times required to allocate or renew an IP address.
- DHCP Session State: Success/Failure distribution for DHCP sessions. Select the Details button to see the DHCP detailed view.
Use the Show Chart / Show Table buttons at the bottom of each display to switch between the chart/table view.
Analyzing DNS Transactions
To analyze the DNS Transactions, choose Analyze > Transaction > DNS.
As described in the Using Transaction Summary section, this page displays two chart or table views of the following:
- DNS Response Time: The mean, minimum, maximum, median and standard deviation DNS response times.
- DNS – Session State: Success/Failure distribution for DNS sessions. Select the Details button to see the DNS detailed view.
Use the Show Chart / Show Table buttons at the bottom of each display to switch between the chart/table view.
Analyzing FTP Transactions
To analyze the FTP, choose Analyze > Transaction > FTP.
As described in the Using Transaction Summary section, this page displays two chart or table views of the following:
- FTP Response Time: The mean, minimum, maximum, median and standard deviation FTP response times.
- FTP – Server Return Codes: server return code distribution. Select the Details button to see the FTP detailed view.
Use the Show Chart / Show Table buttons at the bottom of each display to switch between the chart/table view.
FTP Details are displayed in tabular form for the FTP – Server Return Codes chart.
Analyzing HTTP Transactions
To analyze the HTTP Transactions, choose Analyze > Transaction > HTTP.
As described in the Using Transaction Summary section, this page displays two chart or table views of the following:
- HTTP Response Time: The mean, minimum, maximum, median and standard deviation response times of HTTP sessions.
- HTTP – Return Code: server return code distribution. Select the Details button to see the HTTP detailed view.
Use the Show Chart / Show Table buttons at the bottom of each display to switch between the chart/table view.
Analyzing ICMP Transactions
To analyze the ICMP Transactions, choose Analyze > Transaction > ICMP.
As described in the Using Transaction Summary section, this page displays two chart or table views of the following:
- ICMP Response Time: The mean, minimum, maximum, median and standard deviation response times of ICMP sessions.
- A high-level pie chart or table view of ICMP Session States. Select the Details button to see the ICMP detailed view.
Use the Show Chart / Show Table buttons at the bottom of each display to switch between the chart/table view.
Analyzing Kerberos Transactions
To analyze the Kerberos Transactions, choose Analyze > Transaction > Kerberos.
As described in the Using Transaction Summary section, this page displays two chart or table views of the following:
- Kerberos Response Time: The mean, minimum, maximum, median and standard deviation response times of Kerberos sessions.
- Kerberos – Session State: Success/Failure distribution for Kerberos sessions. Select the Details button to see the Kerberos detailed view.
Use the Show Chart / Show Table buttons at the bottom of each display to switch between the chart/table view.
Analyzing LDAP Transactions
To analyze the LDAP Transactions, choose Analyze > Transaction > LDAP.
As described in the Using Transaction Summary section, this page displays two chart or table views of the following:
- LDAP Response Time: The mean, minimum, maximum, median and standard deviation response times of LDAP sessions.
- LDAP – Session State: Success/Failure distribution for LDAP sessions. Select the Details button to see the LDAP detailed view.
Use the Show Chart / Show Table buttons at the bottom of each display to switch between the chart/table view.
Analyzing RADIUS Transactions
To analyze the RADIUS Transactions, choose Analyze > Transaction > RADIUS.
As described in the Using Transaction Summary section, this page displays two chart or table views of the following:
- RADIUS Response Time: The mean, minimum, maximum, median and standard deviation response times of RADIUS sessions.
- RADIUS – Session State: Success/Failure distribution for RADIUS sessions. Select the Details button to see the RADIUS detailed view.
Use the Show Chart / Show Table buttons at the bottom of each display to switch between the chart/table view.
Analyzing SMB Authentication Transactions
To analyze the LDAP Transactions, choose Analyze > Transaction > SMB Authentication.
As described in the Using Transaction Summary section, this page displays two chart or table views of the following:
- SMB Authentication Response Time: The mean, minimum, maximum, median and standard deviation response times of SMB Authentication sessions.
- SMB Authentication – Session State: Success/Failure distribution for SMB Authentication sessions.Select the Details button to see the SMB Authentication detailed view.
Use the Show Chart / Show Table buttons at the bottom of each display to switch between the chart/table view.
SMB Authentication Details are displayed in tabular form for the SMB Authentication – Session State chart.
Transaction Details
The transaction details contains the following topics:
- 802.1X/EAP Transaction Details
- ARP Transaction Details
- DHCP Transaction Details
- DNS Transaction Details
- FTP Transaction Details
- HTTP Transaction Details
- ICMP Transaction Details
- Kerberos Transaction Details
- LDAP Transaction Details
- RADIUS Transaction Details
- SMB Authentication Transaction Details
- Analyzing TLS Transaction Details
802.1X/EAP Transaction Details
To analyze the 802.1X/EAP Transaction Details, choose Analyze > Transaction > Detailed Views / 802.1X/EAP.
The details for EAP Codes are displayed in tabular form below.
ARP Transaction Details
To analyze the ARP Transaction Details, choose Analyze > Transaction > Detailed Views / ARP.
The details for ARP Session States are displayed in table form where the table columns are described in the table below.
DHCP Transaction Details
To analyze the DHCP Transaction Details, choose Analyze > Transaction > Detailed Views / DHCP.
The details for DHCP Session States are displayed in table form where the table columns are described in the table below.
DNS Transaction Details
To analyze the DNS Transaction Details, choose Analyze > Transaction > Detailed Views / DNS.
The details for DNS Session States are displayed in table form where the table columns are described in the table below.
FTP Transaction Details
To analyze the FTP Transaction Details, choose Analyze > Transaction > Detailed Views / FTP.
The details for FTP Server Return Codes are displayed in table form where the table columns are described in the table below.
HTTP Transaction Details
To analyze the HTTP Transaction Details, choose Analyze > Transaction > Detailed Views / HTTP.
The details for HTTP Return Codes are displayed in table form where the table columns are described in the table below.
ICMP Transaction Details
To analyze the ICMP Transaction Details, choose Analyze > Transaction > Detailed Views / ICMP.
The details for ICMP Session States are displayed in table form where the table columns are described in the table below.
Kerberos Transaction Details
To analyze the Kerberos Transaction Details, choose Analyze > Transaction > Detailed Views / Kerberos.
The details for Kerberos Session States are displayed in table form where the table columns are described in the table below.
LDAP Transaction Details
To analyze the LDAP Transaction Details, choose Analyze > Transaction > Detailed Views / LDAP.
The details for LDAP Session States are displayed in table form where the table columns are described in the table below.
RADIUS Transaction Details
To analyze the RADIUS Transaction Details, choose Analyze > Transaction > Detailed Views / RADIUS.
The details for RADIUS Session States are displayed in table form where the table columns are described in the table below.
SMB Authentication Transaction Details
To analyze the SMB Authentication Transaction Details, choose Analyze > Transaction > Detailed Views / SMB Authentication.
The details for SMB Authentication Session States are displayed in table form where the table columns are described in the table below.
Analyzing TLS Transaction Details
To analyze the TLS Transaction Details, choose Analyze > Transaction > Detailed Views / TLS.
The details for TLS are displayed in table form where the table columns are described in the table below.
Using the NAM Application Programming Interface
NAM provides an Application Programming Interface (API) that allows you to configure and retrieve data from the NAM. The API follows the commonly used Representational State Transfer (REST) style of providing services over HTTP or HTTPS. The NAM REST API is also referred to as the Northbound Interface (NBI).
For application developers who want to use the NAMREST API, ask your Cisco representative about the Cisco Prime Network Analysis Module REST API Guide .
 Feedback