-
null
- What Are Alarms and Events?
- How are Alarms and Events Created and Updated?
- Which Events Are Supported?
- Set Alarm and Event Management Preferences
- Interpret Event and Alarm Badges and Colors
- Find and View Alarms
- View a Specific Alarm in the Topology Map
- View Root Cause and Correlated Alarms
- Get Troubleshooting and Detailed Alarm Information
- Acknowledge and Clear Alarms
Monitor Alarms and
Events
What Are Alarms and Events?
An event is a distinct incident that occurs at a specific point in time, such as a port status change, or a device becoming unreachable. Events can indicate an errors, failures, or exceptional conditions in the network. Events can also indicate the clearing of those errors, failures, or conditions. Event have associated severities (which you can adjust as described in Change Event Severity Levels).
An alarm is a Cisco EPN Manager response to one or more related events. Only certain events generate alarms. Alarms have a state (cleared or not cleared) and a severity (Critical, Major, Minor, and so forth). An alarm inherits the severity of its most recent event. Alarms remain open until a clearing event is generated (or if the alarm is manually cleared).
How are Alarms and Events Created and Updated?
Cisco EPN Manager processes SNMP traps, syslogs, and TL1 messages from both IPv4 and IPv6 devices. It maintains an event catalog that determines how it should respond to these events.Cisco EPN Manager performs the following general steps when it processes an event:
-
Checks the event catalog to see if higher level processing is necessary (as
opposed to just generic processing) for the incoming
SNMP trap, syslog, or TL1 message
(by examining the raw event for
predefined patterns).
- If it cannot match the raw event to the catalog, the event is considered a generic event and it undergoes generic processing. Generic events are displayed events in the GUI and can be forwarded in notifications. (Generic event handling can be disabled; see Disable and Enable Generic Trap and Syslog Handling). This is done so that none of the traps and syslogs received by Cisco EPN Manager is discarded i.e., they either go through generic processing to create generic events or higher level processing to create alarms/processed events.
- If it can match the raw event to the catalog, the raw event is considered for higher level processing and Cisco EPN Manager creates a processed event with a severity and potentially an alarm.
- Identifies the device and device component that is causing the event (localizes the event).
- Checks whether the supported
event triggers inventory collection.
Some events have specific rules that instruct Cisco EPN Manager what information it should collect. For more information, see How Often Is Inventory Collected?
- Checks whether the supported event is a duplicate. If an event is a duplicate of an existing event, it is listed in the Events tab and saved in the database. A new alarm is not created.
- Checks whether the event severity is INFO or CLEARED.
- Checks whether an alarm
already exists or a new alarm should be created.
- If an alarm does exist,
Cisco EPN Manager
associates the event to the existing alarm. The alarm severity is changed to
match the severity of the new event, and the alarm time stamp is updated. If it
is a clearing event (for example, a link up event), the alarm will be cleared.

Note
In some cases, a device may not generate a clearing alarm. The administrator should set the alarm auto-clearing interval as described in Change Alarm Auto-Clear Intervals. - If an alarm does not exist, Cisco EPN Manager creates a new alarm and assigns it the same severity as the event.
- If an alarm does exist,
Cisco EPN Manager
associates the event to the existing alarm. The alarm severity is changed to
match the severity of the new event, and the alarm time stamp is updated. If it
is a clearing event (for example, a link up event), the alarm will be cleared.
-
Checks whether the new or existing alarm can be correlated to any other alarms. (Note that here, alarms are being correlated with other alarms, not with events.) If they can be correlated, Cisco EPN Manager does the following: You can identify uncleared correlated alarms by checking the Correlated Alarms tab in the Alarms and Events table. For more information on these kinds of alarms, see View Root Cause and Correlated Alarms.
Example: Link Down Alarm
In this example, Cisco EPN Manager receives a Link Down trap that it receives from a device. Cisco EPN Manager generates a Link Down event and, because the port is operationally down, it also generates a Link Down alarm. (Cisco EPN Manager will not open an alarm when a port is simply issued a shutdown command.)
When Cisco EPN Manager receives a Link Up trap from the device, it generates a Link Up event and clears the alarm.
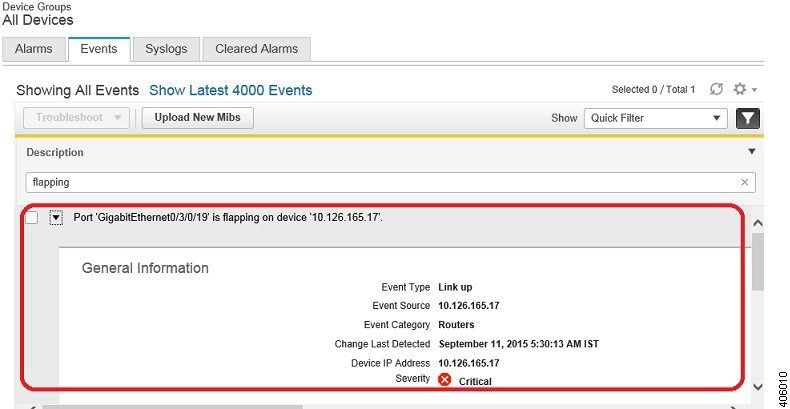
Flapping Events and Flow Controllers
Flapping is a flood of consecutive event notifications related to the same alarm. It can occur when a fault causes repeated event notifications (for example, a cable with a loosely fitting connector.) An event is identified as a flapping event if multiple events are of the same type, are associated with the same source, and recur in a short period of time. Cisco EPN Manager will generate an alarm for flapping events. This alarm is generated when there are five occurrences of the same event within 300 seconds. The five occurrences could be of a sequence such as, Interface Down, Interface Up, Interface Down, Interface Up, Interface Down, and so on.
When an alarm is generated for a flapping event, the devices often go into a continuous synchronization state. This can prevent deployment of device configuration such as service provisioning, OAM, etc, on the device. However, in Cisco EPN Manager, when a monitored device raises a Flapping alarm, Cisco EPN Manager detects this alarm and stops further updates of the alarm until the flapping condition on the device is cleared.
The alarm detected as a Flapping Event is cleared based on an exit condition, which is that when there is no occurrence of the same event within the next 300 seconds, the alarm is cleared. This helps control the flow of events to avoid unnecessary triggering of device synchronization.
Which Events Are Supported?
Refer to the following documents for information on the events that are supported by Cisco EPN Manager .
- Cisco Evolved Programmable Network Manager Supported Traps
- Cisco Evolved Programmable Network Manager Supported Syslogs
- Cisco Evolved Programmable Network Manager Supported TL1 Messages
For information about how unsupported events are handled, see View Events (Including Generic Events).
Set Alarm and Event Management Preferences
Note | Advanced users can also use the Cisco EPN Manager Representational State Transfer (REST) API to access device fault information. For information on the API, click |
- Set Up Your Alarm and Event Display Preferences
- View Critical Alarm Notifications
- Customize the Alarm Summary
Set Up Your Alarm and Event Display Preferences
In the Alarms and Events tables, Cisco EPN Manager displays the last 4000 alarms or events, by default. Cisco EPN Manager can only display what is available in the cache (which may be less than 4000). If you want to see more than 4000 alarms or events, click Show All above the table.
You can customize the
following alarm and event display by clicking
![]() at the top right of the
Cisco EPN Manager
window and choosing
My
Preferences. After you make your changes, click
Save to apply your new settings. Other settings,
such as whether acknowledged, cleared, and assigned alarms are displayed, are
controlled globally by the administrator.
(see
Configure Global Display and Search Settings for Acknowledged, Cleared, and Assigned Alarms).
at the top right of the
Cisco EPN Manager
window and choosing
My
Preferences. After you make your changes, click
Save to apply your new settings. Other settings,
such as whether acknowledged, cleared, and assigned alarms are displayed, are
controlled globally by the administrator.
(see
Configure Global Display and Search Settings for Acknowledged, Cleared, and Assigned Alarms).
|
User Preference Setting |
Description |
||
|---|---|---|---|
|
Automatically refresh Alarms & Events page |
Enables or disables automatically refreshing of the Alarms and Events page. If enabled, the page is refreshed according to the setting in Refresh Alarm count in the Alarm Summary. |
||
|
Refresh Alarm count in the Alarm Summary every ___ minutes/seconds |
Sets the refresh interval for the alarm count in the Alarm Summary (1 minutes by default) (see Customize the Alarm Summary). |
||
|
Enable Alarm Badging on Alarms & Events page |
When user enables Alarm Badging, alarm severity icons are displayed next to the device groups on the page. |
||
|
Disable Alarm Acknowledge Warning Message |
Disables the following message from displaying when user selects an alarm and chooses : Warning: This alarm will not be generated, if the original event recurs again, within next 7 days, as it is acknowledged now. Clearing the alarm instead of acknowledging will cause the alarm to be generated if the event recurs again. Proceed with alarm acknowledgment? |
||
|
Disable confirmation prompt for “Clear all of this condition” |
Disables the following message from displaying when user selects an alarm and chooses : Are you sure you want to clear all alarms of this condition? (Disabled by default) |
||
|
Disable “Set severity to information” prompt for “Clear all of this condition” |
Disables the following message which is displayed when user selects an alarm and chooses : Do you want to set the severity for the selected alarm's condition to Information? WARNING: This is a system-wide change that will prevent creation of future alarms of this condition. You can undo this change on the Severity Configuration page under System Settings. (Disabled by default)
|
||
|
Select alarm categories for Alarm Summary Toolbar |
Controls what is displayed in the Alarm Summary (see Customize the Alarm Summary). |
||
|
When clearing all alarms of a condition, always set the condition's severity to Information |
When user selects and alarm and chooses . (Disabled by default) |
||
|
Enable New Critical Alarm Count Notifications |
Enables the notification pop-up that displays the count of critical alarms.The count gets updated once the alarm interval is refreshed depending on the interval set in Refresh Alarm count in the Alarm Summary (see Customize the Alarm Summary). Only the outstanding critical alarms are displayed. |
View Critical Alarm Notifications
The count of the critical alarms in the network is displayed as a notification pop-up in every page. The count gets refreshed every 1 minute or some interval depending on the interval set in the My Preferences page.
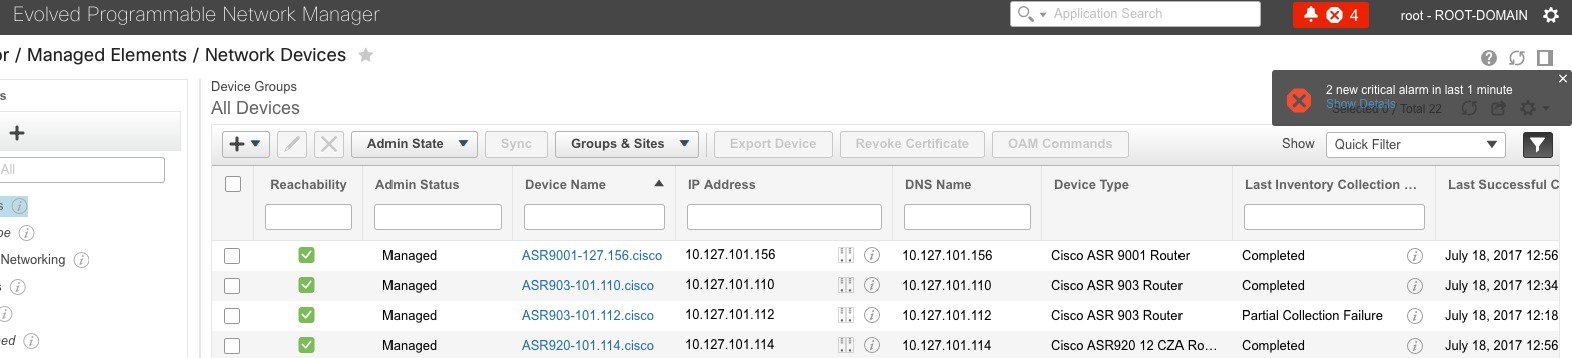
Click the Show Details hyperlink to view the list of critical alarms in the page.
Note | Only the outstanding critical alarms are taken count and displayed. |
The notification is not enabled by default and needs to be enabled from the My Preferences page. For details on how to enable the critical alarm count notification, see Set Up Your Alarm and Event Display Preferences.
Customize the Alarm Summary
You can specify what alarm categories are displayed:
- In the Cisco EPN Manager title bar alarm count (bell). This gives you a quick visual count of alarms you are interested in.
- In the Alarm Summary pop-up window that is launched when you click the alarm count. The pop-up window gives you a quick look at alarm counts with their severity, as shown in the following figure.
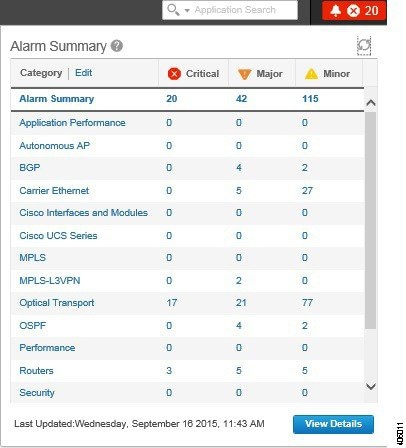
To customize this information:
Interpret Event and Alarm Badges and Colors
When there is a problem in the network, Cisco EPN Manager flags the problem by displaying an alarm or event icon with the element that is experiencing the problem. xxx lists the icons and their colors.
Alarm Severity Icons
|
Severity Icon |
Description |
Color |
|---|---|---|
|
|
Critical alarm |
Red |
|
|
Major alarm |
Orange |
|
|
Minor alarm |
Yellow |
|
|
Warning alarm |
Light Blue |
|
|
Alarm cleared; normal, OK |
Green |
|
|
Informational alarm |
Medium Blue |
|
|
Indeterminate alarm |
Dark Blue |
Find and View Alarms
To view alarms, go to . From the displayed alarms table, you can search for specific alarms, as described in the table below. You can also create and save customized (preset) filters as described in the procedure that follows the table. To get more information about an alarm, see View an Alarm's Details.
Note | By default, acknowledged and cleared alarms are not included for any search criteria. This behavior is controlled by the system administrator. See Configure Global Display and Search Settings for Acknowledged, Cleared, and Assigned Alarms |
|
To find these alarms: |
Choose and: |
|---|---|
|
Alarms generated by specific device |
For active alarms, click the “i” icon next to the device name to open the Device 360 view, then click the Alarms tab. For cleared alarms, refer to the Alarms and Events table. For cleared alarms or correlated alarms, click the appropriate tab and enter the device name or component in the Location column. You can use wild cards. For certain devices, you can also use the Chassis View to check device alarms. See View Alarms in the Chassis View. |
|
Alarms generated by a specific circuit/VC |
See Check Circuits/VCs for Faults for information on other ways to get circuit/VC alarm information. |
|
All alarms in the network |
Click the Show All link. |
|
Alarms assigned to you |
Click the Show drop-down filter list and choose Alarms assigned to me. You can also use this filter for cleared and correlated alarms. |
|
Unassigned alarms |
Click the Show drop-down filter list and choose Unassigned Alarms. You can also use this filter for cleared and correlated alarms. |
|
For active alarms:
You can use these same filters for cleared and correlated alarms. The filters do not have the (CEPNM timestamp) suffix because filtering by device timestamps is not supported for cleared and correlated alarms. |
|
|
Latest alarms according to the device timestamp |
Follow the same instructions as in the previous row, but choose the filters with the suffix (Device timestamp) This filter is not supported when searching for cleared or correlated alarms. |
|
Choose a group from the navigation pane on the left. You can also use this filter for cleared and correlated alarms. |
|
|
Alarms using customized filters |
Create and save the advanced filter (see the procedure that follows this table). |
You can also filter the data to find specific alarms using a quick filter or an advanced filter from the Show drop-down list. For information about how to filter the data, see Filter Data in the Detailed Tables.
View a Specific Alarm in the Topology Map
From the Alarms table, you can select a specific alarm and launch the topology map to see the alarm on the map.
View Root Cause and Correlated Alarms
TheCisco EPN Manager correlation process determines the causality for alarms and alarm sequences. Alarms that support the correlation process can be:
-
A root cause alarm—An alarm that causes other alarms (the "correlating" alarm).
-
A symptom alarm—An alarm that is the result of another alarm (the "correlated to" alarm).
Root cause and symptom alarms are displayed in a hierarchical manner to help you easily identify impacted network elements. The following is an example of an uncleared link down alarm that is the root cause for two other link down symptom alarms. To display an alarm tooltip in the hierarchy, hover your mouse cursor over an alarm.
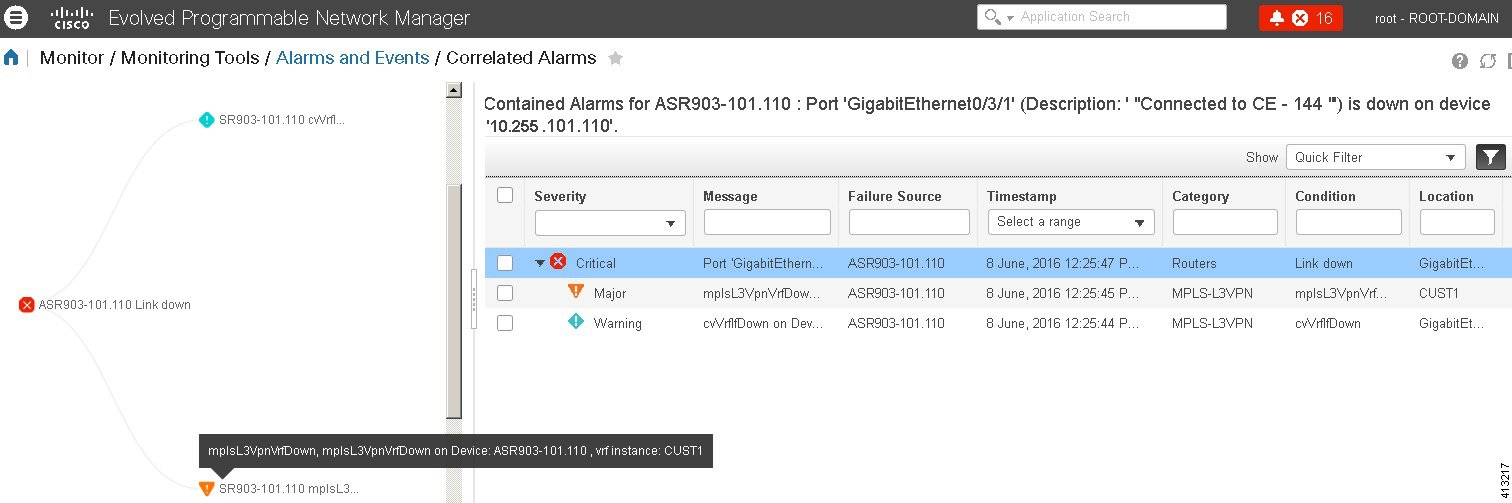
This view is especially helpful when alarm sequence have multiple hierarchies. All alarm sequences, regardless of the number of hierarchies, have only one root cause alarm.
| Step 1 | Choose . |
| Step 2 | To view
uncleared
correlated alarms, click the
Correlated Alarms tab.
You can also view uncleared correlated alarms in the main Alarms and Events table. The Correlation Type column will identify whether it is an uncleared root cause alarms or symptom alarm (with a hyperlink to more information). Cleared correlated alarms are displayed in the Cleared Alarms tab. Like uncleared alarms, the Correlation Type column will identify it as a cleared root cause or symptom alarm. |
Get Troubleshooting and Detailed Alarm Information
- View an Alarm's Details
- Find Troubleshooting Information for an Active Alarm
- Find Out Which Events Are Associated With An Alarm
- Find Out If An Alarm Impacts Other Services or Network Elements
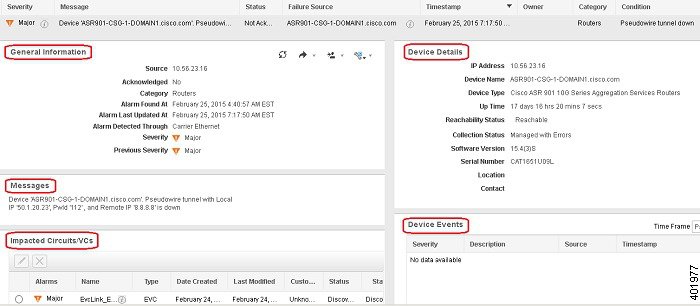
View an Alarm's Details
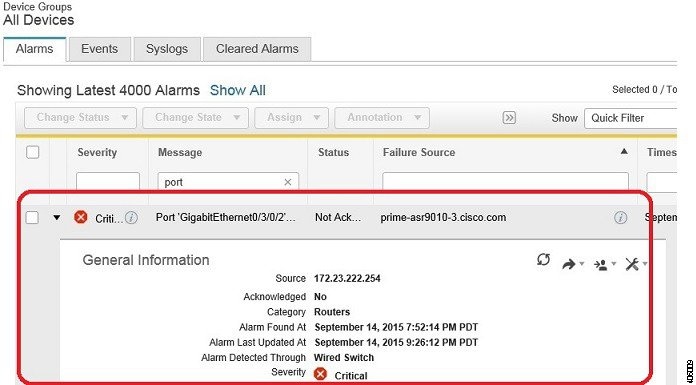
To get more details about an alarm, expand it. You can do this from the Alarms list (by choosing , or by clicking Details in the Alarm Summary pop-up). The circled areas are explained in the table that follows this figure.
|
General Information—When alarm was found and last updated, current and last severity, and how it was detected |
Device Details—Managed device name, address, uptime, reachability status, collection status, and so forth |
|
Messages—Trap, syslog, or TL1 message |
Device Events—Recent device events from past hour (of any type, in chronological order) |
|
Impacted Circuits/VCs—Carrier Ethernet or Optical circuits/VCs affected by alarm |
Find Troubleshooting Information for an Active Alarm
Use this procedure to get an explanation for why an active alarm occurred, and the recommended response to the alarm.
Note | Not all alarms have this information. Users with sufficient privileges can add or change the information that is displayed in the popup window. See Customize the Troubleshooting Text for an Alarm. |
| Step 1 | Choose , then click the Alarms tab. (For interface alarms, you can also get this information from the Interface 360 view under the Alarms tab.) |
| Step 2 | Locate the
alarm, then click the "i" icon in the
Condition column to open the popup window that
provides the explanation and the recommended action that can be taken to
troubleshoot the alarm.
If you take any actions, we recommend you document your actions. Choose the alarm, click Annotation. |
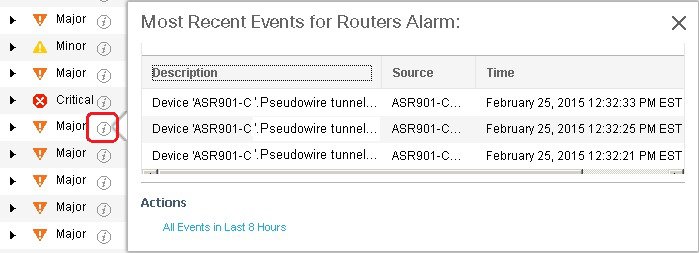
Find Out Which Events Are Associated With An Alarm
To view the events that have been correlated to an alarm, from the Alarms table, click the “i” icon next to the Severity.
Find Out If An Alarm Impacts Other Services or Network Elements
The Alarms table contains a Service Affecting column which tells you if an alarm affects other parts of the network:
Note | Service-affecting information is displayed for optical devices only. |
To identify all alarms that can affect services, choose Quick Filter from the Show drop-down list and enter SA in the field above the Service Affecting column.
To find out which services are affected, expand the alarm and check the details in the Impacted Circuits/VCs area of the alarm details.
The Alarms table also contains a Correlation Type column which tells you if the alarm is causing other alarms (Root Cause Alarm), or if the alarm is a symptom of another alarm (Symptom Alarm). For more information, see View Root Cause and Correlated Alarms.
Acknowledge and Clear Alarms
An alarm can have a status of Not Acknowledged, Acknowledged, or Cleared.
Not Acknowledged
Not Acknowledged means the problem is not being worked on. It could indicate that a new fault condition in the network, or that a cleared fault condition that has recurred. Not Acknowledged alarms are not removed from the Alarms and Events tables until they are either acknowledged or cleared.
Acknowledged
Acknowledged means a fault condition has either been recognized and is being worked on, or it can be ignored. Moving an alarm to the acknowledged status is a manual operation and changes the alarm Status to Acknowledged. An acknowledged event is still considered to be open (that is, not cleared), so if any related events recur, the events are added to the alarm.
By default, acknowledged alarms are not removed from the Alarms list. This behavior depends on the Hide Acknowledge Alarms setting that is controlled by the Administrator.
Acknowledged alarms can be moved back to the Not Acknowledged status (for example, if you acknowledged the wrong alarm).
Cleared
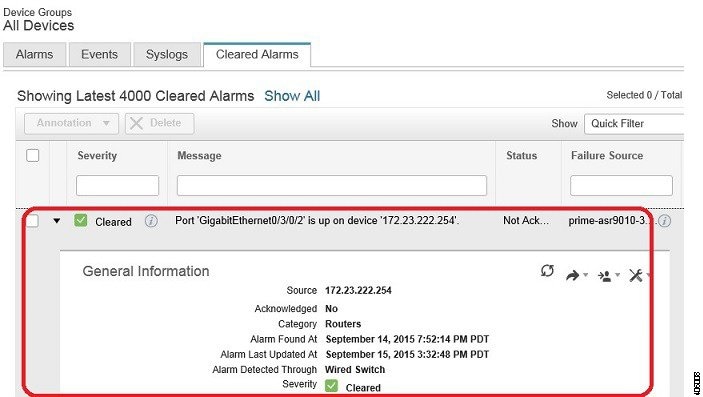
Cleared means the fault condition no longer exists. If an alarm is cleared but an associated event recurs, Cisco EPN Manager opens a new alarm. An alarm can be cleared by a user or by the Cisco EPN Manager system. Cleared alarms are removed from the Alarms list (but you can still view them under the Cleared Alarms tab).
You can also clear an alarm by choosing Clear all of this Condition, which will clear all alarms that are having the same problem. You may also be prompted to change all alarms with that condition to Informational severity. This means that if an associated event recurs, a new alarm will not be opened. You should use that setting with care.
To change the status of an alarm:
| Step 1 | Choose Monitor > Monitoring Tools > Alarms & Events. | ||
| Step 2 | Select an
alarm, then choose
Change
Status and the appropriate status (Acknowledge,
Unacknowledge, Clear, Clear all of this Condition).
| ||
| Step 3 | Click Yes to confirm that you want to clear all alarms of the specified condition. |
What are the Supported Alarm Clearing Mechanisms
At times you may face a situation where there are so many alarms that are available irrespective of their events being cleared. If you encounter any such problems, here are some of the solutions supported in Cisco EPN Manager .
- Default clearing of alarms—The fault is resolved on the device and an event is triggered for the same. For example, a device-reachable event clears the device-unreachable event. This in-turn, clears the device-unreachable alarm.
- Auto-clearing of alarms—In some cases, a device may not generate a clearing alarm. In such cases, Cisco EPN Manager waits for 24 hours (default interval) and then auto-clears the alarm. You need to have administrator privileges to change the auto-clear duration and to know how to set that interval, see Change Alarm Auto-Clear Intervals .
- Clearing alarms based on inventory status of ports—When a device is rebooted, a card is reloaded or a RSP failover happens, the inventory collection is triggered for that device. During this inventory synchronisation, Cisco EPN Manager clears several types of alarms located on some specific ports based on the operational status of that particular port of the device. For example, when Cisco EPN Manager receives a Link Down trap from a device, it generates a Link Down alarm on the specific port since it is operationally down. After a device reboot, if the operational status of the port changes to up, then the Link Down alarm is cleared automatically by Cisco EPN Manager .
- Syncing device to clear
alarms—Here, the devices are synced so that
Cisco EPN Manager
gets the list of the outstanding active alarms and the events that does not
exist are cleared. This is a different mechanism when compared to the event
based alarm/event reporting (over traps/syslogs). Once the sync is over, the
Alarms Table is refreshed to display only the outstanding active alarms.
Note
This feature is supported only for certain devices or for certain device functionalities. For example, this feature is supported for optical devices/optical part of devices (For example, NCS 4K, NCS 1K) and is not supported for packet devices (For example, ASR 9K, 9xx, 42xx, 4K). - Manual clearing of alarms—In situations where the clearing event is missing, you can manually clear an alarm by choosing the particular alarm, and changing its status to Clear. For more information, see the Cleared section under Acknowledge and Clear Alarms.
Add Notes To an Alarm
The annotation feature allows you to add free-form text to the alarm, which is displayed in the Messages area of the alarm details. To add text to an alarm, choose the alarm in the Alarms and Events table, click Annotate, and enter your text. As with acknowledging, when you annotate an alarm, Cisco EPN Manager adds your user name and the annotation time stamp to the Messages area of the alarm details.
Forward Alarms and Events as Email Notifications
You can configure Cisco EPN Manager to send email notifications for alarms and events. You can specify the severity for which you want to be notified, and the notification email destinations. The settings for the email subject line and body of the email are controlled globally by the administrator; you cannot adjust them.
Manage How Alarms Are Triggered (Alarm Thresholds)
You can customize how often information is gathered (polling interval), the threshold value that indicates a problem, and whether Cisco EPN Manager should generate an informational event or an alarm (of an severity) when a problem is detected. Not all policies have all of these settings; for example, a policy may only collect statistics, so it would not have any thresholds or alarms associated with it.
| Step 1 | Choose Monitor > Monitoring Tools > Monitoring Policies > My Policies and select the policy you want to edit. |
| Step 2 | Locate the parameter you want to change. You can search for the parameter by entering a string in the Parameter text box. |
| Step 3 | To adjust the polling interval, select the new interval from the Polling Frequency drop-down list. To disable polling, choose No Polling. Note that some polling frequencies are applied to groups of parameters. Changing the group interval will change the polling for all settings in the group. If a policy does not have any thresholds or events associated with it, Cisco EPN Manager prompts you to save the changes. |
| Step 4 | To change a threshold value, expand the parameter and choose a value from the parameter’s drop-down list. |
| Step 5 | To specify what Cisco EPN Manager should do when the threshold is surpassed, choose an alarm value from the parameter’s drop-down list. You can configure Cisco EPN Manager to generate an alarm of a specified severity, generate an informational event, or do nothing (if no reaction is configured). |
| Step 6 | Click: |
View Events (Including Generic Events)
The Events tab displays supported and generic (unsupported) events. Supported events are events that Cisco EPN Manager generates based on information about the network. It receives this network information either through syslogs and traps generated by devices, or through polling and inventory collection. This process is described in How are Alarms and Events Created and Updated?. Generic events are events that Cisco EPN Manager does not recognize. Rather than drop the events, Cisco EPN Manager assigns the events a Minor severity (this severity is applied to all generic events; to change it, see Change Event Severity Levels). If desired, you can customize the information displayed by generic events; see Customize Generic Events That Are Displayed in the Web GUI. For information about supported events, see Which Events Are Supported?.
Generic event processing is disabled by default. Users with Administrator privileges can disable or re-enable it.
The Events tab provides a variety of filters that you can use to find the information you are looking for. You can also create and save customized (preset) filters using the same procedure described in Find and View Alarms. The following table lists some of the ways you can filter events.
|
To find these events: |
Select , click the Events tab, and: |
|---|---|
|
All events in the network |
Click the Show All hyperlink |
|
Latest 4,000 Events |
Click the Show Latest 4000 Events hyperlink |
|
All events generated by a device group, series, type, location group, or user-defined group |
Choose a group from the left sidebar menu |
|
Events in last x minutes, hours, or days |
Click the Show drop-down filter list and choose the appropriate filter |
|
Non-informational events generated in the last hour |
From the Show drop-down filter list, choose Non-info events in last hour |
|
Events using customized filters |
Create and save an advanced filter (see Find and View Alarms) |
View Syslogs
Cisco EPN Manager logs all syslogs from severity 0 through 7 (emergency through debugging messages) generated by all devices that are managed by Cisco EPN Manager . Syslogs from devices that are not managed are not logged or displayed. Cisco EPN Manager also logs all SNMP messages.
Cisco EPN Manager stores a maximum of 2,000,000 syslogs with the display limit of maximum 2,00,000 historic syslogs.
To view syslogs, choose , then click the Syslogs tab.
Export Alarms or Events to a CSV or PDF File
Use this procedure to save alarms or events as a CSV or PDF file.
| Step 1 | Navigate to the
data you want to export.
|
| Step 2 | If you have a very large amount of data, apply a filter; otherwise the export process may take some time. |
| Step 3 | Click
|
| Step 4 | Choose CSV or PDF, click OK, and save the file. |
Get Support from Cisco
If you receive an alarm in Monitor > Monitoring Tools > Alarms and Events for which you cannot find a resolution in the Cisco Support Community (click an alarm, then choose Troubleshoot > Support Forum.), you can use Cisco EPN Manager to open a support request (click an alarm, then choose Troubleshoot > Support Case).
Respond to Problems Within Cisco EPN Manager
Cisco EPN Manager generates internal SNMP traps to monitor its own functions—such as server CPU and disk utilization, fan and power supply failures, and high availability (HA) state changes. For information on these types of events, see Troubleshoot Server Internal SNMP Traps.
 Feedback