System

This section contains the following topics:

Architecture overview

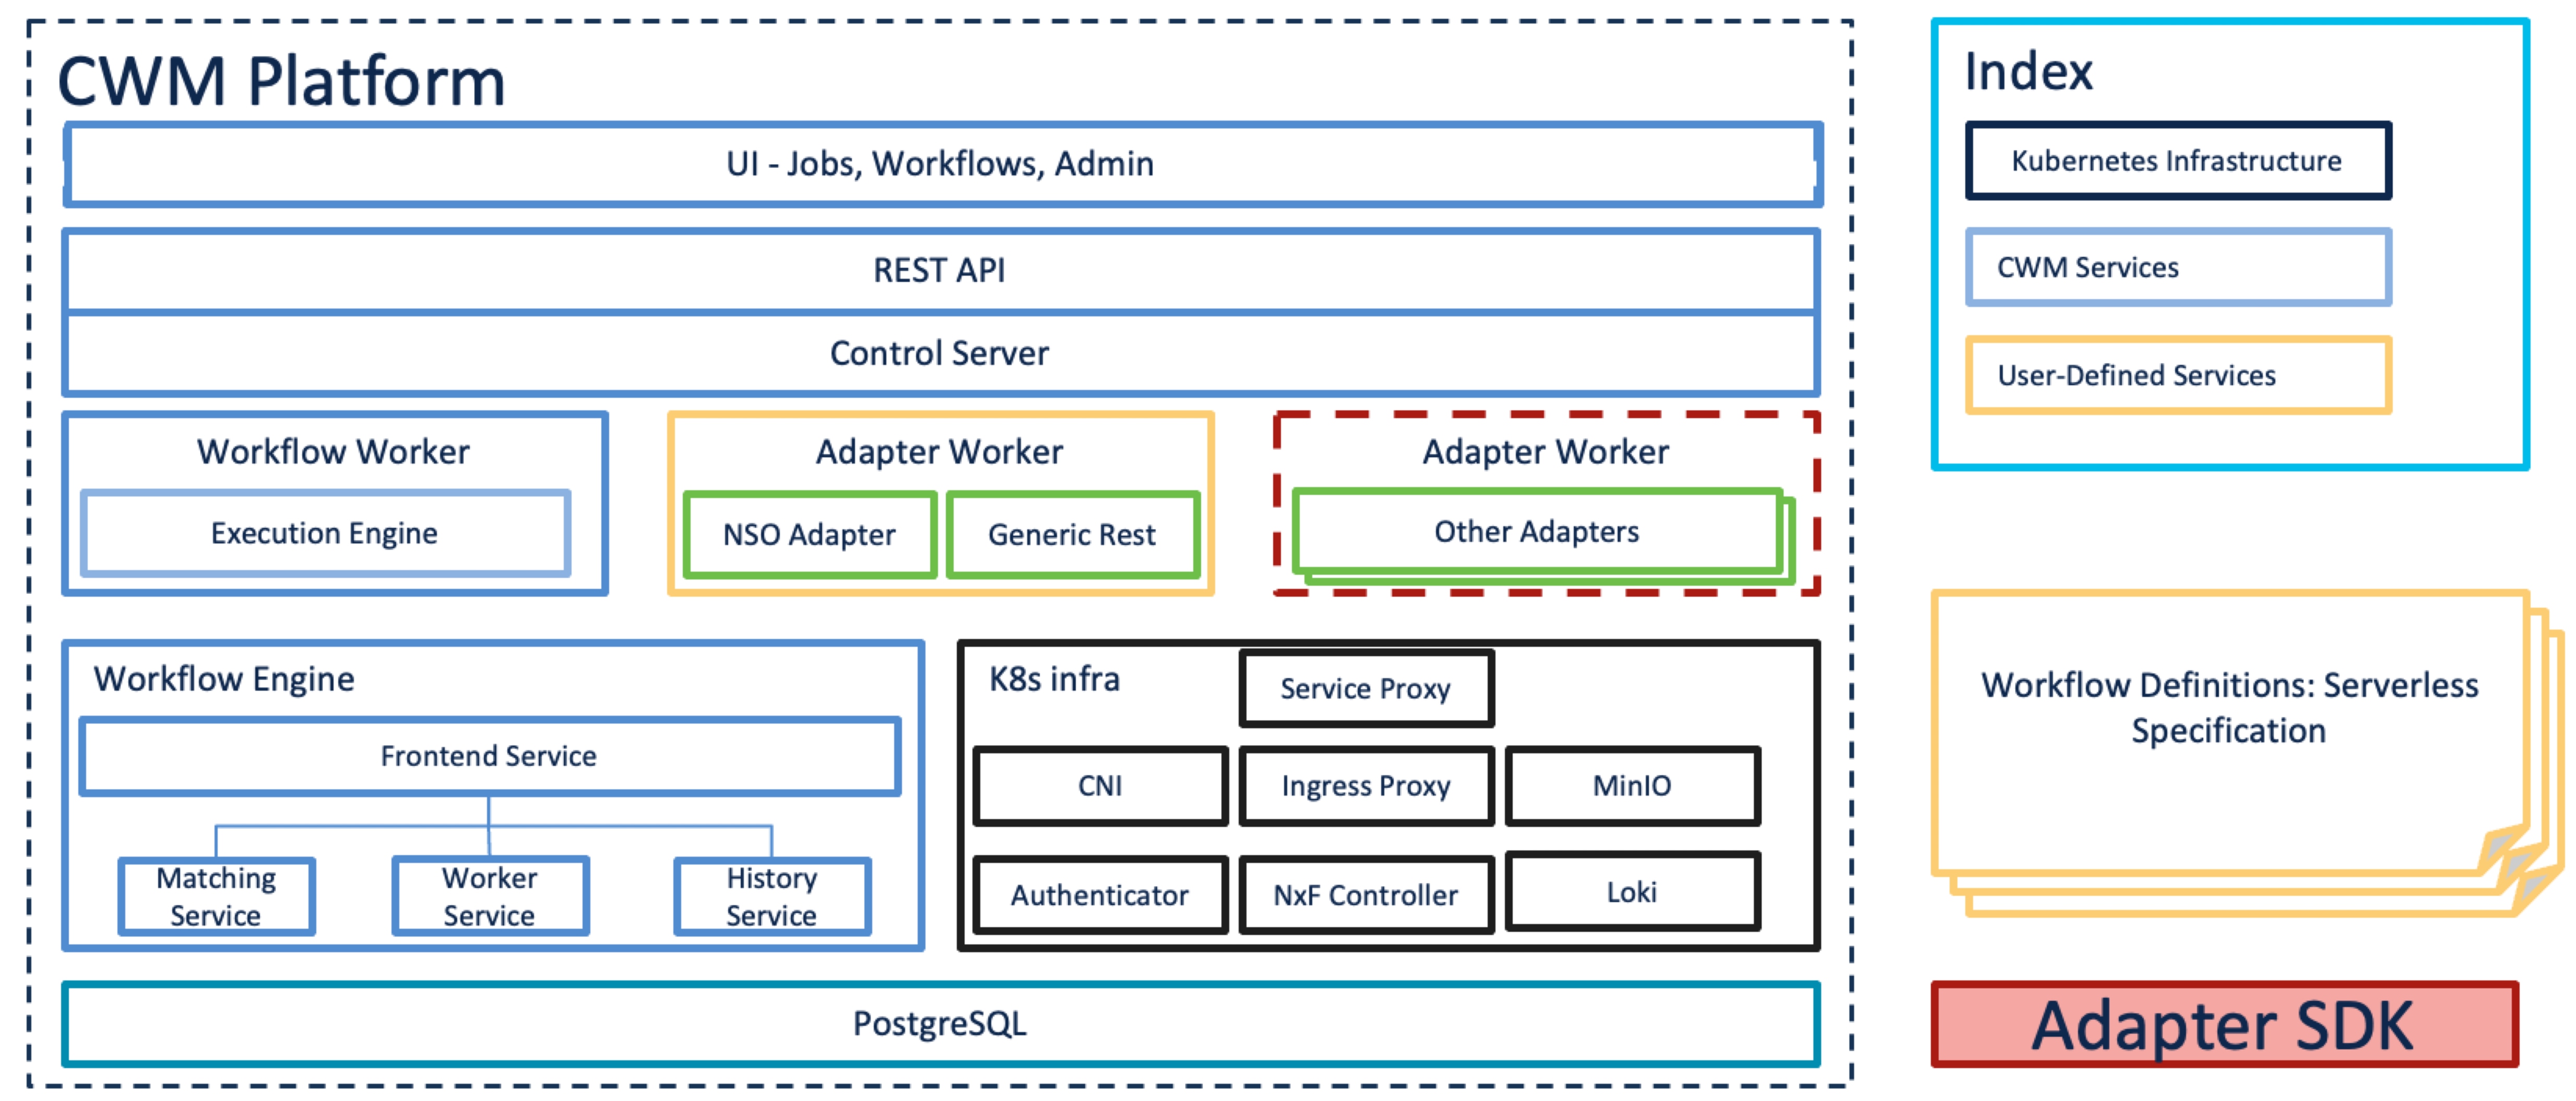
The Crosswork Workflow Manager architecture is a microservice-based solution that operates on top of the Kubernetes container orchestration system. This section shows a diagram presenting its core architectural components along with short descriptions of each.


Architecture diagram
  • User Interface (UI): allows operators to add and instantiate workflows, enter workflow data, list running workflows, monitor job progress. The Admin section of the UI enables adding workers, managing worker processes and assigning activities from adapters to workers.

  • REST API: includes all interaction with the CWM application: deploying adapters, publishing and instantiating workflows, managing workers, resources and secrets.

  • Control Server: dispatches API requests to relevant microservices.

  • Workflow Engine: it is the core component that conducts how workflows are handled; it interprets and manages the execution of workflow definitions.

  • Execution Engine (Workflow Worker): it is responsible for executing the workflow tasks. It receives the workflow tasks from the Workflow Engine, executes them in the correct order, and sends the results back to the Workflow Engine.

  • Adapter Workers: they are processes responsible for executing the tasks defined in workflow definitions and adapter code. They receive the tasks from the Workflow Worker, execute them, and send the results back to the Workflow Worker. The Execution Workers are capable to load additional adapters as plugins, which allows them to work with different systems and technologies.

  • Adapters: they interface and integrate with external systems, applications and technologies. Inside them, activities that can be consumed in a workflow are defined.

  • Adapter SDK: a Software Development Kit that helps developers create new adapters to integrate with external systems.

  • Workflow Definitions: workflow code written in the JSON format based on the Serverless Workflow specification.

  • K8s Infrastructure: runtime platform for the CWM application. It is a collection of services that provide the necessary infrastructure to support the deployment and management of the application within a Kubernetes cluster.

  • PostgreSQL: it is the database used by the system to store and manage its data.

Check health and logs

CWM is a microservice-based application that leverages Kubernetes cluster architecture as its runtime environment. The health of the CWM application can thus be checked using Kubernetes commands.


Note


To see all the supported kubectl commands, log in to the OS on your VM and use kubectl --help.

Check pod status

Procedure


Step 1

Using a command-line terminal, log in to the OS on your virtual machine with SSH:

ssh -o UserKnownHostsFile=/dev/null  -p 22  nxf@<your_resource_pool_address>

Step 2

To check status of pods for namespace zone-a (this is the default namespace for pods contaning CWM microservices), run the following command:

kubectl get pods -n zone-a

Step 3

A list of pods will appear:

k8s pods

Step 4

If a pod has a status different from Running, you can 'restart' it using the following command:

kubectl delete pod <pod_name> -n zone-a

The pod will be deleted, but as Kubernetes configuration is declarative, it will effectively recreate the deleted pod and rerun it.


Check and collect logs

Application logs can be checked with Loki logCLI command-line interface. To gather logs from the CWM platform, follow these steps:

Procedure


Step 1

Using a command-line terminal, connect to the system using SSH client:

ssh  -pSSH_PORT nxf@ip_address_of_deployment

Note


Adjust SSH_PORT and ip_address_of_deployment accordingly.

Step 2

After successful login, use the command below to list all running pods:

kubectl get pods -A

Example result:

[nxf@wf-nat-08 ~]$ kubectl get pods -A
NAMESPACE            NAME                                      READY   STATUS      RESTARTS       AGE
kube-flannel         kube-flannel-ds-trr95                     1/1     Running     0              103m
kube-system          coredns-htg9j                             1/1     Running     0              103m
kube-system          etcd-wf-nat-08                            1/1     Running     0              103m
kube-system          kube-apiserver-wf-nat-08                  1/1     Running     0              103m
kube-system          kube-controller-manager-wf-nat-08         1/1     Running     0              103m
kube-system          kube-proxy-c25f5                          1/1     Running     0              103m
kube-system          kube-scheduler-wf-nat-08                  1/1     Running     0              103m
local-path-storage   local-path-provisioner-6fb6f599c7-ckcjc   1/1     Running     0              103m
nxf-system           authenticator-5db8885675-qlrmg            2/2     Running     0              102m
nxf-system           controller-cbd87f8c5-6tg6f                2/2     Running     1 (102m ago)   102m
nxf-system           ingress-proxy-56f7c9899d-6st6j            1/1     Running     0              102m
nxf-system           kafka-0                                   1/1     Running     0              102m
nxf-system           loki-7c994678f8-fnrs9                     3/3     Running     0              102m
nxf-system           minio-0                                   2/2     Running     0              103m
nxf-system           postgres-0                                2/2     Running     0              102m
nxf-system           promtail-v6tb4                            1/1     Running     0              102m
nxf-system           registry-7dd84db44f-n5q7h                 2/2     Running     0              102m
nxf-system           vip-wf-nat-08-28131000-772k5              0/1     Completed   0              3m42s
zone-a               api-service-745759bffc-v6r25              2/2     Running     2 (100m ago)   100m
zone-a               dsl-service-77d5fc96cc-5nv42              2/2     Running     3 (100m ago)   100m
zone-a               logcli-5c7ddbc95d-mkpcc                   2/2     Running     0              100m
zone-a               plugin-manager-665b7bbd4d-jvqdk           2/2     Running     1 (100m ago)   100m
zone-a               ui-service-57cf6d6bcc-smmvt               2/2     Running     0              100m
zone-a               worker-manager-6d6b445d46-r6nzk           2/2     Running     1 (99m ago)    100m
zone-a               workflow-frontend-77bc897549-kcz5k        2/2     Running     1 (99m ago)    100m
zone-a               workflow-history-58bdb85b8d-88t25         2/2     Running     1 (99m ago)    100m
zone-a               workflow-history-58bdb85b8d-h22bd         2/2     Running     1 (99m ago)    100m
zone-a               workflow-history-58bdb85b8d-ph5fh         2/2     Running     1 (99m ago)    100m
zone-a               workflow-matching-86cfc5577c-4mxhb        2/2     Running     1 (99m ago)    100m
zone-a               workflow-ui-68f857645-9mq9v               2/2     Running     0              100m
zone-a               workflow-worker-8496898f7b-wcrqs          2/2     Running     1 (99m ago)    100m

Step 3

Identify the logcli tool available in the zone-a namespace. In this example, it is the pod named logcli-5c7ddbc95d-mkpcc.

Step 4

Connect to the correct pod and list the available log labels for filtering:

kubectl exec --namespace=zone-a -ti logcli-5c7ddbc95d-mkpcc -- logcli labels
app
container
filename
level
namespace
node_name
pod
stream

Step 5

Gather logs from all applications running in the "zone-a" namespace and save them to a single file. Make sure to adjust the --since option to collect logs from the relevant time period when the troubleshooting event occurred:

kubectl exec --namespace=zone-a -ti logcli-5c7ddbc95d-mkpcc -- logcli query '{namespace="zone-a"}' --since 60m > zone-a.log

Step 6

Similarly, collect logs from other namespaces, using different files for convenience:

kubectl exec --namespace=zone-a -ti logcli-5c7ddbc95d-mkpcc -- logcli query '{namespace="nxf-system"}' --since 60m > nxf-system.log
kubectl exec --namespace=zone-a -ti logcli-5c7ddbc95d-mkpcc -- logcli query '{namespace="kube-system"}' --since 60m > kube-system.log

Step 7

Use the SCP tool to copy the log files from the system to your desktop:

scp -P SSH_PORT nxf@ip_address_of_deployment:"*.log".

Step 8

Finally, you can send the logs to support and provide a detailed description of the issue you are experiencing.

Note


For more details on the logCLI commands and usage, refer to logCLI Grafana documentation.