- Cisco VAMS 1.5 Preface
- Cisco VAMS 1.5 Chapter 1, Overview
- Cisco VAMS 1.5 Chapter 2, Preinstallation
- Cisco VAMS 1.5 Chapter 3, Installation
- Cisco VAMS 1.5 Chapter 4, Uninstallation
- Cisco VAMS 1.5 Chapter 5, Configuration
- Cisco VAMS 1.5 Chapter 6, Troubleshooting
- Cisco VAMS 1.5 Appendix A, Trap Definitions
- Cisco VAMS 1.5 Appendix B, End User License Agreement Supplement
- Cisco VAMS 1.5 Glossary
- Cisco VAMS 1.5 Index
- Monitoring ANA, CMM, and Video Probe Events with TBSM
- Monitoring ANA, CMM, and Video Probe Events with Netcool/Webtop
- Advanced Troubleshooting with CMM and TBSM
Troubleshooting with the Cisco Video Assurance Management Solution 1.5
Troubleshooting with the Cisco VAMS 1.5 involves the use of:
•![]() Monitoring Service Trees and Events using IBM Tivoli TBSM
Monitoring Service Trees and Events using IBM Tivoli TBSM
•![]() Monitoring ANA and CMM events using Netcool/Webtop
Monitoring ANA and CMM events using Netcool/Webtop
•![]() CMM for advanced troubleshooting.
CMM for advanced troubleshooting.
•![]() Cisco ANA for basic troubleshooting.
Cisco ANA for basic troubleshooting.
This chapter contains:
•![]() Monitoring ANA, CMM, and Video Probe Events with TBSM
Monitoring ANA, CMM, and Video Probe Events with TBSM
•![]() Monitoring ANA, CMM, and Video Probe Events with Netcool/Webtop
Monitoring ANA, CMM, and Video Probe Events with Netcool/Webtop
•![]() Advanced Troubleshooting with CMM and TBSM
Advanced Troubleshooting with CMM and TBSM
•![]() Monitoring and Troubleshooting in the Wireline Network
Monitoring and Troubleshooting in the Wireline Network
•![]() Monitoring and Troubleshooting in the Cable Network
Monitoring and Troubleshooting in the Cable Network
•![]() Troubleshooting with Cisco ANA
Troubleshooting with Cisco ANA
Monitoring ANA, CMM, and Video Probe Events with TBSM
Step 1 ![]() Log in to IBM Tivoli Business and Services Manager (TBSM).
Log in to IBM Tivoli Business and Services Manager (TBSM).
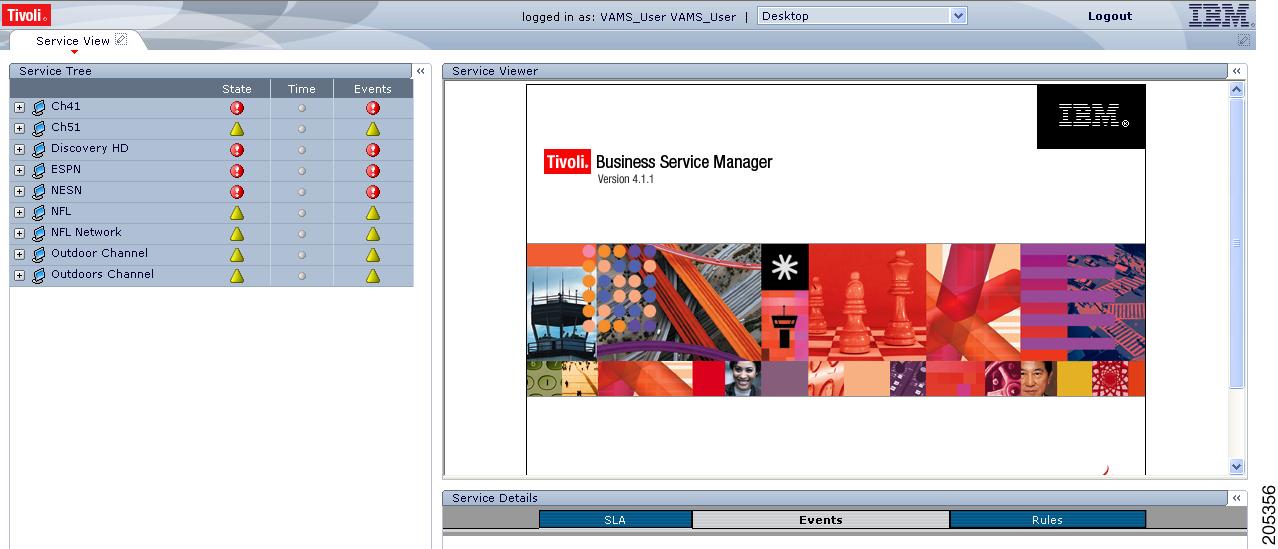
The main TBSM page appears, as shown in Figure 6-4.
The highest severity alarm status is shown in the Service Tree at the left of the page.
Figure 6-1 TBSM Main Window
Step 2 ![]() From the service tree directory browser at the left of the page, click on a service.
From the service tree directory browser at the left of the page, click on a service.
The service tree for the selected service appears.
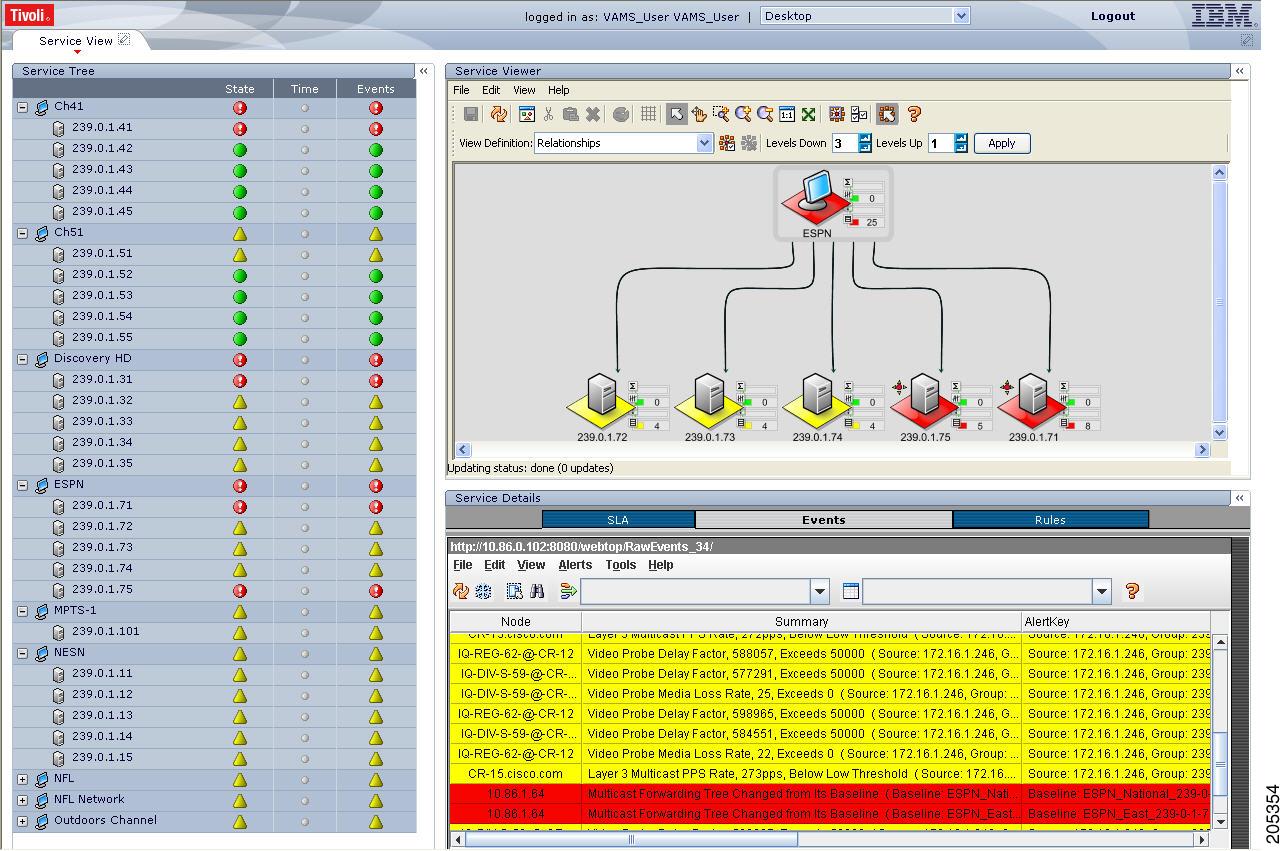
Step 3 ![]() Click on a specific device address.
Click on a specific device address.
The Service Viewer displays the service relationships and the Service Details window shows an event list for the service, as shown in Figure 6-2.
Figure 6-2 Service Viewer and Service Details Window
Step 4 ![]() To view the details of an event, double-click on the row for the event.
To view the details of an event, double-click on the row for the event.
A table giving detailed field information for the event appears.
Step 5 ![]() To launch the CMM application, highlight an event, and then from the Alerts Menu, choose VAMS Tools > Region Name > Launch CMM.
To launch the CMM application, highlight an event, and then from the Alerts Menu, choose VAMS Tools > Region Name > Launch CMM.

Note ![]() The Region Name value is configurable from TBSM. For information on configuring the Region Name, see the IBM Tivoli TBSM documentation at the following URL:
The Region Name value is configurable from TBSM. For information on configuring the Region Name, see the IBM Tivoli TBSM documentation at the following URL:
http://publib.boulder.ibm.com/infocenter/tivihelp/v3r1/topic/com.ibm.tivoli.itbsm.doc/tbsm42custom.pdf
Note ![]() You can launch a real-time CMM flow trace or launch the CMM Latest Events page for further troubleshooting. it is possible to have one or more CMM servers available to launch to. The example in Figure 6-3 shows two regional CMM servers reporting events to a single CIC server.
You can launch a real-time CMM flow trace or launch the CMM Latest Events page for further troubleshooting. it is possible to have one or more CMM servers available to launch to. The example in Figure 6-3 shows two regional CMM servers reporting events to a single CIC server.
Figure 6-3 shows the menu selections for starting CMM.
Figure 6-3 Launching CMM from a TBSM Event List

The CMM application starts.
For additional information on the Tivoli TBSM application, and information on how to adjust and customize the TBSM window, see the IBM Tivoli TBSM documentation at the following URL:
Monitoring ANA, CMM, and Video Probe Events with Netcool/Webtop
Step 1 ![]() Log in to IBM Tivoli Business and Services Manager (TBSM).
Log in to IBM Tivoli Business and Services Manager (TBSM).
The main TBSM window appears, as shown in Figure 6-4.
Figure 6-4 TBSM Main Window
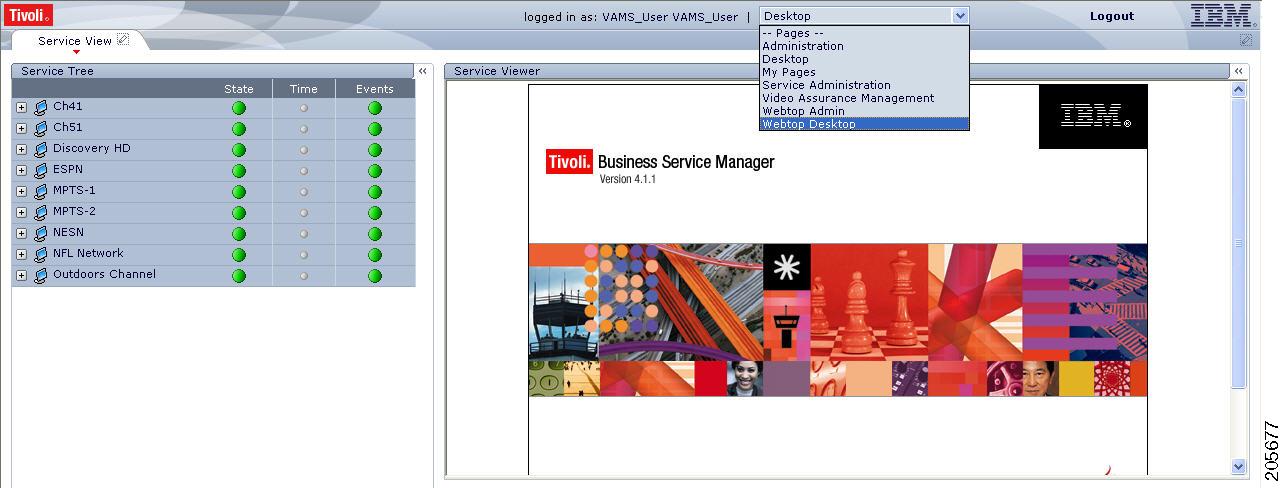
Step 2 ![]() From the pull-down menu at the top of the TBSM start page, select Webtop Desktop.
From the pull-down menu at the top of the TBSM start page, select Webtop Desktop.
The Webtop Desktop User page appears.
Step 3 ![]() Click the Event Lists tab.
Click the Event Lists tab.
The Active Event List appears, as shown in Figure 6-5.
Figure 6-5 Webtop Active Event List
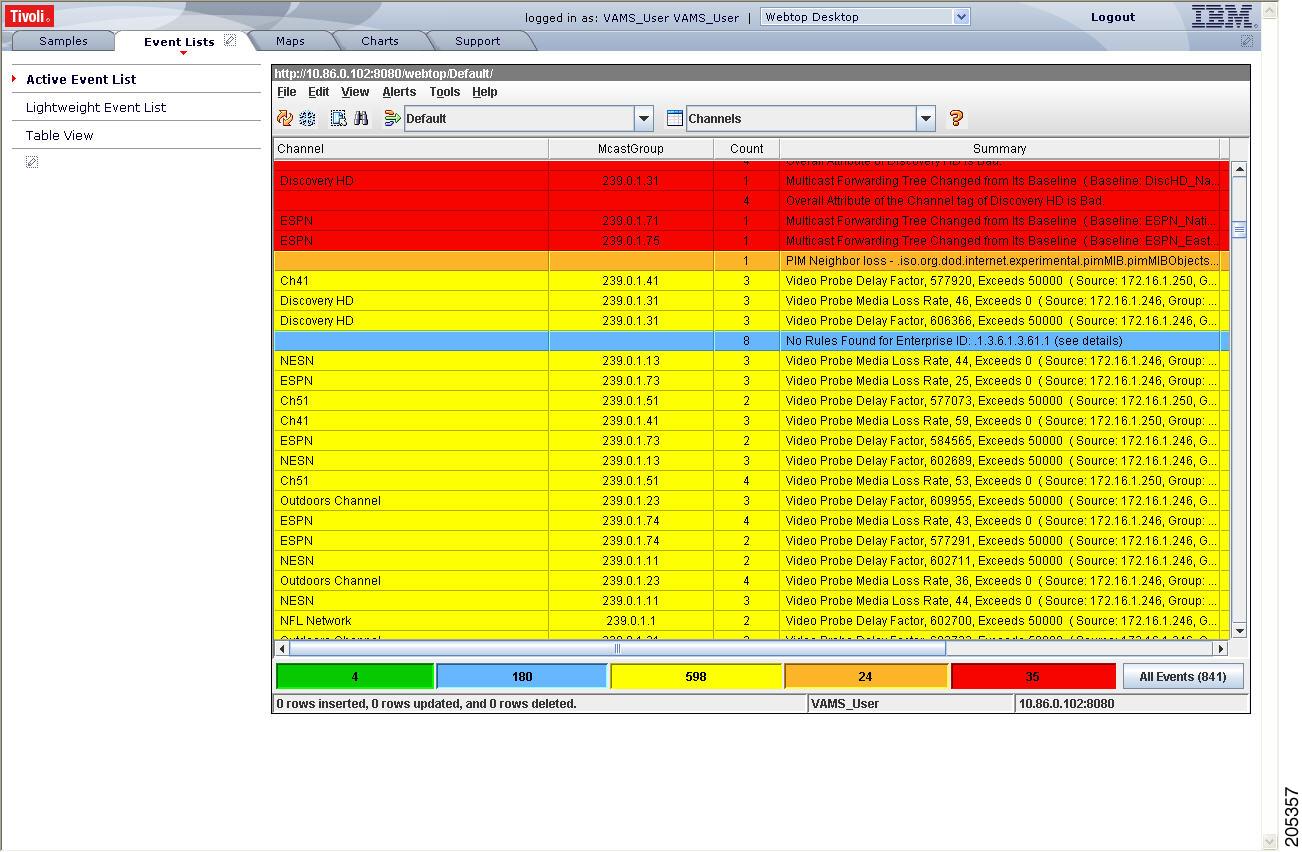
The Active Event List shows ANA events and CMM events. These events are sent from the CMM video probes by means of the MTTrapd probe. The Active Event List also shows events from the IneoQuest, Bridge Tech, Mixed Signals, and Pixelmetrix video probes.
Step 4 ![]() To view the details of an event, double-click on the row for the event.
To view the details of an event, double-click on the row for the event.
A table giving detailed field information for the event appears.
Step 5 ![]() To launch the CMM application, highlight an event, and then from the Alerts Menu, choose VAMS Tools > Region Name > Launch CMM.
To launch the CMM application, highlight an event, and then from the Alerts Menu, choose VAMS Tools > Region Name > Launch CMM.
Note ![]() You can launch a real-time CMM flow trace or you can launch the CMM Latest Events page for further troubleshooting.
You can launch a real-time CMM flow trace or you can launch the CMM Latest Events page for further troubleshooting.
Note ![]() The Region Name value is configurable. For information on configuring the Region Name in TBSM, see the IBM Tivoli TBSM documentation at the following URL:
The Region Name value is configurable. For information on configuring the Region Name in TBSM, see the IBM Tivoli TBSM documentation at the following URL:
http://publib.boulder.ibm.com/infocenter/tivihelp/v3r1/topic/com.ibm.tivoli.itbsm.doc/tbsm42custom.pdf
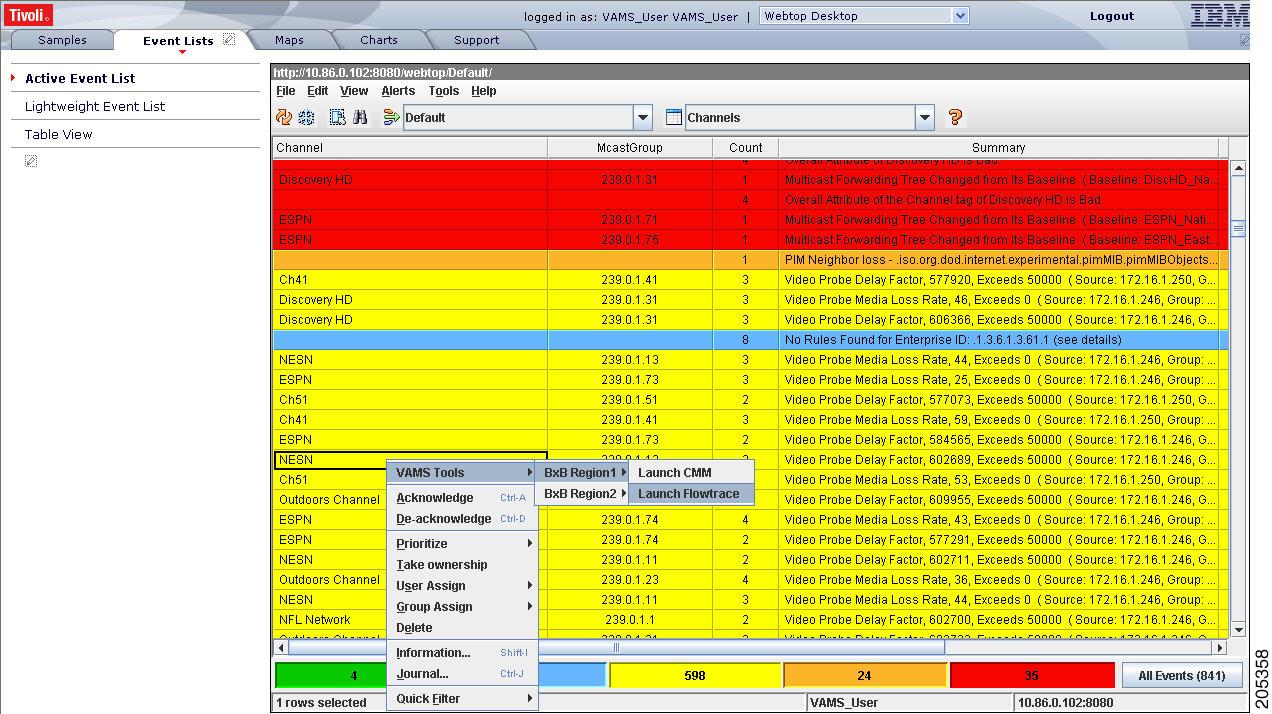
Note ![]() It is possible to have one or more CMM servers available to launch to. The example in Figure 6-6 shows two regional CMM servers reporting events to a single CIC server.
It is possible to have one or more CMM servers available to launch to. The example in Figure 6-6 shows two regional CMM servers reporting events to a single CIC server.
Figure 6-6 shows the menu selections for starting CMM.
Figure 6-6 Launching CMM from Webtop
For detailed information on the Netcool/Webtop tool, see the following IBM Netcool/Webtop documents on the IBM Tivoli Netcool web site:
•![]() IBM Tivoli Netcool/Webtop QuickStart Guide
IBM Tivoli Netcool/Webtop QuickStart Guide
•![]() IBM Tivoli Netcool/Webtop Administration Guide
IBM Tivoli Netcool/Webtop Administration Guide
Advanced Troubleshooting with CMM and TBSM
CMM provides a diagnostics tool that gives you a multicast global view and a router-specific view of your network. Webtop events that you can view using TBSM allow you to see additional details about the network.
Table 6-1 lists important areas of the CMM that you can use to troubleshoot a multicast video distribution network using Cisco VAMS:
|
|
|
|---|---|
Viewing network status |
View the status of all devices in the current multicast domain. See: http://www.cisco.com/en/US/products/ps6337/products_user_guide_chapter09186a0080834d83.html |
Viewing RP status |
View all routers in the database, their RPs, and the active groups. See: http://www.cisco.com/en/US/products/ps6337/products_user_guide_chapter09186a0080834d83.html |
IGMP diagnostics |
View the interfaces that have joined a particular group. See: http://www.cisco.com/en/US/products/ps6337/products_user_guide_chapter09186a0080834d83.html |
Layer 2 switches |
View Layer 2 multicast information and host IPs. The table shows, from a Layer 2 perspective, which multicast groups are being forwarded out which interfaces. See: http://www.cisco.com/en/US/products/ps6337/products_user_guide_chapter09186a0080834d83.html |
Cisco 6500/7600 troubleshooting |
Gather accurate packet-forwarding statistics and other information. See: http://www.cisco.com/en/US/products/ps6337/products_user_guide_chapter09186a0080834d83 |
Top-20 video flows |
View the top-20 video flows. The top-20 video flows are dynamically updated at every polling interval. See: http://www.cisco.com/en/US/products/ps6337/products_user_guide_chapter09186a0080834d83.html |
Video probe status1 |
View diagnostic information about video probes and the flows that they are monitoring. See: http://www.cisco.com/en/US/products/ps6337/products_user_guide_chapter09186a0080834d83.html |
Video Flow Tracing |
Video flows can be traced through the network. All routers participating in the transport of the multicast flow are listed. A graphical representation of the flow path is provided which includes IneoQuest probes and their status for a given flow. |
PPS/BPS Threshold Monitoring |
PPS/BPS threshold monitoring allows you to set and monitor thresholds on Cisco routers and switches for high or low BPS or PPS rates on a per flow basis. See Monitoring Multicast Tree Changes (Tree Polling) for details on PPS/BPS threshold monitoring. |
Monitoring Multicast Tree Changes (Tree Polling) |
View changes to multicast trees, which might affect video quality immediately, or at some time in the future. Tree polling allows you to monitor the multicast distribution tree of a video service and receive an alert when changes to the distribution tree occur. See: • • http://www.cisco.com/en/US/docs/net_mgmt/cisco_multicast_manager/2.5/user/guide/cmm_mon.html |
Health Checks |
You can perform health checks to check and report on the critical components of your network. For example, you can check on the status of Rendezvous Points (RPs), Multicast Source Discovery Protocol (MSDP) peering, the presence of sources and groups, and the status of multicast trees. See: • http://www.cisco.com/en/US/docs/net_mgmt/cisco_multicast_manager/2.5/user/guide/cmm_dt.html |
Monitoring IP Multicast Heartbeat |
You can monitor IP multicast heartbeat to confirm that the devices forwarding a traffic stream are functioning correctly. See Monitoring IP Multicast Heartbeat. |
1 Cisco Multicast Manager 2.5.4 supports only the IneoQuest video probe. |
Monitoring Multicast Tree Changes (Tree Polling)
You can monitor multicast tree changes with CIC, and from CIC, launch CMM for advanced troubleshooting of the tree changes.
Monitoring Multicast Tree Changes with CIC
To monitor multicast tree changes with CIC, bring up a Webtop event list using CIC/TBSM:
Step 1 ![]() From the service tree directory browser at the left of the CIC/TBSM display, click on a service.
From the service tree directory browser at the left of the CIC/TBSM display, click on a service.
The service tree for the selected service appears.
Step 2 ![]() Click on a specific device address.
Click on a specific device address.
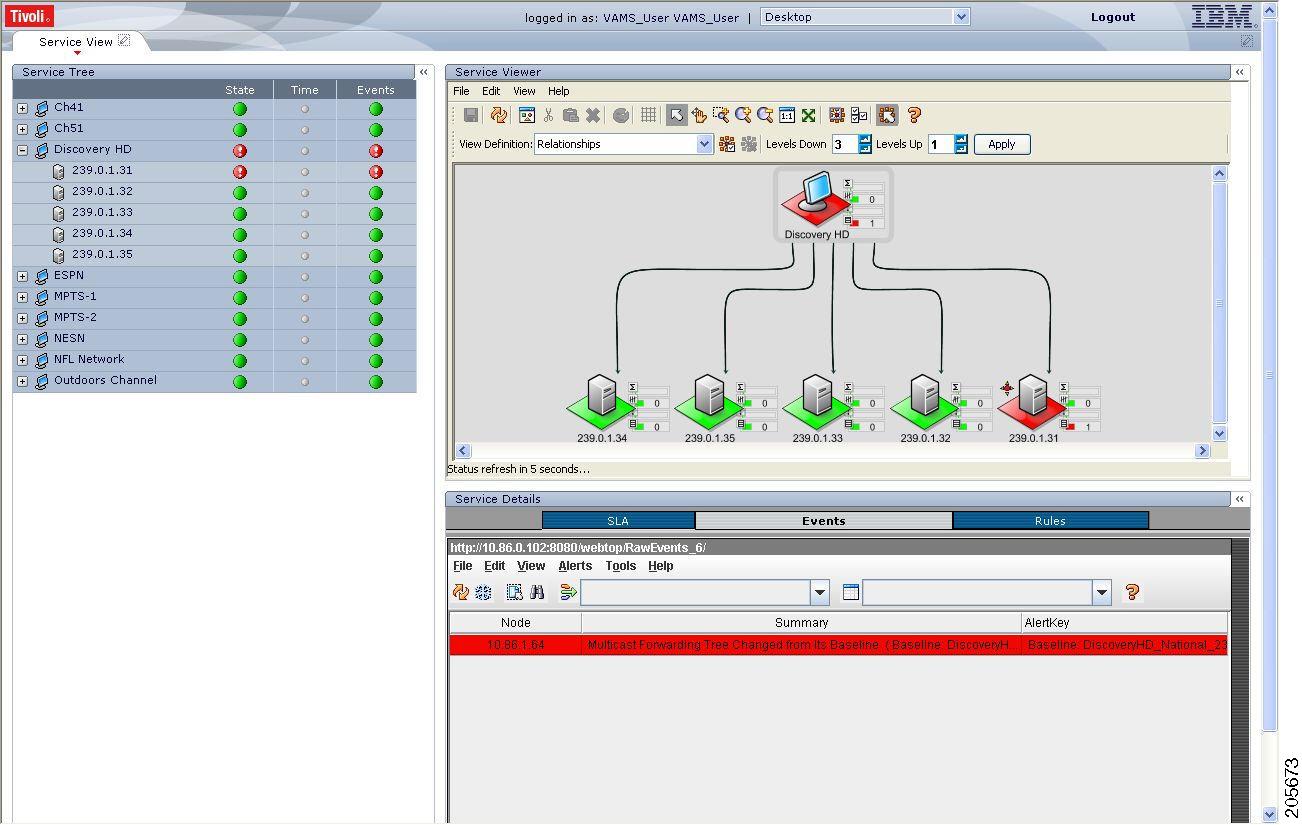
The Service Viewer displays the network topology an the Service Details window shows an event list for the service.
Figure 6-7 shows a CIC/TBSM display and a Webtop event indicating that a Multicast Forwarding Tree has changed from its baseline.
Figure 6-7 Viewing a Tree Change Event in TBSM/Webtop
Step 3 ![]() To view the details of an event, double-click on the row for the event.
To view the details of an event, double-click on the row for the event.
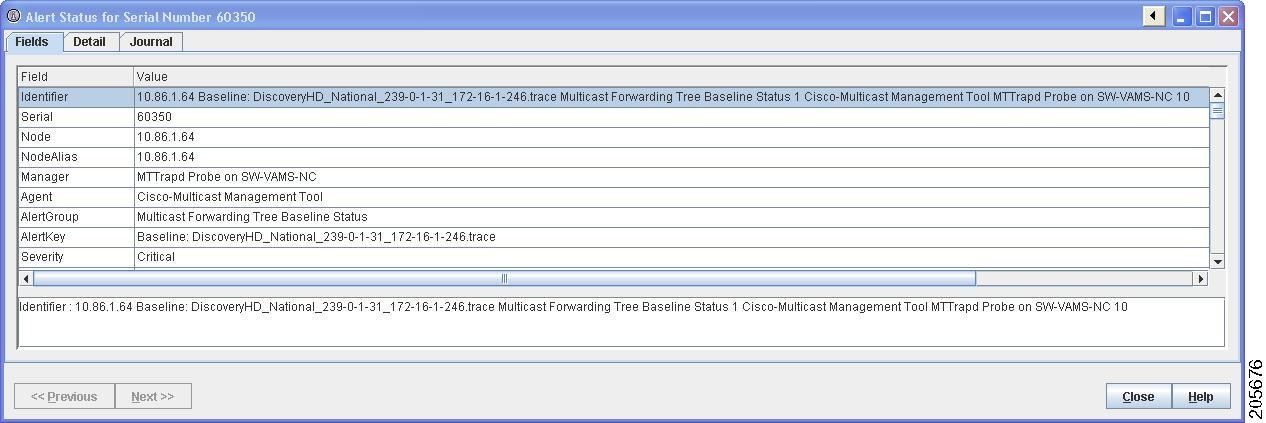
A table giving detailed field information for the tree change event appears. Figure 6-8 shows a sample Alerts Status page with tree change event details.
Figure 6-8 Detailed Tree Change Event Information
Step 4 ![]() To launch the CMM application and monitor additional information about the tree change event, highlight an event, and then from the Alerts Menu, choose VAMS Tools > Region Name > Launch CMM.
To launch the CMM application and monitor additional information about the tree change event, highlight an event, and then from the Alerts Menu, choose VAMS Tools > Region Name > Launch CMM.
Step 5 ![]() Go to the Monitoring Multicast Tree Changes with CMM for information on monitoring tree change events with CMM.
Go to the Monitoring Multicast Tree Changes with CMM for information on monitoring tree change events with CMM.
Monitoring Multicast Tree Changes with CMM
Using CMM, you can:
•![]() View the latest tree change events.
View the latest tree change events.
•![]() View a Tree Changed Report that shows details about the changes in the tree
View a Tree Changed Report that shows details about the changes in the tree
When you launch CMM from TBSM/CIC, the CMM Latest Events list appears. Figure 6-9 shows a Latest Events list from CMM that includes tree change events.
Figure 6-9 CMM Tree Change Events
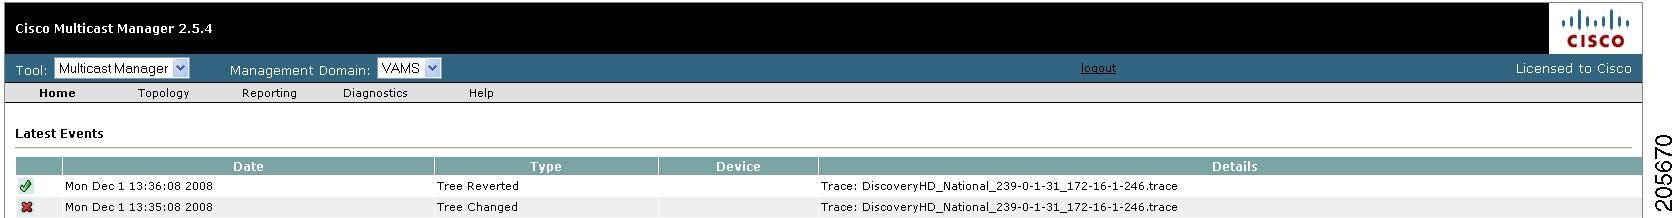
The event list in the figure shows two events:
•![]() The first event to come in is a Tree Changed event indicating that a tree has been changed.
The first event to come in is a Tree Changed event indicating that a tree has been changed.
The Tree Changed event indicates the name of the trace file that was used as the baseline to compare the current distribution tree against. The format of the trace file name shown in the event is the same format that you use to specify the trace file name when during Tree Polling configuration for the domain.
The trace file name has this format:
<channel name>_<ad zone>_<Mcast-Group>_<source-IP>
where channel_name is the name of the channel, ad_zone is the name of the Ad zone, Mcast-Group is the address of the multicast group, and source-IP is the IP address of the source. For example:
PBS_National_232-0-1-32_12-101-2-18
•![]() The second event to come in is a Tree Reverted event that indicates that the tree reverted back to its previous state. This trap has the same format as the Tree Changed event (indicates the filename of the trace file was used as the baseline to compare against).
The second event to come in is a Tree Reverted event that indicates that the tree reverted back to its previous state. This trap has the same format as the Tree Changed event (indicates the filename of the trace file was used as the baseline to compare against).
Viewing a Tree Changed Report
To view a Tree Changed Report:
Step 1 ![]() If you are in the TBSM/CIC interface, highlight an event, and then from the Alerts Menu, choose VAMS Tools > Region Name > Launch CMM.
If you are in the TBSM/CIC interface, highlight an event, and then from the Alerts Menu, choose VAMS Tools > Region Name > Launch CMM.
The CMM Latest Events page appears.
Step 2 ![]() From the CMM Home Page, select Reporting > Tree Report.
From the CMM Home Page, select Reporting > Tree Report.
The Multicast Tree Report page appears, as shown in Figure 6-10.
Figure 6-10 Selecting a Tree Change Report

Step 3 ![]() Select the baseline trace file that matches the Tree Changed event.
Select the baseline trace file that matches the Tree Changed event.
A list of Multicast Tree Change reports for the baseline appears, as shown in Figure 6-11.
Figure 6-11 Multicast Tree Change Report
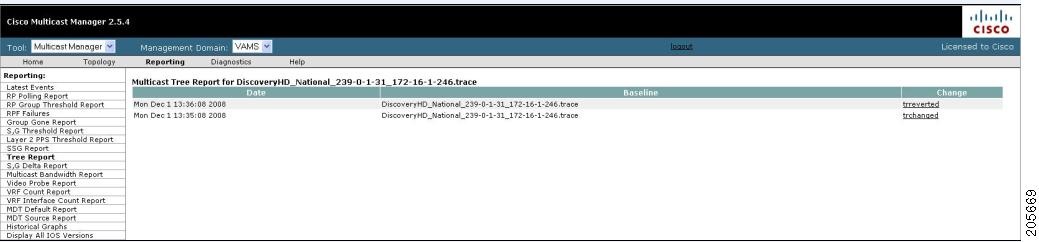
Step 4 ![]() Click the trchange link to view the Tree Changed Report.
Click the trchange link to view the Tree Changed Report.
The selected Tree Changed Report appears. The report shows:
•![]() A table containing detailed information about the routers and interfaces in the tree
A table containing detailed information about the routers and interfaces in the tree
•![]() The baseline tree.
The baseline tree.
•![]() The current tree (changed tree).
The current tree (changed tree).
Routers and interfaces that are no longer part of the multicast tree are highlighted in red. Routers and interfaces that have been added to the distribution tree are highlighted in green.
Step 5 ![]() If you want to view a Tree Reverted report, click the trreverted link next to a report name.
If you want to view a Tree Reverted report, click the trreverted link next to a report name.
A Tree Reverted report shows the baseline distribution tree in tabular and in graphical format.
Figure 6-12 shows a sample Tree Changed Report.
Figure 6-12 Tree Changed Report

Monitoring IP Multicast Heartbeat
You can monitor the multicast data plane of multicast video flows on Cisco routers and switches that utilize the IP Multicast Heartbeat feature to confirm that the routers and switches are receiving the monitored multicast video flows. You can view heartbeat events with CIC, and from CIC, launch CMM for advanced troubleshooting of the heartbeat events.
Monitoring Heartbeat Events with CIC/TBSM
To view heartbeat events in TBSM/Webtop:
Step 1 ![]() From the service tree directory browser at the left of the TBSM display, click on a service.
From the service tree directory browser at the left of the TBSM display, click on a service.
The service tree for the selected service appears.
Step 2 ![]() Click on a specific device address.
Click on a specific device address.
The Service Viewer displays the network topology and the Service Details window shows an event list for the service.
Figure 6-13 shows a Webtop/TBSM display with a heartbeat event indicating that a a heartbeat threshold has been violated on a router.
Figure 6-13 Viewing a Heartbeat Event in TBSM/Webtop
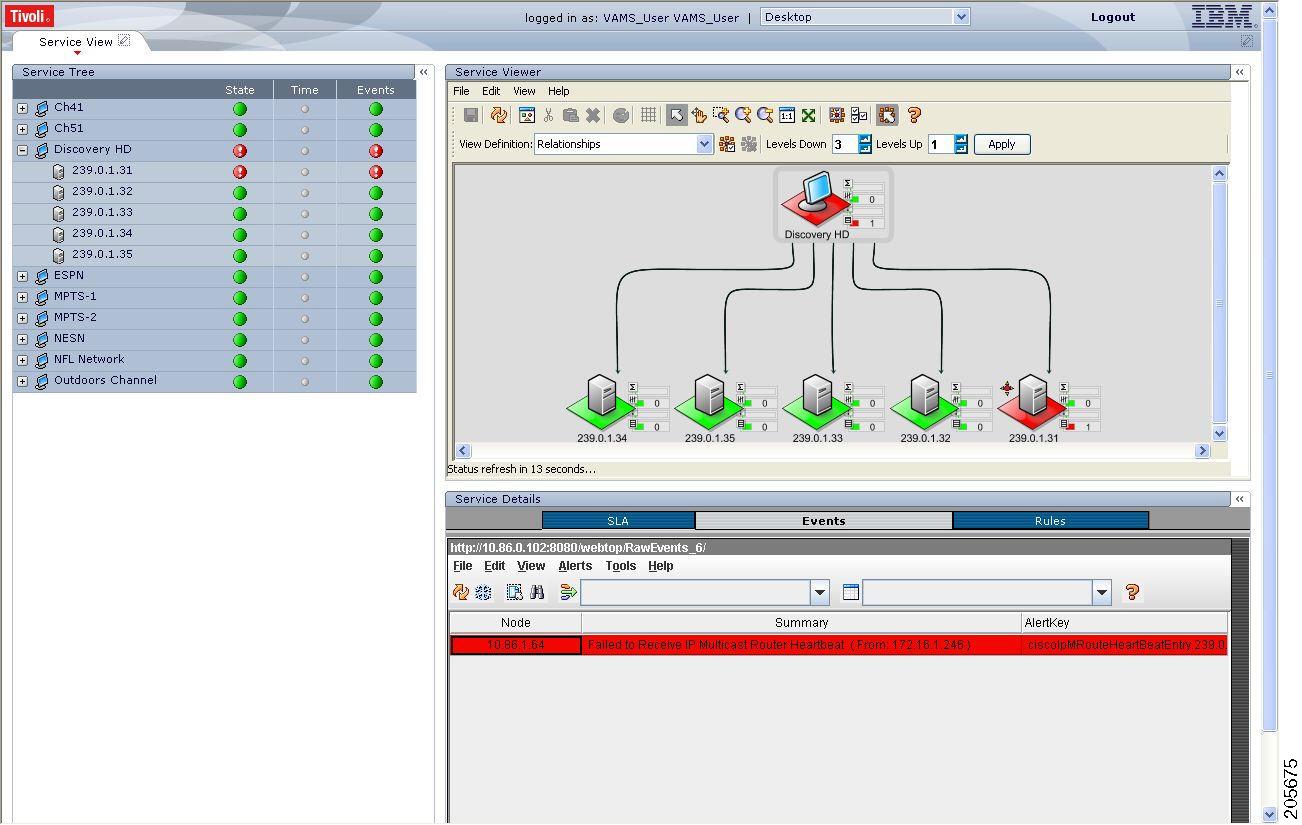
The Summary column shows the IP address of the router that generated the heartbeat event.
Step 3 ![]() To view additional details about the event, double click on the event in the Webtop display.
To view additional details about the event, double click on the event in the Webtop display.
Figure 6-14 shows a sample Alerts Status page with heartbeat event details.
Figure 6-14 TBSM/Webtop: Viewing Heartbeat Event Details
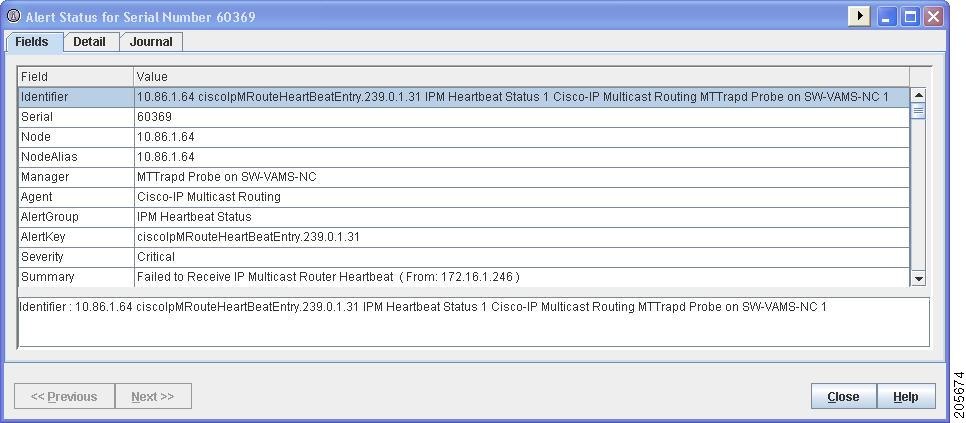
The event summary for the service details includes the baseline trace file name, which includes the Service Name, Ad Zone, Multicast Group, and Source Address.
Step 4 ![]() To launch the CMM application and monitor additional information about the heartbeat event, highlight an event, and then from the Alerts Menu, choose VAMS Tools > Region Name > Launch CMM.
To launch the CMM application and monitor additional information about the heartbeat event, highlight an event, and then from the Alerts Menu, choose VAMS Tools > Region Name > Launch CMM.
Step 5 ![]() Go to the Monitoring Heartbeat Events with CMM for information on monitoring heartbeat events with CMM.
Go to the Monitoring Heartbeat Events with CMM for information on monitoring heartbeat events with CMM.
Monitoring Heartbeat Events with CMM
To view IP Multicast heartbeat events with CMM:
Step 1 ![]() If you are in the TBSM/CIC interface, highlight an event, and then from the Alerts Menu, choose VAMS Tools > Region Name > Launch CMM.
If you are in the TBSM/CIC interface, highlight an event, and then from the Alerts Menu, choose VAMS Tools > Region Name > Launch CMM.
The CMM home page shows the Latest Events list, which includes any heartbeat events that have come in.
Figure 6-15 shows a Latest Events list with a heartbeat event.
Figure 6-15 Viewing a Heartbeat Event in CMM
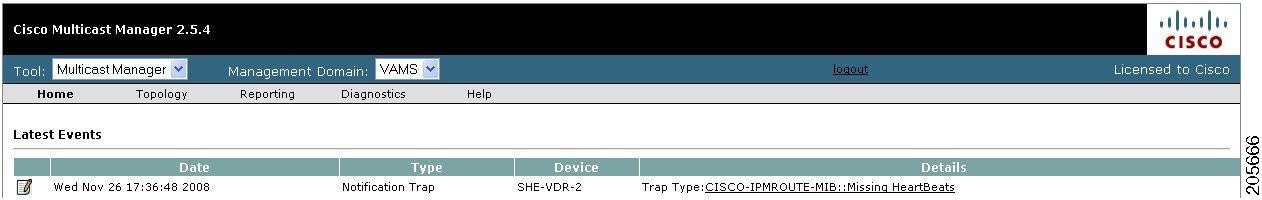
The heartbeat event includes the name of the SNMP MIB used to forward the event and the name of the event; however, CMM 2.5.4 does not indicate the name of the Multicast Group or the Channel Name on the Latest Events page for heartbeat events.
Step 2 ![]() To view additional information about the heartbeat event click the URL link in the Details column.
To view additional information about the heartbeat event click the URL link in the Details column.
A Trap Details list appears for the heartbeat event, as shown in Figure 6-16.
Figure 6-16 Trap Details List for a Heartbeat Event
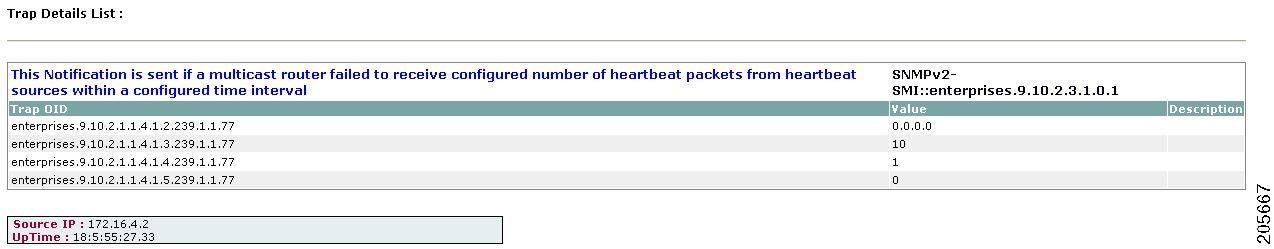
The Trap Details list displays the full description of the heartbeat event, the SNMP version used to generate the event, and the OIDs from the reporting router.
The last four octets of the OID indicate the Multicast Group. The Source IP address at the bottom of the Trap Details page is the IP address of the reporting router.
Step 3 ![]() To determine the video service affected by the event, select Diagnostics > Show All Groups and find the corresponding Multicast Group in the list that matches the heartbeat event. Note that CIC/TBSM parses the heartbeat event to and matches the Multicast Group to the corresponding video service directly.
To determine the video service affected by the event, select Diagnostics > Show All Groups and find the corresponding Multicast Group in the list that matches the heartbeat event. Note that CIC/TBSM parses the heartbeat event to and matches the Multicast Group to the corresponding video service directly.
Performing Health Checks
Using the Health Check page, you can run a health check on a multicast domain.
To run a health check:
Step 1 ![]() On the Multicast Manager tool, select Diagnostics > Health Check.
On the Multicast Manager tool, select Diagnostics > Health Check.
The Select Health Check page appears.
Step 2 ![]() Select a health check from the list of health checks and click Run.
Select a health check from the list of health checks and click Run.
Figure 6-17 shows a sample health check display.
Figure 6-17 Health Check
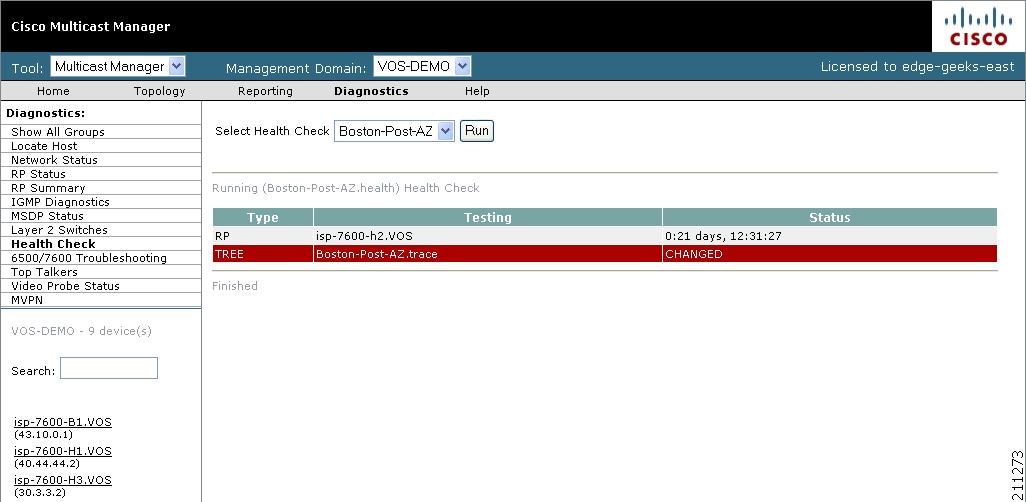
The color of the displayed text on the Health Check display indicates the status of the monitored condition:
•![]() Gray = normal
Gray = normal
•![]() White = normal
White = normal
•![]() Red = error condition
Red = error condition
Monitoring PPS/BPS Thresholds
When a PPS/BPS threshold is exceeded or fails to reach a minimum value, an event is generated and the event is displayed in CIC, in the TBSM/Webtop. From the TBSM/Webtop event list, you can launch CMM to view enhanced monitoring information about the threshold event.
Monitoring PPS/BPS Thresholds in CIC TBSM/Webtop
To view heartbeat events in TBSM/Webtop:
Step 1 ![]() From the service tree directory browser at the left of the TBSM display, click on a service.
From the service tree directory browser at the left of the TBSM display, click on a service.
The service tree for the selected service appears.
Step 2 ![]() Click on a specific device address.
Click on a specific device address.
The Service Viewer displays the network topology and the Service Details window shows an event list for the service.
Figure 6-18 shows a Webtop/TBSM display with a threshold event indicating that high and low threshold limits have been exceeded.
Figure 6-18 Viewing a Threshold Event in TBSM/Webtop
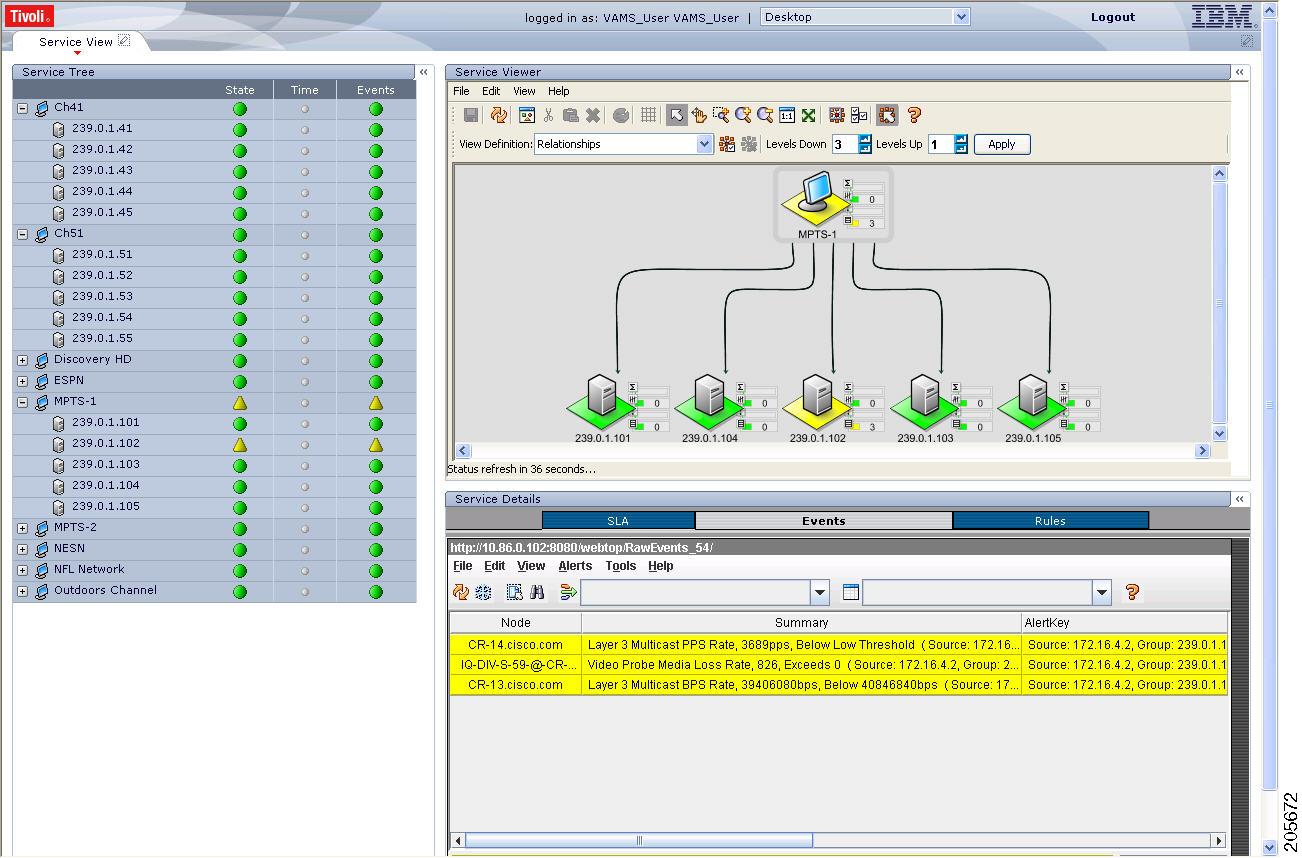
The event summary for threshold events includes the measured value and the configured threshold.
Step 3 ![]() To view additional details about the event, double-click on the event in the event list.
To view additional details about the event, double-click on the event in the event list.
Step 4 ![]() To launch the CMM application and monitor additional information about the threshold events, highlight an event, and then from the Alerts Menu, choose VAMS Tools > Region Name > Launch CMM.
To launch the CMM application and monitor additional information about the threshold events, highlight an event, and then from the Alerts Menu, choose VAMS Tools > Region Name > Launch CMM.
Step 5 ![]() Go to the Monitoring Threshold Events with CMM for information on monitoring heartbeat events with CMM.
Go to the Monitoring Threshold Events with CMM for information on monitoring heartbeat events with CMM.
Monitoring Threshold Events with CMM
To view threshold events with CMM:
Step 1 ![]() If you are in the TBSM/CIC interface, highlight an event, and then from the Alerts Menu, choose VAMS Tools > Region Name > Launch CMM.
If you are in the TBSM/CIC interface, highlight an event, and then from the Alerts Menu, choose VAMS Tools > Region Name > Launch CMM.
The CMM home page shows the Latest Events list, which includes any BPS/PPS threshold events that have come in.
Figure 6-19 shows a Latest Events list with a BPS/PPS threshold events.
Figure 6-19 Viewing BPS/PPS Threshold Events in CMM
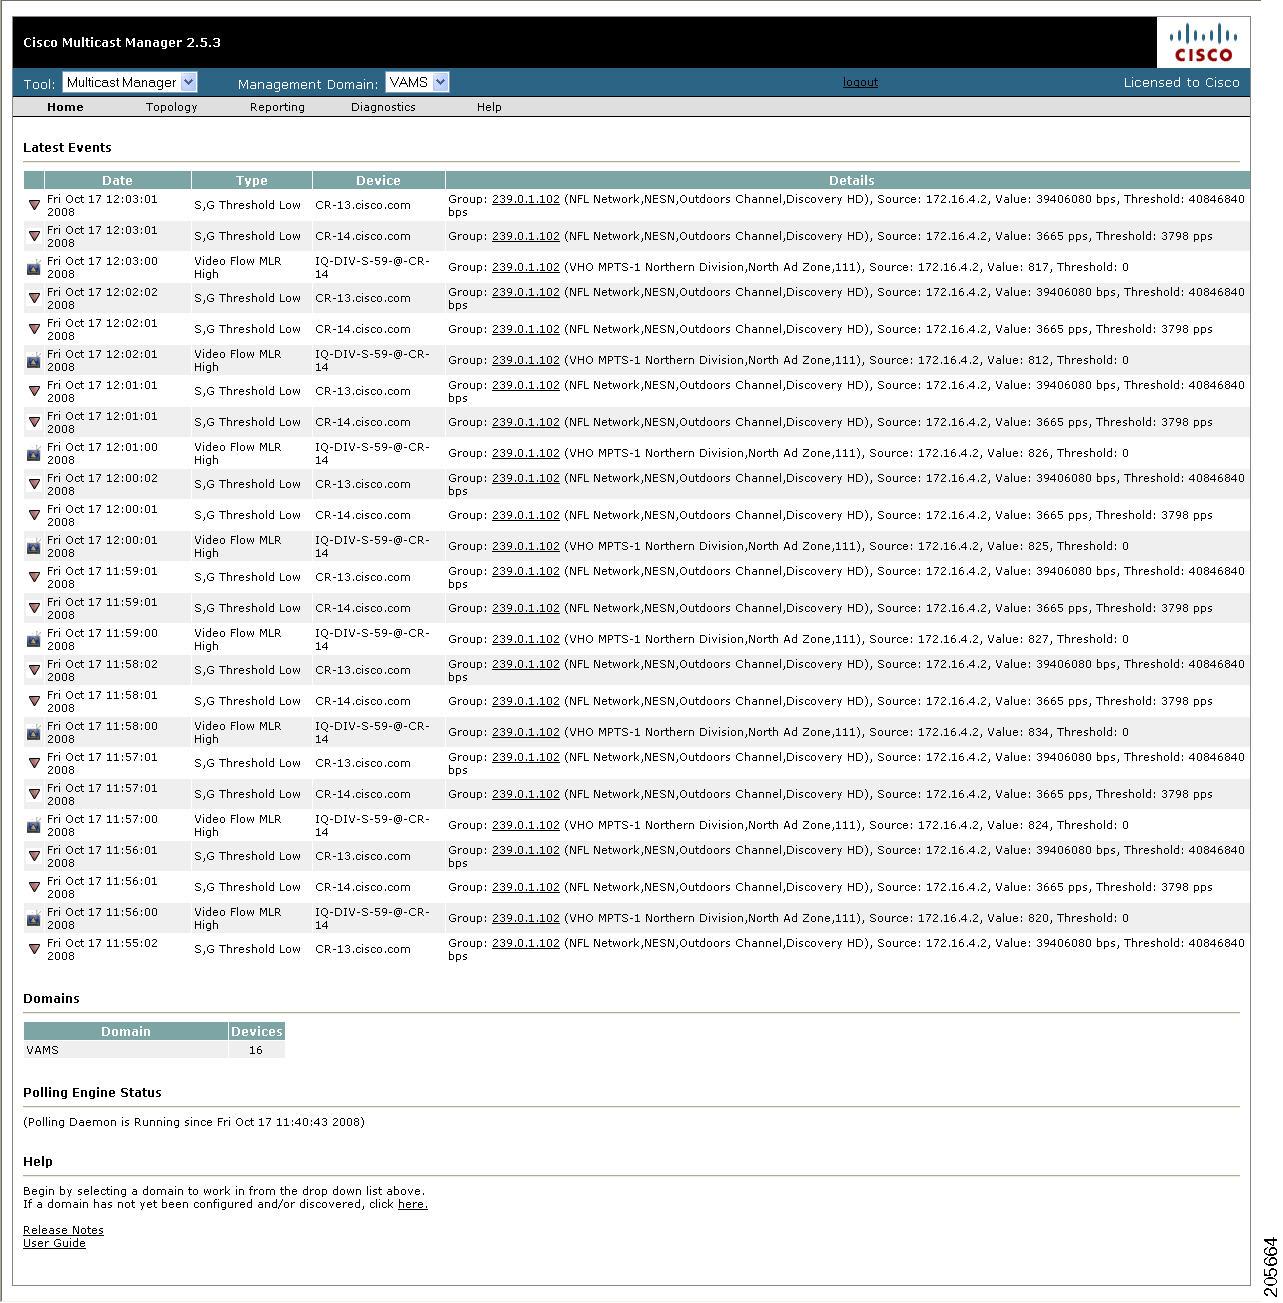
The Details column for BPS/PPS threshold events includes the measured value and the configured threshold.
Note ![]() CMM 2.5.4 does not reflect the BPS/PPS flow status on CMM flow traces, as it does for video probe status. Therefore, you will have to manually correlate the devices reporting BPS/PPS events from either CIC/TBSM or the CMM Latest Events page, to the CMM flow trace, to isolate where in the distribution tree the problem is occurring.
CMM 2.5.4 does not reflect the BPS/PPS flow status on CMM flow traces, as it does for video probe status. Therefore, you will have to manually correlate the devices reporting BPS/PPS events from either CIC/TBSM or the CMM Latest Events page, to the CMM flow trace, to isolate where in the distribution tree the problem is occurring.
Running Threshold Reports
CMM provides two threshold reports that you can use to monitor threshold events:
•![]() S, G Threshold Report—Shows threshold events for a specified source and group.
S, G Threshold Report—Shows threshold events for a specified source and group.
•![]() Layer 2 PPS Threshold Report—Shows threshold events for a specified port on a specified switch.
Layer 2 PPS Threshold Report—Shows threshold events for a specified port on a specified switch.
To run an S, G Threshold report:
Step 1 ![]() In the CMM Multicast Manager tool, click Reporting.
In the CMM Multicast Manager tool, click Reporting.
Step 2 ![]() Select S, G Threshold Report.
Select S, G Threshold Report.
A list of groups appears.
Step 3 ![]() Select a group from the list and then click Report.
Select a group from the list and then click Report.
CMM displays an S,G Threshold Report listing any events that have occurred in the last 24 hours.
To run a Layer 2 PPS Threshold report:
Step 1 ![]() In the CMM Multicast Manager tool, click Reporting.
In the CMM Multicast Manager tool, click Reporting.
Step 2 ![]() Select Layer 2 PPS Threshold Report.
Select Layer 2 PPS Threshold Report.
A list of groups appears.
Step 3 ![]() Select a group from the list and then click Report.
Select a group from the list and then click Report.
CMM displays a Layer 2 PPS Threshold Report listing any events that have occurred in the last 24 hours.
Monitoring and Troubleshooting in the Wireline Network
The Cisco Wireline Video/IPTV Solution Design and Implementation Guide, Release 1.1, provides an introduction to monitoring and troubleshooting the Cisco Ethernet switches in the Cisco wireline-based IPTV solution. Troubleshooting areas include:
•![]() Network Time Protocol (NTP)
Network Time Protocol (NTP)
•![]() Syslog
Syslog
•![]() Quality of Service (QoS)
Quality of Service (QoS)
•![]() Multicast
Multicast
Monitoring and troubleshooting information is viewable online at:
Monitoring and Troubleshooting in the Cable Network
The Cisco Gigabit-Ethernet Optimized Video Networking Solution for Cable Design and Implementation Guide, Release 3.0, provides an introduction to monitoring and troubleshooting the Cisco Ethernet switches in the Cisco cable-based IPTV solution. Troubleshooting areas include:
•![]() Troubleshooting multicast.
Troubleshooting multicast.
•![]() Show commands.
Show commands.
•![]() Debug commands.
Debug commands.
•![]() Viewing hardware rate limiter (HWRL) counters.
Viewing hardware rate limiter (HWRL) counters.
Monitoring and troubleshooting information is viewable online at:
Troubleshooting with Cisco ANA
Troubleshooting with Cisco ANA requires an understanding of the Cisco ANA fault-management system. You should also understand how to use ANA NetworkVision and ANA EventVision.
This section contains:
Fault Management
Table 6-2 highlights important aspects of the fault management system in Cisco ANA.
ANA NetworkVision
Network administrators use Cisco ANA NetworkVision to manage, fulfill, plan, and assure the integrity of network resources. Table 6-3 lists important aspects of using Cisco ANA NetworkVision for troubleshooting.
ANA EventVision
You use Cisco ANA EventVision to view, filter, and display the properties of specific events. Table 6-4 lists important aspects of using Cisco ANA EventVision for troubleshooting.
 Feedback