Collecting Logs from Cisco MDS 9000 Switches and DCNM
Available Languages
Bias-Free Language
The documentation set for this product strives to use bias-free language. For the purposes of this documentation set, bias-free is defined as language that does not imply discrimination based on age, disability, gender, racial identity, ethnic identity, sexual orientation, socioeconomic status, and intersectionality. Exceptions may be present in the documentation due to language that is hardcoded in the user interfaces of the product software, language used based on RFP documentation, or language that is used by a referenced third-party product. Learn more about how Cisco is using Inclusive Language.
- US/Canada 800-553-2447
- Worldwide Support Phone Numbers
- All Tools
 Feedback
 Feedback
The show logging onboard command
What Evidence to Get for Different Problem Types
Collecting tech-support files Using NX-OS CLI
Using DCNM SAN Java Client Run CLI Commands
Copying files from Switches to Your Laptop
Collecting the tech-support file for the DCNM Server
Uploading the tech-support file to the Cisco TAC
Preparing to Call the Cisco TAC
Note: The documentation set for this product strives to use bias-free language. For the purposes of this documentation set, bias-free is defined as language that does not imply discrimination based on age, disability, gender, racial identity, ethnic identity, sexual orientation, socioeconomic status, and intersectionality. Exceptions may be present in the documentation due to language that is hardcoded in the user interfaces of the product software, language used based on RFP documentation, or language that is used by a referenced third-party product.
For any storage network administrator that has encountered an issue with their SAN (hardware, software, misconfiguration), the call to the Cisco Technical Assistance Center (TAC) is often the inevitable next step. Cisco TAC will promptly respond and verify you are entitled to receive support, thanks to a valid service contract (SmartNet Total Care). Then Cisco TAC will typically request one or more tech-support files. These tech-support files serve as the baseline amount of information to start a proper troubleshooting action. But what is the tech-support file? How do you generate it? How can you share it with the Cisco TAC? This document will show the best way to collect logs from Cisco MDS 9000 Switches and its management application, Cisco Data Center Network Manager (DCNM). It also shows what logs are the most useful in what situation.
When the unexpected happens and some problem surfaces, it is always good to know how to start the investigation. Most Cisco products, MDS 9000 Switches included, have a method of gathering wide variety of switch information via single command called a ‘tech-support’. The collected information comprises both configuration parameters and some logs. By comparing logs from different devices, you can also discover some additional insights, like determine the root cause of an issue. A log is essentially an official record of events, a machine-generated list of occurrences displayed in temporal order. The widespread adoption of logs has contributed to their variety. An attempt could be made to categorize and differentiate logs as event logs, transaction logs, message logs, or accounting logs. Log files are often the primary data source for system observability. They can be used in real time, to follow step-by-step execution of a process, or post-mortem, to determine where the process halted and what error was encountered, or which administrator committed a specific action (auditing). Log files serve multiple purposes, and their monitoring and analysis can benefit an organization in several ways. Many times, the tech-support file is improperly referred to as the log file, but that is not accurate. The tech-support file includes some logs, but it is not just a log. It is more than that. A tech-support file is an aggregation of many, mostly show, commands. Some tech-support files are for a specific component or service in the MDS 9000 Switches, like FSPF or FLOGI. Some tech-support files point to specific module-level information, and other tech-support files are aggregations of multiple other tech-support files. All tech-support files are gathered by issuing the show tech-support <type> command.
Individual logs on MDS 9000 Switches are very detailed, but you need to know all possible logs of interest for your specific need and there are many. To properly troubleshoot challenging situations, you need to correlate information from a set of logs from the same device or even different devices. You also need to associate the information provided by logs with other information describing the setup and its configuration. Cisco adopted an approach whereby a multitude of key logs is combined with other useful information reflecting the device inventory and configuration so that a careful and meaningful analysis is possible for a support engineer. This is the famous tech-support file, and it represents the baseline data collection for all types of problems. In simple terms, tech-support files are preferred to individual log files because they make troubleshooting easier. Before contacting Cisco TAC, you are encouraged to collect this baseline tech-support file and upload it when you open a service request (SR). In some cases, this will suffice. In other cases, Cisco TAC will require a supplement of information and a higher level of details, possibly asking to upload additional log files.
Some more information about the award-winning Cisco TAC organization, the definition of severity levels, and useful contacts can be found here:
https://www.cisco.com/c/en/us/support/web/tac/technical-services-resource-guide.html
There are multiple ways to collect tech-support files and prepare them for sharing or future investigation. The most used approach is by using the Cisco NX-OS command-line interface (CLI) and its specific set of commands. This is the historical and well-known approach when dealing with switches one by one. There are two main commands used to gather information for troubleshooting:
● The show tech-support command
● The show logging onboard command
The alternative approach would be via the DCNM graphical user interface. This approach has multiple facets because DCNM offers a web user interface, an embedded Device Manager, and a SAN Java client.
In this document, we will focus on the typical procedure to collect the necessary log files and be well positioned to open an SR with the Cisco TAC.
The show tech-support <type> command is useful when troubleshooting a problem because it collects a large amount of information about your switch via one command. The output from this command varies depending on your device and its configuration and can be provided to Cisco TAC when reporting a problem. The show tech-support command is not used to display such a large quantity of information on a terminal. Instead, it is used to generate a tech-support file.
The show tech-support command is quite comprehensive with many different types available. Some show tech-support commands contain other show tech-support commands nested inside. The key is to select the proper type of tech-support that best fits your problems. To keep it simple, the tech-support types referenced in this document will be limited to:
● details – Used for most problems except congestion or performance issues.
● module – Used when there are specific switching module or port level problems.
● slowdrain – Used for when there are performance, congestion, and slow-drain problems.
● fcip – Used when troubleshooting FCIP interfaces.
The show tech-support details command includes the following show commands (as well as many others) and will display their output in series, one after the other:
● show switchname
● show interface mgmt0
● show version
● show environment
● show module
● show hardware
● show running-config
● show interface
● show accounting log
● show process
● show license
● show system internal flash
● show interface transceivers details
● show tech-support flogi, fcns, zone, rscn, and so on.
Many more show commands are included, with some dependence on the switch model and specific switching modules that are installed in the chassis. If you are curious to know what commands are used to generate the output of the technical support file, you can satisfy your curiosity by trying this NX-OS command (available with most <type> parameters):
switch# show tech-support <type> commands
Indeed, you will see there are several show commands, way too many to list here and sometimes even under update from one NX-OS release to the next one for serving the customers in the best possible way.
The show logging onboard command
Each module in a Cisco MDS 9000 switch logs various information in a persistent way to its NVRAM and this capability is called Onboard Failure Logging (OBFL). This information is time-stamped giving the ability to look back in time and investigate a problem that occurred in the past. The OBFL functionality on Cisco MDS 9000 switches is similar to a black box on aircrafts.
The show logging onboard command displays that information on a per-module basis. For fabric switches, there is only one module: ‘module 1’. For directors, there are up to 18 separate modules.
OBFL contains different types of information like TxWait for congestion and error-stats for error counters. Most OBFL types store their information in cyclical buffers of various sizes. The amount of time the cyclical buffer contains (how far in the past it can go) depends on the size of that buffer and the rate of new entries being recorded in it. Different types of OBFL buffers on different modules will certainly go back different amounts of time because the rate of entries recorded will be different. Key OBFL concepts:
● Most information is in cyclical buffers
● For most types, new entries are recorded at regular intervals when values change not as they occur
● Most information is date and time stamped
● For most OBFL types, new entries are only recorded when a counter’s value changes. When that happens the current value of the counter is recorded. To determine how much the counter incremented in the recording interval the current value of the counter should be compared to the previous value of the same counter for the same interface. See the example below.
● OBFL is not lost if the module reloads or is reloaded
● OBFL can be cleared, if necessary, but normally that should not be done.
Some of the most important OBFL types are as follows:
● error-stats – Records per port error counters as they increment. Entries are recorded at 20-second intervals only when values change.
● counter-stats – Records error and statistical (non-error) counters. Entries are recorded at 10-minute intervals only when values change.
● datarate – Records tx-datarate, rx-datarate, tx-datarate-burst, rx-datarate-burst entries from port-monitor.
● txwait – Record per-interface TxWait in 2.5us increments when the amount of TxWait on an interface is 100 ms or more in a 20 second interval.
Reading a typical OBFL type may require some explanation. The following is an excerpt of the show logging onboard error-stats command showing two instances of F32_TMM_PORT_FRAME_DROP. The older instance was recorded at 4/13/21 20:25:23 and had a value of 18772 and the most recent instance was logged at 04/21/21 09:55:12 and had a value of 18774. From the header, you can see that for this error-stats log the information is recorded every 20 seconds. This indicates that the F32_TMM_PORT_FRAME_DROP counter for port fc9/17 incremented from 18772 to 18774 (+2) in the time interval of 04/21/21 09:54:52 to 04/21/21 09:55:12. It also indicates that the F32_TMM_PORT_FRAME_DROP counter for port fc9/17 did NOT increment between 4/13/21 20:25:23 and 04/21/21 09:54:52. Sometimes knowing when something did not happen is as useful as knowing when something did happen.
MDS9710-1# show logging onboard module 9 error-stats
----------------------------
Module: 9 show clock
----------------------------
2021-04-24 08:20:41
---------------------------------
Module: 9 error-stats
---------------------------------
Notes:
- Sampling period is 20 seconds
-----------------------------------------------------------------------------------------------
ERROR STATISTICS INFORMATION FOR DEVICE DEVICE: FCMAC
-----------------------------------------------------------------------------------------------
Interface | | | Time Stamp
Range | Error Stat Counter Name | Count |MM/DD/YY HH:MM:SS
| | |
-----------------------------------------------------------------------------------------------
fc9/17 |F32_TMM_PORT_FRAME_DROP | 18774 |04/21/21 09:55:12
fc9/17 |F32_MAC_KLM_CNTR_TX_WT_AVG_B2B_ZERO | 5274 |04/21/21 09:55:12
fc9/17 |F32_MAC_KLM_CNTR_TX_WT_AVG_B2B_ZERO | 5270 |04/20/21 12:08:19
fc9/17 |F32_TMM_PORT_FRAME_DROP | 18772 |04/13/21 20:25:23
What Evidence to Get for Different Problem Types
As mentioned, there are different types of show tech-support commands and each has its specific uses. In addition to that, there is OBFL. What should be gathered for different problem types to have the best chance at capturing the requested information needed to resolve them?
● For most problem types, except congestion or performance issues, get show tech-support details and show logging onboard (in separate appropriately named files).
● When there are specific switching module or port level problems, get show tech-support module <num> in addition to show tech-support details and show logging onboard (in separate appropriately named files).
● When there are performance, congestion or slow-drain problems, get show tech-support slowdrain. These need to be gathered from all switches in the fabric at approximately the same time because congestion may affect multiple switches in the fabric. Name these appropriately and zip together into a single file with an appropriate name and date. Something like:
‘Fabric_A_show_tech_slowdrain_May_15_2021.zip’.
See the section on Using DCNM SAN Java Client Run CLI Commands.
● When troubleshooting FCIP interfaces, get show tech-support fcip in addition to show tech-support details and show logging onboard (in separate appropriately named files).
Collecting tech-support files Using NX-OS CLI
This section describes the approach of collecting tech-support files from Cisco MDS 9000 switches using Cisco NX-OS CLI. You would need to access the switch in Secure Shell by using a terminal application. This can be a PuTTY or SecureCRT application installed on your Windows laptop or the Terminal application on macOS or some alternative solution on Linux. Open a new SSH connection to your switch and provide credentials.
Secure Shell Terminal Output Redirection
Let’s start showing how to collect the tech-support file using the NX-OS CLI option and terminal output redirection. This is the easiest but slowest method of creating the tech-support files.
The output from the show tech-support command is very long. To better manage this, you can redirect the screen output of your terminal application to a text file, so that the interaction with the device will be logged to a file. To do this, connect to the switch from the terminal, right-click on the top bar of the PuTTY application window and go to Change Settings…
|
|
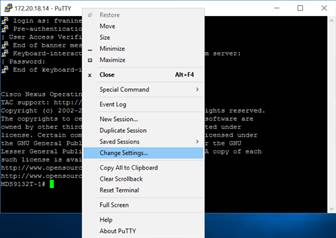
How to change settings on PuTTY terminal
From the configuration panel, select Session > Logging and the radio button Printable output. Choose an appropriate file name and location for the content to be stored.
By choosing the option Printable output, a log file will be created and written to, but the only printable text will be saved into it. The various terminal control codes that are typically sent down an interactive session alongside the printable text will be omitted. This might be a useful mode if you want to read a log file in a text editor and make sense of it.
Remember to name the PuTTY log file appropriately. This can make a difference for the person who receives them without living all day long in your data center and without any prior knowledge about the context. As a reference, follow the suggestion below:
<switchname>_techsupport_type_YYMMDD_HHMM.txt
Example:
switch27_techsupport_details_20210421_0830.txt
|
|
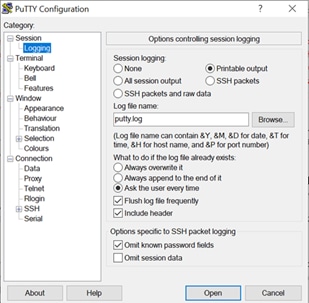
How to configure session logging to a file on PuTTY terminal
If you want to see the entire log content on screen, then go to Window in the left menu and add five zeroes to Lines of scrollback. Accept the changes by clicking the Apply button.
|
|
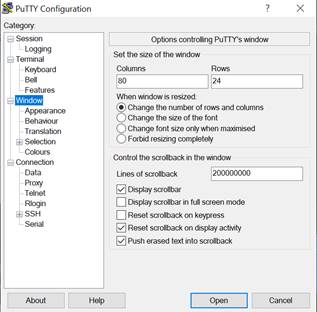
How to change screen visualization on PuTTY terminal
The Lines of scrollback input box lets you configure how many lines of text PuTTY keeps. By default, the last 2000 lines scrolled off the top are preserved for you to look at. You can increase (or decrease) this value using the configuration box. Changing the Lines of scrollback value is not needed because we want to send the log content to a file, and we are not interested to see it all on screen. However, it can be something useful to know.
Now that your terminal output is mapped to a file, you are ready to send these commands to the switch:
switch# terminal length 0
switch# terminal width 300
switch# show tech-support details
Wait until the logs are collected.
The command terminal length 0 is not required because the show tech-support command is smart enough to bypass it. However, it is still required if you are sending other commands via the CLI. This command sets the number of lines of output to display on the terminal screen for the current SSH session before pausing. The terminal length 0 command allows the text output to scroll indefinitely. The range is from 0 to 511. Use 0 to not pause while displaying output. To revert to the default, use the no terminal length 0 command. The initial default for the console is 0 (do not pause output). The initial default for virtual terminal sessions is defined by the client software, like PuTTY. The default for the no terminal length 0 command is 24 lines. If this command is not used and not only the show tech-support command is sent to the switch, the collected text file will contain all the “---- MORE ---- “ statements, making the output harder to read.
The command terminal width 300 is also not strictly required, but sometimes it helps avoid lines to wrap. It sets the number of character columns for the current terminal session. The range is between 24 and 511 characters. If the terminal emulator does not specify a screen width, the default number of character columns is 80. Most modern terminals propagate their window width to the switch so that the switch will automatically page output to match the width of the user’s window.
The time it takes to collect the tech-support file depends on the switch model and its configuration, but it can range from 1 minute to 10 minutes approx. Some patience is required while waiting for it to complete. The size of the tech-support file can also vary from 20 MB to 300 MB. Keep that in mind in case you are thinking to share it.
In case you want to collect additional logs, you can follow the same methodology but always remember to change the name of the destination log file most appropriately. In general, an additional set of logs could be worth capturing, depending on specific needs. Just as an example, the show tech-support slowdrain command would be very valuable in case of performance and congestion problems because it includes more details than what is part of the standard show tech-support collection. Similarly, you might want to explore the Onboard Failure Logging (OBFL) log with the show logging onboard command and so troubleshoot issues even after they are cleared. In case of malfunction on long-distance links, the show tech-support fcip command can be of help.
To recap, the below commands should be used in the specified order as a baseline data collection for most types of problems:
switch# terminal length 0
switch# terminal width 300
switch# show tech-support details
Note that when you have issued the terminal length and width commands once, they do not have to be issued again in that same SSH session because the settings will persist. Instead, a new SSH session will need those commands to be resent.
In addition to the baseline data collected by show tech-support details, getting the output of show logging onboard will give lots of additional information, especially about when various counters are incremented. Remember to change your screen output file name and connect to the switch again.
switch# terminal length 0
switch# terminal width 300
switch# show logging onboard
In addition to the baseline data, additional data may be needed for different types of issues. Here are two examples.
Data to be collected for long-distance replication issues using FCIP (Fiber Channel over IP)
switch# show tech-support fcip
Data to be collected if the issue is related to congestion/performance within the local SAN:
switch# show tech-support slowdrain
For some fabric-wide issues, including congestion or performance-related problems, tech-support files should be collected from all the switches in one fabric and added to a single compressed zip file per fabric. For example, show tech-support slowdrain commands should be run against all switches in the fabric, given good descriptive names, and zipped into a single file per fabric. Again, use a meaningful name for the zip file. Cisco support center (TAC) will be asking for that.
Example:
Fabric_A_techsupport_slowdrain_20210421_0830.zip
Fabric_B_techsupport_slowdrain_20210421_0830.zip
After collecting the tech-support files, it may be required to clear error counters and statistics on switches. Logs are cumulative and so it is easier to identify changes if you clear statistics after collecting logs and then collect again in case the issue repeats or is ongoing. Run the commands below to clear the statistics on a switch:
switch# clear counters interface all (Clears the port counters)
switch# debug system internal clear-counters all (Clears the ASIC counters)
switch# clear ips stats all (Clears FCIP counters only needed on FCIP enabled switches)
Native NX-OS Command Redirection
Instead of using terminal output redirection from your SSH application (PuTTY), you can also consider redirecting the output of the show tech-support and show logging onboard commands to a local writable storage file system (for example, bootflash) or a remote file system (for example, your laptop or an external computer), provided they have a file transfer service enabled (TFTP or FTP or SFTP). This approach leverages the embedded capability of Cisco NX-OS to redirect command output to the indicated destination.
Example:
MDS9710# show tech-support details > tftp://168.11.28.124/mydir/MDS9710_techsupport_details_20210421_0830.txt
Trying to connect to tftp server......
/TFTP put operation was successful
There are two methods for executing the command output redirection. Follow the usage guidelines as indicated below:
● “>” redirects the output and creates a file at the indicated location (tftp server, bootflash:, and so on)
● “>>” redirects the output and appends to an existing file
You can also redirect to the local file system on the switch bootflash and execute a file transfer at a later time. This method is faster than any other for individual tech-support file collection. Streaming the show tech-support to PuTTY is much slower. It also avoids rerunning the collection in case of unstable connectivity on the management network.
Example:
MDS9710# show tech-support details > bootflash:MDS9710_techsupport_details_20210421_0830.txt
MDS9710# dir bootflash:
137922373 Apr 22 11:03:47 2021 MDS9710_techsupport_details_20210421_0830.txt
Tech-support files tend to be significant in size and that consideration becomes even more important when you think those files will be shared with Cisco TAC engineers. The bigger the file, the harder and longer it will take to transfer and share. It is possible to address the size issue by compressing the files. As an example, the gzip application can be installed on your laptop and it provides lossless data compression. In this case, the file to be compressed would need to be on your laptop already. Even better, gzip comes pre-installed within NX-OS, so you can gzip the file in a few seconds and make it smaller before transferring it to your computer.
Example:
MDS9710# gzip bootflash:MDS9710_techsupport_details_20210421_0830.txt
MDS9710# dir bootflash:
9135656 Apr 22 11:03:47 2021 MDS9710_techsupport_details_20210421_0830.txt.gz
We went from a 138 MB file to a 9 MB zipped file that can be transferred to Cisco TAC in an easier way and in a shorter time.
Using DCNM SAN Java Client Run CLI Commands
Cisco Data Center Network Manager (DCNM) is the comprehensive management solution for all Cisco NX-OS network deployments spanning LAN fabrics, SAN fabrics, and IP Fabric for Media (IPFM) networking. At deployment time, a specific operational mode must be selected. Cisco DCNM provides management, control, automation, monitoring, visualization, and troubleshooting across Cisco Nexus and MDS 9000 solutions. Cisco DCNM provides an alternative to the command-line interface (CLI) for switch configuration commands. The Cisco DCNM SAN Java client displays a map of your network fabrics, including Cisco MDS 9000 Family switches, third-party switches, hosts, and storage devices. The Cisco DCNM SAN Java client provides multiple menus for accessing the SAN functionalities.
Let’s now consider the DCNM SAN Java client and the way to use it for collecting device logs. In this case, rather than collecting the tech-support files from individual switches, we will collect them for an entire fabric in one single step. This can come in handy when troubleshooting congestion problems.
After logging into the tool, perform these steps.
1. Select the fabric of your interest
2. Go to Tools > Run CLI Commands
3. Select the switches of your interest
4. Provide the folder name
5. Select to compress
6. Change the filename from CLICommands.zip to something more descriptive. If these are show tech-support details from fabric A name it: Fabric_A_ techsupport_details_<date>.zip. If it is show tech-support slowdrain for fabric A name it: Fabric_A_ techsupport_slowdrain_<date>.zip. The more descriptive the filename is, the quicker the Cisco TAC will be able to understand and process the file.
7. In the Command(s) pane, insert show tech-support details, show tech-support slowdrain, show tech-support module <num>, and so on. Quotes should not be used. Note <num> is a module number.
8. Click Run and wait till you see a success message in green color
|
|
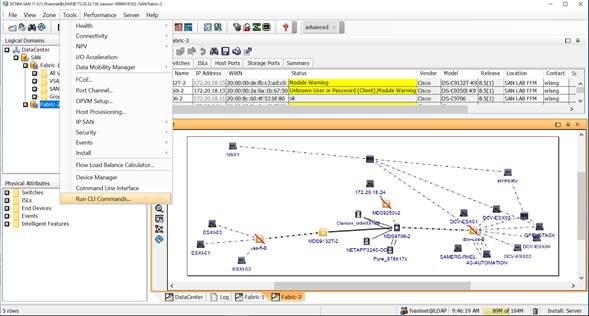
Selecting Run CLI Commands… from the Tools menu within DCNM SAN Java client
|
|
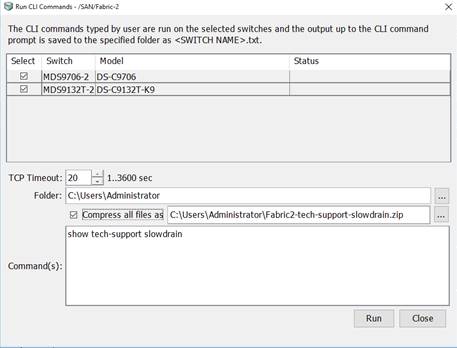
Configuration window for the Run CLI Commands… task
Copying files from Switches to Your Laptop
In case you decide to generate the tech-support file on the bootflash of your switch, you need a way to execute a file transfer to your laptop or an external computer. This can be easily done by using a file transfer protocol like TFTP, SFTP, FTP, or SCP. The same method can be used for other files like configuration files or firmware files. Also, in a similar way it is possible to copy files from an external computer to the bootflash of your switch. Cisco NX-OS CLI offers four protocols to use for copying to or from the device. The device always acts as a client, so that an FTP, SFPT, SCP, or TFTP session always originates from a Cisco NX-OS switch and either pushes files to an external system or pulls files from an external system.
The copy command supports the FTP, SCP, SFTP, and TFTP transfer protocols and twelve different sources for copying files.
MDS9710# copy bootflash: ?
bootflash: Select destination filesystem
debug: Select destination filesystem
ftp: Select destination filesystem
http: Select destination filesystem
https: Select destination filesystem
log: Select destination filesystem
logflash: Select destination filesystem
nvram: Select destination filesystem
running-config Copy from source to running configuration
scheduled-config Schedule configuration at the specified source to be applied at next switch reload
scp: Select destination filesystem
sftp: Select destination filesystem
slot0: Select destination filesystem
startup-config Copy from source to startup configuration
system: Select destination filesystem
tftp: Select destination filesystem
usb1: Select destination filesystem
volatile: Select destination filesystem
This example copies the tech-support.txt.gz file on bootflash to an external server using SFTP transfer mechanism:
switch# copy bootflash:tech-support.txt.gz sftp://fvaninet@172.22.20.10/test/tech-support.txt.gz
Of course, an SFTP server needs to be enabled on the external host.
For those administrators that tend to avoid using NX-OS CLI, they can execute the same operation from the embedded Device Manager inside the DCNM web user interface. To copy the tech-support file from the switch bootflash to your laptop using Device Manager, follow these steps from within the Device Manager screen:
Step 1. Choose Admin > Flash Files…. A new window will open with the list of files stored on the different Flash partitions.
Step 2. Select the file you want to copy to an external server
Step 3. Click the Copy button
Step 4. Select the protocol you want to use to copy the file from the switch, provide server IP address and credentials, as well as the destination filename.
Step 5. Select Apply to copy the file and the Close.
|
|
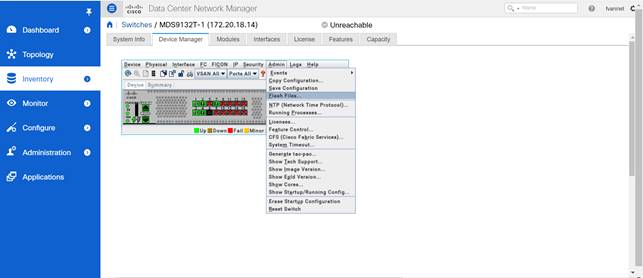
How to copy files from switch bootflash to your laptop using Device Manager
|
|
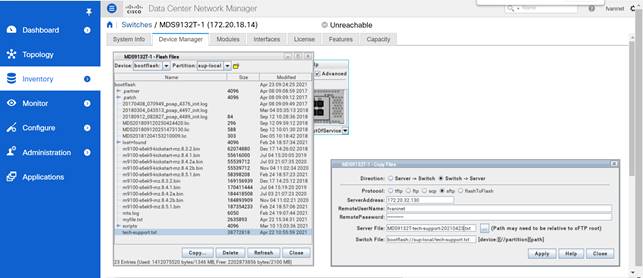
How to copy files from switch bootflash to your laptop using Device Manager
Collecting the tech-support file for the DCNM Server
There is also a possibility you may need support for DCNM tool itself. In this case, here is the procedure to see and collect the relevant support files for further investigation.
Log into DCNM web user interface, go to Administration > DCNM Server > Logs.
At the top right of the page, select Generate Techsupport and follow instructions in the follow-up window.
|
|
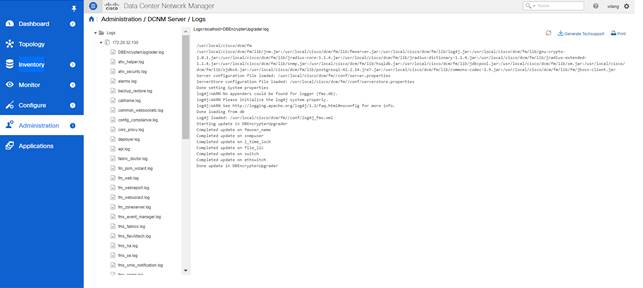
How to generate the tech-support file for the DCNM server itself
Uploading the tech-support file to the Cisco TAC
Customers are of prime importance to Cisco and being able to address and resolve their problems promptly is a top priority. However, customers have a role in facilitating the Cisco TAC support engineer and speed up problem identification and resolution. One way a customer can assist the process is by providing all relevant files to the Cisco Technical Assistance Center (TAC) for review, using appropriate names for them. Cisco provides multiple options for uploading information to the Cisco TAC to match a customer's requirements. Some of these options are less secure, leading to certain inherent risks, and each option has limitations that customers should consider before deciding on an appropriate upload option. A complete description of the available options is offered here:
https://www.cisco.com/c/en/us/support/web/tac/tac-customer-file-uploads.html
The use of the email system to transfer tech-support files is not recommended. Apart from being a less secure transfer method, the size of these files, even when zipped, can be significant and many email systems have a limit on the maximum size for an email message. A proper file transfer mechanism is so recommended. Despite there are many free file transfer options, Cisco has introduced its method for a better user experience. This offers a secure transfer of large amounts of information (files, images, and so on) and provides integration with the Support Case Manager (SCM) portal, with an immediate linkage to the associated Service Request number.
The Support Case Manager (SCM) file upload method is the preferred and most secure option for uploading files to cases. Files transferred by using this option are encrypted in transit and the size limit of 250 GB has proved sufficient for all practical needs. The communication channel between the customer’s computing device and Cisco is encrypted. Files uploaded through SCM are immediately linked to the associated case number and stored in an encrypted format.
When a new Service Request is created, follow these steps from the case confirmation screen to upload a file.
Step 1. Select the Add files to your case button (Figure 9).
|
|
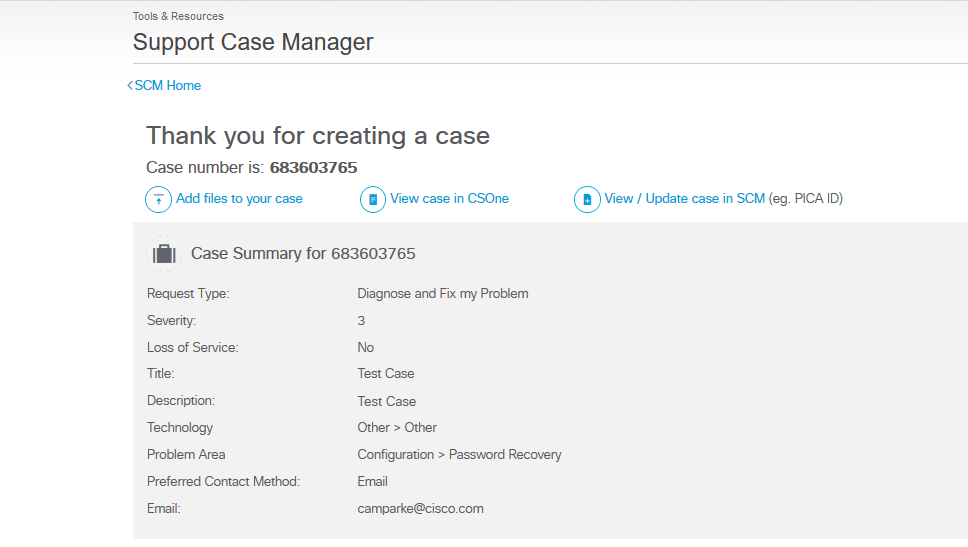
How to add files to your case from SCM
Step 2. From the Attachments tab, select the Add Files button (Figure 10).
|
|
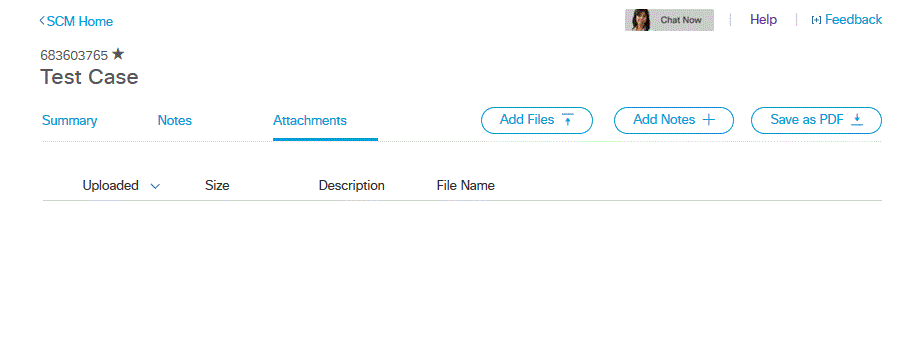
Attachments tab in SCM and the Add Files button
You will be navigated to the Case File Uploader tool. The case you created will be pre-populated in the tool.
Step 3. When choosing a file to attach, either drag and drop or click inside the dash-edged box to select the file to upload (Figure 11).
|
|
Case File Uploader: file drag and drop screen
Preparing to Call the Cisco TAC
When an issue is encountered in a storage area network, the administrator may need to contact the Cisco TAC for some assistance. This section outlines the steps that the administrator should perform before contacting the Cisco TAC, as this will reduce the amount of time needed to resolve the issue.
Remember that the Cisco TAC has its procedures and tools for analyzing support files. For this reason, the support files collected from switches should be plain text. Rich Text Format (RTF), Word processing formats, email formats, pdf formats, and similar formats are not valid.
When the below information is available, administrators can open a case online via SCM portal or contact the Cisco TAC via email or phone, or chat.
Step 1. If possible, before any recovery efforts or attempts are made, please collect the proper logs for the problem type. As mentioned, for most non-performance/congestion issues this is a minimum of show tech-support details and show logging onboard. If it is a problem dealing with one or more ports a show tech-support module <num> would also be good. In general, we do not recommend reloading modules or switches. Some logs and counters are kept in volatile storage and will not survive a reload.
Step 2. Collect switch information and configuration. Do this before the issue is resolved and after it is resolved. Use the method you prefer, choosing between NX-OS CLI or DCNM SAN Java client.
Step 3. Answer the following questions before placing a call to the Cisco TAC:
● In which switch, HBA, or storage port is the problem occurring? List MDS 9000 firmware, driver versions, operating systems versions, and storage device firmware.
● What is the network topology?
● Were any changes being made to the environment (zoning, adding line cards, upgrades) before or at the time of this event?
● Are there other similarly configured devices that could have this problem but do not have it?
● Where is this problematic device connected (MDS 9000 switch Z, interface x/y)?
● When did this problem first occur?
● When did this problem last occur?
● How often does this problem occur?
● How many devices have this problem?
● Were any traces or debug outputs captured during the problem time? What troubleshooting steps have already been done? Were any of the following tools used?
FCanalyzer, local or remote SPAN
CLI debug commands
FC traceroute, FC ping
Step 4. Is your problem related to a software upgrade attempt?
● What was the original Cisco NX-OS version?
● What is the new Cisco NX-OS version?
● Did you use DCNM or the CLI to attempt this upgrade?
● Please collect the output from the following commands and forward them to your customer support representative:
show install all status
show system internal log install
show system internal log install details
show log nvram
Step 5. If your problem is related to zoning, use the show tech-support zone CLI command to gather relevant information.
Core files (sometimes referred to as core dumps) consist of the recorded state of the working memory of the NX-OS program at a specific time. They are per-process system memory dumps, so they never take up the full memory. They might be several MB in size. They are available in situations where an NX-OS process or service crashes or terminates abnormally. When that happens, a core file is automatically produced and, by default, saved on the switch in a dedicated directory of the persistent storage. Core files can also be generated for specific needs by special tools available from Cisco TAC. Core files can be sent to an external server via TFTP, SFTP, or SCP or to a Flashcard in slot0: of the local switch. You should set up your switch to send core files off the switch under guidance and instruction from your customer support representative. They are decoded by technical support engineers. Core files saved in the local switch should be copied to an external location at the earliest possible opportunity because they may be deleted with certain switch events. To see if any core file exists, the show core command can be issued.
Core files can be copied on-demand or periodically. For on-demand transfer of a core file to an external location, the copy core: command can be issued. This is the same copy command used previously to transfer files off bootflash. A best practice is to set up cores files to go to an external server. Then these core files can be sent to the Cisco TAC by using the same Support Case Manager (SCM) file upload method explained before. To set up a periodic copy of core files on your switch using NX-OS CLI, use the system cores command.
switch# system cores tftp://10.92.53.200/cisco_corefiles
switch# show system cores
Core files are transferred to tftp://10.92.53.200/cisco_corefiles
The directory cisco_corefiles must already exist in the TFTP server directory. If the directory specified by this task does not exist, the switch software logs a system message each time a copy cores is attempted.
Use the clear cores command to clean out all the core files present on the active supervisor module.
When you need support on Cisco MDS 9000 Switches and DCNM, the award-winning Cisco TAC organization is available for your help. For faster resolution of your issues, it is important that the information, such as log files, tech-support files, core dumps, and so on, is collected and shared with Cisco TAC in an efficient way. This document provides best practices to collect the necessary information and be well positioned to open a service request with the Cisco TAC.
![]()