
New and changed information
The following table provides an overview of the significant changes up to this current release. The table does not provide an exhaustive list of all changes or of the new features up to this release.
| Release Version | Feature | Description |
|---|---|---|
|
Nexus Dashboard 4.1.1 |
Improved navigation and workflow when working with connectivity for Nexus Dashboard IPFM fabrics |
Beginning with Nexus Dashboard 4.1.1, the navigation and workflow when working with connectivity in Nexus Dashboard IPFM fabrics have been enhanced. |
Navigate to the Connectivity page
To navigate to the Connectivity page:
-
Navigate to the main Fabrics page:
Manage > Fabrics
-
In the table showing all of the Nexus Dashboard fabrics that you have already created, locate the IPFM fabric where you want to configure connectivity.
-
Single-click on that fabric.
The Overview page for that fabric appears.
-
Click Connectivity.
These subtabs provide more focused connectivity options:
Interfaces
The Interfaces option displays these details about the switch and its vPC peer:
-
interfaces that are discovered
-
intended interfaces not yet deployed, and
-
Virtual Port Channels (vPCs)
An invalid interface error appears for the following scenarios:
-
Interface Mode 'routed' is invalid. Allowed mode is trunk & access.
-
Access port which is already allocated to other network.
-
Interface which is not available in the switch.
You can use the following functions:
-
Create, deploy, view, edit and delete a port channel, vPC, Straight-through FEX, Active-Active FEX, loopback, and subinterface.

-
The following features are unsupported for the brownfield migration of switches with the Cisco NX-OS Release 7.0(3)I4(8b) and 7.0(4)I4(x) images:
-
FEX on switches other than Cisco Nexus 9300 Series switches and Cisco Nexus 9500 Series switches with X9500 line cards
-
AA-FEX
For information about the platform support for FEX, refer to your platform and NX-OS documentation to check the feature compatibility.
-
To edit interfaces associated with fabric links such as intra-fabric links and inter-fabric links, see Edit interfaces associated with links.
-
The flowcontrol or priority-flow-control config is not supported for HIF ports or PO with HIF ports as members.
-
When using the REST API for configurations, make sure to set consistent values for the primary fields and NV pairs fields. For example, a REST API post for a single port channel that has different values in certain fields, such as:
-
ifName: Port-testing123
-
PO_ID: Port-channel1000
results in two interfaces being created rather than the intended single interface.
-
-
-
Create tunnel interfaces for Cisco Cloud Services Router 1000v Series (Cisco CSR 1000v Series).
-
Create breakout and unbreakout ports.
-
Shut down and bring up interfaces.
-
Rediscover ports and view interface configuration history.
-
Apply host policies on interfaces and vPCs. For example, int_trunk_host, int_access_host, and so on.
-
View interface information such as its admin status, operation status, reason, policy, speed, MTU, mode, VLANs, IP/Prefix, VRF, port channel, and the neighbor of the interface.
The Neighbor column provides details of connected switches that are discovered, intent links, and Virtual Machine Manager (VMM) connectivity.
The Status column displays the following status of an interface:
-
Blue: Pending
-
Green: In Sync/Success
-
Red: Out-of-Sync/Failed
-
Yellow: In Progress
-
Grey: Unknown/NA
-
If an interface is created out-of-band, you need to perform fabric resync or wait for Config Compliance poling before this interface can be deleted. Otherwise, Config Compliance does not generate the correct diff.
However, you cannot add or edit interfaces for ASR 9000 Series Routers and Arista switches.
You can filter and view information for any of the given fields (such as Device Name).
-
Ensure that appropriate configurations are deployed on the Fabric before deploying from the Interfaces option, including proper vPC pair configurations. If you add or edit an interface before configurations are deployed on the Fabric, the configuration may fail on the device.
-
Deploy any underlays including vPC Pairing in the fabric before deploying any configurations from the interface manager.
The following table describes the action items available in Actions menu drop down list when you select an interface.
| Field | Description |
|---|---|
|
Actions |
|
|
Create interface |
Allows you to add a logical interface such as a port channel, vPC, Straight-through FEX, Active-Active FEX, and loopback. |
|
Actions |
|
|
Edit configuration |
Allows you to edit and change policies that are associated with an interface.
Access-admin user role cannot edit interfaces associated with link policy such as inter-fabric link or intra-fabric link for easy fabrics. The user role can edit interfaces for LAN classic and IPFM fabrics. If you select the int_monitor interface policy, you are responsible for the interface configuration and management. Nexus Dashboard does not apply any interface configurations nor perform configuration compliance for interfaces that have the int_monitor policy. |
|
Actions > Configuration |
|
|
Create subinterface |
Allows you to add a logical subinterface. |
|
Multi-attach |
Allows you to attach multiple networks when you add an interface from an interface group in the Interfaces. |
|
Multi-detach |
Allows you to detach multiple networks when you remove an interface from an interface group in the Interfaces. |
|
Preview |
Allows you to preview the interface configuration. |
|
Deploy |
Allows you to deploy or redeploy saved interface configurations. |
|
No Shutdown |
Allows you to enable an interface (no shutdown or admin up). |
|
Shutdown |
Allows you to shut down the interface. |
|
Breakout |
Allows you to breakout an interface. |
|
Un-Breakout |
Allows you to unbreakout interfaces that are in breakout state. |
|
Actions > Interface group |
|
|
Add |
Allows you to add or remove an interface to an interface group. |
|
Remove |
Allows option to edit an interface group. |
|
Actions > Maintenance |
|
|
Rediscover |
Allows you to rediscover or recalculate the compliance status on the selected interfaces. |
|
Show commands |
Allows you to display the interface show commands. A show command requires show templates in the template library. |
|
History |
Allows you to display the interface deployment history details. |
|
Actions > Bulk actions |
|
|
Import |
Allows you to import the edited interfaces. The following are the limitations during importing the interfaces:
There is a server property to set the maximum number of rows that can be imported. By default, the property is 200 for import. |
|
Export |
Allows you to export the selected interfaces with multiple types of policies to a .csv file. While there is technically no limit on the number of interfaces to export, the number of interfaces included in each exported .csv file is limited to the number of rows that are displayed on the page. For example, if you select all of the interfaces in the window and you have 50 as the entry in the Rows per page field at the bottom of the window, then only the 50 interfaces displayed in this page are exported to the .csv file. |
|
Normalize |
Allows you to apply the same interface policies and its parameters on selected interfaces in one shot. |
|
Actions |
|
|
Delete |
Allows you to delete a logical interface that is created from the Interfaces screen. An interface having a policy that is attached from an overlay and underlay cannot be deleted. |
You can disable deployments, or freeze, a fabric in Nexus Dashboard as a network administrator. However, you cannot perform all actions when you freeze the fabric or if the fabric is in monitor mode.
The following table describes the actions you can perform when you freeze a fabric and when you enable the monitor mode for a fabric.
|
Operations |
Nexus Dashboard Mode |
|
|
Freeze Mode |
Monitor Mode |
|
|
Add |
Save, Preview |
Blocked |
|
Breakout |
Blocked |
Blocked |
|
Unbreakout |
Blocked |
Blocked |
|
Edit |
Save, Preview |
Blocked |
|
Delete |
Save, Preview |
Blocked |
|
Shutdown |
Save, Preview |
Blocked |
|
No Shutdown |
Save, Preview |
Blocked |
|
Show |
Supported |
Supported |
|
Rediscover |
Supported |
Supported |
|
Deploy |
Blocked |
Blocked |
|
Import |
Supported |
Supported |
|
Export |
Supported |
Supported |
The buttons for the associated operations are grayed out accordingly.
If you perform admin operations (shutdown/no shutdown) on an SVI, which is part of a config profile, successive Save & Deploy operations generate the no interface vlan command.
For an SVI with no policy, on performing admin operation, that is, shutdown/no shutdown command pushed from Interface Manager, the int_vlan_admin_state policy is associated with the SVI.
For example, create and deploy the SVI from switch_freeform.
interface vlan1234
  description test
  no shutdown
  no ip redirects
  no ipv6 redirects
If you shutdown the SVI from the interface manager, the int_vlan_admin_state policy is associated with the SVI.
Pending diff is shown as:
interface Vlan1234
  shutdown
  no ip redirects
  no ipv6 redirects
  description test
  no shutdown
Remove the no shutdown CLI from the free-form config.
If you have performed an admin operation on the SVI, the device has an interface as a running config. Therefore, post network detach interface vlan is still present and the interface is discovered. You need to manually delete the interface from the Interface Manager.
The following table describes the fields that appear on the Manage > Fabrics > Overview > Connectivity > Interfaces tab.
| Field | Description |
|---|---|
|
Interface |
Specifies the interface name. |
|
Switch |
Specifies the switch name. |
|
Config-sync status |
Specifies the configuration sync status of the switch. |
|
Admin Status |
Specifies the administrative status of the interface. The status can be either Up or Down. |
|
Oper-Status |
Specifies the operational status of the interface. The status can be either Up or Down. |
|
Reason |
Specifies the reason. |
|
Policies Group |
Specifies the policy name. |
|
Overlay Network |
Specifies the overlay network. |
|
Sync Status |
Specifies the sync status. Specifies if the interface status is In-Sync or Out-Of-Sync. |
|
Interface Groups |
Specifies the interface group to which the interface belongs to. |
|
Port Channel ID |
Specified the port channel ID. |
|
vPC ID |
Specifies the vPC ID. |
|
Speed |
Specifies the interface speed. |
|
MTU |
Specifies the MTU size. |
|
Mode |
Specifies the interface mode. |
|
VLANs |
Specifies the VLANs. |
|
IP/Prefix |
Specifies the interface IP/prefix. |
|
VRF |
Specifies virtual routing and forwarding instances (VRFs). |
|
Neighbor |
Specifies the interface neighbor. |
|
Description |
Specifies the interface description.
There is a known issue where the description entry is truncated to 64 characters. If the interface description is more than 64 characters, run the |
Add interfaces
Follow these steps to add interfaces.
-
Click the Interfaces tab.
-
Click Actions > Create interface to add a logical interface.
The Create interface page appears.
-
From the Type drop-down list, choose the type of the interface.
Valid values are Port Channel, virtual Port Channel (vPC), Straight-through (ST) FEX, Active-Active (AA) FEX, Loopback, Subinterface, Tunnel Ethernet, and Switch Virtual Interface (SVI). The respective interface ID field is displayed when you choose an interface type.
-
When you create a port channel through Nexus Dashboard, add interfaces of the same speed. A port channel that is created from interfaces of varying speeds won’t come up. For example, a port channel with two 10 Gigabit Ethernet ports is valid. However, a port channel with a 10-Gigabit Ethernet + 25-Gigabit Ethernet port combination isn’t valid.
-
To add vPC hosts, you must designate vPC switches in the fabric topology and deploy vPC and peer-link configurations using the Save Deploy option. After the vPC pair configurations are deployed, it appears in the Select a vPC pair drop-down box.
You can create a vPC using the int_vpc_trunk_host policy.
-
When adding a subinterface, you must choose a routed interface from the interface table before clicking the Add button.
-
You can preprovision Ethernet interfaces on the Interfaces page. This preprovisioning feature is supported in VXLAN, eBGP, and External fabrics.
-
After preprovisioning the Ethernet interface, you can preprovision a subinterface on a physical interface.
-
-
In the Select a device drop-down list, choose a device.
Devices are listed by fabric, switch, and interface type. To narrow your search, you can also type the characters in the drop-down list. For vPC or Active to Active FEX, choose the vPC switch pair.
-
Enter the ID value in the respective interface ID field (Port Channel ID,vPC ID,Loopback ID, Tunnel ID, Interface name, VLAN ID, and Subinterface ID) that is displayed, based on the chosen interface.
You can override this value. The new value is used only if it’s available in the Resource Manager pool. Else, it results in an error.
-
Under the Policy field, choose a policy to apply on an interface.
The field only lists the Interface Python Policy with tag interface_edit_policy and filtered based on the interface type.
You must not create a _upg interface policy. For example, you should not create a policy using the vpc_trunk_host_upg, port_channel_aa_fex_upg, port_channel_trunk_host_upg, and trunk_host_upg options.
The policies are filtered based on the interface type you choose in the Type drop-down list and the device you choose in the Select a device drop-down list.
-
Enter values in the required fields under Policy Options.
The fields vary according to the interface type you chose.
-
You can mirror the configurations of Peer-1 on Peer-2 while creating a vPC. When you check the Enable Config Mirroring check box, the Peer-2 fields will be grayed out. The configurations that you enter in the Peer-1 fields will be copied to Peer-2 fields.
-
You can set Native Vlan for the interface which has int_trunk_host or int_port_channel_trunk_host, or int_vpc_trunk_host policy template.
A trunk port can carry nontagged packets simultaneously with tagged packets. When you assign a default port VLAN ID to the trunk port, all untagged traffic travels on the default port VLAN ID for the trunk port, and all untagged traffic is assumed to belong to this VLAN. This VLAN is referred to as the native VLAN ID for a trunk port. That is, the native VLAN ID is the VLAN that carries untagged traffic on trunk ports.
-
If you are creating a port channel or virtual port channel interface, you can edit these general parameter fields:
-
Configure BPDU Filter--Enables or disables the spanning tree BPDU filter. If enabled, the interface cannot send nor receive BPDUs.
-
Spanning-tree Link-type--Specifies the link type for the spanning tree protocol (STP) to use.
-
Enable Auto-Negotiation--Enables or disables auto-negotiation. Auto-negotiation is an optional function of the IEEE 802.3u Fast Ethernet standard that enables devices to automatically exchange information over a link about speed and duplex abilities.
-
Bandwidth in kilobits--Specifies the allowed bandwidth in kilobits of the interface.
-
Inherit Bandwidth in kilobits--Specifies the allowed bandwidth in kilobits of all sub-interfaces of this interface.
-
Debounce Timer--Specifies the link debounce timer in milliseconds, which is the wait time for the interface when there is a flap in the link. After the specified time passes, Nexus Dashboard checks the link status again to re-confirm the event. If the link is okay at this time, then the interface remains up.
-
Debounce Link-up Timer--Specifies the link debounce link-up timer, which is the wait time before bringing up the interface after it was taken down due to a flap.
-
Enable Error Detection--Enables or disables error detection for access control list. When enabled, if the software on the switch detects an error situation on the interface, the software shuts down that interface and no traffic is sent nor received on that interface.
-
Forwarding Error Correction--Specifies the Forwarding Error Correction (FEC) mode. Forwarding Error Correction is a method of obtaining error control in data transmission over an unreliable or noisy channel in which the source (transmitter) encodes the data in a redundant way using an Error Correcting Code, and the destination (receiver) recognizes it and corrects the errors without requiring a retransmission.
-
-
If you are creating a port channel or virtual port channel interface, you can edit these storm control fields:
-
Broadcast Storm Control Level in Percentage--Specifies the broadcast traffic utilization threshold at which point storm control begins to manage broadcast traffic.
-
Multicast Storm Control Level in Percentage--Specifies the multicast traffic utilization threshold at which point storm control begins to manage broadcast traffic.
-
Unicast Storm Control Level in Percentage--Specifies the unicast traffic utilization threshold at which point storm control begins to manage broadcast traffic.
-
Broadcast Storm Control Level in PPS--Specifies the threshold level for broadcast traffic in packets per second (pps). The interface blocks all traffic when traffic utilization exceeds this level.
-
Multicast Storm Control Level in PPS--Specifies the threshold level for multicast traffic in packets per second. The interface blocks all traffic when traffic utilization exceeds this level.
-
Unicast Storm Control Level in PPS--Specifies the threshold level for unicast traffic in packets per second. The interface blocks all traffic when traffic utilization exceeds this level.
-
-
-
Click Save to save the configurations.
To apply QoS policies on the interface, create the interface freeform with references accordingly.
Only saved configurations are pushed to the device. While adding the interface, you can only modify the policy attribute after the first save. If you try to use an ID that is already used, you encounter the Resource could not be allocated error.
-
To view configurations for a new interface, double-click on the policy name in the Policies tab.
-
(Optional) Click the Preview option to preview the configurations to be deployed.
-
Click Deploy to deploy the specified logical interface.
The newly added interface appears in the screen.
Breakout
To breakout an interface, from Nexus Dashboard:
-
Click the Interfaces tab.
-
Choose the appropriate interface from the list.
-
On the Interfaces page, click Actions > Configuration > Breakout.
The Breakout Interfaces page appears.
-
Choose the required option on the page and click Breakout.
The available options are 10g-4x, 25g-4x, 50g-2x, 50g-4x, 100g-2x, 100g-4x, 200g-2x, and Unbreakout.
UnBreakout
You can unbreakout interfaces that are in a breakout state.
-
Click the Interfaces tab.
-
On the Interfaces page, click Actions > Configuration > UnBreakout.
The unbreakout option is grayed out for interfaces that are not in breakout state.
Edit interfaces
The Edit interface(s) page allows you to configure interfaces, modify applied policies, and manage interface assignments for port channels or virtual port channels (vPCs).
Follow these steps to edit interfaces.
-
Click the Interfaces tab.
-
Choose the interface that you want to edit.
You can choose multiple interfaces at the same time to edit them sequentially.
You cannot edit multiple port channels and vPCs. You cannot edit interfaces of different types at the same time.
-
From the Actions drop-down list, choose Edit configuration.
The Edit interface(s) page displays parameters based on the template and the policy that you chose.
Nexus Dashboard does not support interface description configuration for FEX fabric ports with fabric resource templates. While the FEX fabric ports and FEX are provisioned correctly, the description configured through Nexus Dashboard is not displayed on the leaf switch interfaces, the fabric port channel, or the APIC interface configuration wizard.
-
Optional: Click the policy name, choose a different policy, and then click Select. The choice of policies depends on the interface type. Ensure that you choose an appropriate policy for the interface.
-
If you are editing a trunk host, you can edit these fields under the General Parameters tab.
-
Enable BPDU Guard — Enables or disables the spanning tree BPDU guard. If enabled, it prevents BPDU traffic.
-
Configure BPDU Filter — Enables or disables the spanning tree BPDU filter. If enabled, the interface cannot send nor receive BPDUs.
-
Spanning-tree Link-type — Specifies the link type for the spanning tree protocol (STP) to use.
-
Enable Port Type Fast — Enables or disables the spanning tree edge port behavior.
-
MTU — Maximum transmission unit (MTU) size of the interface.
-
SPEED — Interface speed.
-
Trunk Allowed Vlans — Specifies the VLANs allowed on the trunk.
-
Native Vlan — Specifies the native VLAN.
-
Interface Description — Add a description for the interface.
-
Enable Auto-Negotiation — Enables or disables auto-negotiation. Auto-negotiation is an optional function of the IEEE 802.3u Fast Ethernet standard that enables devices to automatically exchange information over a link about speed and duplex abilities.
-
Enable CDP — Enables or disables Cisco Discovery Protocol (CDP) on the interface.
-
Enable vPC Orphan Port — Enables or disables vPC orphan port functionality. When enabled, you can configure the interface as a vPC orphan port, and the secondary peer suspends it during vPC failures.
-
Port Duplex Mode — Configures the communication mode of the port to operate in either full-duplex or half-duplex mode.
-
Bandwidth in kilobits — Specifies the allowed bandwidth in kilobits of the interface.
-
Inherit Bandwidth in kilobits — Specifies the allowed bandwidth in kilobits of all sub-interfaces of this interface.
-
Debounce Timer — Specifies the link debounce timer in milliseconds, which is the wait time for the interface when there is a flap in the link. After the specified time passes, Nexus Dashboard checks the link status again to re-confirm the event. If the link is okay at this time, then the interface remains up.
-
Debounce Link-up Timer — Specifies the link debounce link-up timer, which is the wait time before bringing up the interface after it was taken down due to a flap.
-
Enable Error Detection — Enables or disables error detection for access control list. When enabled, if the software on the switch detects an error situation on the interface, the software shuts down that interface and no traffic is sent nor received on that interface.
-
Forwarding Error Correction — Specifies the Forwarding Error Correction (FEC) mode. Forwarding Error Correction is a method of obtaining error control in data transmission over an unreliable or noisy channel in which the source (transmitter) encodes the data in a redundant way using an Error Correcting Code, and the destination (receiver) recognizes it and corrects the errors without requiring a retransmission.
-
Freeform Config — Allows custom configurations.
-
Enable Interface — Enables or disables the interface.
-
Enable Netflow — Enables or disables Netflow monitoring. Netflow monitoring is supported only if it is enabled on fabric.
-
Netflow Monitor — Configures Netflow monitoring settings.
-
Netflow Sampler — Configures Netflow sampling settings.
-
Enable priority flow control — Enables or disables priority flow control.
-
Enable QoS Configuration — Enables or disables quality of service (QoS) settings. When enabled, you can configure a QoS policy specific to the interface. If AI queuing is active on the fabric, Nexus Dashboard applies the
QOS_CLASSIFICATIONpolicy by default. You must provide a custom policy in the Custom QoS Policy field to override this default behavior. -
Custom QoS Policy — Applies a custom QoS policy.
-
Custom Queuing Policy — Applies a custom queuing policy.
-
Switchport monitor — Enables or disables switchport monitoring.
-
Enable VLAN Mapping — Enables or disables VLAN mapping.
The feature is applicable to these trunk interface types.
-
Ethernet
-
Port channel
-
Virtual port channel (vPC)
For more information, see Enable VLAN mapping.
-
-
-
If you are editing a trunk host, you can edit these fields under the Storm Control tab.
-
Configure Traffic Storm Control — Enables or disables storm control on the interface. Storm control prevents excessive broadcast, multicast, or unicast traffic from disrupting the network by monitoring traffic levels and applying thresholds.
-
Storm Control Action — Specifies the action to take when a traffic storm is detected. You can see these options.
-
Shutdown — Disables the port when a storm is detected.
-
Trap — Sends an SNMP trap notification when a storm is detected.
-
No — Returns to default settings.
-
-
Broadcast Storm Control Level in Percentage — Specifies the broadcast traffic utilization threshold at which point storm control begins to manage broadcast traffic.
-
Multicast Storm Control Level in Percentage — Specifies the multicast traffic utilization threshold at which point storm control begins to manage broadcast traffic.
-
Unicast Storm Control Level in Percentage — Specifies the unicast traffic utilization threshold at which point storm control begins to manage broadcast traffic.
-
Broadcast Storm Control Level in PPS — Specifies the threshold level for broadcast traffic in packets per second (pps). The interface blocks all traffic when traffic utilization exceeds this level.
-
Multicast Storm Control Level in PPS — Specifies the threshold level for multicast traffic in packets per second. The interface blocks all traffic when traffic utilization exceeds this level.
-
Unicast Storm Control Level in PPS — Specifies the threshold level for unicast traffic in packets per second. The interface blocks all traffic when traffic utilization exceeds this level.
-
-
Edit the other policy options fields as necessary.
-
Click Save, and then click Deploy.
-
Additional information
This information applies for editing interfaces.
-
In a vPC setup, the two switches are in the order the switch names are displayed on the Edit page. For example, if Switch Name is displayed as LEAF1:LEAF2, then Leaf1 is peer switch one and Leaf2 is peer switch two.
-
During overlay network deployment on switches, the network can be associated with trunk interfaces. The Interface tab displays the trunk interface to network association. You can update such interfaces.
Enable VLAN mapping
You can configure VLAN mapping on trunk interfaces to enhance network management. To enable VLAN mapping, configure the switch to map customer VLANs to provider VLANs. This configuration segregates traffic and ensures proper handling of VLAN IDs across networks.
Follow these steps to configure VLAN mapping on a trunk interface.
-
Click the Interfaces tab.
-
Choose the interface that you want to edit.
You can choose multiple interfaces at the same time to edit them sequentially.
-
In the Edit interface(s) page, check the Enable VLAN Mapping check box.
The Vlan Mapping Entries table is enabled.
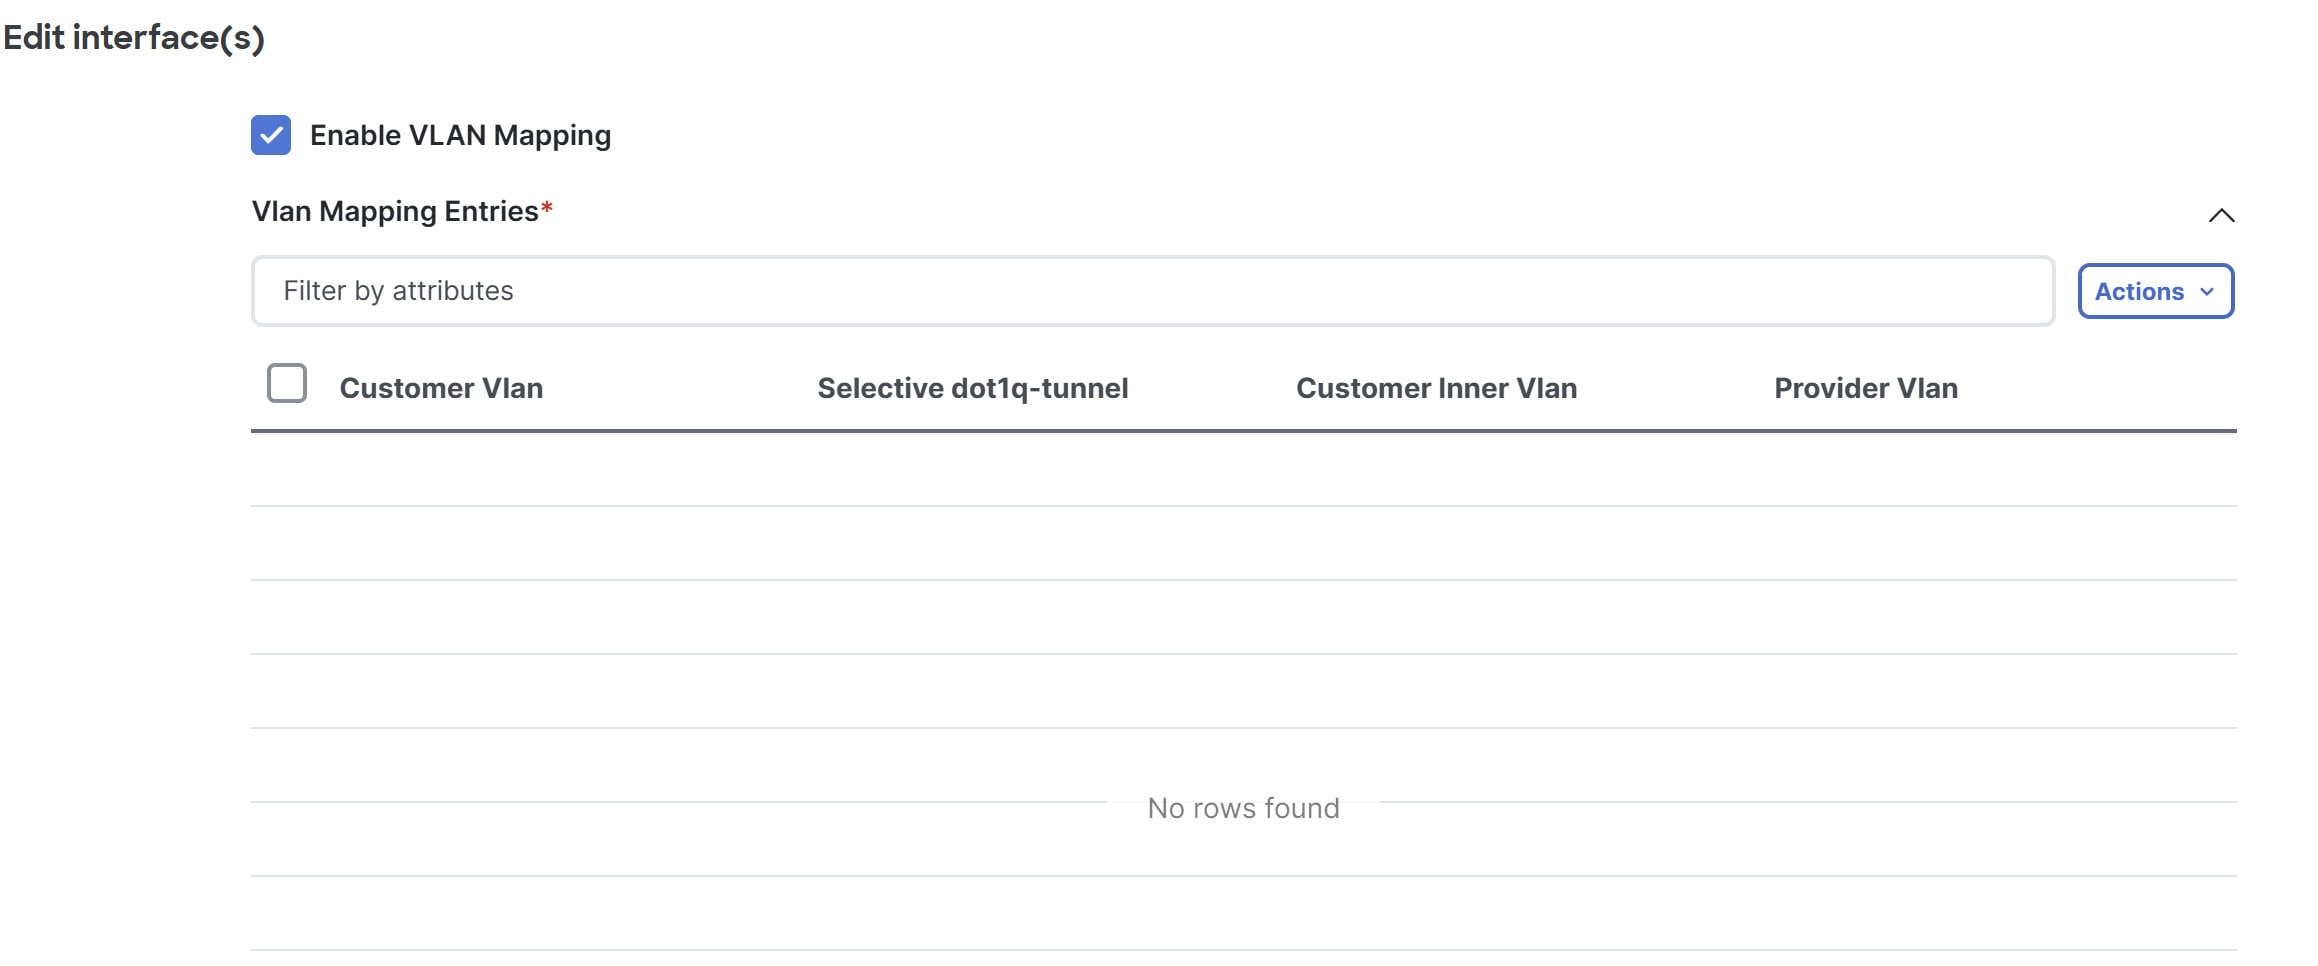
The Vlan Mapping Entries table displays these information.
-
Customer Vlan — Represents the Vlan ID used within the customer’s network.
-
Selective dot1q-tunnel — Allows selective tunneling of specific Vlans by mapping a range of customer Vlans to provider Vlan.
Selective dot1q-tunnel and port Vlan mapping cannot be present on the same interface.
-
Customer Inner Vlan — Refers to the VLAN tag located inside the header of an incoming packet from the customer.
-
Provider Vlan — Represents the Vlan ID assigned by the service provider to encapsulate customer traffic for transport across the provider’s network.
-
-
Add a new mapping entry.
Follow these steps to add a new mapping entry.
-
From the Actions drop-down list, click Add.
The Add Item dialog box opens.
-
In the Customer Vlan field, provide the customer Vlan ID or a range of Vlan IDs.
-
Check the Selective dot1q-tunnel check box, if needed.
Ensure that you configure the Selective dot1q-tunnel option to all the customer Vlans. You cannot configure both selective dot1q-tunnel and port Vlan mapping on the same interface.
-
Optional: In the Customer Inner Vlan field, provide the inner Vlan ID from the customer network.
You cannot provide Customer Inner Vlan if you choose the Selective dot1q-tunnel check box. When you choose Selective dot1q-tunnel, Nexus Dashboard uses provider Vlan for tunneling and does not require customer inner Vlan.
-
In the Provider Vlan field, enter the provider Vlan ID to map the customer Vlan.
-
Click Save to save the configuration.
-
Limitations
-
For PVLAN interfaces, you can associate interfaces with the networks only for access and trunk port types.
-
For interface policies that are not created from the Manage > Inventory > Interfaces > Interfaces page, you can edit some configurations but not change the policy itself. The policy and fields that cannot be edited are grayed out.
-
These are some examples of policies that you cannot edit.
-
Loopback interface policies. You use the int_fabric_loopback policy to create a loopback interface. You can edit the loopback IP address and description, but not the int_fabric_loopback policy instance.
You cannot edit the loopback IP addresses for loopback interfaces that are created automatically while creating and attaching the VRF instances.
-
Fabric underlay network interface policies, such as int_fabric_num, and fabric overlay network interface (NVE) policies.
-
Policies associated with port channels and member ports of port channels, including the port channels and member ports associated with a vPC.
-
SVIs created during network and VRF instance creation. The associated VLANs appear in the interfaces list.
-
Edit interfaces associated with links
There are two types of links, namely intra-fabric links and inter-fabric links. As the name implies, intra-fabric links are set up between devices within the same VXLAN fabric and are typically used for spine-leaf connectivity. Inter-fabric links are set up between a VXLAN fabric, and typically other External or VXLAN fabrics. They are used for external WAN and/or DCI connectivity. A policy is associated with each link that effectively states the configuration that is applied to both ends of the link. In other words, the link policy becomes the parent of the individual child interface policies that are associated with the two interfaces that form the link. In this scenario, you must edit the link policy to edit the interface policy fields such as description, IP address, and any per interface freeform configuration.
Follow these steps to edit the interfaces associated with links:
-
Click the Interfaces tab.
-
Choose a link and click Actions > Maintenance > Rediscover.
Delete interfaces
To delete the interfaces from Nexus Dashboard, perform the following steps:
-
This option allows you to delete only logical ports, port channels, and vPCs. You can delete the interface if it does not have overlay or underlay policy attached.
-
When a port channel or vPC is removed, the corresponding member ports get the default policy associated. The default policy can be configured in server.properties file.
-
Click the Interfaces tab.
-
Choose the interfaces and click Actions > Delete.
You cannot delete logical interfaces created in the fabric underlay.
-
Click Save.
-
Click Deploy to delete the interface.
Shut down and bring up interfaces
To shut down and bring up the interfaces from Nexus Dashboard:
-
Click the Interfaces tab.
-
Choose the interfaces that you want to shut down or bring up.
Note: For all interfaces except VLANs, you cannot perform a Shutdown or No Shutdown on interfaces that do not have a policy attached.
-
Click Actions > Configuration > Shutdown to disable the selected interfaces. For example, you may want to isolate a host from the network or a host that is not active in the network.
A confirmation page appears where you can save, preview, and deploy the changes.
-
Click Save to preview or deploy the changes.
-
Click Actions > Configuration > No Shutdown to bring up the selected interfaces.
A confirmation page appears where you can save, preview, and deploy the changes.
-
Click Save to preview or deploy the changes.
View interface configuration
To view the interface configuration commands and execute them from Nexus Dashboard, perform the following steps:
-
Click the Interfaces tab.
-
Choose the interface with configurations that you want to view and choose Actions > Maintenance > Show Commands.
-
On the Interface show commands page, select the action from the Commands drop-down list and click Execute.
The interface configurations are displayed on the right of the screen.
For show commands, you must have corresponding show templates for interface or interface sub types like port channel or vPC, defined in the Templates.
Rediscover interfaces
To rediscover the interfaces from Nexus Dashboard:
-
Click the Interfaces tab.
-
Choose the interfaces that you want to rediscover and choose Actions > Maintenance > Rediscover to rediscover the selected interfaces.
For example, after you edit or enable an interface, you can rediscover the interface.
View interface history
To view the interface history from Nexus Dashboard, perform the following steps:
-
Click the Interfaces tab.
-
Select the interface and choose Actions > Maintenance > History to view the configuration history on the interface.
-
Click Status to view each command that is configured for that configuration instance.
Deploy interface configurations
To deploy the interface configuration from Nexus Dashboard, perform the following steps:
-
Click the Interfaces tab.
-
Choose an interface that you want to deploy and choose Actions > Configuration > Deploy to deploy or redeploy configurations that are saved for the interface.
You can select multiple interfaces and deploy pending configurations.
After you deploy the interface configuration, the interface status information is updated. However, the overall switch-level state may be in the pending state, which is in blue. The overall switch-level state goes to the pending state whenever there is a change in intent from any module, such as interface, link, policy template update, top-down, or so on. In the pending state, a switch may have pending configurations or switch-level recomputation. The switch-level recomputation occurs when:
-
You deploy for the switch
-
During a deploy
-
During hourly sync
-
Create external fabric interfaces
You can add and edit port channel, vPC, subinterface, and loopback interfaces for external fabric devices. You cannot add Straight-through FEX and Active-Active FEX functions.
The Breakout port function is only supported for the Cisco Nexus 9000, 3000, and 7000 Series Switches in the external fabric.
When you add an interface to an external fabric device, the Resource Manager is not in sync with the device. So, ensure that the value populated in the ID field (Port-channel ID, vPC ID, Loopback ID, etc) is not previously configured on the switch.
If you want to configure a portchannel in the external fabric, you should add and deploy the feature_lacp policy on the switches where the portchannel will be configured.
When an external fabric is set to Fabric Monitor Mode Only, you cannot deploy configurations on its switches. If you click Save & Deploy in the fabric topology screen, it displays an error message. However, the following settings (available when you right-click the switch icon) are allowed:
-
vPC pairing — You can designate a vPC switch pair, but it is only for reference.
-
View/edit policy — You can add a policy but you cannot deploy it on the switch.
-
Manage interfaces — You can only create intent for adding interfaces. If you try to deploy, edit, or delete interfaces, it results in an error message.
Sync up out-of-band switch interface configurations
Any interface level configuration made outside of Nexus Dashboard (via CLI) can be synced to Nexus Dashboard and then managed from Nexus Dashboard. Also, the vPC pair configurations are automatically detected and paired. This applies to the External and Classic LAN fabrics only. The vPC pairing is performed with the vpc_pair policy.
When Nexus Dashboard is managing switches, ensure that all configuration changes are initiated from Nexus Dashboard and avoid making changes directly on the switch.
When the interface config is synced up to the Nexus Dashboard intent, the switch configs are considered as the reference, that is, at the end of the sync up, the Nexus Dashboard intent reflects what is present on the switch. If there were any undeployed intent on Nexus Dashboard for those interfaces before the resync operation, they will be lost.
Guidelines
-
Supported in fabrics using the following fabric templates: Data Center VXLAN EVPN, External, and Classic LAN.
-
Supported for Cisco Nexus switches only.
-
Supported for interfaces that do not have any fabric underlay related policy associated with them prior to the resync. For example, IFC interfaces and intra fabric links are not subjected to resync.
-
The time taken by host port resync depends on the number of switches/interfaces to be synchronized.
-
Supported for interfaces that do not have any custom policy (policy template that is not shipped with Cisco Nexus Dashboard) associated with them prior to resync.
-
Supported for interfaces where the intent is not exclusively owned by a Cisco Nexus Dashboard feature and/or application prior to resync.
-
Supported on switches that do not have Interface Groups associated with them.
-
Interface mode (switchport to routed, trunk to access, and so on) changes are not supported with overlays attached to that interface.
The sync up functionality is supported for the following interface modes and policies:
|
Interface Mode |
Policies |
|
trunk (standalone, po, and vPC PO) |
|
|
access (standalone, po, and vPC PO) |
|
|
dot1q-tunnel |
|
|
routed |
int_routed_host |
|
loopback |
int_freeform |
|
sub-interface |
int_subif |
|
FEX (ST, AA) |
|
|
breakout |
interface_breakout |
|
nve |
int_freeform (only in External_Fabric/Classic LAN) |
|
SVI |
int_freeform (only in External_Fabric/Classic LAN) |
|
mgmt0 |
int_mgmt |
The interface resync automatically updates the network overlay attachments based on the access VLAN or allowed VLANs on the interface.
After Nexus Dashboard completes the resync operation, the switch interface intent can be managed using normal Nexus Dashboard procedures.
Sync up switch interface configurations
We recommend that you deploy all switch configurations from Nexus Dashboard. In some scenarios, it may be necessary to make changes to the switch interface configuration out-of-band. This will cause configuration drift causing switches to be reported Out-of-Sync.
Nexus Dashboard supports syncing up the out-of-band interface configuration changes back into its intent.
Guidelines and limitations
The following limitations are applicable after syncing up the switch interface configurations to Nexus Dashboard:
-
This feature is not supported on ToR/Access switches, or on leaf switches with ToR pairing present.
-
The port channel membership changes (once the policy exists) are not supported.
-
Changing the interface mode (trunk to access and so on) that have overlays attached is not supported.
-
Resync for interfaces that belong to Interface Groups are not supported.
-
The vPC pairing in External_Fabric and Classic LAN templates must be updated with the vpc_pair policy.
-
The resync can be performed for a set of switches and repeated as desired.
-
The time taken by host port resync depends on the number of switches/interfaces to be synchronized.
-
In Data Center VXLAN EVPN fabrics, VXLAN overlay interface attachments are performed automatically based on the allowed VLANs.
Before you begin
-
We recommend taking a fabric backup before attempting the interface resync.
-
In External Fabric and Classic LAN fabrics, for the vPC pairing to work correctly, both the switches must be in the fabric and must be functional.
-
Ensure that the switches are In-Sync and switch mode must not be Migration or Maintenance.
-
From the Actions drop-list, choose Discovery > Rediscover to ensure that Nexus Dashboard is aware of any new interfaces and other changes.
Procedure
-
Choose Manage > Fabrics and single-click on a fabric.
The Fabric Overview window appears.
-
Click Inventory > Switches and ensure that switches are present in the fabric.
-
Click Inventory > vPC Pairs and ensure that vPC pairings are completed.
-
Click Configuration Policies > Policies tab and choose one or more switches where the interface intent resync is needed.
-
If a pair of switches is already paired with either no_policy or vpc_pair, select only one switch of the pair.
-
If a pair of switches is not paired, then select both the switches.
-
-
From the Actions drop-down list, choose Add policy.
The Create Policy window appears.
-
On the Create Policy window, choose host_port_resync from the Policy drop-down list.
-
Click Save.
-
Click Inventory > Switches, then check the Mode column for the switches to ensure that they report Migration. For a vPC pair, both switches are in the Migration-mode.
-
After this step, the switches in the Topology view are in Migration-mode.
-
Both the switches in a vPC pair are in the migration mode even if one of the switches is placed into this mode.
-
If switches are unintentionally put into the resync mode, they can be moved back to the normal mode by identifying the host_port_resync policy instance and deleting it from the Policies tab.
-
-
After the configuration changes are ready to sync up to Nexus Dashboard, navigate to the Switches tab and select the required switches.
-
Click Actions > Recalculate and deploy to start the resync process.
This process might take some time to complete based on the size of the switch configuration and the number of switches involved.
-
The Deploy Configuration window is displayed if no errors are detected during the resync operation. The interface intent is updated in Nexus Dashboard.
If the External_Fabric or Classic LAN fabric is in Monitored Mode, an error message indicating that the fabric is in the read-only mode is displayed. This error message can be ignored and doesn’t mean that the resync process has failed.
Close the Deploy Configuration window, and you can see that the switches are automatically moved out of the Migration-mode. Switches in a vPC pair that were not paired or paired with no_policy show up as paired and associated with the vpc_pair policy.
The host_port_resync policy that was created for the switch is automatically deleted after the resync process is completed successfully.
Links
You can add links between border switches of different fabrics (inter-fabric links) or between switches in the same fabric (intra-fabric links). You can only create an inter-fabric connection (IFC) for a switch that is managed by Nexus Dashboard.
There are scenarios where you might want to define links between switches before connecting them physically. The links could be inter-fabric or intra-fabric links. Doing so, you can express and represent your intent to add links. The links with intent are displayed in a different color till they are actually converted to functional links. Once you physically connect the links, they are displayed as connected.
Management links might show up in the fabric topology as red colored links. To remove such links, right-click the link and click Delete Link.
The Border Spine and Border Gateway Spine roles are added to switch roles for border switches.
You can create links between existing and pre-provisioned devices as well by selecting the pre-provisioned device as the destination device.
These are the subtabs available under Links:
Links
The following table describes the fields that appear on the Links tab.
|
Field |
Description |
|
Fabric Name |
Specifies the name of the Fabric. |
|
Name |
Specifies the name of the link. The list of previously created links is displayed. The list contains intra-fabric links, which are between switches within a fabric, and inter-fabric links, which are between border switches in this fabric and switches in other fabrics. |
|
Policy |
Specifies the link policy. |
|
Info |
Provides more information about the link. |
|
Admin State |
Displays the administrative state of the link. |
|
Oper State |
Displays the operational state of the link. |
The following table describes the action items, in the Actions menu drop-down list, that appear on Fabric Overview > Links > Links.
|
Action Item |
Description |
|
Create |
Allows you to create the following links: |
|
Edit |
Allows you to edit the selected fabric. |
|
Delete |
Allows you to delete the selected fabric. |
|
Import |
You can import a CSV file containing details of links to add new links to the fabric. The CSV file should have the following details of links: link template, source fabric, destination fabric, source device, destination device, source switch name, destination switch name, source interface, destination interface, and nvPairs.
You cannot update existing links. |
|
Export |
Select Actions > Export to export the links in a CSV file. The following details of links are exported: link template, source fabric, destination fabric, source device, destination device, source switch name, destination switch name, source interface, destination interface, and nvPairs. The nvPairs field consists JSON object. |
Protocol View
This tab displays the protocols for the links in the selected fabric.
The following table describes the fields that appear on Protocol View tab.
| Field | Description |
|---|---|
|
Fabric Name |
Specifies the name of the fabric. |
|
Name |
Specifies the name of the link. |
|
Is Present |
Specifies if the link is present. |
|
Link Type |
Specifies the type of link. |
|
Link State |
Specifies the state of link. |
|
UpTime |
Specifies the time duration from when the link was up. |
To delete a protocol for links in a selected fabric, choose the protocol and click Actions > Delete.
Create intra-fabric links
To create intra-fabric links:
-
Click the Links tab.
-
Click Actions > Create.
The Link Management - Create Link page appears.
-
From the Link Type drop-down list, choose Intra-Fabric since you are creating an IFC. The screen changes correspondingly.
The fields are:
-
Link Type — Choose Intra-Fabric to create a link between two switches in a fabric.
-
Link Sub-Type — This field populates the fabric indicating that this is a link within the fabric.
-
Link Template — You can choose any of the following link templates.
-
int_intra_fabric_num_link — If the link is between two ethernet interfaces assigned with IP addresses, choose int_intra_fabric_num_link.
-
int_intra_fabric_unnum_link — If the link is between two IP unnumbered interfaces, choose int_intra_fabric_unnum_link.
-
int_intra_vpc_peer_keep_alive_link — If the link is a vPC peer keep-alive link, choose int_intra_vpc_peer_keep_alive_link.
-
int_pre_provision_intra_fabric_link — If the link is between two pre-provisioned devices, choose int_pre_provision_intra_fabric_link. After you click Save & Deploy, an IP address is picked from the underlay subnet IP pool.
Correspondingly, the Link Profile section field is updated.
-
-
Source Fabric — The fabric name populates this field since the source fabric is known.
-
Destination Fabric — Choose the destination fabric. For an intra-fabric link, source and destination fabrics are the same.
-
Source Device and Source Interface — Choose the source device and interface.
-
Destination Device and Destination Interface — Choose the destination device and interface.
Select the pre-provisioned device as the destination device if you are creating a link between an existing device and a pre-provisioned device.
In the General tab in the Link Profile section:
-
Interface VRF — Name of a non-default VRF for this interface.
-
Source IP and Destination IP — Specify the source and destination IP addresses of the source and destination interfaces, respectively.
The Source IP and Destination IP fields do not appear if you choose the int_pre_provision_intra_fabric_link template.
-
Interface Admin State — Check or uncheck the check box to enable or disable the admin state of the interface.
-
MTU — Specify the maximum transmission unit (MTU) through the two interfaces.
-
Source Interface Description and Destination Interface Description — Describe the links for later use. For example, if the link is between a leaf switch and a route reflector device, you can enter the information in these fields (link from leaf switch to RR 1 and link from RR 1 to leaf switch). This description gets converted into a configuration, but will not be pushed into the switch. After Save & Deploy, it is reflected in the running configuration.
-
Disable BFD Echo on Source Interface and Disable BFD Echo on Destination Interface — Check the check box to disable BFD echo packets on the source and the destination interface.
Note that the BFD echo fields are applicable only when you have enabled BFD in the fabric settings.
-
Source Interface Freeform CLIs and Destination Interface Freeform CLIs — Enter the freeform configurations specific to the source and destination interfaces. You should add the configurations as displayed in the running configuration of the switch, without indentation. For more information, see Enabling Freeform Configurations on Fabric Switches.
-
-
Click Save at the bottom right part of the page.
You can see that the IFC is created and displayed in the list of links.
-
On the Fabric Overview Actions drop-down list, choose Recalculate Config.
The Deploy Configuration page appears.
It displays the configuration status on the switches. You can also view the pending configurations by clicking the respective link in the Pending Config column. It lists the pending configurations on the switch. The Side-by-Side Comparison tab displays the running configuration and the expected configuration side-by-side.
Close the Pending Config page.
-
From the Fabric Overview Actions drop-down list, click Deploy Config.
The pending configurations are deployed.
After ensuring that the progress is 100% in all the rows, click Close at the bottom part of the page. The Links page displays again. In the fabric topology, you can see that the link between the two devices is displayed.
Create inter-fabric links
-
Click the Links tab.
In external fabrics, inter-fabric links support BGW, Border Leaf/Spine, and edge router switches. To create inter-fabric links, perform the following steps:
-
Click Actions > Create.
The Link Management - Create Link page appears.
-
From the Link Type drop-down box, choose Inter-Fabric since you are creating an IFC. The page changes correspondingly.
The fields for inter-fabric link creation are as follows:
Field Description Link Type
Choose Inter-Fabric to create an inter-fabric connection between two fabrics, over their border switches.
Link Sub-Type
This field populates the IFC type. From the drop-down list, choose VRF_LITE, MULTISITE_UNDERLAY, or MULTISITE_OVERLAY.
For information about VXLAN MPLS interconnection, see Editing Data Center VXLAN EVPN Fabric Settings.
For information about routed fabric interconnection, see the section "Creating Inter-Fabric Links Between a Routed Fabric and an External Fabric" in Managing BGP-Based Routed Fabrics.
Link Template
The link template is populated.
The templates are autopopulated with corresponding prepackaged default templates that are based on your selection.
You can add, edit, or delete user-defined templates. See Managing Your Template Library for more details.
Source Fabric
This field is prepopulated with the source fabric name.
Destination Fabric
Choose the destination fabric from this drop-down box.
Source Device and Source Interface
Choose the source device and Ethernet interface that connects to the destination device.
Destination Device and Destination Interface
Choose the destination device and Ethernet interface that connects to the source device.
Based on the selection of the source device and source interface, the destination information is autopopulated based on Cisco Discovery Protocol information, if available. There is an extra validation that is performed to ensure that the destination external device is indeed part of the destination fabric.
-
Navigate to the General Parameters tab.
Field Description Source BGP AS#
In this field, the AS number of the source fabric is autopopulated.
Source IP Address/Mask
In this field, enter the IPv4 address with a netmask of the source interface that connects to the destination device.
Destination IP Address
In this field, enter the IPv4 address of the destination interface.
Source IPv6 Address/Mask
In this field, enter the IPv6 address with a netmask of the source interface.
Destination IPv6 Address
In this field, enter the IPv6 address of the destination interface.
Destination BGP ASN Address
Specifies the BGP autonomous system number for the destination fabric.
BGP Maximum Paths
Specifies the maximum number of iBGP/eBGP paths. The valid value is between 1 and 64.
Routing TAG
Specifies the routing tag associated with the interface IP.
Link MTU
Specifies the interface MTU for both ends of the inter-fabric link.
-
Click Save at the bottom-right part of the screen.
You can see that the IFC is created and displayed in the list of links.
-
On the Fabric Overview > Actions drop-down list, select Recalculate Config.
The Deploy Configuration page displays.
It displays the configuration status on the switches. You can also view the pending configurations by clicking the respective link in the Pending Config column. It lists the pending configurations on the switch. The Side-by-side Comparison tab displays the running configuration and expected configuration side by side.
Close the Pending Config screen.
-
From the Fabric Overview > Actions drop-down list, select Deploy Config.
The pending configurations are deployed.
After ensuring that the progress is 100% in all the rows, click Close at the bottom part of the page. The Links page comes up again. In the fabric topology, you can see that the link between the two devices is displayed.
If the two fabrics are member fabrics of an MSD, then you can see the link in the MSD topology too.
What’s next:
When you enable the VRF-Lite function using the ToExternalOnly method or using a VXLAN fabric group for inter-fabric connectivity, IFCs are automatically created between the (VXLAN fabric) border/BGW device and connected (external fabric) edge router or core device. When you remove the ER/core/border/BGW device, the corresponding IFCs (link PTIs) to/from that switch are deleted on Nexus Dashboard. Next, Nexus Dashboard removes the corresponding IFC configurations, if any, from the remaining devices on the next Save & Deploy operation. Also, if you want to remove a device that has an IFC and overlay extensions over those IFCs, you should undeploy all the overlay extensions corresponding to those IFCs for switch delete to be possible.
-
To undeploy VRF extensions, select the VXLAN fabric and the extended VRFs, and undeploy the VRFs on the VRF deployment page.
-
To delete the IFCs, delete the IFCs from the Links tab.
-
Ensure that the fabric switch names are unique. If you deploy VRF extensions on switches with the same name, it leads to an erroneous configuration.
The new fabric is created, the fabric switches are discovered in Nexus Dashboard, the underlay networks that are provisioned on those switches, and the configurations between Nexus Dashboard and the switches are synced.
The remaining tasks are:
-
Provision interface configurations such as vPCs, loopback interface, and subinterface configurations. See Interfaces for more information.
-
Create overlay networks and VRFs and deploy them on the switches. Refer to Working with Segmentation and Security for Your Nexus Dashboard VXLAN Fabric.
-
Hosts
To navigate to the Hosts page:
-
Click Hosts.
The Hosts includes the following subtabs:
Discovered Hosts Summary
-
Click Hosts.
-
Click the Discovered Hosts Summary subtab.
You can view a summary of all the hosts that are populated through telemetry in this page.
Discovered Hosts Summary Table Fields and Description Field Description VRF
Specifies the VRF for the host.
Host
Specifies the IP address for the host.
Senders/Receivers
Specifies the number of times the host device plays its role as a sender or a receiver. Click the count to view where it was used.
Click the table header to sort the entries in alphabetical order of that parameter.
Discovered Hosts
-
Click Hosts.
-
Click the Discovered Hosts subtab.
You can view all the hosts that are populated through telemetry on this page. After the switches are discovered, all the switches in the fabric will push data to the Nexus Dashboard server at regular intervals using telemetry. The Nexus Dashboard server displays the received events and flow statistics for each active flow.
Field Description VRF
Specifies the VRF for the host.
Host
Specifies the IP address for the host.
Role
Specifies the role of the host device. The role of the host can be one of the following:
-
Sender
-
External Sender
-
Dynamic Receiver
-
External Receiver
-
Static Receiver
Multicast Group
Specifies the multicast address of the flow in which the host participates.
Source
Specifies the source of the flow which the discovered host participates in.
Switch
Specifies the name of the switch.
Interface
Specifies the interface to which the host is connected to on the sender or receiver switch.
MAC Address
Specifies the MAC address of a physical host, if the switch has ARP entry for that host).
Host Discovered Time
Specifies the date and time at which the switch discovered the host.
Fault Reason
Specifies the failure reason for the flow that the discovered host has participates in.
Click the table header to sort the entries in alphabetical order of that parameter.
-
Host Policies
-
Click Hosts.
-
Click the Host Policies subtab to configure the host policies.
You can add policies to the host devices.
Switches must be deployed with default host policies. You can edit the default host policies to permit or deny. From the Deployment drop-down list, select Deploy selected policies to deploy the default policies to the switches. You can also deploy all the default policies to all the managed switches by selecting Deploy all default policies even without selecting any default policies.
By default, the sequence numbers for policies are auto-generated by Nexus Dashboard and Multicast mask/prefix is taken as /32. If you want to enter the required values for the sequence number and the multicast mask/prefix in the appropriate fields, ensure that the Enable mask/prefix for the multicast range in Host Policy check box under the Admin > System Settings > Server Settings > *Fabric management > Advanced Settings > IPFM tab is enabled. Then, you can enter the sequence number and the multicast mask/prefix in the appropriate fields available in the Create host policy and Edit host policy options available in the Actions drop-down list on the Host Policies page.
The default host policies must be deployed successfully to the switch before you deploy the custom host policies on that switch. Otherwise, the custom policies will fail to deploy. Ensure that you deploy all default policies successfully to all the switches before you create, edit, import, or deploy custom policies.
When a user logs in to Nexus Dashboard with a network operator role, all the buttons or options to create, delete, edit, import, export, or deploy policies are disabled. This user can only view policies, and deployment status or history.
Policies are automatically deployed to switches whenever they are created, edited, or imported. You can choose to undeploy or redeploy the policies, by selecting one or more check boxes next to the policies and choosing the appropriate actions in the Actions drop-down list. The policies will not be deployed correctly if the device is rebooting while the policy was deployed. In such case, the Failed message appears in the Deployment Status column on the Host Policies page.
If you have created a custom or non-default VRF, although the host and flow policies are automatically created for the VRF, use the action options on this page to manually deploy the host policies to the switches in the fabric.
This table describes the action items in the Actions drop-down list that appear on the Host Policies page.
| Action Item | Description |
|---|---|
|
Create host policy |
Allows you to create a new host policy. For instructions about creating a host policy, see Create a host policy. |
|
Edit host policy |
Allows you to view or edit the selected host policy parameters. To edit the host policy, select the check box next to the host policy that you want to delete and choose Edit host policy. On the Edit host policy page, edit the required values and click Save & Deploy to configure and deploy the policy or click Cancel to discard the host policy. The edited host policy is shown in the table ion the Host Policies page.
The changes made to host policy are applied immediately. If the policy is already applied to any device, the changes may impact the existing flows. |
|
Delete host policy |
Allows you to delete user-defined host policies.
To delete a host policy, select the check box next to the host policy that you want to delete and choose Delete host policy. You can choose multiple host policy entries and delete them at the same instance. A delete host policy success message appears at the bottom of the page. |
|
Purge |
Allows you to delete all custom policies without selecting any policy check box.
|
|
Import |
Allows you to import host policies from a .csv file to Nexus Dashboard.
After import, all policies imported from a .csv file are applied to all managed switches automatically. To import a host policies, choose Import. Browse the directory and select the .csv file that contains the host policy configuration information. The policy will not be imported if the format in the .csv file is incorrect. Click Open. The imported policies are automatically deployed to all the switches in the fabric. |
|
Export |
Allows you to export host policies from Nexus Dashboard to a .csv file. To export host policies, choose Export. Select a location on your local system directory to store the host policy details file. Click Save. The host policy file is exported to your local directory. The filename is appended with the date on which the file is exported. The format of the exported file is .csv. |
|
Deploy selected policies |
Choose this option to deploy only the selected policies to the switch. |
|
Deploy all custom policies |
Choose this option to deploy all the custom or user-defined policies to the switch in a single instance. If the policies are deployed when the switch is rebooting, the deployment fails and a failed status message appears. |
|
Deploy all default policies |
Choose this option to deploy all default policies to the switch. |
|
Undeploy Selected Policies |
Choose this option to undeploy the selected policies.Select one or more check boxes next to the policy name. Select this option from the drop-down list to undeploy the selected policies. |
|
Undeploy All Custom Policies |
Choose this option to undeploy all the custom or user-defined policies in a single instance. |
|
Undeploy All Default Policies |
Choose this option to undeploy the default policies. |
|
Redo All Failed Policies |
The deployment of policies may fail due to various reasons. Select this option to deploy or undeploy all failed policies.All the deployments that failed on switches previously will be deployed again to only those switches. All the undeployments that failed on switches previously are undeployed again from only those switches. |
|
Deployment History |
Choose one policy from the drop-down list. Choose this option to view the deployment history of the selected policy in the Deployment History pane. The policy name is shown in the Policy Name field. From the drop-down list, choose the switch on which this policy was deployed. The Deployment History pane displays these fields.
|
This table describes the fields that appear on the Host Policies page.
|
Field |
Description |
|
VRF |
Specifies the VRF for the host. The fields, Deployment, Undeployment, Status, and History, are based on the VRF. |
|
Policy Name |
Specifies the policy name for the host, as defined by the user. |
|
Receiver |
Specifies the IP address of the receiving device. |
|
Multicast IP/Mask |
Specifies the multicast IP address for the host. |
|
Sender |
Specifies the IP address of the transmitting device. |
|
Host Role |
Specifies the host device role. The host device role is one of the following:
|
|
Operation |
Specifies if the operation of the host policy. The policy has the following operations:
|
|
Sequence Number |
Specifies the sequence number of the custom policy when the multicast range is selected. |
|
Deployment Action |
Specifies the action performed on the switch for that host policy.
|
|
Deployment Status |
Specifies if the deployment is successful, failed, or the policy is not deployed. |
|
Last Updated |
Specifies the date and time at which the host policy was last updated. The format is Day MMM DD YYYY HH:MM:SS Timezone. |
Deployment Status
This table describes the fields that appear on the Deployment Status page.
|
Field |
Description |
|
Policy Name |
Specifies the name of the host policy. |
|
VRF |
Specifies the name of the VRF. |
|
Switch Name |
Specifies the switch on which the VRF is deployed. |
|
IP Address |
Specifies the IP address of the switch. |
|
Deployment Status |
Displays the status of the deployment. It shows if the deployment was a Success or Failed along with the reason why the deployment failed. |
|
Action |
Specifies the action that is performed on the switch, for example, Create. |
|
Deployment Date/Time |
Displays the date and time when the deployment was initialized. |
Create a host policy
The default host policies must be deployed successfully to the switch before you deploy the custom host policies on that switch. Otherwise, the custom policies will fail to deploy. Ensure that you deploy all default policies successfully to all the switches before you add custom policies.
To create a host policy:
-
Click Hosts.
-
Click the Host Policies subtab.
-
In the Host Policies page, click Actions > Create host policy.
-
In the Create host policy page, specify the parameters in the following fields.
-
VRF - Click the Select a VRF link to open the Select a VRF page. The default VRF is also listed in the page. Search and select a VRF for the host and click Save.
Policy names can be repeated across VRFs, that is, they are unique only within a VRF.
Across the VRF, host policies may be same or different.
-
Policy Name - Specifies a unique policy name for the host policy.
-
Host Role - Specifies the host as a multicast sender or receiver. Select one of the following:
-
Sender
-
Receiver-Local
-
Receiver-External
-
-
Sender Host Name - Specifies the sender host to which the policy is applied.
Hosts that are discovered as remote senders can be used for creating sender host policies.
-
Sender IP - Specifies the IP address of the Sender host. Note that you can specify wildcard for this IP address by specifying the * (asterisk) symbol or 0.0.0.0 in this field.
-
Receiver Host Name - Specifies the receiver host to which the policy is applied. If a destination host is detected, you can choose the hostname from the drop-down list.
Do not select hosts that are discovered as remote receivers to create receiver or sender host policies. However, hosts that are discovered as remote senders can be used for creating sender host policies.
-
Receiver IP - Specifies the IP address of the receiver host. This field is visible and is applicable only if the Host Role is set to Receiver-Local. Note that you can specify wildcard for this IP address by specifying the * (asterisk) symbol or 0.0.0.0 in this field.
When Receiver IP in a receiver host policy is a wildcard (* or 0.0.0.0), Sender IP also has to be a wildcard (* or 0.0.0.0).
-
Multicast - Specifies the multicast IP Address for the host policy. Note that you can specify wildcard for this IP address by specifying the * (asterisk) symbol in this field. This will translate to 224.0.0.0/4. If you specify a wildcard IP address for Sender IP and Receiver IP fields, the Multicast Group is always required, that is, you cannot specify multicast as * or 0.0.0.0.
-
Permit/Deny - Click Permit if the policy must allow the traffic flow. Click Deny if the policy must not allow the traffic flow.
-
-
Click Save & Deploy to configure and deploy the Policy. Click Cancel to discard the new policy. The deployment completed message appears at the bottom of the page. You can click Refresh to refresh the current deployment status in the page or click View Details to verify the deployment details.
Host Alias
This section is applicable for both the IPFM and Generic Multicast modes in Nexus Dashboard.
Cisco Nexus Dashboard allows you to create host aliases for sender and receiver hosts for IPFM fabrics. The active multicast traffic transmitting and receiving devices are termed as hosts. You can add a host-alias name to your sender and receiver hosts, to help you identify the hosts by a name. You can also import many Host Alias to Cisco Nexus Dashboard with IPFM deployment.
To navigate to the Host Alias page:
-
Click Hosts.
-
Click the Host Alias subtab.
This table describes the action items in the Actions drop-down list that appear on the Host Alias page.
| Action Item | Description |
|---|---|
|
Create host alias |
Allows you to create a new host alias. For instructions about creating a new host alias, see Create a host alias. |
|
Edit host alias |
Allows you to view or edit the selected host alias parameters. To edit the host alias, select the check box next to the host alias that you want to delete and choose Edit host alias. In the Edit host alias page, edit the required values and click Submit to apply the changes or click Cancel to discard the host alias. The edited host alias is shown in the table in the Host Alias page. |
|
Delete host alias |
Allows you to delete the host alias. To delete a host alias, select the check box next to the host alias that you want to delete and choose Delete host alias. You can select multiple host alias entries and delete them at the same instance. |
|
Import |
Allows you to import host aliases for devices in the fabric. To import host aliases, choose Import. Browse the directory and select the .csv file that contains the host IP address and corresponding unique host name information. Click Open. The host aliases are imported and displayed in the Host Alias page. |
|
Export |
Allows you to export host aliases for devices in the fabric. To export a host alias, choose Export. Select a location on your local system directory to store the host aliases configuration from Nexus Dashboard and click Save. The host alias configuration file is exported to your local directory. The file name is appended with the date and time at which the file was exported. The format of the exported file is .csv. |
| Field | Description |
|---|---|
|
VRF |
Specifies the VRF for the host. |
|
Host Alias |
Specifies the host name that is configured to identify the host. |
|
IP Address |
Specifies the IP address of the host connecting to the switch, which you want to refer with an alias name. |
|
Last Updated At |
Specifies the date and time at which the host alias was last updated. |
Create a host alias
To create a host alias from the Cisco Nexus Dashboard:
-
Click Hosts.
-
Click the Host Alias subtab.
-
In the Host Alias page, from the Actions drop-down list, choose Create host alias.
-
In the Create host alias page, enter the following:
All the fields are mandatory.
-
VRF — Select the VRF from this drop-down list. The default value is default.
Host and IP Address are unique per VRF, that is, same host name with the same IP Address can exist in multiple VRFs.
-
Host Name — Enter a fully qualified unified hostname for identification.
-
IP Address — Enter the IP address of the host that is part of a flow.
You can also create host alias before a host sends any data to its directly connected sender or receiver leaf.
-
-
Click Submit to apply the changes.
Click Cancel to discard the host alias.
The new host alias is shown in the table in the Host Alias page.
Applied Host Polices
You can view the policies that you have applied in the entire network in the Applied Host Policies page.
To navigate to the Applied Host Policies page:
-
Click Hosts.
-
Click the Applied Host Policies subtab.
The table displays default PIM policy, local receiver policy, and sender policy. IPFM does not display user-defined PIM Policies or Receiver External Policies.
| Field | Description |
|---|---|
|
VRF |
Specifies the VRF for the host. |
|
Policy Name/Sequence # |
Specifies the name of the policy applied. |
|
Host Role |
Specifies the role of the host.The host device role is either one of the following:
|
|
Switch |
Specifies the name of the switch to which the policy is applied. |
|
Interface |
Specifies the interface to which the policy is applied. |
|
Active |
Specifies if the policy is active or not. |
|
Timesttamp |
Specifies the date and time at which the policy was created\deployed.The format is Day, MMM DD YYYY HH:MM:SS (Timezone). |
Flows
Flows provides deep insights at a flow level giving details such as average latency and packet drop indicator. It also raises anomalies when the latency of the flows increase or when packets get dropped because of congestion or forwarding errors.
Each flow has a packet counter representing the number of packets entering the ASIC for that flow over a period of time. This period of time is called aggregation interval. There are several points where flow statistics for a given flow can be aggregated. Aggregation can happen in the ASIC, switch software, and server software.
The Flows section of Nexus Dashboard displays the telemetry information collected from various devices in the fabric that were added to the fabric.
For details on Flow Telemetry support for Cisco Nexus series switches and line cards, see the "Compatibility Information" section in the Nexus Dashboard Release Notes.
Flows hardware requirements
For details on Flow Telemetry support for Cisco Nexus platform switches, see the "Compatibility Information" section in the Nexus Dashboard Release Notes.
Flows guidelines and limitations for NX-OS fabrics
For details on Flow Telemetry hardware support, see the "Compatibility Information" section in the Nexus Dashboard Release Notes.
-
Output port information for outgoing traffic from N9K-C93180YC-EX, N9K-C93108TC-EX, and N9K-C93180LC-EX line cards will not be displayed.
-
Flows does not support multicast traffic. The access list must be provisioned to exclude the multicast traffic flows.
-
A maximum of 63 VRFs are supported on flow telemetry nodes.
-
The number of anomalies in the Fabric Overview dashboard will not match the number of anomalies in the flow browse page. The Fabric Dashboard contains the total anomaly count for the time range you selected. The flow records are not aggregated in the flow browse view, where multiple flow records can point to the same anomaly entry.
-
The L3-VNI flows show as L2-VNI flows when the VXLAN flow is dropped in the ingress node. When VXLAN packets are dropped in the first-hop, the exported VXLAN flow telemetry records will indicate the drop. However, they don’t carry the VNI information in it. The Ingress interface from the flow telemetry export along with the VRF associated with the interface, does not deduce if the flow is L2-VNI or L3-VNI. In this case Nexus Dashboard associates the L2-VNI for the flow.
-
When a VXLAN encapsulated packet enters an Cisco Nexus 9500-EX switch and feature overlay (EVPN) is configured, the packet will be treated like a VXLAN transit node packet. Also the ingress interface and egress interface are set as zeros in the flow telemetry export. The ingress and egress interfaces are needed to consider this record for flows. The limitation on these switches results in the Cisco Nexus 9500-EX switch not being considered in the path stitching and correlation if the switch is in ingress, transit, or egress direction. Cisco Nexus 9500-EX switches will be treated like a transit node for an overlay packet.
-
For Nexus Dashboard to work in VXLAN deployments, you must have symmetric configuration on the switches involved in the overlay. This enables Nexus Dashboard to correlate and stitch the overlay flows. When such a symmetric configuration is not present, the VXLAN feature and forwarding will work, but Nexus Dashboard will not stitch the flows correctly. See the following examples to understand what is meant by symmetric configuration on switches:
-
For Layer 2 VXLAN VNI cases: If vlan-x is mapped VNI-A in PE1, then the same vlan-x must be mapped to VNI-A in PE2, where PE1 and PE2 are VTEP endpoints for the Layer 2 overlay.
-
For Layer 3 VXLAN VNI cases: If SVI-x is mapped to VRF-A mapped VNI-P on PE1, then the same SVI-x must be mapped to VRF-A mapped VNI-P in PE2, where PE1 and PE2 are VTEP end points for the Layer 3 overlay.
-
-
The ingress and VRF information will not be shown for all interfaces which use the flow telemetry 'tenant-id' for encoding the logical interface ID, as this ID will be used for 'overlay-id'. It’s not possible to derive the logical interface (SVI with trunk port, sub interface, SVI with trunk and port channel) and get the VRF associated with it. This results in the flow browse page and details page not showing the ingress and egress VRFs.
-
On the Cisco Nexus 9500-EX switches connected to VPC pair, the current design limits in identifying the ingress leaf nodes between VPC pairs causing the loss of flow in Nexus Dashboard.
-
When there are 29 million anomalies in the indices, flow database writes are too slow, which causes KAFKA lag on 350 nodes supported for software telemetry and flow telemetry. The KAFKA lag results in partial data in Nexus Dashboard user interface.
-
Flows information is retained for 7 days or until flow database reaches 80%, which ever happens first, then older flows information is deleted from the database.
-
Flow telemetry and flow telemetry events will not export
drop bitif there is an egress ACL drop in Cisco Nexus FX switches. -
For Nexus Dashboard to receive Flow Telemetry data, the TCAM region for
ing-netflowmust be set to 512. See Nexus 9000 TCAM Carving.
-
For flows, if the time range you have selected is greater than 6 hours, the data may not get displayed. Select a time range that is less than or equal to 6 hours.
-
When the scale limit for anomalies is reached, some of the unhealthy flows may not be displayed as anomalies in the Flow Record Details page. A system issue is raised when this condition happens. Navigate to Admin > System Settings > System Issues to view the system issue.
-
For Layer 4 to Layer 7 Services only intra VRF is supported for flows. For Layer 4 to Layer 7 Services inter VRF is not supported for flows.
-
Multicast is not supported for Flow Telemetry.
-
When traffic flows through sub-interfaces, in the Flow Record Details page, sub-interface is displayed only in the ingress direction in the Flow Path area. In the egress direction the parent interface is displayed.
-
For unicast routes in Flow Telemetry, Layer 4 to Layer 7 Services traffic path visibility is supported on Cisco Nexus 9300 -GX2 and -FX3 platform switches.
-
Configuring Netflow on a switch before onboarding a Standalone NX-OS fabric on Nexus Dashboard and then enabling Flow Telemetry on the corresponding fabric from Nexus Dashboard could lead to anomalies being generated for incorrect configurations being pushed to the switch.
To resolve the issue, perform the following steps:
-
Remove switch from the Standalone NX-OS fabric.
-
Use the command
no feature netflowto remove Netflow from the switch. -
Add the switch back to the Standalone NX-OS fabric.
-
Enable Flow Telemetry.
-
-
When Flow Telemetry is disabled while one of the switches is unreachable, the fabric goes into the Disable Failed state. This is expected behavior. Following this condition, when the switch becomes available and you enable Flow Telemetry, the ACL configurations get corrupted.
We recommend either of these workarounds:
-
When this condition occurs and the fabric is in a Disable Failed state, retry the switch that is in this state. This will trigger the ACL to unconfigure successfully. Thereafter, when you enable the fabric, start a disable acl job to clean any existing ACLs in the switch.
-
If you have already enabled Flow Telemetry without cleaning the existing ACLs in the switch, then perform these actions:
-
Disable Flow Telemetry and then enable it.
-
Remove the switch that has the issue from the DCNM fabric and add it back in the fabric.
-
-
Extending flows to Cisco ACI tier-3 topologies in Nexus Dashboard
Flows implements 3-tier topology where a second tier of leaf nodes are connected to first tier of leaf nodes. In the 3-tier topology when flow packet traverses from one host to the other using multiple tiers, before they reach the destination host, the packet becomes an iVXLAN packet when it traverses through a tier-1 leaf node.
Guidelines and limitations
-
The Cisco APIC Release 4.2(4o) does not support a leaf node exporting flow telemetry in case of iVXLAN packet, resulting in an incomplete flow path and inadequate information to stitch together all the flows.
View flows
The Flows page displays telemetry information collected from various devices in an online fabric. The Flows records let the user visualize the flows per fabric. For a particular fabric, you can view flows by Anomaly Score, Packet Drop Indicator, and Average Latency.
The flows engine also runs machine-learning algorithms on the behavior of the flows to raise anomalies in the behavior, such as average latency and packet drop indicator. The graph represents the anomalies in the behavior over a period of time.
Flow telemetry and analytics gives in-depth visibility of the data plane. Flows collects the flow records streamed from the nodes and converts to understandable EPG-based flow records. Top nodes by flow anomalies displays the nodes in the network with the most anomalies.
To view flow details, you must first enable flows.
-
Click Manage > Fabrics, then click on the appropriate fabric.
-
Click Actions > Edit Fabric Settings.
-
Under General, verify that the Telemetry option is enabled in the Enabled features area.
-
Under Telemetry, verify that the Flow telemetry option is enabled in the Mode area.
To view flows:
-
Navigate to Connectivity > Flows.
-
Select a time range.
-
In the Fabric Flows by area select an option from the drop-down list to view flows by Anomaly Score, Packet Drop Indicator, and Average Latency. The graph displays a time series plot for flows properties recorded in the entire fabric. The flows recorded for Top Sources and Top Destinations are also displayed.
-
The Flows table displays information such as anomaly score, flow record time, nodes, flow type, protocol, latency, packet drop indicator.
-
Use the search bar to filter the flows. The Flows table displays the filtered flows. Click the column heading to sort the flows in the table.
-
Click Record Time to view the flow record details. The details include record time, flow type, aggregated flow information, ingress and egress information, flow path, anomalies, and trends for average latency, traffic, packet drop indicator, bursts.
Layer 4 to Layer 7 services traffic path visibility
You have expanded visibility in the Flow Path to Layer 4 to Layer 7 services external devices such as firewalls. Nexus Dashboard tracks the end-to-end flow across the service chain in real-time and helps locate data plane issues across the device silos. A non-NAT environment across all third-party vendors is supported.
For Layer 4 to Layer 7 services traffic path visibility, your flow telemetry must be enabled and the appropriate rules must be configured.
-
Click Manage > Fabrics, then click on your fabric.
-
Click Actions > Edit Fabric Settings.
-
Under General, verify that the Telemetry option is enabled in the Enabled features area.
-
Under Telemetry > Flow Collection, verify that the Flow telemetry option is enabled in the Mode area.
Based on your rules, if the flow is passing through Policy Based Redirects (for example, a firewall), it will display that information in the flow path.
View Layer 4 to Layer 7 services traffic path visibility
Follow these steps to view Layer 4 to Layer 7 services traffic path visibility.
-
Navigate to Manage > Fabrics.
-
Select Online Fabrics from the drop-down list.
-
Click a fabric name to view the fabric details.
-
Navigate to Connectivity > Flows.
-
Select a time range.
-
In the flows table, click Record Time to view the flow record details.
In the Path area, a graphical flow path will display the end-to-end information, from source to destination, and it will also identify the firewall in the path if a firewall is present. The graph also captures the end-to-end flow path network latency that is occurring. In the graph, if there are any anomalies, a red dot is displayed next to the symbol for the leaf switch or the spine switch.
-
Click Anomalies in the Flow Details page to view further details related to the anomaly.
In the current release firewalls are not supported for anomalies.
Guidelines and limitations for Layer 4 to Layer 7 services traffic path visibility
These guidelines and limitations are for Layer 4 to Layer 7 services traffic path visibility.
-
This feature is currently recommended only if policy-based redirect can be configured using the service graph for a Cisco ACI fabric or Layer 4 to Layer 7 services for an NX-OS fabric.
-
In the current release, firewalls are not supported for anomalies.
-
In the current release, the latency information that is being displayed is the network latency, and it does not capture the latency that is occurring in the firewall.
-
In the current release, NAT is not supported.
-
This feature is currently supported if you use these switches:
-
Cisco Nexus 9300-FX Platform Switches
-
Cisco Nexus 9300-FX2 Platform Switches
-
Cisco Nexus 9300-FX3 Platform Switches
-
Cisco Nexus 9300-GX Platform Switches
-
-
Policy-based redirect destinations on L3Out are not supported because such configurations use an internal VRF because of which only a partial flow path would be available.
-
In a Cisco ACI fabric, when the Layer 4 to Layer 7 services traffic is forwarding in Layer 2 (bridged mode), the flow analytics support is limited. Ingress and egress nodes detection is not accurate, and path summary is not available.
-
The service node displays as unknown for Layer 4 to Layer 7 traffic path visibility.
-
Without a service graph for Layer 4 to Layer 7 services, if the client > service node is VRF_A and the service node > server is VRF_B, the paths will be recorded as separate flows as there is no common or single contract to stitch the flows.
-
Load balancers are not supported.
Flow telemetry events
Flow telemetry events are enabled implicitly when flow telemetry is enabled, and on NX-OS fabrics flow rules are configured. The flow telemetry enables triggering events when a configured rule is met, where packets are exported to the collector for analysis.
Flow telemetry events enhance and complement current flows in Nexus Dashboard. They enrich anomaly generation for flow telemetry and flow telemetry events.
It monitors security, performance, and troubleshooting. This is achieved using the periodic flow table event records exported every second.
The data export to Nexus Dashboard is done directly from the hardware without control plane needing to handle the data. Statistics are assembled as a packet with a configurable MTU size and a defined header. These packets are sent as in-band traffic from the fabric. Headers are configured by software, and packets streamed are UDP packets.
When flow telemetry is available for a triggered flow telemetry event, then you can navigate to flow details page for aggregated information. These events are based on the following drop events:
-
Cisco ACL Drop—In an NX-OS fabric, when packet hits
sup-tcamrules and the rule is to drop the packet, the dropped packet is counted as ACL_Drop and it will increment the forward drop counter. When this occurred, it usually means the packet is about to be forwarded against basic Cisco ACI forwarding principals. Thesup-tcamrules are mainly to handle some exceptions or some of control plane traffic and not intended to be checked or monitored by users. -
Buffer Drop—When the switch receives a frame and there are no buffer credits available for either ingress or egress interface, the frame is dropped with buffer. This typically hints at a congestion in the network. The link that is showing the fault could be full or the link containing the destination may be congested. In this case a buffer drop is reported in flow telemetry events.
-
Forward Drop—The packets that are dropped on the LookUp block (LU) of the Cisco ASIC. In a LU block a packet forwarding decision is made based on the packet header information. If the packet is dropped, forward drop is counted. There may be a variety of reasons when forward drop is counted.
-
RTO Inside—In a Cisco ACI fabric, when a TCP retransmission happens for a flow due to a drop inside the fabric, an RTO inside anomaly is raised. This anomaly is aggregated across flows based on ingress node.
-
RTO Outside—In a Cisco ACI fabric, when a flow experiences TCP retransmission, but there is no drop inside the fabric for that flow, then an RTO outside anomaly is raised. This anomaly is aggregated across flows based on ingress node.
Flow telemetry events compared to flow telemetry
-
The flow telemetry event packets are exported only when configured events occur, whereas flow telemetry packets are streamed continuously.
-
The flow telemetry events are captured for all traffic, where as flow telemetry is captured for filtered traffic.
-
The total number of collectors between flow telemetry and flow telemetry events is 256.
Guidelines and limitations for flow telemetry events
-
In a standalone NX-OS fabric, flow telemetry event anomalies are aggregated. For example, a packet drop anomaly occurred from time T0 to T1. No packet drop anomaly occurred from time T1 to T2. Another packet drop anomaly occurred from time T2 to T3. Although there is no anomaly from T1 to T2, the time stamp for the aggregated packet drop anomalies is from T0 to T3.
-
The flow telemetry events do not report policing drop anomalies in Nexus Dashboard, when the egress data plane policer is configured on front-panel ports and there is traffic drop.
-
To export flow telemetry events on FX platform switches, you must configure flow telemetry filters. In a Cisco ACI fabric, starting with Cisco ACI-Mode Switch release 16.0(3), FX switches export flow telemetry events to indicate only buffer drops experienced by flows without the need to configure flow telemetry filters.
-
Standalone NX-OS fabrics do not support TCP packet RTO anomalies.
Navigate to the Flows page
To navigate to the Flows page:
-
Click the Flows tab.
The Flows tab includes the following subtabs:
Flow Status
To navigate to the Flow Status page:
-
Click the Flows tab.
-
Click the Flow Status subtab.
IPFM and generic multicast flow status
This section is applicable for both the IPFM and generic multicast modes in Nexus Dashboard. Cisco Nexus Dashboard allows you to view the flow status pictorially and statistically.
IPFM flow status
Visibility in the Layer 2 segment is possible after the SVI. You can identify the receiver connected Layer 2 interface.
View the Layer 2 port information and the Layer 3 SVI in the Receiver Interface column, or by clicking on the active link under the Flow Link State column on the Fabric Overview > Connectivity > Flows > Flow Status page.
If you click on the active link, you can view the Layer 2 port in the topology diagram with an updated tooltip and a table displaying the Layer 2 physical port.
You can also view the Layer 2 receiver port along with the SVI details by navigating to the Home > Topology page.
Generic multicast flow status
In the generic multicast mode, the switch reports the receiver interface IP address instead of the receiver endpoint IP address. This IP is displayed in the Flow Status and Topology pages as a host. In the Sender and Receiver fields, the IPs are suffixed with a blue dot and the word Remote to indicate that those IPs are remote hosts. Also, as there’s no policing of the traffic, switch reports only display allowed bytes/packets and not denied bytes/packets.
| Field | Description |
|---|---|
|
MUNAT |
Specifies that the multicast traffic at the egress interface is converted to unicast traffic at the receiver interface. |
|
Umcat |
Specifies that the received multicast traffic at the egress interface is converted into unicast traffic at the sender interface. |
-
Click the Unicast or Multicast link in the Receiver or the Sender Interface columns to view the IP route table for this interface.
-
Click the active link in the Flow Link State column to view the details for a given flow such as all pre or post multicast and source IP-addresses, post group, post S/DST ports, pre/post NAT policy ID, starting and destination node details, as well as view the topology for a particular multicast IP.
In VXLAN TRM, sources and receivers associated with an overlay flow are in a customer, also known as a tenant VRF. This tenant traffic is encapsulated in an underlay header that has Encap Source and Encap Group (located in the default VRF) on the sender VTEP side. The underlay encapsulated flow then reaches the receiver VTEP and is decapsulated here.
The flow topology in Nexus Dashboard shows the overlay and underlay parts of the flow in different colors (purple for the underlay and green for the overlay).
Separation Between Default and Tenant VRFs Field Description Type
Specifies the name of the virtual routing and forwarding (VRF).
L3VNI
Specifies the tenant VNI.
Encap Source
Specifies the IP address of the encapsulated source from the default VRF.
Encap Group
Specifies the IP address of the encapsulated group from the default VRF.
-
Click on the Telemetry Sync Status link above the table on the top-right corner.
The Telemetry Sync Status page displays the sync status and the IP address of the telemetry collector for each switch, along with the timestamp at the last sync.
-
To view the load on each telemetry collector, use the Telemetry Collector == <IP address of the collector> filter.
You can balance the collector performance based on the flows it is currently handling.
Multicast NAT visualization
Nexus Dashboard follows the existing flow classification for multicast flows, that is, active, inactive, sender only, or receiver only. With ingress and egress NAT multiple, input and output addresses can be translated to the same group. Nexus Dashboard aggregates these flows per sender and receiver combinations and provides visibility into NAT rules through a topology. For more information about flow topology for active flows, see RTP/EDI Flow Monitor.
Multicast NAT is supported in the IPFM network, and it is not supported for regular or generic multicast.
You can use the NAT Search field to search for NAT flows. All pre or post multicast and source IP-addresses are not visible in the Flow Status window. You can view these details for a given flow in a pop-up by clicking the active flow hyperlink. The NAT Search feature allows you to enter the IP address of either pre or post source or multicast group and filter relevant entries. Note that a searched IP address may not be visible in the main table on filtering as it may be part of a pre or a post entry that can be seen on the corresponding pop-up window.
For NAT flows with NAT types containing Ingress, the source and group will be the postNAT source and the postNAT group. For NAT types containing Egress, the source and group will be the preNAT source and the preNAT group. NAT rules are displayed on the Sender Only and Receiver Only tabs.
For a NAT flow, the topology graph path tracing shows the NAT badge on the switch which has ingress NAT and shows the NAT label on the link to the receiver for the egress NAT.
For NAT flows, there is an extra table shown below the topology graph panel to show all the relevant Ingress NAT or Egress NAT information. The NAT flow information is also available on the Topology window. This information is available when you click the links in the Flow Link State column.
The VRF name is also shown in the slide-in pane for the host and the switch.
For example, sanjose-vrf:2.2.2.2 indicates that the VRF is sanjose-vrf and the host is 2.2.2.2.
The flows carry the VRF name as a prefix. If the VRF is default, it will not be displayed.
|
Field |
Description |
|
NAT |
Specifies the NAT mode, that is, Ingress, Egress, or Ingress and Egress. For the Ingress NAT type, the following information is displayed:
|
|
Pre-Source |
Specifies the source IP address before NAT. |
|
Post-Source |
Specifies the source IP address after NAT. |
|
Pre-Group |
Specifies the multicast group before NAT. |
|
Post-Group |
Specifies the multicast group after NAT. |
|
Post S Port |
Specifies the source port after NAT. |
|
Post DST Port |
Specifies the destination port after NAT. |
|
Field |
Description |
|
Common Fields for IPFM and Generic Multicast Modes |
|
|
VRF |
Specifies the name of the VRF for the flow. |
|
Encap |
Specifies the name of the encap for the TRM flow. |
|
Multicast IP |
Specifies the multicast IP address for the flow.
You can click the wave link next to the multicast IP address to view the pictorial representation of the flow statistics. |
|
Flow Alias |
Specifies the name of the flow alias. |
|
Flow Link State |
Specifies the state of the flow link. The dotted line displays the direction of the flow of traffic. You can hover over the nodes to view information. The table on the right side shows information about the sender and the receiver interfaces. The flows in the network diagram or topology show the multicast IP as well as the VRF. If the VRF is default, then the VRF will not be shown along with the multicast IP. |
|
Sender |
Specifies the IP address or the host alias of the sender for the multicast group. |
|
NAT |
Specifies whether the flow is ingress, egress, or both ingress and egress. |
|
Sender Switch |
Specifies if the sender switch is a leaf or spine. |
|
Sender Interface |
Specifies the interface to which the sender is connected to. |
|
Receiver Switch |
Specifies if the receiver switch is a leaf or a spine. |
|
Receiver Interface |
Specifies the interface to which the receiver is connected to. Displays the Layer 2 physical port for the receiver interface. Example: Vlan120:Ethernet1/3 |
|
Sender Start Time |
Displays the time from when the sender joined. |
|
Receiver Join Time |
Specifies the time at which the receiver joined. |
|
Fields Specific for IPFM Mode |
|
|
Priority |
Specifies the flow priority for flows. |
|
Policed |
Specifies whether a flow is policed or not policed. |
|
Receiver |
Specifies the IP address or the host alias of the receiver joining the group. |
|
Bandwidth |
Specifies the bandwidth that is allotted for the traffic. |
|
QOS/DSCP |
Specifies the switch-defined QoS Policy. |
|
Policy ID |
Specifies the policy ID applied to the multicast IP. |
|
Fields Specific for Generic Multicast Mode |
|
|
Receiver Interface IP |
Specifies the IP address of the receiver interface joining the group. |
|
Field |
Description |
|
Common Fields for IPFM and Generic Multicast Modes |
|
|
VRF |
Specifies the name of the VRF for the flow. |
|
Multicast IP |
Specifies the multicast IP address for the flow.
You can click the chart link next to the Multicast IP address to view the pictorial representation of the flow statistics. |
|
Flow Alias |
Specifies the name of the flow alias. |
|
NAT |
Specifies whether the flow is ingress, egress, or both ingress and egress. |
|
Sender |
Specifies the IP address or the host alias of the sender for the multicast group. |
|
Sender Start Time |
Displays the time from when the sender joined. |
|
Receiver Join Time |
Specifies the time at which the receiver joined. |
|
Fields Specific for IPFM Mode |
|
|
Priority |
Specifies the flow priority. |
|
Policed |
Specifies whether a flow is policed or not policed. |
|
Receiver |
Specifies the IP address or the host alias of the receiver joining the group. |
|
Bandwidth |
Specifies the bandwidth that is allotted for the traffic. |
|
QOS/DSCP |
Specifies the switch-defined QoS Policy. |
|
Policy ID |
Specifies the policy ID applied to the multicast IP. |
|
Fault Reason |
Specifies the reason for the inactive flow. Cisco Nexus Dashboard determines the inactive flow if both the sender and receiver mroute exists with any of the following combinations. Options are:
In this scenario, the switch will not have any fault reason. Therefore, there is no fault reason for such an inactive flows. |
|
Field Specific for Generic Multicast Mode |
|
|
Receiver Interface IP |
Specifies the IP address of the receiver interface joining the group. |
|
Field |
Description |
|
Common Fields for IPFM and Generic Multicast Modes |
|
|
VRF |
Specifies the name of the VRF for the flow. |
|
Multicast IP |
Specifies the multicast IP address for the flow. |
|
Flow Alias |
Specifies the name of the flow alias. |
|
Flow Link State |
Specifies the flow link state, if it’s allow or deny. Click the Sender Only link to view the network diagram or topology of the sender and the receiver. The dotted line displays the direction of the flow of traffic. You can hover over the nodes to view information. The table on the right side shows information about the sender and the receiver. The flows in the network diagram or topology show the multicast IP as well as the VRF. If the VRF is default, then the VRF will not be shown along with the multicast IP. |
|
Sender |
Specifies the name of the sender. |
|
NAT |
Specifies whether the flow is ingress, egress, or both ingress and egress. |
|
Sender Switch |
Specifies the IP address of the sender switch. |
|
Sender Ingress Interface |
Specifies the name of the sender ingress interface. |
|
Sender Start Time |
Displays the time from when the sender switch is transmitting information. |
|
Fields Specific for IPFM Mode |
|
|
Policed |
Specifies whether a flow is policed or not policed. |
|
Policy ID |
Specifies the policy ID applied to the multicast IP. |
|
Bandwidth |
Specifies the bandwidth that is allotted for the traffic. |
|
QOS/DSCP |
Specifies the switch-defined QoS Policy. |
|
Priority |
Specifies the flow priority for flows. |
|
Field |
Description |
|
Common Fields for IPFM and Generic Multicast Modes |
|
|
VRF |
Specifies the name of the VRF for the flow. |
|
Multicast IP |
Specifies the multicast IP address for the flow. |
|
Flow Alias |
Specifies the name of the flow alias. |
|
Flow Link State |
Specifies the flow link state, if it’s allow or deny. Click the Receiver Only link to view the network diagram or topology of the sender and the receiver. The dotted line displays the direction of the flow of traffic. You can hover over the nodes to view information. The table on the right side shows information about the sender and the receiver. The flows in the network diagram or topology show the multicast IP as well as the VRF. If the VRF is default, then the VRF will not be shown along with the multicast IP. |
|
Source Specific Sender |
Specifies the IP address of the multicast sender. |
|
Receiver |
Specifies the receiver ID. If the multicast receiver is remote, the Remote label can be seen next to its name. |
|
NAT |
Specifies whether the flow is ingress, egress, or both ingress and egress. |
|
Receiver Switch |
Specifies the IP address of the receiver switch. |
|
Receiver Interface |
Specifies the name of the destination switch interface. |
|
Receiver Join Time |
Specifies the time at which the receiver joined. |
|
Fields Specific for IPFM Mode |
|
|
Bandwidth |
Specifies the bandwidth that is allotted for the traffic. |
|
Policy ID |
Specifies the policy ID applied to the multicast IP. |
|
Priority |
Specifies the flow priority for flows. |
|
QOS/DSCP |
Specifies the switch-defined QoS Policy. |
If sstatistics are enabled on switches, only then they can be seen in Nexus Dashboard.
Click the Show drop-down list in the statistical representation area to display the statistical data in various formats.
Click the arrow to export the statistical data. You can export the statistical data in either a .csv or .pdf format.
Cisco Nexus Dashboard holds the flow statistics values in the Nexus Dashboard server internal memory. Therefore, after a Nexus Dashboard restart or high-availability switch over, the flow statistics won’t show previously collected values. However, you can see the flow statistics that are collected after the server restart or high-availability switch over.
If the new flow joins before the uplinks between the switches that are detected in Nexus Dashboard, a message BW_UNAVAIL appears. This is resolved after the uplinks between the switches are detected by Nexus Dashboard after discovery of the devices.
Flow Policies
Use this window to configure the flow policies.
To navigate to the Flow Policies page:
-
Click the Flows tab.
-
Click the Flow Policies subtab.
When you log in to Nexus Dashboard with a network operator role, all the buttons or options to add, delete, modify, import, export, or deploy policies are disabled. This user can only view policies, and deployment status or history.
The default policies are displayed on the Flow Policies tab. By default, the bandwidth of these policies is 0. You can configure the bandwidth such that any flow that matches the default flow policy will accordingly use the bandwidth and QOS/DSCP parameters. The policy is deployed to all the devices when you save the configuration.
When you undeploy a default policy, it will be reset to default values, that is, Bandwidth:0gbps, DSCP:Best Effort, and Policer:Enabled.
Policies are automatically deployed to switches whenever they are created, edited, or imported. You can choose to undeploy or redeploy the policies, by choosing the appropriate actions in the Actions drop-down list. The policies will not be deployed correctly if the device is rebooting while the policy was deployed. In such case, the Failed message appears in the Deployment Status column.
The default flow policies must be deployed successfully to the switch before you deploy the custom flow policies on that switch. Otherwise, the custom policies will fail to deploy. Ensure that you deploy all default policies successfully to all the switches before you add, edit, import, or deploy custom policies.
If you have created a custom or non-default VRF, although the host and flow policies are automatically created for the VRF, use the action options in this window to manually deploy the flow policies to the switches in the fabric.
The following table describes the fields that appear on this page.
| Field | Description |
|---|---|
|
VRF |
Specifies the name of the VRF for the flow policy. |
|
Policy Name |
Specifies the flow policy name. |
|
Multicast IP Range |
Specifies the multicast IP address for the traffic. Click view to view the details such as starting and ending IP addresses of the multicast range as well as the flow priority in the Multicast Range List box. |
|
Bandwidth |
Specifies the bandwidth that is allotted for the traffic. |
|
QoS/DSCP |
Specifies the Switch-defined QoS Policy. |
|
Deployment Action |
Specifies the action that is performed on the switch for that host policy.
|
|
Deployment Status |
Specifies if the flow policy is deployed successfully, not deployed, or failed. |
|
In Use |
Specifies if the flow policy is in use or not. |
|
Policer |
Specifies whether the policer for a flow policy is enabled or disabled.
In adding or editing a flow policy, the default policer state is Enabled. |
|
Last Updated |
Specifies the date and time at which the flow policy was last updated. The format is Day MMM DD YYYY HH:MM:SS Timezone. |
Click the table header to sort the entries in alphabetical order of that parameter.
The following table describes the action items, in the Actions drop-down list, that appears in the Flow Policies horizontal tab on the Flows tab in the Fabric Overview window.
A new flow policy or an edited flow policy is effective only under the following circumstances:
- If the new flow matches the existing flow policy.
- If the flow expires and reforms, while the new policy is already created or edited, that matches with the flow policy.
| Field | Description |
|---|---|
|
Create flow policy |
Allows you to create a new flow policy. For more information, see Create a flow policy. |
|
Edit flow policy |
Allows you to view or edit the selected flow policy parameters.
The default flow policies must be deployed successfully to the switch before you deploy the custom flow policies on that switch. Otherwise, the custom policies will fail to deploy. Ensure that you deploy all default policies successfully to all the switches before you edit custom policies. To edit a flow policy for a VRF, select the check box next to the VRF and choose Edit flow policy action. In the Edit flow policy window, you can make the required changes and click Save & Deploy to deploy the changes or click Cancel to discard the changes. The deployment completed message appears at the bottom of the window. You can click Refresh to refresh the current deployment status in the window or click View Details to verify the deployment details. |
|
Delete flow policy |
Allows you to delete the user-defined flow policy.
To delete a flow policy, select the check box next to that VRF and choose the Delete flow policy action. A warning message appears asking you to undeploy policies from the switches. Click Confirm to proceed with deletion and leave the policies on the switches or click Cancel to discard the delete operation. |
|
Purge |
Allows you to delete all the flow policies at a single instance.
Undeploy policies from all switches before deleting them from Nexus Dashboard. To delete all flow policies, choose the Purge action. A warning message appears asking you to undeploy policies from all the switches. Click Confirm to proceed with deletion and leave the policies on the switches or click Cancel to discard the delete operation. |
|
Import |
Allows you to import flow policies from a csv file.
The default flow policies must be deployed successfully to the switch before you deploy the custom flow policies on that switch. Otherwise, the custom policies will fail to deploy. Ensure that you deploy all default policies successfully to all the switches before you import custom policies. To import the flow policies, choose the Import action. Browse the directory and select the .csv file that contains the flow policy configuration information. The policy will not be imported if the format in the .csv file is incorrect. Click Open. The imported policies are automatically deployed to all the switches in the fabric. |
|
Export |
Allows you to export flow policies to a csv file. To export the flow policies, choose the Export action. Select a location on your local system directory to store the flow policy details file. Click Save. The flow policy file is exported to your local directory. The file name is appended with the date on which the file is exported. The format of the exported file is .csv. |
|
Deploy selected policies |
Select this option to deploy only the selected policies to the devices. You can deploy other policies when required. Select one or more check boxes next to the policy name. Select this option to deploy selected policies to the switch. |
|
Deploy all custom policies |
Select this option to deploy all the custom or user-defined policies at a single instance. The policies are deployed even if the switch is rebooting. In such case, the deployment fails and a status message Failed appears in the Deployment Status column. |
|
Deploy all default policies |
Select this option to deploy all default policies to the switch. |
|
Undeploy Selected Policies |
Select this option to undeploy the selected policies. To undeploy the selected policies, select one or more check boxes next to the VRFs. Select this option from the drop-down list to undeploy the selected policies. |
|
Undeploy All Custom Policies |
Select this option to undeploy all the custom or user-defined policies at a single instance. |
|
Undeploy All Default Policies |
Select this option to undeploy all the default policies at a single instance. |
|
Redo All Failed Policies |
The deployment or undeployment of policies may fail due to various reasons. Select this option to deploy all the failed policies. All the deployments that failed on switches previously will be deployed again to only those switches. All the undeployments that failed on switches previously will be undeployed again from only those switches. |
|
Deployment History |
Select this option to view the deployment history of the selected policy for the switch in the Deployment History pane. The Deployment History pane displays the following fields:
|
Deployment Status
The following table describes the fields that appear on the Deployment Status page.
| Field | Description |
|---|---|
|
Policy Name |
Specifies the name of the flow policy. |
|
VRF |
Specifies the name of the VRF. |
|
Switch Name |
Specifies the switch on which the VRF is deployed. |
|
IP Address |
Specifies the IP address of the switch. |
|
Deployment Status |
Displays the status of the deployment. It shows if the deployment was a Success or Failed along with the reason why the deployment failed. |
|
Action |
Specifies the action that is performed on the switch, for example, Create. |
|
Deployment Date/Time |
Displays the date and time when the deployment was initialized. |
Create a flow policy
The default host policies must be deployed successfully to the switch before you deploy the custom host policies on that switch. Otherwise, the custom policies will fail to deploy. Ensure that you deploy all the default policies successfully to all the switches before you add custom policies.
To create a flow policy from Nexus Dashboard:
-
Click the Flows tab.
-
Click the Flow Policies subtab.
-
Click Actions > Create flow policy.
The Create flow policy window is displayed.
-
In the Create flow policy window, specify the parameters in the following fields.
-
VRF — Click the Select a VRF link to open the Select a VRF window. The default VRF is also listed in the window. Search and select a VRF for the host and click Save.
-
Policy names can be repeated across VRFs, that is, they are unique only within a VRF.
-
Across the VRF, host policies may be same or different.
-
Sequence number for the host policies is per VRF
-
-
Policy Name — Specify a unique policy name for the flow policy.
-
Bandwidth — Specifies the bandwidth that is allocated for the flow policy. Select of the radio buttons to choose Gbps, Mbps, or Kbps.
-
-
From the QoS/DSCP drop-down list, choose an appropriate ENUM value.
-
Click the Policer check box to enable or disable policer for a flow.
-
In Multicast IP Range, enter the beginning IP and ending IP Address for the multicast range in the From and To fields. The valid range is between 224.0.0.0 and 239.255.255.255.
From the Flow Priority drop-down list, choose the priority for the flow. You can choose either Default or Critical. The default value is Default.
The flow priority is used during the following scenarios:
-
Error Recovery - Unicast Routing Information Base (URIB) reachability changes on flows, and a re-Reverse-path forwarding (RPF) is being performed. When a set of existing flows is retried, the recovery starts from the flows with Critical priority.
-
Flow Retry - When pending flows are retried, the Critical priority flows are retried first.
Actions - Actions has a variety of icons to perform various actions. Click the tick mark icon if you have entered the correct details; if not, click the check mark icon to add the multicast range to the policy. Click the edit icon if you want to modify the details or click the bin icon to delete the row. Click the Plus (+) mark to add another row.
-
-
Click Save & Deploy to deploy the new policy or click Cancel to discard the changes. The deployment completed message appears at the bottom of the window. You can click Refresh to refresh the current deployment status in the window or click View Details to verify the deployment details.
Flow Alias
Use this tab to configure flow alias.
To navigate to the Flow Alias page:
-
Click the Flows tab.
-
Click the Flow Alias subtab.
Using the Flow Alias feature, you can specify names for multicast groups. The multicast IP addresses are difficult to remember, thus by assigning a name to the multicast IP address, you can search and add policies based on the name.
The following table describes the fields that appear in this window.
| Field | Description |
|---|---|
|
VRF |
Specifies the VRF for the flow alias. |
|
Policy Name |
Specifies the policy name. |
|
Multicast IP Range |
Specifies the multicast IP address for the traffic. |
|
Description |
Description added to the flow alias. |
|
Last Updated |
Specifies the date on which the flow alias was last updated. |
The following table describes the action items, in the Actions drop-down list, that appears in the Flow Alias horizontal tab on the Flows tab of the Fabric Overview window.
| Action Item | Description |
|---|---|
|
Create flow alias |
Allows you to create a new flow alias. For instructions about creating a new flow alias, see Create a flow alias. |
|
Edit flow alias |
Allows you to view or edit the selected flow alias parameters. To edit the flow alias, select the check box next to the flow alias that you want to delete and choose Edit flow alias. In the Edit flow alias window, edit the required values and click Submit to apply the changes or click Cancel to discard the flow alias. The edited flow alias is shown in the table in the Flow Alias window. |
|
Delete flow alias |
Allows you to delete the flow alias. To delete a flow alias, select the check box next to the flow alias that you want to delete and choose Delete flow alias. You can select multiple flow alias entries and delete them at the same instance. |
|
Import |
Allows you to import flow aliases for devices in the fabric. To import flow aliases, choose Import. Browse the directory and select the .csv file that contains the flow IP address and corresponding unique flow name information. Click Open. The flow aliases are imported and displayed in the Flow Alias window. |
|
Export |
Allows you to export flow aliases for devices in the fabric. To export a flow alias, choose Export. Select a location on your local system directory to store the flow aliases configuration from Nexus Dashboard and click Save. The flow alias configuration file is exported to your local directory. The file name is appended with the date and time at which the file was exported. The format of the exported file is .csv. |
Create a flow alias
To create a flow alias from the Cisco Nexus Dashboard:
-
Click the Flows tab.
-
Click the Flow Alias subtab.
-
On the Flow Alias page, click Actions > Create flow alias.
-
On the Create flow alias page, enter the following:
All the fields are mandatory.
-
VRF — Select the VRF from this drop-down list. The default value is default.
Host and IP Address are unique per VRF, that is, same host name with the same IP Address can exist in multiple VRFs.
-
Flow Name — Enter a fully qualified unique flow name for identification of the flow alias.
-
Multicast IP Address — Enter the multicast IP address for the flow alias.
-
Description — Enter a description for the flow alias.
-
-
Click Submit to apply the changes.
Click Cancel to discard the flow alias.
The new flow alias is shown in the table on the Flow Alias page.
Static Flow
You configure a static receiver using the Static Flow window. Use the Select an Option field to select a switch before creating a static flow for it.
To navigate to the Static Flow page:
-
Click the Flows tab.
-
Click the Static Flow subtab.
| Field | Description |
|---|---|
|
Create static flow |
Allows you to create a static flow. For more information, see Create a static flow. |
|
Delete static flow |
Allows you to delete the static flow.Select a static flow that you need to delete and click the Delete static flow action to delete the selected static flow. |
| Field | Description |
|---|---|
|
VRF |
Specifies the VRF for a static flow. |
|
Group |
Specifies the group for a static flow. |
|
Source |
Specifies the source IP address for the static flow. |
|
Interface Name |
Specifies the interface name for the static flow. If it is not specified while creating the static flow, it is displayed as N/A. |
|
Deployment Action |
Specifies the action that is performed on the switch for the rule. Create implies that the static flow has been deployed on the switch. Delete implies that the static flow has been undeployed from the switch. |
|
Deployment Status |
Specifies if the static flow is deployed or not. If there is a deployment failure, hover over the information icon to view the failure reason. |
|
Last Updated |
Specifies the date and time at which the static flow was last updated.The format is Day MMM DD YYYY HH:MM:SS Timezone. |
Create a static flow
Choose a switch in the Static Flow tab of the Fabric Overview page before creating a static flow for it.
To create a static flow for the chosen switch:
-
Click the Flows tab.
-
Click the Static Flow subtab.
-
Click Actions > Create static flow.
The Create static flow page displays.
-
On the Add Static Flow page, specify the parameters in the following fields.
-
Selected Switch — Specifies the switch name. This field is read-only, and it is based on the switch selected in the Static Flow window.
-
VRF — Choose the VRF that you will associate with this static flow.
-
Group — Specifies the multicast group that you will associate with this static flow.
-
Source IP — Enter the source IP address.
-
Interface Name — Specify the interface name for the static flow. This field is optional. If you do not specify an interface name, the host IP 0.0.0.0 is passed to the API and config is created using Null0 interface.
-
-
Click Save & Deploy to save the static flow.
Click Cancel to discard it.
Multicast NAT
Multicast NAT translation of UDP stream is supported using Nexus Dashboard IPFM mode. You can apply NAT for the incoming traffic (ingress), or on the egress link or interface. The scope of ingress NAT is the entire switch, whereas egress NAT is for a specific interface. The same switch can have both ingress and egress NAT. However, it can’t be on the same flow for a given switch. Egress NAT has the capability to replicate the same flow up to 40 times. To achieve this function, the service-reflect interface is defined on the switch. It serves for a multiple or single egress port.
Ingress and/or egress NAT translation is supported only on the sender switch, also known as the First Hop Router (FHR), and receiver switch, also known as Last Hop Router (LHR). It is not supported on intermediates nodes such as spine switches.
For more information about NAT, see Cisco Nexus 9000 Series NX-OS IP Fabric for Media Solution Guide.
Prerequisites
-
Set up loopback interface with PIM sparse mode. When flow is translated, post-translated source needs to be secondary IP address on this loopback to make sure RPF check won’t fail. This loopback is configured as service reflect interface for NAT purpose. You need to set up lookback per VRF.
Here is an example to configure the loopback interface:
interface loopback10
ip router ospf 1 area 0
ip pim sparse-mode
ip address 192.168.1.1/32
ip address 172.16.1.10/32 secondary

ip service-reflect source-interface loopback10
-
TCAM memory carving must be completed.
The command to configure the TCAM for Multicast NAT is:
hardware access-list tcam region mcast-nat _tcam-size_
For information about switch models that support multicast NAT, see Configuring Multicast Service Reflection with NBM in Cisco Nexus 9000 Series NX-OS IP Fabric for Media Solution Guide.
NAT modes
NAT mode objects are created per switch and VRF. The switches are populated in the drop-down based on the scope. You should choose the switch to list and operate on the corresponding NAT mode objects.
To navigate to the NAT Modes page:
-
Click Multicast NAT.
-
Click the NAT Modes subtab.
The following table describes the fields that appear in NAT Modes.
Field
Description
VRF
Specifies the VRF for the multicast NAT. VRF support is not applicable for eNAT, however, it is applicable for iNAT.
Group
Specifies the multicast address of the NAT mode.
Mode
Specifies the multicast NAT mode, that is, ingress or egress.
Deployment Action
Specifies the action that is performed on the switch for that mode. Create implies that the mode has been deployed on the switch. Delete implies that the mode has been undeployed from the switch.
Deployment Status
Specifies if the mode is deployed or not. If there’s deployment failure, hover over the information icon to view the failure reason.
Last Updated
Specifies the date and time at which the mode was last updated.
The format is Day MMM DD YYYY HH:MM:SS Timezone.
This table describes the action items, in the Actions drop-down list that appear in NAT Modes.
Action Item Description Create NAT mode
Choose Create NAT mode to add a NAT mode.
Delete NAT mode
Choose a mode from the table and choose Delete NAT mode to delete the mode.
Import
Allows you to import NAT modes from a CSV file to Nexus Dashboard.
Export
Allows you to export NAT modes from Nexus Dashboard to a CSV file.
Deploy selected NAT modes
Choose modes from the table and choose Deploy selected NAT modes to deploy selected modes to the switch.
Deploy all NAT modes
Choose Deploy all NAT modes to deploy all the modes to the switch.
Undeploy Selected NAT Modes
Choose modes from the table and choose Undeploy Selected NAT Modes to undeploy selected modes from the switch.
Undeploy All NAT Modes
Choose Undeploy All NAT Modes to undeploy all modes from the switch.
Redo All Failed NAT Modes
Choose Redo All Failed NAT Modes to deploy all the failed modes.
Deployment History
Choose a mode from the table and choose Deployment History to view the deployment history of the selected mode.
Deployment History shows the following fields.
-
Switch Name — Specifies the name of the switch that the mode was deployed to.
-
VRF — Specifies the name of the VRF that mode was deployed to.
-
Group — Specifies the multicast group of the NAT mode.
-
Mode — Specifies the NAT mode, that is, ingress or egress.
-
Deployment Status — Displays the status of deployment. It shows if the deployment was Success or Failed.
-
Action — Specifies the action that is performed on the switch for that mode. Create implies that the mode has been deployed on the switch. Delete implies that the mode has been undeployed from the switch.
-
Deployment Date/Time — Specifies the date and time at which the mode was last updated. The format is Day MMM DD YYYY HH:MM:SS Timezone.
-
Failed Reason — Specifies why the mode wasn’t successfully deployed.
-
Add a NAT mode
To add a NAT mode:
-
Click Multicast NAT.
-
Click the NAT Modes subtab.
-
Click Actions > Create NAT mode to add a NAT mode.
The Add NAT Mode page appears.
-
In the Add NAT Mode page, specify the following information:
Mode: Choose the multicast NAT mode, that is, Ingress or Egress.
Selected Switch: Specifies the switch name. This field is read-only, and it’s based on the switch chosen in NAT Modes.
VRF: Select the VRF to which the NAT mode should belong to.
Group / Mask: Specify the multicast group with the mask. The same group can’t be ingress as well as egress NAT on a given switch. You need to identify whether a particular group or mask is ingress or egress.
-
Click Save & Deploy to save the NAT mode and deploy it.
Delete a NAT mode
To delete a NAT mode:
-
Click Multicast NAT.
-
Click the NAT Modes subtab.
-
Select the NAT mode that you need to delete and click Actions > Delete NAT mode to delete a NAT mode.
If the NAT mode isn’t deployed or failed, you can skip this step.
-
Click Confirm to delete the selected NAT mode.
Recirc Mappings
Nexus Dashboard allows you to map recirculation packets across ports for ingress or egress interfaces. You can configure recirc mappings for the following translation types:
-
Multicast-to-Multicast
-
Multicast-to-Unicast
-
Unicast-to-Multicast
To navigate to the Recirc Mappings page:
-
Click Multicast NAT.
-
Click the Recirc Mappings subtab.
The following table describes the fields that appear on the Recirc Mappings tab.
Field Description VRF
Specifies the VRF over which the recirc mapping is routed.
Egress Interfaces
Specifies the egress interfaces for the mapping.
Destination/Prefix
Specifies the IP address of the destination unicast interface.
Map Interface
Specifies the map interface.
Egress interfaces and map interface have a many-to-one relationship. When there is more than one egress interface for a mapping, it is shown as a hyperlink. You can click on the hyperlink to see the complete list of interfaces.
Max Replications
Specifies the max replications for the map interface.
Deployment Action
Specifies the action that is performed on the switch for that egress interface mapping. Create implies that the egress interface mapping has been deployed on the switch. Delete implies that the egress interface mapping has been undeployed from the switch.
Deployment Status
Specifies if the egress interface mapping is deployed or not. If there’s a deployment failure, hover over the information icon to view the failure reason.
Last Updated
Specifies the date and time at which the egress interface mapping was last updated.
The format is Day MMM DD YYYY HH:MM:SS Timezone.
This table describes the action items in the Actions menu drop-down list that appear on the Recirc Mappings tab.
Action Item Description Create NAT recirc mapping
Choose Create NAT recirc mapping to add a recirc mapping.
Edit NAT Recirc Mapping
Choose a mode from the table and choose Edit NAT Recirc Mapping to edit a recirc mapping.
Delete NAT recirc mapping
Choose a mode from the table and choose Delete NAT recirc mapping to delete a recirc mapping.
Import
Allows you to import a NAT egress interface mapping from a CSV file to Nexus Dashboard.
Export
Allows you to export NAT Recirc mappings from Nexus Dashboard to a CSV file.
Deploy selected NAT recirc mappings
Choose modes from the table and choose Deploy selected NAT recirc mappings to deploy the selected recirc mapping to the switch.
Deploy all NAT recirc mappings
Choose Deploy all NAT recirc mappings to deploy all recirc mappings to the switch.
Undeploy Selected NAT Recirc Mappings
Choose modes from the table and choose Undeploy Selected NAT Recirc Mappings to undeploy selected recirc mappings from the switch.
Undeploy All NAT Recirc Mappings
Choose Undeploy All NAT Recirc Mappings to undeploy all Recirc mapping from the switch.
Redo All Failed NAT Recirc Mappings
Choose Redo All Failed NAT Recirc Mappings to deploy all failed recirc mappings.
Deployment History
Choose a recirc mapping from the table and choose Deployment History to view the deployment history of the selected recirc mapping.
Deployment History shows these fields.
-
Switch Name — Specifies the name of the switch that the mode was deployed to.
-
VRF — Specifies the VRF used to configure the selected recirc mapping.
-
Map Interface — Specifies the map interface for the Recirc mappings.
-
Max Replications — Specifies the maximum replications for the Recirc mappings.
-
Egress Interfaces or Destination/Prefix — Specifies the interface over which recirc mapping is configured.
-
Deployment Status — Displays the status of deployment. It shows if the deployment was a success or failed. If failed, the reason is displayed.
-
Action — Specifies the action that is performed on the switch for that recirc mapping. Create implies that the mapping has been deployed on the switch. Delete implies that the mapping has been undeployed from the switch.
-
Deployment Date/Time — Specifies the date and time at which the mapping was last updated. The format is Day MMM DD YYYY HH:MM:SS Timezone.
-
Add Recirc Mappings
To add recirc mappings:
-
Click Multicast NAT.
-
Click the Recirc Mapping subtab.
-
From the Selected Switch drop-down list, choose the switch where you want to create recirc mappings.
-
Click Actions > Create NAT recirc mapping to add a recirculation mapping for the chosen switch.
The Add Recirc Mappings page appears.
-
On the Add Recirc Mappings page, Selected Switch field specifies the switch name.
This field is read-only, and it’s based on the switch chosen on the Recirc Mappings page.
-
From the VRF drop-down list, choose the VRF over which the recirc is routed.
-
In the Translation Type field, choose one of the translation types:
-
Multicast-to-Multicast
-
Multicast-to-Unicast
-
Unicast-to-Multicast
-
-
If you chose the Multicast-to-Multicast translation type, in the Egress Interfaces area, choose one of the following:
-
All - Choose All to select all the interfaces
-
Select one or more - You can select multiple egress interfaces by choosing the Select one or more option and click the Select Egress Interfaces option to choose the interfaces. The Select dialog box shows the interfaces that are available, that is, the interfaces that are already defined in other mappings are filtered out. To select all the interfaces, you can select All. When you choose All, the option to select individual egress interfaces is disabled.
-
-
Based on the translation type, do the following:
-
If you choose the Multicast-to-Multicast translation type, the IP address of the destination multicast interface in the destinationPrefix field is disabled.
-
If you choose the Multicast-to-Unicast translation type, enter the IP address of the destination unicast interface in the destinationPrefix field.
-
If you choose the Unicast-to-Multicast translation type, enter the IP address of the destination multicast interface in the destinationPrefix field.
-
-
From the Map Interface drop-down list, choose an interface to start recirc mapping.
An interface can either be an egress interface or a map interface and can’t be both. An error is displayed if you select a map interface that is already selected as an egress interface.
-
In the Max Replications field, enter the maximum replications for the map interface.
The range for this field is 1-250 for Cisco Nexus switches running Cisco NX-OS versions 10.5.2 and above. The default value is 250.
The range for this field is 1-40 for Cisco Nexus switches running Cisco NX-OS versions prior to 10.5.2. The default value is 40. You receive an error if you enter a value higher than 40.
You can then configure NAT rules. For more information, see NAT Rules.
-
Click Save & Deploy to save the NAT mode and deploy it.
NAT Rules
NAT rules are identical for ingress and egress NAT except you need to also specify a receiver outgoing network interface (OIF) for egress NAT.
To navigate to the NAT Rules page:
-
Click Multicast NAT.
-
Click the NAT Rules subtab.
This table describes the fields that appear on NAT Rules.
Field
Description
VRF
Specifies the VRF for the multicast NAT.
Mode
Specifies the NAT mode, that is, ingress or egress.
Pre-Translation Group/Unicast IP
Specifies the multicast group before NAT.
Post-Translation Group/Unicast IP
Specifies the multicast group after NAT.
Group Mask
Specifies the group mask.
Pre-Translation Source
Specifies the source IP address before NAT.
Post-Translation Source
Specifies the source IP address after NAT.
Source Mask
Specifies the source mask.
Post-Translation Source Port
Specifies the source port after NAT. The range is 0-65535. The value 0 means that there’s no translation of UDP source port.
Post-Translation Destination Port
Specifies the destination port after NAT. The value 0 means that there’s no translation of the UDP destination port.
Static Oif
Specifies the static outgoing interface to bind the egress NAT rule to. This drop-down is populated with egress interfaces defined in the Egress Interface Mappings page. This field is disabled for ingress mode.
Deployment Action
Specifies the action that is performed on the switch for the rule. Create implies that the rule has been deployed on the switch. Delete implies that the rule has been undeployed from the switch.
Deployment Status
Specifies if the rule is deployed or not. If there’s a deployment failure, hover over the information icon to view the failure reason.
Last Updated
Specifies the date and time at which the rule was last updated.
The format is Day MMM DD YYYY HH:MM:SS Timezone.
This table describes the action items, in the Actions drop-down list, that appear on NAT Rules.
Action Item Description Create NAT rule
Choose Create NAT rule to add a NAT rule.
Delete NAT rule
Select a mode from the table and choose Delete NAT rule to delete the rule.
Import
Allows you to import NAT rules from a CSV file to Nexus Dashboard.
Export
Allows you to export NAT rules from Nexus Dashboard to a CSV file.
Deploy selected NAT rules
Select rules from the table and choose Deploy selected NAT rules to deploy selected rules to the switch.
Deploy all NAT rules
Choose Deploy all NAT rules to deploy all rules to the switch.
Undeploy Selected NAT Rules
Select rules from the table and choose Undeploy Selected NAT Rules to undeploy selected rules to the switch.
Undeploy All NAT Rules
Choose Undeploy All NAT Rules to undeploy all rules from the switch.
Redo All Failed NAT Rules
Choose Redo All Failed NAT Rules to deploy all failed rules.
Deployment History
Choose a rule from the table and choose Deployment History to view the deployment history of the selected rule.
Deployment History shows the following fields.
-
Switch Name — Specifies the name of the switch that the rule was deployed to.
-
VRF — Specifies the VRF that the mapping belongs to.
-
Deployment Status — Displays the status of the deployment. It shows if the deployment was successful or failed.
-
Action — Specifies the action that is performed on the switch for that rule. Create implies that the rule has been deployed on the switch. Delete implies that the rule has been undeployed from the switch.
-
Deployment Date/Time — Specifies the date and time at which the rule was last updated. The format is Day MMM DD YYYY HH:MM:SS Timezone.
-
Failed Reason — Specifies why the rule wasn’t successfully deployed.
-
Add a NAT rule
To add a NAT rule:
-
Click Multicast NAT.
-
Click the NAT Rules subtab.
-
Click Actions > Create NAT rule to add a NAT rule.
This table describes the available fields and descriptions in Add NAT Rule.
Field
Description
Translation Type
Choose one of the translation types:
-
Multicast-to-Multicast
-
Multicast-to-Unicast
-
Unicast-to-Multicast
Mode
Choose the NAT mode (Ingress or Egress).
This mode is not visible for Multicast-to-Unicast and Unicast-to-Multicast translation types.
Selected Switch
Specifies the switch name. This field is read-only, and it’s based on the switch selected in NAT Rules.
VRF
Select the VRF for the NAT rule. By default, it’s the default VRF.
Pre-Translation Group/Unicast IP
Specifies the multicast or unicast group before NAT.
Post-Translation Group
Specifies the multicast or unicast group after NAT.
Group Mask
Specifies the mask value for the NAT rule. By default, it’s 32.
Pre-Translation Source
Specifies the source IP address before NAT.
Post-Translation Source
Specifies the source IP address after NAT.
The post-translation source IP needs to be the secondary IP address on the loopback interface to make sure the reverse-path forwarding (RPF) check won’t fail. However, the switch maintains separate records for pre- and post- NAT records, and Nexus Dashboard merges unicast-multicast pre-post entries as a single flow.
Source Mask
Specifies the source mask value for the NAT rule. By default, it’s 32.
Post-Translation Source Port
Source port is 0 by default. The value 0 means no translation.
Post-Translation Destination Port
Destination port is 0 by default. The value 0 means no translation.
Static Oif
This field is not visible for ingress mode. In egress mode, this field displays Egress Interfaces as defined in Recirc Mappings. The field is empty if there are no recirc mappings defined.
-
-
Click Save & Deploy to save the NAT rule and deploy it.
Delete a NAT rule
To delete a NAT rule:
-
Click Multicast NAT.
-
Click the NAT Rules subtab.
-
Select the NAT mode that you need to delete and click Actions > Delete NAT rule to delete a NAT rule.
If the NAT rule isn’t deployed or failed, you can skip this step.
-
Click Confirm to delete the selected NAT rule.
RTP/EDI Flow Monitor
Cisco Nexus Dashboard provides a view of all the active RTP and EDI streams. It also lists out active flows that have RTP and EDI drops and historical records for the same. For active IPFM flow, Nexus Dashboard provides RTP and EDI topology to pinpoint the loss in network.
You need to enable telemetry on the switches to view the RTP/EDI Flow Monitor. For more information, see your respective platform documentation.
To navigate to the RTP/EDI Flow Monitor page:
-
Click RTP/EDI Flow Monitor.
This table provides information on the fields shown in this page:
Field Description VRF
Specifies the name of the VRF.
Switch
Specifies the name of the switch.
Interface
Specifies the interface from which the flows are detected.
Source IP
Specifies the source IP address of the flow.
Source Port
Specifies the source port of the flow.
Destination IP
Specifies the destination IP address of the flow.
Destination Port
Specifies the destination port of the flow.
Receiver IPs
Specifies the receiver IPs which are connected directly to the given switch.
Bit Rate
Specifies the bit rate of the flow, in bps, kbps, mbps, gbps, or tbp.
Packet Count
Specifies the number of packets in the flow.
Packet Loss
Specifies the number of lost packets.
Loss Start
Specifies the time at which the packet loss started.
Loss End
Specifies the time at which the packet loss stopped.
Start Time
Specifies the time at which the flow started.
Protocol
Specifies the protocol that is being used for the flow.
You can click the Telemetry Switch Sync Status link to check whether the switches are in sync. The Telemetry Sync Status page displays the status of the switches in the Sync Status field and the last time that the sync occurred in the Last Sync Time field.
The RTP/EDI Flow Monitor page has the following tabs:
Active Flows
The Active Flows displays the current active flows. You can also view these flows by navigating to Flows > Flow Status. You can click a switch link to view the end-to-end flow topology.
Flow Topology
The flow topology is displayed for the active flows that are displayed on the Flow Status page. For more information about multicast NAT visualization, see Flow Status.
The flow topology for the active flows is displayed in Active Flows.
-
Click a switch link to display the end-to-end flow topology.
The flow topology displays the direction of the flows. The arrows in the icon indicate the direction of the flow from the sender to the receiver. The IP addresses suffixed with (S) and ® indicate the sender and receiver host respectively. If there are multiple receivers for a given flow, you can choose a receiver from the Select Receiver drop-down list.
The switches experiencing packet drops are circled in red.
-
Hover your cursor over a switch to display the following details:
-
Name
-
IP address
-
Model
-
Packet loss, if any
-
-
Click the file icon next to the links between the switches to view the interface counters errors for the interfaces connecting the two switches.
When you click the file icon, the show interface <interface name> counters errors command is run for the interface where the flow is participating between these switches, and the results are displayed in a pop-up dialog.
Packet Drop
The Packet Drop shows the packet drops for active flows.
Drop History
When active RTP packet drop is not observed, records from Packet Drop are moved to Drop History. By default, the RTP drop history is maintained for seven days. You can customize this setting by entering the required value in the IPFM history retention days field in Admin > System Settings > Fabric Management > Advanced Settings > IPFM and saving it.
The Drop History tab displays only the last 100,000 records at the maximum.
Global Config
This tab is only available on IPFM fabrics when you have deployed IPFM on Nexus Dashboard. However, the IPFM fabric with generic multicast fabric technology is an exception (as the IPFM VRF created here is used for defining host and flow aliases for both an IPFM fabric and generic multicast.
Navigate to the Global Config page to set or modify switch global configurations and VRFs:
-
Click Global Config.
Nexus Dashboard allows two major operations.
-
Monitor the network.
-
Configure host and flow policies.
Nexus Dashboard monitors the Flow Status, Discovered Host, Applied Host Policies, and other operations using telemetry. For any operations triggered by the switch and received through telemetry (for example, Flow Established), Nexus Dashboard periodically checks for new events and generates the appropriate notifications.
If pmn.deploy-on-import-reload.enabled server property is set to true during a switch reload, when Nexus Dashboard receives switch coldStartSNMPtrap, it deploys Global Config, and host and flow policies that are showing 'Deployment Status=Successes' to the switch automatically. Deploy the switch telemetry and SNMP configuration can be deployed on demand by using Nexus Dashboard packaged pmn_telemetry_snmp CLI template available in Templates.
When you install Nexus Dashboard with an IPFM deployment, you can deploy policies, the unicast bandwidth, Any Source Multicast (ASM) range, and VRFs using Global Config.
After you deploy Nexus Dashboard with IPFM, configure the bandwidth and ASM. The remaining percentage of the bandwidth is utilized by the multicast traffic. Nexus Dashboard acts like a master controller, and deploys the bandwidth and ASM configurations to all the switches in the fabric.
As Nexus Dashboard uses telemetry to fetch data from the fabric, the flow status and Kafka notifications may not reflect the current state in real time. Nexus Dashboard periodically checks new events and generates the appropriate notifications. For more information, see the Cisco Nexus Dashboard Kafka Notifications Guide.
Switch Global Config
Navigate to the Switch Global Config page to configure the global parameters:
-
Click Global Config.
-
Click the Switch Global Config subtab.
A user with the network operator role in Nexus Dashboard cannot save, deploy, undeploy, add or delete ASM, or edit the unicast bandwidth reservation percentage.
After you configure the Unicast Bandwidth Reservation and ASM range, you can perform the following operations to deploy these configurations to the switches.
After deploying the global configurations, configure the WAN for each switch in your network.
| Field | Description |
|---|---|
|
VRF |
Specifies the name of the VRF. This VRF is used to associate IPFM Host/Flow policies as well as Host/Flow aliases for both IPFM and Generic Multicast fabrics. |
|
Unicast Bandwidth Reservation % |
Displays a numeric value that indicates the unicast bandwidth configuration percentage, and the status specifies if the bandwidth deployment was success, or failed or not deployed. You can configure the server to allot a dedicated percentage of bandwidth to unicast traffic. The remaining percentage is automatically reserved for multicast traffic. Click the numerical value link to view the details of the deployment history for the Unicast Bandwidth for the selected VRF and switch in the Deployment History pane. For more information, see Deployment History. Click the Failed or Success link to view the details of the deployment status for the Unicast Bandwidth for the selected VRF and switch in the Deployment Status pane. For more information, see Deployment Status. |
|
Reserve Bandwidth to Receiver Only |
Bandwidth reservation status specifies if the bandwidth deployment was success, or failed or not deployed. The Enabled status indicates that the ASM traffic is pushed to the spine only if there is a receiver. This feature is applicable for switches with the Cisco NX-OS Release 9.3(5) and later. Click the Enabled link to view the details of the deployment history for the reserve bandwidth for the selected VRF and switch in the Deployment History pane. For more information, see Deployment History. Click the Failed link to view the details of the deployment status for the reserve bandwidth for the selected VRF and switch in the Deployment Status pane. For more information, see Deployment Status. |
|
ASM/MASK |
Displays the number of Any Source Multicast (ASM) groups enabled for the selected VRF and the status indicates whether the ASM and Mask configuration was deployed successfully, or failed or not deployed. The ASM is a PIM tree building mode that uses shared trees to discover new sources and receivers as well as source trees to form shortest paths from receivers to sources. ASM provides discovery of multicast sources. The IP address and subnet mask in the ASM/MASK field define the multicast source. The ASM range is configured by specifying the IP address and the subnet mask. Click the numerical value link to view the details of the deployment history for the ASM/mask for the selected VRF and switch in the Deployment History pane. For more information, see Deployment History. Click the Failed link to view the details of the deployment status for the ASM/mask for the selected VRF and switch in the Deployment Status pane. For more information, see Deployment Status. |
Click the table header to sort the entries in alphabetical order of that parameter.
This table describes the action items in the Actions drop-down list that appear in the Switch Global Config page.
| Action Item | Description |
|---|---|
|
Edit NBM VRF Config |
Allows you to edit the NBM VRF configuration.To perform an edit, choose this option. The Edit NBM VRF Config page opens. Edit the required values and click Deploy. |
|
Undeploy All |
Undeploys ASM, unicast bandwidth, and reserved bandwidth configuration to all switches. |
|
Undeploy Unicast BW |
Undeploys only unicast bandwidth configuration. |
|
Undeploy Reserve BW |
Undeploys only the reserve bandwidth configuration. |
|
Undeploy ASM/Mask |
Undeploys only the ASM configuration. |
|
Redo All Failed |
Redeploys the selected failed configurations. |
Deployment History
This table describes the fields that appear on Deployment History.
| Field | Description |
|---|---|
|
Type |
Specifies whether the type is Unicast Bandwidth Reservation %, Reserve Bandwidth to Receiver Only, or ASM/MASK. |
|
VRF |
Specifies the name of the VRF. |
|
Switch Name |
Specifies the switch name in the fabric on which the configuration was deployed. |
|
Deployment Status |
Displays the status of deployment. It shows if the deployment was Success or Failed along with the reason why the deployment failed. |
|
Action |
Specifies the action that is performed on the switch, such as Create or Delete. |
|
Deployment Date/Time |
Displays the date and time when the deployment was initialized. |
Deployment Status
This table describes the fields that appear on Deployment Status.
| Field | Description |
|---|---|
|
Type |
Specifies whether the type is Unicast Bandwidth Reservation %, Reserve Bandwidth to Receiver Only, or ASM/MASK. |
|
VRF |
Specifies the name of the VRF. |
|
Switch Name |
Specifies the switch name in the fabric on which the configuration was deployed. |
|
IP Address |
Specifies the IP address of the switch. |
|
Deployment Status |
Displays the status of the deployment. It shows if the deployment was a Success or Failed along with the reason why the VRF deployment failed. |
|
Action |
Specifies the action that is performed on the switch, for example, Create. |
|
Deployment Date/Time |
Displays the date and time when the deployment was initialized. |
IPFM VRF
Use the IPFM VRF page to create, edit, delete, and redeploy IPFM VRFs. You can view the deployment status and history of each VRF.
To navigate to the IPFM VRF page:
-
Click Global Config.
-
Click the IPFM VRF subtab.
You can configure and monitor both NBM active and passive VRFs. In NBM passive mode, Nexus Dashboard will be involved only in the monitoring of IPFM fabric and not configuration except in setting up VRF mode as NBM passive. Perform the following steps to change the NBM mode:
-
Click Actions > Create VRF.
-
In the Create VRF page, enter the name of the VRF.
-
Choose Active or Passive and click Save & Deploy.
You cannot edit the existing VRF to change the NBM mode. You must delete and re-create VRF to change the NBM mode from active to passive or conversely.
If a fabric is set to monitor mode, changing a VRF is not applicable, as this is a fabric-level configuration and not a VRF configuration.
You are not allowed to create an IPFM VRF when none of the switches are imported to Nexus Dashboard. Import or add a switch to the fabric to create an IPFM VRF.
Discovery status is updated at regular intervals by a background process. NBM configuration can be deployed even if the switch is in an unreachable state. After periodic discovery, the status of the switches are updated appropriately.
IPFM VRF Table Fields and Description Field Description Name
Specifies the name of the VRF.
Mode
Specifies the type of mode (Active or Passive) of the VRF.
Deployment Status
Specifies whether the VRF deployment is successful, failed, or the VRF is not deployed. For default VRFs, the deployment status is displayed as Not Applicable. Click the Failed status to view more information about the Switch Global Config.
Deployment History
Specifies the deployment history of the VRF. For default VRFs, the deployment history is displayed as Not Applicable. Click View in Deployment History to view more information about the Deployment History.
Description
Specifies the description of the VRF.
Click the table header to sort the entries in alphabetical order of that parameter.
This table describes the action items, in the Actions drop-down list that appear in the IPFM VRF horizontal tab on Global Config in the Fabric Overview page.
IPFM VRF Actions and Description Action Item Description Create VRF
Allows you to create a new VRF.
To create a VRF, choose Create VRF from the Action drop-down list of the IPFM VRF horizontal tab on Global Config in the Fabric Overview page. In the Create VRF page, enter the VRF name and description, choose Active or Passive mode and click Save & Deploy to retain the changes and deploy or click Cancel to discard the changes.
When you create an active nondefault VRF, although the default host and flow policies are automatically created for that VRF, you must manually deploy the policies to the switches in the fabric. When VRF is set to passive, then flow policies are not created. For more information about deploying the policies manually, see Host Policies and Flow Policies.
Edit VRF
Allows you to edit a selected VRF.
To edit a VRF, select the check box next to the VRF that you want to edit and choose Edit VRF. In the Edit VRF page, you can edit only the description and click Save to retain the changes or click Cancel to discard the changes.
Delete VRF
Allows you to delete one or more VRFs, which deletes the data from the database and cancels the deployment on the switch.
To delete a VRF, select the check box next to the VRF that you want to delete and choose Delete VRF. You can select multiple VRF entries and delete them at the same instance.
Redeploy
Allows you to select and redeploy the VRFs with a failed status.
To redeploy a VRF to the switch, check the check box next to the VRF that you want to deploy again and choose Redeploy. You can choose multiple VRF entries and redeploy them at the same instance.
Deployment History
This table describes the fields that appear in Deployment History.
| Field | Description |
|---|---|
|
Type |
Specifies the type of VRF. |
|
VRF |
Specifies the name of the VRF. |
|
Switch Name |
Specifies the switch on which the VRF is deployed. |
|
Deployment Status |
Displays the status of the deployment. It shows if the deployment was a Success or if the deployment Failed along with the reason why the VRF deployment failed, or Not Applicable. |
|
Action |
Specifies the action that is performed on the switch, such as Create or Delete. |
|
Deployment Date/Time |
Displays the date and time when the deployment was initialized. |
Deployment Status
This table describes the fields that appear in Deployment Status.
| Field | Description |
|---|---|
|
Type |
Specifies the type of VRF. |
|
VRF |
Specifies the name of the VRF. |
|
Switch Name |
Specifies the switch on which the VRF is deployed. |
|
IP Address |
Specifies the IP address of the switch. |
|
Deployment Status |
Displays the status of the deployment. It shows if the deployment was a Success or Failed along with the reason why the deployment failed. |
|
Action |
Specifies the action that is performed on the switch, for example, Create. |
|
Deployment Date/Time |
Displays the date and time when the deployment was initialized. |