
New and Changed Information
The following table provides an overview of the significant changes up to this current release. The table does not provide an exhaustive list of all changes or of the new features up to this release.
| Release Version | Feature | Description |
|---|---|---|
|
Nexus Dashboard 4.1.1 |
Improved navigation and workflow to the Fabric Overview page for SAN fabrics |
Beginning with Nexus Dashboard 4.1.1, the navigation and workflow to the Fabric Overview page for SAN fabrics in Nexus Dashboard have been enhanced. |
|
Nexus Dashboard 4.1.1 |
New navigation to Links for SAN fabrics |
Beginning with Nexus Dashboard 4.1.1, the navigation to the Links page for SAN fabrics in Nexus Dashboard has changed. |
Navigate to Fabric Overview for SAN fabrics
To navigate to the Fabric Overview window for SAN fabrics:
-
Click Manage > Fabrics.
Any SAN fabrics that have already been configured is displayed.
-
Double-click on the appropriate SAN fabric.
The Fabric Overview window for that SAN fabric is displayed, with the Summary tab selected by default.
The Actions drop-down list at the Fabric Overview level allows you to configure backup. Refer to Backing Up and Restoring Your Nexus Dashboard for more information.
The Fabric Overview window contains tabs that allows you view and perform certain operations on the fabric:
View summary information
The Summary window displays several tiles that provide upper-level information about the SAN fabric, as described below.
To navigate to the Summary window:
-
Click the Summary tab.
The following areas appear in the Fabric Overview > Summary window:
Section
Description
Fabric Information
Provides basic information about the fabric.
You can view the following VSAN zone lock states on the Fabric Information dashlet:
-
Locked - Displays as Locked if at least one VSAN has a zone pending on a switch.
-
Unlocked - Displays as Unlocked when there are no VSANs with a zone pending on any switch.
-
Syncing - Displays as Syncing if a user initiated an on-demand request for Nexus Dashboard to retrieve the zone lock information from each switch in the fabric.
-
Unknown - Displays as Unknown when the zone lock state of the fabric is not fetched and stored in the cache.
You can click on the Refresh icon to get an update on demand.
If you hover over the zone lock State with your mouse, you can access a tooltip that displays the IP address of the switch with the zone lock including the VSAN ID. You can use the information from the tooltip to resolve the zone lock.
For more information on how to resolve a VSAN zone lock, see Troubleshooting VSAN Zone Locks.
Event Analytics
Displays the alarms and events based on the categories.
Links
Displays the N Port Virtualization (NPV) links and the Inter-Switch Links (ISLs).
Top Congested Devices
Displays the top congested devices.
Top Congested ISLs
Displays the top congested ISLs.
Switches
Displays the health, status, release versions, and modes for the connected switches.
Modules
Displays the modules.
Interfaces
Displays the interfaces.
Port Usage
Displays the port usage.
-
Troubleshooting VSAN Zone Locks
If you see that a VSAN zone is locked on the Fabric Overview > Summary page, perform the following steps to unlock the VSAN zone on the switch.
-
Navigate to the Manage > Zoning tab.
-
Ensure that you choose Regular as the Zoning Type.
-
Choose the fabric with the locked VSAN in the Fabric drop-down list.
-
Choose the VSAN with the zone lock from the VSAN drop-down list.
-
Choose the switch that has the zone lock from the Switch drop-down list.
-
Click Actions > Changes > Commit changes.
A Commit changes > Pending Zone Data dialog box displays showing the VSAN zone with the pending diff, on which VSAN ID, and the zone name.
-
Click Commit to commit the update.
View module information
To view the inventory information for modules in SAN fabrics:
-
Click the Modules tab.
The Modules tab displays a list of all the switches and its details for a selected scope.
Field
Description
Switch Name
Displays the switch name.
Module Name
Displays the module name.
Model
Displays the model name.
Serial Number
Displays the serial number.
Type
Displays the type of the module.
Oper. Status
Displays the operation status of the module.
Slot
Displays the slot number.
HW Revision
Displays the hardware version of the module.
Software Revision
Displays the software version of the module.
Asset ID
Displays the asset id of the module.
View and configure interfaces on switches
To view information on interfaces in SAN fabrics:
-
Click the Interfaces tab.
The following table describes the fields that appear on the Interfaces tab.
Field
Description
Switch Name
Specifies the name of the switch the interface belongs to.
Interface Name
Specifies the name of the interface.
The Show 24hr chart icon to the left of the interface name opens the Interface Details and Performance Chart dialog box for the selected interface. It displays details about the interface and a performance chart that depicts the traffic details through the interface. This chart is available only for interfaces that are connected to another interface.
Admin. Status
Specifies the administration status of the interface.
Oper. Status
Specifies the operational status of the interface.
Reason
Specifies the reason for failure.
Admin. Speed
Specifies the configured speed of the interface in Gbs.
Oper. Speed
Specifies the current operational speed of the interface in Gbs.
Mode
Specifies the mode of the interface.
VSAN
Specifies the name of the connected VSAN.
Connected To
Specifies the connection details.
Connected To Type
Specifies the type of connection.
Description
Specifies the description that you have added about the interface.
Owner
Specifies the name of the port owner.
Port Group
Specifies the port group number to which the interface belongs to.
You can also filter the performance data that is shown using the following options:
-
Real time: Gathers performance data every 10 seconds
-
Custom: Gathers performance data based on the calendar begin and end dates that you select
You can make these configurations for switch interfaces in a SAN fabric:
Perform a No Shutdown for an interface
-
Check the check box for the required interface and choose No Shutdown from the Actions drop-down list.
-
Click Confirm in the warning dialog box that appears.
Perform a Shutdown for an interface
-
Check the check box for the required interface and choose Shutdown from the Actions drop-down list.
-
Click Confirm in the warning dialog box that appears.
Assign a port owner for an interface
-
Check the check box for the required interface and choose Owner from the Actions drop-down list.
You can select multiple interfaces while assigning the port owner, if required.
-
Enter the required name in the Set Port Owner dialog box.
-
Click Apply.
Add a description for an interface
-
Check the check box for the required interface and choose Description from the Actions drop-down list.

You can add a description for multiple interfaces, simultaneously.
-
Enter the description in the Set Port Description dialog box.
-
Click Apply.
Set up diagnostics for an interface
-
Check the check box for the required interface.
-
Choose Link Diagnostics from the Actions drop-down list.
Edit port VSAN membership
-
Check the check box for the required interface.
-
Choose Edit Port VSAN Membership from the Actions drop-down list.
The Edit Port Vsan Membership dialog box appears.
You can select multiple interfaces for editing VSAN port membership if the interfaces are in the same VSAN.
-
Choose the Trunk, No Trunk, or Auto option for New Admin Trunk Mode and populate the New Trunking VSAN Allowed List with a comma-separated or a dash-separated list of the allowed VSANs.
The following table describes the fields that appear on the Edit Port Vsan Membership dialog box.
Field
Description
Switch
Specifies the name of the switch the interface belongs to.
Interface
Specifies the name of the interface.
Status
Specifies the operational status of the interface.
VSAN
Specifies the configured VSAN ID.
Admin Mode
Specifies the administrative mode of the interface.
Oper Mode
Specifies the operational mode of the interface.
-
Choose the new port number for the VSAN.
-
Click Apply.
You should receive a success message.
-
Choose the same interface and verify that the new port number is assigned to the VSAN.
Edit port trunking VSAN membership
-
Check the check box for the required interface and choose Edit Port VSAN Membership from the Actions drop-down list.
The Edit Port Trunking Mode and Vsan Allowed List dialog box appears.
You can select multiple interfaces for editing VSAN membership with port trunking if the interfaces have the same Port Trunking Allowed VSAN list.
-
Choose the Trunk, No Trunk, or Auto option for New Admin Trunk Mode and populate the New Trunking VSAN Allowed List with a comma-separated or a dash-separated list of the allowed VSANs.
The following table describes the fields that appear on the Edit Port Trunking Mode and Vsan Allowed List dialog box.
Field
Description
Switch
Specifies the name of the switch the interface belongs to.
Interface
Specifies the name of the interface.
Status
Specifies the operational status of the interface.
Oper Mode
Specifies the operational mode of the interface.
oper Trunk
Specifies the operational trunk mode.
admin Trunk
Specifies the administrative trunk mode.
Up VSAN List
Specifies the list of the VSANs where the interface is up.
Allowed Vsan List
Specifies the list of the VSANs where the interface is configured.
-
Click Apply.
You should receive a success message.
-
Choose the same interface and verify that the Allowed VSAN List is updated with the allowed VSANs.
Clear FICON RNID Old value
-
Filter for the value of old in the Connected To column.
-
Check the check box for the switch or switches that display old in the Connected To column.
-
Choose Clear FICON RNID Old Value from the Actions drop-down list.
-
Click OK in the confirmation dialog box.
Nexus Dashboard displays a success message indicating that the FICON (fiber connectivity) Request Node Identifier (RNID) status changed from old to invalid. The switch clears out the old RNID information, and Nexus Dashboard fetches the updated RNID information in the next discovery cycle.
-
Refresh the page to verify that the Connected To column no longer displays the value of old.
View and configure VSANs
You can configure and manage Virtual SANs (VSANs) from Cisco Nexus Dashboard.
To view information on interfaces in SAN fabrics:
-
Click the VSANs tab to view VSAN information.
You can view or configure a VSAN for the discovered fabrics, with either Manageable or Manage Continuously status. For a selected fabric, a VSAN scope tree is displayed in the left panel.
You can achieve higher security and greater stability in Fibre Channel fabrics by using virtual SANs (VSANs) on Cisco Data Center Switches and Cisco MDS 9000 Series switches. VSANs provide isolation among devices that are physically connected to the same fabric. With VSANs, you can create multiple logical SANs over a common physical infrastructure. Each VSAN can contain up to 239 switches and has an independent address space that allows identical Fibre Channel IDs (FC IDs) to be used simultaneously in different VSANs.
Cisco Nexus Dashboard does not discover, nor display any suspended VSAN.
The VSANs tab displays the following fields.
|
Field |
Description |
|
VSAN Name |
Displays the VSAN name. The information that is associated with the selected VSAN scope appears in the right panel. If a VSAN is segmented, each individual segmented VSAN is a VSAN scope. For every selected VSAN scope, you can view information in tabs. |
|
VSAN ID |
Specifies the VSAN ID. |
|
Segments |
Specifies the Segments on this VSAN. Click on segments to open a slide-in pane to view summary information about each segment. |
|
Status |
Specifies if VSAN is Up or Down. |
The following table describes the action items, in the Actions drop-down list, that appear on the Fabrics Overview > VSANs tab.
|
Action Item |
Description |
|
Create VSAN |
Allows you to launch a wizard to create a VSAN. For more information, see Create VSAN Wizard. |
|
Delete VSAN |
Select the VSAN and click Delete VSAN to delete the VSAN. For more information, see Delete a VSAN. |
When changing the switch port of a VSAN in Nexus Dashboard, if the port was associated with an isolated VSAN, then the previous VSAN column will be blank. For a description on all the fields that appear on the tabs, see View additional information for segmented VSANs.
Default VSAN settings
The following table lists the default settings for all configured VSANs.
| Parameters | Default |
|---|---|
|
Default VSAN |
VSAN 1. |
|
State |
Active State |
|
Name |
Concatenation of VSAN and a four-digit string representing the VSAN ID. For example, VSAN 3 is VSAN0003. |
|
Load-balancing attribute |
OX ID (src-dst-ox-id). |
Create VSAN Wizard
The VSAN Creation Wizard workflow includes these steps:
-
VSAN ID and name
-
Select Switches
-
Configure VSAN Attributes
-
Configure VSAN Domain
-
Configure Port Membership
-
Go to Manage > Fabrics, then double-click on a fabric to view the Fabric Overview page.
-
Click on the VSANs tab to view VSAN information.
-
Click Actions > Create VSAN.
The Create New VSAN screen of the wizard is displayed.
-
Ensure that the VSAN is not already created.
To create and configure VSANs from the Cisco Nexus Dashboard Web UI, perform the following steps:
You cannot configure any application-specific parameters for a VSAN before creating the VSAN.
Ensure that the VSAN is not already created. Do not create the VSAN in suspended state.
The suspended VSANs are not managed.
-
In the VSAN ID and Name window, perform the following steps:
-
Ensure that the correct Fabric is against the Fabric field.
-
In the VSAN ID field, select VSAN ID from the drop-down list.
The range is 2-4094. Create the list of VSAN ID in at least one Switch in the Fabric. VSAN ID 4079 is for reserved VSAN.
-
In the VSAN Name field, enter a name for VSAN.
If the field is left blank, the Switch assigns a default name to the VSAN.
-
Click the FICON check box to enable FICON on the switch.
-
Click Next.
-
-
In the Select Switches screen, click the check box next to the Switch Name, to create the VSAN.
If the switch name is grayed out, it implies that the switch is already part of a VSAN. It may also imply that the switch doesn’t have FICON feature enabled, if FICON is checked in the previous step.
Click Next.
-
In the Configure VSAN Attributes screen, configure the VSAN attributes.
If you create a VSAN in a suspended state, it doesn’t appear on the Cisco Nexus Dashboard as it doesn’t manage suspended VSANs.
-
In Load Balancing, select the load balancing type to be used on the VSAN.
The following types are available:
-
Src ID/Dest ID: Based on only source ID (Src_ID) and destination ID (Dest_ID).
-
Src ID/Dest ID/Ox ID (default): Originator exchange ID (Ox_ID) is also used for load balancing, in addition to Src_ID and Dest_ID. 0x_ID is an exchange ID assigned by the originator Interconnect Port for an exchange with the target Interconnect Port.
-
-
In InterOp, select an interoperability value.
The InterOp value is used to interoperate with different vendor devices. You can choose from one of the following:
-
Default: implies that the interoperability is disabled.
-
InterOp-1: implies that the VSAN can interoperate with all the Fibre Channel vendor devices.
-
InterOp-2: implies that the VSAN can interoperate with specific Fibre Channel vendor devices for basic to advanced functionalities.
-
InterOp-3: implies that the VSAN can interoperate with specific Fibre Channel vendor devices for basic to advanced functionalities.
-
InterOp-4: implies that the VSAN can interoperate with specific Fibre Channel vendor devices for basic to advanced functionalities.
InterOp isn’t supported on FICON VSAN.
-
-
In Admin State, select the configurable state for this VSAN.
-
Active: implies that the VSAN is configured and services for this VSAN is activated.
-
Suspended: implies that the VSAN is configured, but the service for this VSAN is deactivated.
Choose this state to preconfigure all the VSAN parameters for the whole Fabric.
Nexus Dashboard doesn’t manage a suspended VSAN, and therefore it does not appear in the VSAN scope.
-
-
Check the InOrder delivery check box to allow in-order delivery.
When the value of fcInorderDelivery is changed, the value of this object is set to the new value of that object.
-
Check the Add Fabric Binding DB check box if you want to enable the fabric binding for the FICON VSAN.
If the check box is selected, all the peers in the selected switches are added to each switch in the selected list.
-
Check the All Port Prohibited check box if you want to prohibit all the ports for FICON VSAN.
If the check box is selected, the FICON VSAN is created as all Ports prohibited, by default.
-
Click Next.
-
-
In the Configure VSAN Domain screen, configure the static domain IDs for FICON VSAN.
-
Check the Use Static Domain IDs check box to configure the domain ID for the switches in the VSAN.
-
The Available Domain IDs field shows all the available Domain IDs in the Fabric.
Click Automatically apply available domain IDs to assign the domain ID for every switch that is selected to be a part of the VSAN.
-
For every switch in the table, enter the domain ID from the list of available Domain IDs.
-
Click Next.
-
-
In the Configure Port Membership screen, for every switch in the VSAN, configure the interfaces as the member of the new VSAN.
Modifying the Port VSAN may affect the I/O of the interface.
Click Next.
-
In the Review screen, verify if you have configured the VSAN correctly.
Click Previous to navigate to the earlier screen and modify the configuration.
Click Finish to confirm and configure the VSAN. The VSAN creation result is displayed at the bottom of the window.
After the VSAN is created, it will take few minutes for the new VSAN to appear in the VSAN scope tree.
If the switch port is associated with Isolated VSAN then the previous VSAN information will be blank.
Delete a VSAN
To delete a VSAN and its attributes from the Cisco Nexus Dashboard Web UI, perform the following steps:
-
Go to Manage > Fabrics, then double-click on a fabric to view the Fabric Overview page.
-
Click on the VSANs tab to view VSAN information.
The VSANS window is displayed.
-
Select the VSAN that you want to delete and click Actions > Delete VSAN.
The Delete VSAN screen appears, showing the switches associated with the VSAN.
-
Select all of the switches or select a specific switch to delete the VSAN from those switches, then click Delete VSAN.
A confirmation window appears.
-
Click Confirm to confirm the deletion or click Cancel to close the dialog box without deleting the VSAN.
After the VSAN is deleted, it will take few minutes for the new VSAN to disappear from the VSAN scope tree.
View additional information for segmented VSANs
If a VSAN is segmented, each individual segmented VSAN is a VSAN scope. For every selected VSAN scope, you can view additional information in these tabs:
Switches
This tab displays Switches in the VSAN scope. Click the Switch name to view the summary information of the switch. The following table describes the fields that appear on the Switches tab.
| Field | Description |
|---|---|
|
Name |
Specifies the name of the switch in the VSAN. Click the name to view the switch summary. Click Show more Details to view complete information. |
|
Domain ID |
Specifies an insistent domain ID. |
|
VSAN WWN |
Specifies the world wide name (WWN) of the VSAN. |
|
Principal WWN |
Specifies the world wide name (WWN) of the switch.
For the principal switch, the value is self. |
|
Model |
Specifies the model name of the switch. |
|
Release |
Specifies the NX-OS version on the switch. |
|
Up Time |
Specifies the time from which the switch is up. |
ISL
This tab displays information about the ISLs about the switches in the VSAN scope. The following table describes the fields that appear on the ISLs tab.
If the VSAN is configured on both the switches across the ISL and if VSAN is not enabled on the ISL, Nexus Dashboard considers VSAN as segmented. Therefore, add the VSAN to the trunked VSANs across the ISL to clear the warning message. Alternatively, you can ignore this warning message.
| Field | Description |
|---|---|
|
VSANs |
All VSANs which this ISL runs traffic on. |
|
From Switch |
The source switch of the link. |
|
From Interface |
The port index of source E_port of the link. |
|
To Switch |
The switch on the other end of the link. |
|
To Interface |
The port index of destination E_port of the link. |
|
Speed |
The speed of this ISL. |
|
Status |
The operational status of the link. |
|
Port Channel Members |
The member of Port Channel if the ISL is a Port Channel. |
|
Additional Info |
Additional information for this ISL, such as, TE/TF/TNP ISL. |
Host Ports
This tab displays information about the host ports on the switches in the VSAN scope. The following table describes the fields that appear on the Host Ports tab.
| Field | Description |
|---|---|
|
Enclosure |
The name of the enclosure. |
|
Device Alias |
The device alias of this entry. |
|
Port WWN |
The assigned PWWN for this host. |
|
Fcid |
The FC ID assigned for this host. |
|
Switch Interface |
Interface on the switch that is connected with the end device. |
|
Link Status |
The operational status of the link. |
|
Vendor |
Specifies the name of the vendor. |
|
Serial Number |
Specifies the serial number of the enclosure. |
|
Model |
Specifies the name of the model. |
|
Firmware |
The version of the firmware that is executed by this HBA. |
|
Driver |
The version of the driver that is executed by this HBA. |
|
Additional Info |
The information list corresponding to this HBA. |
Storage Ports
This tab displays information about the storage ports on the switches in the VSAN scope. The following table describes the fields that appear on the Storage Ports tab.
| Field | Description |
|---|---|
|
Enclosure |
The name of the enclosure. |
|
Device Alias |
The device alias of this entry. |
|
Port WWN |
The assigned PWWN for this host. |
|
Fcid |
The FC ID assigned for this host. |
|
Switch Interface |
Interface on the switch that is connected with the end device. |
|
Link Status |
The operational status of the link. |
Attributes
This tab displays the attributes of all the switches in the VSAN scope. The following table describes the fields that appear on the Attributes tab.
| Field | Description |
|---|---|
|
Edit |
Click Edit to modify the attributes of the VSAN and to push the same VSAN attributes to the selected switches. If the VSAN is FICON VSAN in any selected switch, the following fields won’t appear on the UI, as they can’t be modified for the FICON VSAN.
After modify the attributes, you can click Save to save changes or Cancel to discard. |
|
Switch Name |
Displays the name of the switch that is associated with the VSAN. |
|
VSAN Name |
Displays the name of the VSAN. |
|
Admin |
Specifies if the status of the Admin is either Active or Suspend.
If you suspend a VSAN, it’s removed from Cisco Nexus Dashboard as well. |
|
Oper |
The operational state of the VSAN. |
|
MTU |
Displays the MTU for the switch. |
|
Load Balancing |
Specifies the load-balancing type that is used in the VSAN. The type of load balancing used on this VSAN.
|
|
InterOp |
The interoperability mode of the local switch on this VSAN.
|
|
Inorder Delivery |
The Inorder Delivery guarantee flag of device. If true, then the inorder delivery is guaranteed. If false, it’s not guaranteed. |
|
FICON |
True if the VSAN is FICON-enabled. |
Domain ID
This tab displays information about the VSAN domain and its parameters. The following table describes the fields that appear on the Domain ID tab.
| Field | Description |
|---|---|
|
Edit |
Select a switch and click the Edit icon to modify the Domain ID information for the selected switch. |
|
Switch Name |
Specifies the switch name in the VSAN.
NPV switches aren’t listed in this column. However, the NPV switches exist in this VSAN fabric. |
|
State |
Specifies the state of the Switch. |
|
Enable |
Specifies if the Domain ID is enabled or disabled. |
|
Running |
Specifies the running domain. |
|
Config |
Specifies the configuration. |
|
Config Type |
Specifies the usage of the domain ID type-preferred or static. |
|
Icons |
|
|
Total |
The number next to Table specifies the entries under this tab. |
|
Refresh Icon |
Click the Refresh icon to refresh the entries. |
VSAN Membership
This tab displays information about the interfaces on the switches that form the VSAN. The following table describes the fields that appear on the VSAN Membership tab.
| Field | Description |
|---|---|
|
Edit |
Select a switch and click the Edit icon to modify Port VSAN Membership for selected VSAN and selected switch. Port VSAN Membership is presented by different types including FC (physical), Port Channel, FCIP, iSCSI, VFC (slot/port), VFC (ID), VFC Channel, VFC FEX, and VFC Breakout, PortChooser is provided for each type to show all existing interfaces on a selected switch for the user to choose from.
If you modify Post VSAN Membership for any operational trunking port or port channel members, a warning appears. Use the Device Manager to change Allowed VSAN List for Trunking Interface. |
|
Switch Name |
Name of the switch |
|
Interfaces |
FC Ports in VSAN |
View and configure device aliases
A device alias is a user-friendly name for a port WWN. Device alias name can be specified when configuring features such as zoning, QoS, and port security. The device alias application uses the Cisco Fabric Services (CFS) infrastructure to enable efficient database management and fabric-wide distribution.
To view and configure device aliases:
-
Click the Device Aliases tab.
This table describes the fields that appear under Device Aliases tab.
Field Description Switch
Displays the device alias switch name.
Device Alias
Displays the alias retrieved from the switch.
pWWN
Displays the port WWN
Configure device aliases
Before performing any device alias configuration, check the status on the CFS tab to ensure that the status is shown as success.
To perform device alias configuration from the Nexus Dashboard Web UI, the fabric must be configured as Device Alias enhanced mode.
To add, or edit, or delete device aliases:
-
Click the Device Aliases tab.
-
Click the check box next to the switch column where you want to add the device alias.
-
Click Actions > Add device alias.
The Add device alias windows appears.
All the provisioned port WWNs are populated in the table.
-
Enter a device alias name in the Device Alias field to indicate to create a device alias for the selected pWWN.
-
Click Save to exit the inline editor mode.
-
Click Apply to assign the device alias to the switches.
You can also create a device alias with a non-provisioned port WWN.
-
Click + icon of Pre-provision device aliases to create a new table row in inline editor mode.
-
In the pWWN field, enter the non-provisioned port WWN and device alias for the new alias.
-
Click Save to exit the inline editor mode.
-
Click Apply to assign the device alias and the associated pWWN to the switches.
If you close the Add device alias window before applying the device alias to the switches, the changes will be discarded and the device alias will not be created.
-
-
To edit the device alias, choose the check box next to the switch column, and then click Actions > Edit device aliases.
You can select multiples switches to edit device aliases.
The Edit device aliases windows appears.
All the selected port WWNs are populated in the table.
-
Click Edit icon next to the pWWN column.
-
Enter a required device alias name in the Device Alias field and click tick icon to save the name.
-
Repeat the same procedure to edit other device alias names.
-
Click Apply to save edited device aliases to the switches.
When you rename a device alias, a warning message appears that editing device alias causes traffic interruption and to review the zone member type. For Cisco NX-OS Releases in:
* 7.x releases - before 7.3(0) releases
* 6.x releases - before 6.2(15) releases
-
Click Cancel to discard changes or click Confirm to save changes.
-
-
Choose check box next to the switch column for which you need to delete the device alias.
-
Click Actions > Delete device alias.
A confirmation window appears.
Deleting the device alias may cause traffic interruption.
-
Click Yes to delete the device alias.
-
-
For end devices with an attached service profile, the service profile name is populated to the Device Alias field. This allows the service profile name as a device alias name for those devices.
Device Alias creation is CFS auto committed after clicking Apply. Click CFS tab to check if CFS is properly performed after the device alias created. In case of failure, you must troubleshoot and fix the problem.
View CFS information
CFS information is listed for all the eligible switches in the fabric. Before performing any Device Alias configuration, check the status on the CFS tab to ensure that the status is shown as "success". If the CFS is locked by another user, or if the previous operation failed, ensure that the CFS session is unlocked.
The following table describes the columns that appears on the CFS tab:
| Fields | Descriptions |
|---|---|
|
Switch |
Specifies the name of switch. |
|
Feature |
Specifies the feature on the switch. |
|
Last Action |
Specifies the last action performed on the switch. |
|
Result |
Specifies the action performed is success or unsuccessful. |
|
Lock Owner Switch |
Specifies whether the switch is locked or not. |
|
Lock Owner User |
Specifies the user role name if the switch is locked. |
|
Merge Status |
Specifies the merge status of the switch. |
To view CFS information from the Nexus Dashboard Web UI:
-
To commit the CFS configuration, choose the Switch radio button, click Commit.
The CFS configuration for this switch is committed.
-
To abort the CFS configuration, choose the Switch radio button, click Abort.
The CFS configuration for this switch is aborted.
-
To clear the lock on the CFS configuration, choose the Switch radio button, click Clear lock.
If the CFS is locked by another user, or if the previous operation failed, ensure that the CFS session is unlocked.
View and configure event analytics
The information shown in the Event Analytics tab is described in greater detail in these areas:
-
Alarms: See the "Alarms" section in Event Analytics for SAN Fabrics
-
Events: See the "Events" section in Event Analytics for SAN Fabrics
-
Accounting: See the "Accounting" section in Event Analytics for SAN Fabrics
Back up and restore fabric configurations
This table describes the columns that appears on the Backup tab.
| Fields | Descriptions |
|---|---|
|
Switch |
Specifies the name of switch. |
|
Backup Date |
Specifies the backup date. |
|
Backup Tag |
Specifies the backup name. |
|
Backup Type |
Specifies the backup type, whether it is a golden backup. |
|
Configuration Files |
Specifies the configuration files details. |
The following table describes the fields and descriptions that appears on Action tab.
| Actions | Descriptions |
|---|---|
|
Backup now |
|
|
Copy to bootflash |
Choose Copy to bootflash. A confirmation window appears, click OK. For more information on bootflash, see the section "Copy to bootflash" in Understanding Switch Overview for SAN Fabrics. |
|
Compare |
Choose required switch names to compare configuration of switches, choose Compare. You can select only two switches at an instance. Compare Config window appears, displaying the difference between the two configuration files. The Source and Target configuration files content is displayed in two columns. The differences in the configuration file are show in the table, with legends.
|
|
Export |
Click Export. The files are downloaded in your local system. You can use the third-party file transfer tools to transfer these files to an external server. |
|
Edit tag |
Click Edit tag to change the backup tag name. |
|
Mark as golden |
To mark existing backup as golden backup, choose Mark as golden, a confirmation window appears, click Confirm. |
|
Remove as golden |
To remove existing backup from golden backup, choose Remove as golden, a confirmation window appears, click Confirm. |
|
Delete |
To delete existing backups, choose Delete a confirmation window appears, click Confirm.
If you have marked backup as golden backup. make sure that the golden backup is removed, else error appears you can’t delete existing backup. |
Monitor changes in configurations using Configuration Monitor
Nexus Dashboard allows you to monitor the changes in configuration as compared to the baseline configuration.
After fabric discovery, configuration monitor saves the baseline configuration for all the switches in the fabric. Nexus Dashboard monitors the following parameters:
-
NTP_TimeZone
-
NTP_TimeServer
-
AAA Config
-
SYSLOG
-
SNMP Host
-
ACL
-
Users
The monitoring job is executed once a day, everyday, to check for differences in the baseline configuration with the current configuration. The Configuration Drift column displays Yes when there is a difference between the baseline and the current configuration and an alarm is raised. You can view the alarms raised on Cisco Nexus Dashboard by navigating to Analyze > Event Analytics > Alarms > Alarms Raised.
The Fabric Overview > Configuration Monitor tab displays the following fields.
|
Field |
Description |
|
Switch Name |
Displays the switches discovered in the fabric. You can click on the switch name to view the summary information in a slide-in pane. |
|
IP Address |
Specifies the IP address of the switch. |
|
Baseline Configuration Time |
Specifies the time at which the baseline configuration was generated. |
|
Baseline Configuration |
Click View to view the baseline configuration for the specific switch. Click Close to return to the initial view. |
|
Configuration Drift |
Specifies if there is a difference in the current configuration as compared to the baseline configuration. N/A specifies that Nexus Dashboard failed to collect the switch baseline configuration due to SSH or reachability issues. No specifies that there is no configuration difference. Yes specifies that there is a configuration drift as compared to the baseline configuration. Click Yes to view the configuration difference. On the Configuration Differences page, Baseline and Current configurations are displayed side-by-side in two columns. The new configuration is highlighted in green color, and the deleted configuration lines are highlighted in red color. Nexus Dashboard generates an alert every 24 hours if the up or trunking interfaces differ from the current interface count. Navigate to Fabric Overview > Configuration Monitor and choose a switch. Click View under the Baseline Configuration column. With this feature, the Base Configuration page displays the up or the trunking interfaces. Nexus Dashboard compares the results between the baseline configuration and the current configuration for the up or the trunking interfaces to determine the configuration differences. You can view the alarms raised by navigating to Analyze > Event Analytics > Alarms > Alarms Raised. This feature is limited to MDS platforms that support the |
The following table describes the action items, in the Actions drop-down list, that appear on the Fabric Overview > Configuration Monitor tab.
For every event, an alarm is triggered and recorded on the Analyze > Event Analytics > Alarms > Alarms Raised page. If you Disable Fabric Monitoring, all the alarms are moved to Alarms Cleared.
|
Action Item |
Description |
|
Enable Fabric Monitoring |
Allows you to enable fabric monitoring on all switches in the fabric. |
|
Disable Fabric Monitoring |
Allows you to disable monitoring the entire fabric. Note that if you disable fabric monitoring, the configuration drift data will not be captured and there will be no data to display on this tab.
If you Disable Fabric Monitoring for the fabric, all the alarms are moved to Alarms Cleared tab. |
|
Reset Baseline Configuration |
Allows you to reset baseline configuration. Select the switch and choose Reset Baseline Configuration to purge all the configurations into the Baseline Configuration. |
View name server information
Name Server stores name entries for all hosts in the FCNS database. The name server permits an Nx port to register attributes during a PLOGI (to the name server) to obtain attributes of other hosts. These attributes are deregistered when the Nx port logs out either explicitly or implicitly. In a multiswitch fabric configuration, the name server instances running on each switch shares information in a distributed database. One instance of the name server process runs on each switch.
To view name server information:
-
Click the Name Server tab.
The Name Server tab displays name server entries for the selected fabric. Note that this data is pulled from the switches discovery so duplicate entries are removed.
| Field | Description |
|---|---|
|
VSAN ID |
Specifies the VSAN ID for the selected Fabric. |
|
FC ID |
Specifies the associated interface FCID. |
|
Switch |
Specifies the name of the switch. Click on the switch name to view the switch summary information. Double click on the switch name to launch the Switch Overview screen. |
|
Port |
Specifies the interface port. |
|
Device Alias |
Displays the alias retrieved from the switch. A device aliases is a user-friendly name for a port WWN. Device alias name can be specified when configuring features. |
|
Type |
The options are N and NL. |
|
Port Name |
Specifies the name of the port. |
|
Node Name |
Specifies the name of the node. |
|
FC4Type:Feature |
Specifies the FC Type that the port is using. This includes which protocol or state the port is in, that is, scsi-fcp, nvme, npv and whether it is an initiator or target. The following are the sample values:
|
View port usage information
To view port usage information:
-
Click the Port Usage tab.
You can view the following information on the Port Usage tab.
-
Port Speed column displays the speed of the port.
-
Used Ports column displays the total ports with the mentioned port speed.
-
Available Ports column displays the available ports for the port speed.
-
Total Ports column displays the total ports with the mentioned speed.
-
Estimated Day Left column displays the estimated days left for the ports.
-
You can use Filter by attribute to view required information.
Click Refresh icon to refresh the table.
Used ports displays the total used ports for the selected switch. Total ports displays the total available ports for the selected switch.
View CPU, memory, traffic, temperature, and power metrics
To view CPU and memory utilization, traffic, temperature, and power utilization for your fabric and the connected switches:
-
Click the Metrics tab.
If you do not see the Metrics tab, click on the three dots (. . .) to access the Metrics tab.
The tabs and their fields on the page are explained in the following sections.
CPU and Memory
The following table describes the columns that appear on the CPU and the Memory tabs.
|
Field |
Description |
|
Switch Name |
Specifies the name of the switch. Click the name of a switch to access a Switch slide-in pane with the switch details. Click on the graph icon to view the CPU or memory performance chart. |
|
IP Address |
Specifies the switch IP address. |
|
Low Value (%) |
Specifies the lowest CPU utilization value on the switch. |
|
Avg. Value (%) |
Specifies the average CPU utilization value on the switch. |
|
High Value (%) |
Specifies the high CPU utilization value on the switch. |
|
Low to High Value Range (Preview) |
Specifies the linear range preview. |
Click the drop-down list to view CPU or memory data for the selected Day, Week, Month, or Year.
The label for the drop-down list changes based on your selection. For example, if you clicked Day, the label changes to Show last day.
Traffic
The following table describes the columns that appear on the Traffic tab.
|
Field |
Description |
|
Switch Name |
Specifies the name of the switch. Click the name of a switch to access a Switch slide-in pane with the switch details. |
|
Avg. Rx |
Specifies the average Rx value. |
|
Peak Rx |
Specifies the peak Rx value. |
|
Avg. Tx |
Specifies the average Tx value. |
|
Peak Tx |
Specifies the peak Tx value. |
|
Avg. Rx+Tx |
Specifies the average of the Rx and Tx value. |
|
Avg. Errors |
Specifies the average error value. |
|
Peak Errors |
Specifies the peak error value. |
|
Avg. Discards |
Specifies the average discarded value. |
|
Peak Discards |
Specifies the peak discarded value. |
|
Last Update Time |
Specifies the last updated time. |
Click the drop-down list to view traffic data for the selected Day, Week, Month, or Year.
The label for the drop-down list changes based on your selection. For example, if you clicked Day, the label changes to Show last day.
Temperature
The following table describes the columns that appear on the Temperature tab.
|
Field |
Description |
|
Switch Name |
Specifies the name of switch. Click the name of a switch to access a Switch slide-in pane with the switch details. Click the graph icon to view the temperature chart. |
|
IP Address |
Specifies the switch IP address. |
|
Temperature Module |
Specifies the module of temperature. |
|
Low Value (°C) |
Specifies the lowest temperature value in degrees. |
|
Avg. Value (°C) |
Specifies the average temperature value in degrees. |
|
High Value (°C) |
Specifies the high temperature value in degrees. |
Click the drop-down list to view temperature data for the selected Hour, Day, Week, or Month.
The label for the drop-down list changes based on your selection. For example, if you clicked Day, the label changes to Show last day.
Power
The following table describes the columns that appear on the Power tab.
|
Field |
Description |
|
Switch Name |
Specifies the name of the switch. Click the name of a switch to access a Switch slide-in pane with the switch details. |
|
IP Address |
Specifies the switch IP address. |
|
Power Module |
Specifies the power module. Click the graph icon to view the power usage chart. |
|
Power Usage (%) |
Specifies the power usage as a percentage with subcategories based on the selected switch. |
|
Avg |
Specifies the average power usage. |
|
Min |
Specifies the minimum power usage. |
|
Max |
Specifies the maximum power usage. |
|
Capacity (AMPs) |
Specifies the capacity in (amps) amperes. |
|
Draw (AMPs) |
Specifies the power usage draw with subcategories based on the selected switch. |
|
Avg |
Specifies the average power usage draw. |
|
Min |
Specifies the minimum power usage draw. |
|
Max |
Specifies the maximum power usage based. |
|
Capacity (WATTs) |
Specifies the power capacity in watts. |
|
Draw (WATTs) |
Specifies the power usage draw in watts with subcategories based on the selected switch. |
|
Avg |
Specifies the average power usage draw in watts. |
|
Min |
Specifies the minimum power usage draw in watts. |
|
Max |
Specifies the maximum power usage draw in watts. |
|
Power Module |
Click on the graph icon under the Power Module column to filter the power usage based on the chosen data type. Options include:
Click on Day, Week, or Month to filter the data based on time increments. If you click on the Day increment, the graph displays one line for the selected data type. If you click on the Week or Month option, the graph displays the average, minimum, or maximum power usage values depending on the chosen data type. |
Click the drop-down list to view power data for the selected Hour, Day, Week, or Month.
The label for the drop-down list changes based on your selection. For example, if you clicked Hour, the label changes to Show last hour.
View slow drain statistics at the switch and port level using Congestion Analysis
The Congestion Analysis option enables you to view slow drain statistics at the switch level and the port level. You can monitor the slow drain issue within any duration. You can display the data in a chart format and export the data for analysis. You can also view the topology that provides a high-level view of txwait, drops, credit loss recovery, over utilization, and port monitor events. You can view the data from the congestion analysis counters such as, TxWait% and Peaktx Wait% to monitor and prevent congestion or slow drain.
-
The jobs run in the background, even after you log off.
-
For the Cisco MDS 9000 Series switches running on NX-OS version 9 and later, performance monitoring data is polled using NX-API for the fiber channel (FC) ports, and the NX-API feature is automatically enabled if it’s not already enabled. For Cisco MDS 9000 Series switches running on NX-OS version 8 and earlier, SNMP is used instead.
-
Slow drain job page is removed because the slow drain job is integrated into PM and it runs together with the PM collection for 24 hours by default.
Follow these steps to view slow drain statistics at the switch and port level:
-
Click Congestion Analysis.
The Congestion Analysis page shows the congestion data for the fabric directly for the last 24 hours.
-
Use the date picker to change the time scope to see the history data up to two weeks.
-
Click the tooltip icon to view the descriptions of all the Congestion Analysis counter descriptions and what they indicate.
-
-
Determine the type of information that you want to have displayed in the Device Interfaces table.
-
Select Only Rows With Data to filter and display the nonzero entries in the statistics.
-
Select Show All Rows to show all entries in the table, regardless of their values.
-
-
Click a switch name in the Switch Name column of the Device Interfaces table to display the switch’s health.
-
Click an interface name in the Interface column of the Device Interfaces table to display the slow drain value for the switch port in a chart format.
-
Use the Filter by attributes option to display the details based on the defined value for each column. For example, you can filter the data based on a value you enter for Switch Name, Interface, Connect To, Speed, and Type.
-
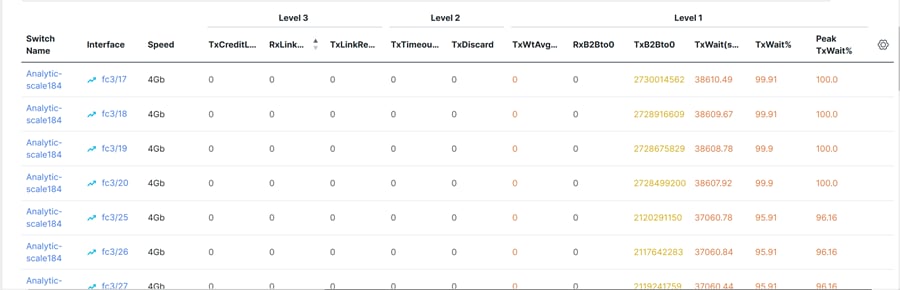
View and analyze the data shown in the Congestion Analysis counters, including TxWait% and Peak TxWait%. The Peak TxWait% shows data for the Peak traffic time.
The data for the Congestion Analysis counters is displayed in different colors, indicating the severity levels. Red for Level 1, orange for Level 2, and yellow for Level 3.
There is a slight difference in color indicators for TxWait% data values. TxWait% values less than 30% are displayed in yellow, and TxWait% values greater than 30% are displayed in orange.
View a visualization of congestion information
A topology of the selected fabric appears when you click a fabric name and displays congestion details for the fabric. The topology window shows color-encoded nodes and links that correspond to various network elements. For each of the elements, you can hover over to fetch more information. The links and switches are color-coded. Enable performance collections and SNMP traps to view the congestion information on the topology.
The following table lists the color description that is associated with the links and switches.
| Color | Name | Description |
|---|---|---|
|
Blue (light) |
High Utilization |
High utilization tx-datarate >= 80% |
|
Green |
Normal |
No Congestion found |
|
Red |
Level 3 |
Credit loss recovery |
|
Orange |
Level 2 |
Drops |
|
Yellow (dark) |
Level 1.5 |
txwait >= 30% |
|
Yellow |
Level 1 |
txwait < 30% |
|
Gray (light) |
No Data |
No Data |
A switch color represents the highest level congestion that is found on any link to switch. The maximum value is 3 and the minimum value is 1. A switch has two colors if overutilized. The right half of the switch is colored in light blue to represent the overutilization. A number on the switch represents the number of F ports with congestion. The color around the number represents the highest level congestion that is found on F ports of the switch. Click the switch to bring in a sliding window, which shows the switch details. Double-click on the switch to view congestion data by filtering on the switch name.
Two parallel lines are used to represent the congestion on links. Links are bidirectional, hence each direction has a color to represent the highest level of congestion. Hover over a link to view the switch and interface name of the source and destination. Click a link to view the congestion data that is related to that link alone.
The highest congestion level a link can have is Level 3. Valid colors for a link are Green, Red, Orange, Yellow, and Gray (light).
View DIRL information
Dynamic Ingress Rate Limiting (DIRL) is used to automatically limit the rate of ingress commands and other traffic to reduce or eliminate the congestion that is occurring in the egress direction. DIRL does this by reducing the rate of IO solicitations such that the data generated by these IO solicitations matches the ability of the end device to process the data without causing any congestion. As the device’s ability to handle the amount of solicited data changes, DIRL, will dynamically adjust seeking to supply it with the maximum amount of data possible without the end device causing congestion. After the end device recovers from congestion, DIRL will automatically stop limiting the traffic that is sent to the switch port.
In case of slow drain and over utilization, the assumption is that if the rate of IO solicitation requests is reduced then this will make a corresponding reduction in the amount of data solicited and being sent to the end device. Reducing the amount of data will resolve both the slow drain and over utilization cases.
DIRL is comprised of two functions and can perform equally well on congestion caused both slow drain and over utilization:
-
Port monitor: Detects slow drain and overutilization conditions and if the port guard action is set as DIRL, it notifies FPM. Port monitor port guard action DIRL can be configured on the following counters:
-
txwait: Use for detection of slow drain.
-
tx-datarate: Used for detection of overutilization.
-
tx-datarate-burst: Use for detection of overutilization.
-
-
FPM: DIRL actions are taken by FPM as notified by port monitor. On detecting a rising threshold from port monitor, FPM does rate reduction causing the rate of ingress traffic to be reduced. On detecting the value of a counter being below the falling threshold continuously for the DIRL recovery interval, FPM does rate recovery.
After the port monitor policy is configured with the DIRL portguard action and activated, all non- default F ports are monitored by default, and FPM is notified if congestion is detected on any of these ports. However, you can manually exclude certain interfaces from being monitored.
The following are the different transition states of DIRL:
-
Normal: The state in which a port is functioning normally and state before it enters DIRL Rate Reduction. After full recovery, the port returns to the Normal state.
-
DIRL Rate Reduction: The state in which an event rising threshold triggers the DIRL rate reduction process.
-
DIRL Rate Reduction Maximum: The state in which the DIRL rate reduction has reached its maximum value and more rising thresholds events are detected.
-
DIRL Status: The state in which an event below the rising threshold and above the falling threshold is detected. This state will transition to the DIRL Recovery state when an event below the falling threshold is detected for the configured recovery-interval.
-
DIRL Rate Recovery: The state in which the DIRL rate recovery happens on detecting an event below the falling threshold for the configured recovery-interval. This state will transition to the Normal state after the port recovers completely from DIRL.
This state is a recurring state and there will be multiple rate recoveries before the ports are completely recovered from DIRL. This state will transition to the DIRL Stasis state when an event below the rising threshold and above the falling threshold is detected.
The following are the actions that are initiated by DIRL depending on the type of event detected on the port:
The events are listed in reverse chronological order with the most current event at the top.
-
An event rising threshold is detected on the port and DIRL is initiated for the port. The port ingress traffic rate is reduced to 50% of its current rate.
-
In the next polling interval, the recovery-interval expires without detecting a rising threshold. The port ingress traffic is increased by 25% of its current capacity.
-
In the next polling interval, the recovery-interval expires without detecting a rising threshold. The port ingress traffic is increased by 25% of its current capacity..
-
In the next polling interval, the recovery-interval expires without detecting a rising threshold. The port ingress traffic is increased by 25% of its current capacity.
-
In the next polling interval, the recovery-interval expires without detecting a rising threshold. The port ingress traffic is increased by 25% of its current capacity.
-
In the next polling interval, an event rising threshold is detected on the port, and DIRL is initiated for the port. The port ingress traffic is reduced again to 50% of its current rate.
View a visualization of DIRL congestion management
Dynamic Ingress Rate Limiting (DIRL) analysis is an on-demand job executed on the selected fabric. It displays the DIRL status and events on all the switches in the fabric. The following commands are executed on the switches and the output is collected as a snapshot.
-
show fpm ingress-rate-limit status
-
show fpm ingress-rate-limit events
DIRL Visualization is supported on Cisco MDS Series switches with Release 9.2(1) and later.
To view the DIRL analysis on Nexus Dashboard:
-
Click the DIRL tab.
-
Click Start DIRL data collection to begin collection.
-
Click Cancel/Abort to stop the collection.
A status message appears to show that the collection is in progress. It also displays the time stamp at which the analysis began. After the Analysis is complete, information is populated in the table below. A status message appears to indicate that the collection is complete. It also displays the time stamp at which the analysis was completed.
An entry in the table below shows that following fields:
| Field | Description |
|---|---|
|
Switch |
Specifies the switch on which the analysis is collected. Click on the Switch to view a slide-in pane displaying the summary. Click on the launch icon to view Switch Overview. |
|
Interface |
Specifies the interface on which the analysis is collected.
|
|
Current rate limit (%) |
Specifies the % indicating the current rate limit. |
|
Previous action |
Specifies the previous action performed to control the rate limit. |
|
Last updated time |
Displays the time stamp at which the event occurred. |
Click DIRL Past Events to view the DIRL events for all the interfaces in this fabric, except the current DIRL interfaces. The table displays events from CLI command output show fpm ingress-rate-limit events.
Get the latest DIRL data
To get the latest DIRL date:
-
Click on the DIRL tab.
-
Click Get latest DIRL data.
You can see the latest DIRL data after the operations completes.
-
Click DIRL Events in the Interface column to view the rate-limit events for the selected interface on the switch.
The fields in the DIRL tab are described in the following table.
Field Description Fabric
Specifies the fabric to which the switch belongs.
Switch
Specifies the fabric for which the DIRL congestion is visualized.
Interface
Specifies the interface on which the events are visualized.
Last collection at
Specifies the date and time at which the DIRL status was collected.
Counter
Specifies if the counter is for txwait or tx-datarate or tx-datarate-burst.
Event
Specifies the event.
Counter Value %
Specifies the value of the counter.
Action
Specifies the action which triggered the event,
Operating port speed (Mbps)
Specifies the speed of the operating port.
Input rate (Mbps)
Specifies the input rate.
Output rate (Mbps)
Specifies the output rate.
Current rate limit (%)
Specifies the current rate limit.
Applied rate limit (%)
Specifies the applied rate limit.
Time
Specifies the time at event was triggered.
View and configure AAA servers
You can view or configure authentication, authorization, and accounting (AAA) servers, Lightweight Directory Access Protocol (LDAP), RADIUS, or TACACS+ servers, using the AAA tab.
-
Click the AAA tab.
If you do not see the AAA tab, click on the three dots (…) in the tab list and then choose AAA from the drop-down list.
The tabs and their fields on the page are explained in the following sections.
View information on AAA servers
AAA Servers
The AAA Servers tab displays any RADIUS, TACACS+, or LDAP server configured on Cisco MDS switches for the chosen fabric.
|
Field |
Description |
|
Switch Name |
Specifies the name of the switch. |
|
Switch IP |
Specifies the IP address of the switch. |
|
Server Groups |
Specifies the number for the AAA server group. |
|
ID |
Specifies the AAA server ID. |
|
Protocol |
Specifies the type of authentication protocol. Available options are:
|
|
IP Address Type |
Specifies the type of IP address. Available options are:
|
|
Name or IP Address |
Specifies the hostname or the IP address of the server. |
|
Auth Port |
Specifies the authentication port of the AAA server. Set the authentication port as 636 for secure LDAP. |
|
Account Port |
Specifies the port number of the account. |
|
Key Type |
Specifies the key type. Available options include:
|
|
Time Out (s) |
Specifies the time-out value in seconds for the AAA server to attempt authentication requests before the AAA server times out. |
|
Retransmits |
Specifies the number of AAA server retransmission attempts. |
|
Idle Time (m) |
Specifies the allowed idle time in minutes before the AAA server times out. |
|
Test User |
Specifies the test username.
You can configure a username and password for periodic TACACS+ server status testing. You can use the default test username (test) and default password (test). |
|
Root DN |
Specifies the root distinguished name (DN). |
AAA Server Groups
The AAA Server Groups tab displays any RADIUS, TACACS+, or LDAP server groups configured on Cisco MDS switches for the chosen fabric. You can also view if an LDAP server group is attached to a search map.
The fields in the AAA Server Groups tab are described in the following table.
|
Field |
Description |
|
Switch Name |
Specifies the name of the switch. |
|
Switch IP |
Specifies the IP address of the switch. |
|
ID |
Specifies ID of the switch. |
|
Name |
Specifies the name of the server group. |
|
Protocol & Search Map |
Specifies the authentication protocol. If the switch is enabled for LDAP, you can configure a search map. For more information, see Create a search map. |
|
Server ID List |
Specifies the list of server IP addresses assigned to the server group. |
|
Dead Time (m) |
Specifies the LDAP server dead-time interval in minutes. The dead-time interval specifies the time that the Cisco MDS server waits, after declaring that an LDAP server is dead, before sending out a test packet to determine if the server is now alive. |
Search Maps
The Search Maps tab allows you to attach an LDAP server group to a search map. A search map provides the workflow for managing your LDAP server groups and Cisco MDS switches.
The fields in the Search Maps tab are described in the following table.
|
Field |
Description |
|
Switch Name |
Specifies the name of the LDAP-enabled Cisco MDS switch. |
|
Name |
Specifies the name of the search map. |
|
Type |
Specifies the type of search map. Available options are:
|
|
Base DN |
Specifies the base distinguished name (DN) for the search map. For example, you can enter dc=ldapuser,dc=local as the base DN. |
|
Filter |
Specifies the filter for the search map. For example, you can enter a filter such as cn=$userid@ldapuser@ldapuser.local. |
|
Attribute |
Specifies the attribute for the search map. For example, you can enter description as an attribute. |
|
Mode |
Specifies the mode for the switch.
The Mode parameter is configured by the switch. |
Applications
The fields in the Applications tab are described in the following table.
|
Field |
Description |
|
Switch Name |
Specifies the name of the switch. |
|
Switch IP |
Specifies the IP address of the switch. |
|
Type, SubType, Function |
Specifies the type, subtype, and function of the LDAP application. |
|
Server Group List |
Specifies the list of server groups. |
|
Server Group Local |
Specifies the local server group. |
|
Server Group Trivial |
Specifies the server group trivial. |
Protocol Defaults
The Protocol Defaults tab displays a default entry for each AAA protocol if enabled from each Cisco MDS switch in the fabric. Cisco MDS switches create the protocol defaults.
The fields in the Protocol Defaults tab are described in the following table.
|
Field |
Description |
|
Switch Name |
Specifies the name of the switch. |
|
Switch IP |
Specifies the IP address of the switch. |
|
Protocol |
Specifies the protocol for the switch. |
|
Authentication Type |
Specifies the type of authentication. |
|
Key |
Specifies the authentication key. |
|
Time Out (s) |
Specifies the time outs in seconds. |
|
Retransmits |
Specifies the number of retransmission attempts. |
|
Directed Req |
Specifies the directed requisition requests. Directed Req is a toggle parameter that allows you to send only the user name to a specified server. |
|
Idle Time (m) |
Specifies the idle time before the server times out in minutes. |
Authentication Type
The fields in the Authentication Type tab are described in the following table.
|
Field |
Description |
|
Switch Name |
Specifies the name of the switch. |
|
Switch IP |
Specifies the IP address of the switch. |
|
Auth Type MSCHAP |
Provides a toggle option for indicating the authentication type of Microsoft Challenge Handshake Authentication Protocol (MSCHAP). |
|
Auth Type MSCHAP2 |
Provides a toggle option for indicating the authentication type of MSCHAP2. |
Configure an AAA server, a server group, a search map, and an authentication type
You can configure an LDAP, RADIUS, or TACACS+ server as an AAA server. You can then add a server group for failover in case a remote AAA server fails to respond. A server group is a set of remote AAA servers implementing the same AAA protocols. The purpose of a server group is to provide for failover servers in case a remote AAA server fails to respond. If the Cisco MDS switch encounters errors from the servers in the first group, it tries the servers in the next server group.
You can create a search map for attaching an LDAP server group. The search map provides a workflow for managing your LDAP server groups and Cisco MDS switches. You can attach a single LDAP-enabled switch or multiple LDAP-enabled switches to a search map. For more information, see Create a search map and Create an AAA server group.
For more information, see the following sections:
Create an AAA server
Nexus Dashboard creates the specified AAA server for the chosen Cisco MDS switch or switches based on the chosen protocol. Nexus Dashboard chooses the proper index based on the existing index allocation for each chosen Cisco MDS switch.
You can assign the same AAA server to multiple switches at one time.
-
Click the AAA tab.
If you do not see the AAA tab, click on the three dots (…) in the list of tabs and then choose AAA from the drop-down list.
-
Click the AAA Servers subtab.
-
Choose Create Server from the Actions drop-down list.
The Create Server dialog appears.
-
Check the check box for the Cisco MDS switch for which you want to create an AAA server.
You can choose multiple Cisco MDS switches.
-
Click Select.
-
Choose a protocol from the Protocol drop-down list.
Available protocols are:
-
LDAP
-
RADIUS
-
TACACS+
-
-
Choose an IP Address Type.
Available options are:
-
IPv4
-
IPv6
-
DNS
For an LDAP, RADIUS, or a TACACS+ server, choose IPv4.
-
-
Choose a key type.
Options are:
-
Plain
-
Encrypted
-
Not Configured
-
-
Click Ok to enter your changes or Close to cancel your changes.
Create an AAA server group
-
Click the AAA tab.
If you do not see the AAA tab, click on the three dots (…) in the list of tabs and then choose AAA from the drop-down list.
-
Click the AAA Server Groups subtab.
-
Choose Create Server Group from the drop-down list.
-
Click LDAP, RADIUS, or TACACS+ as the protocol depending on what type of server group you want to create.
-
Choose a switch from the list of switches.
-
Choose a server group name from the Server Group Name drop-down list.
-
Choose a server name from the Server ID List drop-down list.
-
Enter the idle time in the Idle Time field.
-
Click Ok to enter your changes or Close to cancel your changes.
You can assign one server group to multiple switches at one time provided that the switches contain the same servers that are being used in the AAA server group. You can use servers that overlap.
Create a search map
You can create a search map for attaching an LDAP server group. A search map helps you manage your LDAP server groups and Cisco MDS switches.
You have to create a search map before you create an LDAP server group.
You can attach a single LDAP-enabled switch or multiple LDAP-enabled switches to a search map.
Before You Begin
Navigate to the Switch Overview > Summary > Switch Information area > Enabled Features link and confirm that LDAP is enabled for the switch.
Workflow
-
Create a search map.
-
Create an AAA server group using the LDAP protocol. For more information, see Create an AAA server group.
Limitations of Search Maps
-
You must create a search map before you create an LDAP server group.
-
You cannot edit a search map.
Create a Search Map
-
Click the AAA tab.
If you do not see the AAA tab, click on the three dots (…) in the list of tabs and then choose AAA from the drop-down list.
-
Click the Search Maps subtab.
If you do not see the AAA tab, click on the three dots (…) in the list of tabs and then choose AAA from the drop-down list.
-
Choose Create Search Map from the Actions drop-down list.
The Create Search Maps dialog box appears.
-
Choose a Cisco MDS switch that is enabled for LDAP from the Switch drop-down list.
-
Choose the appropriate map type from the Map Type drop-down list.
-
Enter a name for the search map in the Map Name field.
-
Enter the base distinguished name (DN) for the LDAP server in the Base DN field. For example, you can enter dc=ldapuser,dc=local as the base DN.
-
Enter a filter for the search map in the Filter field. For example, you can enter cn=$userid@ldapuser@ldapuser.local as a search map filter.
-
Enter an attribute for the search map in the Attribute field. For example, you can enter description as an attribute.
-
Click Submit to submit your changes and create the search map.
Create an AAA Server Group for the Search Map
-
Click the AAA tab.
If you do not see the AAA tab, click on the three dots (…) in the list of tabs and then choose AAA from the drop-down list.
-
Click the AAA Server Groups subtab.
-
Choose Create Server Group from the drop-down list.
-
Choose LDAP as the protocol for creating an LDAP server group.
-
Choose an LDAP switch from the list of switches.
-
Choose a server group name from the Server Group Name drop-down list.
-
Choose a server name from the Server ID List drop-down list.
-
Enter the idle time in the Idle Time field.
-
Click Ok to enter your changes or Close to cancel your changes.
You can create multiple server groups at one time.
You can navigate to the AAA Server Groups > Protocol & Search Map column to see if your LDAP-enabled switch is attached to a search map.
Configure an authentication type
Cisco MDS switches allow user logins to perform remote authentication using different versions of the Microsoft Challenge Handshake Authentication Protocol (MSCHAP). You use MSCHAP for authentication on a RADIUS or a TACACS+ server, while you use MSCHPAv2 for authentication on a RADIUS server.
-
Click the AAA tab.
If you do not see the AAA tab, click on the three dots (…) in the list of tabs and then choose AAA from the drop-down list.
-
Click the Protocol Defaults subtab.
-
Click on the pencil icon.
You can edit the following fields:
-
Select Encryption Type
-
Key
-
Timeout
-
Retransmits
-
Directed Req
-
Idle Time (m)
-
-
Click the checkmark icon to save your edits, or click the X to cancel your edits.
Edit a server group list, edit a server group list, server group local, or trivial for an AAA server
-
Click the AAA tab.
If you do not see the AAA tab, click on the three dots (…) in the list of tabs and then choose AAA from the drop-down list.
-
Click the Applications subtab.
-
Click on the pencil icon.
-
Edit the Server Group List, Server Group Local, or Server Group Trivial fields.
-
Click the checkmark icon to save your edits, or click the X to cancel your edits.
Delete an AAA server
-
Click the AAA tab.
If you do not see the AAA tab, click on the three dots (…) in the list of tabs and then choose AAA from the drop-down list.
-
Click the AAA Servers subtab.
-
Choose a Cisco MDS switch to delete.
-
Choose Delete Servers from the Actions drop-down list.
You can choose multiple servers to delete at one time.
Delete an AAA server group
-
Click the AAA tab.
If you do not see the AAA tab, click on the three dots (…) in the list of tabs and then choose AAA from the drop-down list.
-
Click the AAA Server Groups subtab.
-
choose Delete Servers from the Actions drop-down list.
You can delete multiple server groups at one time.
Delete a search map
-
Click the AAA tab.
If you do not see the AAA tab, click on the three dots (…) in the list of tabs and then choose AAA from the drop-down list.
-
Click the Search Maps subtab.
-
Choose the search map that you want to delete.
-
Choose Delete Search Maps from the Actions drop-down list.
The search map is deleted.