
New and changed information
The following table provides an overview of the significant changes up to this current release. The table does not provide an exhaustive list of all changes or of the new features up to this release.
| Release Version | Feature | Description |
|---|---|---|
|
Nexus Dashboard 4.1.1 |
Improved navigation and workflow when configuring inventory for Nexus Dashboard SAN fabrics |
Beginning with Nexus Dashboard 4.1.1, the navigation and workflow when configuring inventory for Nexus Dashboard SAN fabrics have been enhanced. |
Navigate to Inventory for SAN fabrics
To navigate to Inventory for SAN fabrics:
-
Click Manage > Inventory.
-
Click the appropriate tab to navigate to any of these areas in Inventory:
Switches
-
Navigate to Inventory:
Manage > Inventory
-
Click Switches.
-
Click the Settings icon on the right corner of the Switches table to change the number of columns that you would like to display for information on Switches.
-
Use the Filter by attributes search bar to filter the Switch information display based on the selected attribute values.
The following table describes the fields that appear for Switches.
Field Description Switch Name
Specifies the name of the switch.
IP Address
Specifies the IP address of the switch.
Fabric Name
Specifies the associated fabric name for the switch.
Status
Specifies the status of the switch.
Health
Specifies the health status of the switch. The following are the potential values:
-
Healthy
-
Critical
-
Warning
-
OK
Ports
Specifies the total number of ports on the switch.
Used Ports
Specifies the total number of used ports on the switch.
NPV Enabled
Specifies the switch is enabled for N-Port Virtualization (NPV). A "Yes" value indicates the switch is enabled for NPV and "No" value indicates this switch is not enable for NPV.
Optics Power Control Capable
Specifies if the Optics Power Control feature is support for a switch. Support status is indicated with a "Yes" or "No" value.
Model
Specifies the switch model.
Serial Number
Specifies the serial number of the switch.
Release
Specifies the release number of the switch.
Up Time
Specifies the switch up time details.
The following table describes the action items in the Actions menu drop-down list.
Action Item
Description
Device Manager
You can log in to the Device Manager for the required switch. The Device Manager login window appears, enter credentials, and log in.
See Device Manager to view descriptions and instructions for using the Cisco MDS 9000 Device Manager.
Tech Support
Allows you to initiate log collection. For more information, see Tech Support.
Execute CLI
Allows you to run multiple CLI commands on multiple switches and collect output as a zipped text file for each switch. For more information, see Execute CLI.
Purge Down Switch
Allows you to purge a switch infomation from the system. For more information, see Purge Down Switch.
Download Device Manager
Allows you to download the Device Manager files. For more information, see Download Device Manager.
Migrate Brocade Parameters
Allows you to run migrage Brocade parameters. For more information, see Migrate Brocade Parameters.
Optics Power Control
Allows you to manage power consumption on Optics Power Control capable switches from the Nexus Dashboard. For more information, see Managing optics power on switches.
-
-
SAN analytics support on new switch models
The Nexus Dashboard supports SAN analytics on the following 96 port 64G fabric switch models:
|
Model Name |
Switch OS Version |
|
case DS_C9396VK9 |
9.4(1) |
|
case DS_C9396VK9_IBM_244 |
9.4(1) |
|
case DS_C9396VK9_IBM_254 |
9.4(1) |
You can view the switch models and supported OS versions on the Nexus Dashboard Fabric Overview page.
-
Navigate to Manage > Fabrics.
-
Double-click the SAN fabric to view the switch information on the Fabric Overview page.
-
Choose the Switches tab to view the switch model name and release number listed under the Model and Release columns.
After you confirm the switch model names and release versions, you can configure SAN insights for this switch. See Configuring SAN Insights for more information.
Navigate to Switch Overview for SAN fabrics
To navigate to the Switch Overview window for SAN fabrics:
-
Navigate to the Switches window using either of the following paths:
-
To see switch overview information for all of the switches in a specific fabric, click Manage > Fabrics, double-click on a SAN fabric, then click the Switches tab , or
-
To see switch overview information for all of the switches in all SAN fabrics in the Nexus Dashboard, click Manage > Inventory, then click the Switches tab.
Any switches in the SAN fabrics that have already been configured is displayed.
-
-
Double-click on the appropriate switch.
The Switch Overview window for that switch is displayed, with the Summary tab selected by default.
The Switch Overview window contains tabs that allows you view and perform certain operations on the fabric:
View summary information
To navigate to the Summary window:
-
Click the Summary tab.
The following areas appear in the Switch Overview > Summary window:
Area Description Switch Information
Displays the details of the switch such as the name, health status, IP address, fabric, model, including version information, and other switch details.
Event Analytics
Displays events with a Critical, a Major, a Minor, or a Warning severity.
In this area, click an event to navigate to the Switch Overview > Event Analytics tab to view the alarms for the event.
Resources
Displays the resource utilization of the switch in graphical form.
Modules
Displays the switches on which the modules are discovered, the status of the modules, and the module count.
Interfaces
Displays the operational and administrative status of the switches.
Port Usage
Displays the available and in-use port summary information.
View module information
To view the inventory information for modules in SAN fabrics:
-
Click the Modules tab.
The Modules tab displays a list of all the switches and its details for a selected scope.
Field
Description
Module Name
Displays the module name.
Model
Displays the model name.
Serial Number
Displays the serial number.
Type
Displays the type of the module.
Oper. Status
Displays the operation status of the module.
Slot
Displays the slot number.
HW Revision
Displays the hardware version of the module.
Software Revision
Displays the software version of the module.
Asset ID
Displays the asset id of the module.
View and configure interfaces on switches
To view information on interfaces in SAN fabrics:
-
Click the Interfaces tab.
The following table describes the fields that appear on the Interfaces tab.
Field
Description
Switch Name
Specifies the name of the switch the interface belongs to.
Interface Name
Specifies the name of the interface.
The Show 24hr chart icon to the left of the interface name opens the Interface Details and Performance Chart dialog box for the selected interface. It displays details about the interface and a performance chart that depicts the traffic details through the interface. This chart is available only for interfaces that are connected to another interface.
Admin. Status
Specifies the administration status of the interface.
Oper. Status
Specifies the operational status of the interface.
Reason
Specifies the reason for failure.
Admin. Speed
Specifies the configured speed of the interface in Gbs.
Oper. Speed
Specifies the current operational speed of the interface in Gbs.
Mode
Specifies the mode of the interface.
VSAN
Specifies the name of the connected VSAN.
Connected To
Specifies the connection details.
Connected To Type
Specifies the type of connection.
Description
Specifies the description that you have added about the interface.
Owner
Specifies the name of the port owner.
Port Group
Specifies the port group number to which the interface belongs to.
You can also filter the performance data that is shown using the following options:
-
Real time: Gathers performance data every 10 seconds
-
Custom: Gathers performance data based on the calendar begin and end dates that you select
You can make these configurations for switch interfaces in a SAN fabric:
Perform a No Shutdown for an interface
-
Check the check box for the required interface and choose No Shutdown from the Actions drop-down list.
-
Click Confirm in the warning dialog box that appears.
Perform a Shutdown for an interface
-
Check the check box for the required interface and choose Shutdown from the Actions drop-down list.
-
Click Confirm in the warning dialog box that appears.
Assign a port owner for an interface
-
Check the check box for the required interface and choose Owner from the Actions drop-down list.
You can select multiple interfaces while assigning the port owner, if required.
-
Enter the required name in the Set Port Owner dialog box.
-
Click Apply.
Add a description for an interface
-
Check the check box for the required interface and choose Description from the Actions drop-down list.

You can add a description for multiple interfaces, simultaneously.
-
Enter the description in the Set Port Description dialog box.
-
Click Apply.
Set up diagnostics for an interface
-
Check the check box for the required interface.
-
Choose Link Diagnostics from the Actions drop-down list.
SAN deployments do not follow security domain mapping; you can access all SAN fabrics according to your assigned privilege level.
Edit port VSAN membership
-
Check the check box for the required interface.
-
Choose Edit Port VSAN Membership from the Actions drop-down list.
The Edit Port Vsan Membership dialog box appears.
You can select multiple interfaces for editing VSAN port membership if the interfaces are in the same VSAN.
-
Choose the Trunk, No Trunk, or Auto option for New Admin Trunk Mode and populate the New Trunking VSAN Allowed List with a comma-separated or a dash-separated list of the allowed VSANs.
The following table describes the fields that appear on the Edit Port Vsan Membership dialog box.
Field
Description
Switch
Specifies the name of the switch the interface belongs to.
Interface
Specifies the name of the interface.
Status
Specifies the operational status of the interface.
VSAN
Specifies the configured VSAN ID.
Admin Mode
Specifies the administrative mode of the interface.
Oper Mode
Specifies the operational mode of the interface.
-
Choose the new port number for the VSAN.
-
Click Apply.
You should receive a success message.
-
Choose the same interface and verify that the new port number is assigned to the VSAN.
Edit port trunking VSAN membership
-
Check the check box for the required interface and choose Edit Port VSAN Membership from the Actions drop-down list.
The Edit Port Trunking Mode and Vsan Allowed List dialog box appears.
You can select multiple interfaces for editing VSAN membership with port trunking if the interfaces have the same Port Trunking Allowed VSAN list.
-
Choose the Trunk, No Trunk, or Auto option for New Admin Trunk Mode and populate the New Trunking VSAN Allowed List with a comma-separated or a dash-separated list of the allowed VSANs.
The following table describes the fields that appear on the Edit Port Trunking Mode and Vsan Allowed List dialog box.
Field
Description
Switch
Specifies the name of the switch the interface belongs to.
Interface
Specifies the name of the interface.
Status
Specifies the operational status of the interface.
Oper Mode
Specifies the operational mode of the interface.
oper Trunk
Specifies the operational trunk mode.
admin Trunk
Specifies the administrative trunk mode.
Up VSAN List
Specifies the list of the VSANs where the interface is up.
Allowed Vsan List
Specifies the list of the VSANs where the interface is configured.
-
Click Apply.
You should receive a success message.
-
Choose the same interface and verify that the Allowed VSAN List is updated with the allowed VSANs.
Clear FICON RNID Old value
-
Filter for the value of old in the Connected To column.
-
Check the check box for the switch or switches that display old in the Connected To column.
-
Choose Clear FICON RNID Old Value from the Actions drop-down list.
-
Click OK in the confirmation dialog box.
Nexus Dashboard displays a success message indicating that the FICON (fiber connectivity) Request Node Identifier (RNID) status changed from old to invalid. The switch clears out the old RNID information, and Nexus Dashboard fetches the updated RNID information in the next discovery cycle.
-
Refresh the page to verify that the Connected To column no longer displays the value of old.
View switch licenses
You can view the following information on the Licenses tab.
| Field | Description |
|---|---|
|
Feature |
Displays the feature names of the selected switch. |
|
Status |
Displays the status of licenses. Status will be either In Use or Unused. |
|
Type |
Displays the type of the licenses. |
|
Warnings |
Displays the grace period of licenses and its expiry date. |
You can use Filter by attribute to view required information.
Click Refresh icon to refresh the table.
View and configure event analytics
The information shown in the Event Analytics tab is described in greater detail in these areas:
-
Alarms: See the "Alarms" section in Event Analytics for SAN Fabrics
-
Events: See the "Events" section in Event Analytics for SAN Fabrics
-
Accounting: See the "Accounting" section in Event Analytics for SAN Fabrics
Back up and restore switch configurations
This table describes the columns that appears on the Backup tab.
| Fields | Descriptions |
|---|---|
|
Switch |
Specifies the name of switch. |
|
Backup Date |
Specifies the backup date. |
|
Backup Tag |
Specifies the backup name. |
|
Backup Type |
Specifies the backup type, whether it is a golden backup. |
|
Configuration Files |
Specifies the configuration files details. |
The following table describes the fields and descriptions that appears on Action tab.
| Actions | Descriptions |
|---|---|
|
Copy to bootflash |
Choose Copy to bootflash. A confirmation window appears, click OK. For more information on bootflash, see Copy to bootflash. |
|
Compare |
Choose required switch names to compare configuration of switches, choose Compare. You can select only two switches at an instance. Compare Config window appears, displaying the difference between the two configuration files. The Source and Target configuration files content is displayed in two columns. The differences in the configuration file are show in the table, with legends.
|
|
Export |
Click Export. The files are downloaded in your local system. You can use the third-party file transfer tools to transfer these files to an external server. |
|
Edit tag |
Click Edit tag to change the backup tag name. |
|
Mark as golden |
To mark existing backup as golden backup, choose Mark as golden, a confirmation window appears, click Confirm. |
|
Remove as golden |
To remove existing backup from golden backup, choose Remove as golden, a confirmation window appears, click Confirm. |
|
Delete |
To delete existing backups, choose Delete a confirmation window appears, click Confirm.
If you have marked backup as golden backup. make sure that the golden backup is removed, else error appears you can’t delete existing backup. |
Copy to bootflash
To copy a backup to bootflash:
-
Click the Backup tab.
-
Click the checkbox next to the backup that you want to copy to bootflash.
-
Click Actions> Copy to bootflash.
After several moments, a Success window appears.
-
Click Ok.
Compare configuration files
This feature allows you to compare two different configuration files.
To compare configuration files:
-
Click the Backup tab.
-
Click the check boxes next to two different configuration files to select those files to compare.
The first file that you select is designated as the Source file and the second configuration file is designated as the Target file.
-
Click Actions > Compare.
The View Config Diff page appears, displaying the difference between the two configuration files.
The content in the Source and Target configuration files is displayed in two columns. From the drop-down list in the right-top corner, choose All to view the entire configuration. You can also choose Changed to view the configuration differences of the configuration files.
The differences in the configuration file are shown in the table, with these legends:
-
Red: Diff configuration details.
-
Green: New added configuration.
-
Blue: Modified configuration details.
-
-
Click Copy to Target to copy the source configuration to the target configuration file, or click Cancel to revert to the configuration details page.
The Copy Configuration window displays the source configuration preview and the target device of the destination configuration. The selected devices area shows the following fields:
-
Device Name: Specifies the target device name to which the source configuration is copied.
-
IP Address: Specifies the IP Address of the destination device.
-
Group: Specifies the group to which the device belongs.
-
Golden Config: Specifies the version of the destination configuration.
-
Status: Specifies the status of the device.
-
-
Click Yes to copy the configuration to the destination device configuration.
Export a configuration file
You can export a configuration file from Nexus Dashboard. Perform the following task to export a configuration file.
-
Click the Backup tab.
-
Select a configuration to export.
-
Click Export.
The files are downloaded in your local system. You can use the third-party file transfer tools to transfer these files to an external server.
View port usage information
To view port usage information:
-
Click the Port Usage tab.
You can view the following information on the Port Usage tab.
-
Port Speed column displays the speed of the port.
-
Used Ports column displays the total ports with the mentioned port speed.
-
Available Ports column displays the available ports for the port speed.
-
Total Ports column displays the total ports with the mentioned speed.
-
Estimated Day Left column displays the estimated days left for the ports.
-
You can use Filter by attribute to view required information.
Click Refresh icon to refresh the table.
Used ports displays the total used ports for the selected switch. Total ports displays the total available ports for the selected switch.
View bootflash information
-
Click the Bootflash tab to view the following areas:
-
Primary Bootflash Summary area displays the total, used, and available space.
-
Secondary Bootflash Summary area displays the total, used, and available space.
-
Directory Listing area displays a check box for the Primary Bootflash and Secondary Bootflash.
This area shows the filename, the size, the last modified date, and the size in bytes for all of the files and directories on the switch bootflash.
-
-
Choose the Delete files option from the Actions drop-down list to delete files to increase the available space on the switch.
View CPU, memory, traffic, temperature, and power metrics
To view CPU and memory utilization, traffic, temperature, and power utilization for your fabric and the connected switches:
-
Click the Metrics tab.
If you do not see the Metrics tab, click on the three dots (. . .) to access the Metrics tab.
The tabs and their fields on the page are explained in the following sections.
CPU and Memory
The following table describes the columns that appear on the CPU and the Memory tabs.
|
Field |
Description |
|
Switch Name |
Specifies the name of the switch. Click the name of a switch to access a Switch slide-in pane with the switch details. Click on the graph icon to view the CPU or memory performance chart. |
|
IP Address |
Specifies the switch IP address. |
|
Low Value (%) |
Specifies the lowest CPU utilization value on the switch. |
|
Avg. Value (%) |
Specifies the average CPU utilization value on the switch. |
|
High Value (%) |
Specifies the high CPU utilization value on the switch. |
|
Low to High Value Range (Preview) |
Specifies the linear range preview. |
Click the drop-down list to view CPU or memory data for the selected Day, Week, Month, or Year.
The label for the drop-down list changes based on your selection. For example, if you clicked Day, the label changes to Show last day.
Temperature
The following table describes the columns that appear on the Temperature tab.
|
Field |
Description |
|
Switch Name |
Specifies the name of switch. Click the name of a switch to access a Switch slide-in pane with the switch details. Click the graph icon to view the temperature chart. |
|
IP Address |
Specifies the switch IP address. |
|
Temperature Module |
Specifies the module of temperature. |
|
Low Value (°C) |
Specifies the lowest temperature value in degrees. |
|
Avg. Value (°C) |
Specifies the average temperature value in degrees. |
|
High Value (°C) |
Specifies the high temperature value in degrees. |
Click the drop-down list to view temperature data for the selected Hour, Day, Week, or Month.
The label for the drop-down list changes based on your selection. For example, if you clicked Day, the label changes to Show last day.
Power
The following table describes the columns that appear on the Power tab.
|
Field |
Description |
|
Switch Name |
Specifies the name of the switch. Click the name of a switch to access a Switch slide-in pane with the switch details. |
|
IP Address |
Specifies the switch IP address. |
|
Power Module |
Specifies the power module. Click the graph icon to view the power usage chart. |
|
Power Usage (%) |
Specifies the power usage as a percentage with subcategories based on the selected switch. |
|
Avg |
Specifies the average power usage. |
|
Min |
Specifies the minimum power usage. |
|
Max |
Specifies the maximum power usage. |
|
Capacity (AMPs) |
Specifies the capacity in (amps) amperes. |
|
Draw (AMPs) |
Specifies the power usage draw with subcategories based on the selected switch. |
|
Avg |
Specifies the average power usage draw. |
|
Min |
Specifies the minimum power usage draw. |
|
Max |
Specifies the maximum power usage based. |
|
Capacity (WATTs) |
Specifies the power capacity in watts. |
|
Draw (WATTs) |
Specifies the power usage draw in watts with subcategories based on the selected switch. |
|
Avg |
Specifies the average power usage draw in watts. |
|
Min |
Specifies the minimum power usage draw in watts. |
|
Max |
Specifies the maximum power usage draw in watts. |
|
Power Module |
Click on the graph icon under the Power Module column to filter the power usage based on the chosen data type. Options include:
Click on Day, Week, or Month to filter the data based on time increments. If you click on the Day increment, the graph displays one line for the selected data type. If you click on the Week or Month option, the graph displays the average, minimum, or maximum power usage values depending on the chosen data type. |
Click the drop-down list to view power data for the selected Hour, Day, Week, or Month.
The label for the drop-down list changes based on your selection. For example, if you clicked Hour, the label changes to Show last hour.
View switch limit information
View and monitor the zone, Fibre Channel Name Server (FCNS), and Fabric login (Flogi) limitations in the Switch Limit.
Follow these steps to view switch limits.
-
Click Switch Limits.
The following metrics with the maximum limit are displayed.
Metric
Max Limit
Current Value
Global Zones
16000
Global Zone Unique Members
32000
Global Zonesets
1000
Global Zone Database Size (Bytes)
4000000
Global Zone EEM Limit
16000
Global Zone Unique Member EEM Limit
32000
Global Zoneset EEM Limit
1000
Global Zone Database Size EEM Limit(Bytes)
4000000
Switch Flogi
8000
Module Flogi
2000
Interface Flogi
256
Use the Rows per page drop down at the bottom of the Switch Limits table to choose the number of rows you want to display in the Switch Limits table. The row count range is 5-100 rows.
You can also click the Show Raw CLI Output to view the switch limit data in a CLI format.
-
show zone internal global-info | inc Limit: This command is used to display the zone global information, with only the limitations information included in the output.
-
show flogi internal info | inc EEM: This command is used to display details about FLOGI scale optimization, with only the Embedded Event Manager (EEM) information included in the output.
-
show fcns internal debug-info | inc EEM: This command is used to display the name server database and statistical information for a specified VSAN or for all VSANs, with only the EEM information included in the output.
-
show flogi database vsan 1-4093 | include "Total number of flogi" This command is used to display flogi based on the vsan.
View Device Manager information
See Device Manager for descriptions and instructions for using the Cisco MDS 9000 Device Manager.
A Device Manager session is terminated when you navigate to another tab on the Switch Overview screen.
Monitor zone/FCNS/FLOGI limitations
Support is available to monitor zone, Fibre Channel Name Server (FCNS), and Fabric login (FLOGI) limitations.
To monitor the zone, Fibre Channel Name Server (FCNS), and Fabric login (FLOGI) limitations:
-
Click the Max. Values tab in the Switch Overview page.
-
View the zone, FCNS, and FLOGI limitations information in the Max. Values page.
The Max. Values page shows the output from these CLI commands:
-
show zone internal global-info | inc Limit: This command is used to display the zone global information, with only the limitations information included in the output.
-
show flogi internal info | inc EEM: This command is used to display details about FLOGI scale optimization, with only the Embedded Event Manager (EEM) information included in the output.
-
show fcns internal debug-info | inc EEM: This command is used to to display the name server database and statistical information for a specified VSAN or for all VSANs, with only the EEM information included in the output.
-
View blades information
You can view the interfaces of the UCS switches in the Switch Overview window.
Ensure that the UCS switches are listed on Nexus Dashboard and the status of these switches are correct. You can view these tabs only for UCS switches.
Blades tab displays information of all server blades attached to the UCS FI.
The UCS has three tabs:
-
Blades
-
vNICs
-
vHBAs
The blades tab displays all blade information as cards. Click More Details icon on each blade area to view details on the side panel of the selected blade.
You can click the Collapse All or Expand All icon to collapse all or expand all blade areas respectively.
Blades tab displays information of all server blades attached to the UCS FI. Primary UCS FI only in redundancy setup or standalone UCS FI are displayed.
vNICs
vNICs tab displays the list of vNIC for that UCS FI. Click the chart icon to show the 24 hour traffic for the vNIC.
vHBAs
vHBAs tab displays the list of vHBA for that particular UCS FI. Click the chart icon to view 24 hour traffic for the vHBA.
Provisioning return material authorization (RMA) manually
This section describes the process of replacing a faulty switch. It also discusses the process to remove a switch if it is no longer needed.
Replace a switch
You can manually replace a switch that is still operational with a new switch.
Follow these steps to replace a switch.
-
Discover your fabric.
-
Secure a backup of the switch that you wish to replace.
-
Bring down the management connectivity of the switch.
When you bring down the management connectivity of the switch, it becomes unreachable.
-
Bring up a new switch of the same model and the same port connectivity.
-
Restore the backup taken in Step 2.
-
Wait a few minutes for rediscovery. The new switch will be discovered as a replacement switch with a new serial number and switch World Wide Name (WWN).
Replace an operationally down switch
You can manually replace a switch that is not operational with a new switch.
Follow these steps to replace an operationally down switch.
-
Discover the fabric
-
Bring up a new switch to replace the operationally down switch.
Ensure the new switch model and version match the model and version of the switch you want to replace.
-
Make sure the connectivity of ports is replicated and configured to match the configuration of the switch you are replacing.
-
Configure the 'IP address/mask/gw' to match the configuration on the switch you are replacing.
-
Bring up the Management (mgmt) interface.
-
Wait a few minutes for rediscovery. The new switch will be discovered as a replacement switch with a new serial number and switch WWN.
Device Manager
The Device Manager provides a graphical representation of the installed switching modules, the supervisor modules, the status of each port within each module, the power supplies, and the fan assemblies.
In addition to the Device Manager service available on the Switches dashboard, you can download and install a standalone Device Manager application on your local system. For more information, see Download Device Manager.
Download Device Manager
Before you begin
The client computer is installed with a Windows or a Linux operating system.
This section describes the steps to download the Device Manager to your local system.
You can install a standalone device manager by choosing Device Manager from the Actions drop-down list.
-
Navigate to Switches.
Manage > Inventory > Switches
-
Check the checkbox for the selected switch.
-
From the Actions drop-down list, choose Download Device Manager.
This will download the device manager client file in tar.gz format to your system.
You can then extract the archive file to view its contents.
-
Depending on the operating system installed, run the script or the batch file to install the Device Manager application on your system.
-
On a Linux system, the script file (*.sh) file resides in the /bin directory.
-
On a Windows system, the script file (*.bat) file resides in the /bin directory.
The Device Manager login dialog box appears.
-
-
Log on to the Device Manager application.
Nexus Dashboard downloads the Device Manager as a standalone application on your local system.
See Device Manager to view descriptions and instructions for using the Cisco MDS 9000 Device Manager.
Tech Support
From the Actions drop-down list, select Tech Support to initiate log collection. A window appears.
-
Enter time in Session timeout field in minutes, by default time is 20 minutes.
-
Enter the command in Command text field and click Run.
-
A confirmation window appears stating 'Data submitted successfully, tech support starting', click Confirm and status changes to Completed.
-
You can download the report, click Download Tech Support.
Execute CLI
Nexus Dashboard allows you to execute CLI commands on switches. You can collect the output from the CLI commands in a zip file for each switch.
To execute CLI commands on switches, do the following:
-
On the Nexus Dashboard UI, choose Manage > Inventory > Switches.
-
Select the switches on which you want to execute the CLI commands.
You can select more than one switch to run the set of CLI commands simultaneously.
-
From the Actions drop-down list, choose Execute CLI .
The Execute Switch CLI screen is displayed.
-
On the Configure tab, click on the hyperlink under Selected Switches to view the selected switches on which the CLIs will be executed.
-
In the Session Timeout area, enter the length of time before the session timeout.
Valid options are 2-10 minutes. The default entry is 5 minutes.
-
Determine how you will provide the CLI commands to be executed on the switches.
-
Enter the CLI commands to be executed on the switches in the CLI Commands text box, or
-
Click on the Read Commands File button and upload a file with a .txt extension that has a list of CLI commands to be executed.
Ensure that you enter one command per line in the CLI Commands text box or in the .txt file.
-
-
Click Execute.
When the command execution is completed on all the switches, a popup window appears, showing the Execute CLI Output.
-
Click Close.
You are returned to the Execute Switch CLI window, where the table displays the switch, the associated fabric and the CLI execution status.
-
Click on Show Output to bring up the popup window again, showing the Execute CLI Output.
When an output is larger than a few MB, the show output is truncated. In that case, you must download the file to see the complete output. Show output is meant for light output to allow for faster debugging with little to display, and is not meant for offline debugging done with a downloaded file.
-
Click on Download output to download the command output as a zip file.
-
Click Done when you are finished with the procedures in this window.
-
If the switch is not reachable via CLI, then the output in the zip file will indicate an error.
Purge Down Switch
Nexus Dashboard allows you to remove switches from the inventory table using the Purge Down Switch option.
To purge a switch from the inventory table:
-
Navigate to Manage > Inventory > Switches.
-
Check the check box next to the switch you want to purge.
-
From the Actions drop-down list, choose Purge Down Switch.
The switch is purged.
Migrate Brocade Parameters
Nexus Dashboard allows you to migrate Brocade fabric switch configuration.
To migrate the configuration for a Brocade switch from the inventory table:
-
Navigate to Manage > Inventory > Switches.
-
Check the check box next to the switch for which you want to migrate the Brocade configuration.
-
From the Actions drop-down list, choose Migrate Brocade Parameters.
-
A confirmation page appears.
-
Managing optics power on switches
The Optics Power Control feature allows you to power off unused ports on Optics Power Control capable switches to reduce energy consumption. You can apply this feature on switches with Optics Power Control capability.
Manage optics power on a switch
Follow these steps to manage optics power on a switch:
-
Navigate to Manage >Inventory > Switches.
-
Check the checkbox for switch names for which you want to apply the optics power control configuration.
-
Navigate to the Optics Power Control Capable column in the switches table and verify if the selected switch has the optics power control capability.
Switches with Optics Power Control capability are indicated with a Yes.
-
Click the Actions drop down list and choose Optics Power Control .
The Optics Power Control dialog box appears with the following two options:
To power off the Optics Power Control setting: admin state has no affect. This function will power on all interfaces on the selected device(s).
Off
To turn on the Optics Power Control setting: the admin state must be set to down. This function will power off all interfaces set to admin state: down on the selected device(s)
On
-
Choose the Off or On option.
-
The Off option turns off the Optics Power Control setting on the switch, where the admin state has no effect on the power status. All interfaces on the chosen switches will remain powered on.
-
The On option turns on the Optics Power Control setting on the switch, where the admin state must be set to down for each interface. This option will power off all interfaces set to admin state down on the chosen switches.
The following F64 platform switch models are supported for the Optics Power Control feature:
DS-C9148V-K9, DS-C9124V-K9, DS-C9396V-K9, and the MDS 9700 family with DS-X97-SF4-K9 sup when with DS-X9748-3072K9
-
-
Click Ok.
Apply optics power control on a fabric
You can apply the optics power control configuration on switches in a specific fabric.
Follow these steps to apply the optics power control setting on a fabric:
-
Navigate to Manage > Fabrics. Double click on the required fabric.
The Fabric Overview page appears.
-
Choose a switch from the Switches tab.
-
Navigate to the Optics Power Control Capable column in the Switches tab on the fabric overview page and verify if the chosen switch has the optics power control capability.
Switches with optics power control capability are indicated with a Yes.
-
Check the checkbox for switch names for which you want to apply the optics power control configuration.
-
Click the Actions drop down list and choose Optics Power Control .
The Optics Power Control dialog box appears with the following two options:
To power off the Optics Power Control setting: admin state has no affect. This function will power on all interfaces on the selected device(s).
Off
To turn on the Optics Power Control setting: the admin state must be set to down. This function will power off all interfaces set to admin state: down on the selected device(s)
On
-
Choose the Off or On option.
-
The Off option turns off the Optics Power Control setting on the switch, where the admin state has no effect on the power status. All interfaces on the chosen switch will remain powered on.
-
The On option turns on the Optics Power Control setting on the switch, where the admin state must be set to down for each interface. This option will power off all interfaces set to admin state down on the chosen switches.
-
-
Click Ok.
Interfaces
This document provides information about SAN interfaces, such as FC ports, Ethernet ports, and port groups.
FC Ports
Choose Manage > Inventory > Interfaces > FC Ports to view information about FC ports.
Viewing Inventory Information for FC Ports
Choose Manage > Inventory > Interfaces > FC Ports > Inventory tab to display the list of Fibre Chanel interfaces.
The following table describes the fields that appear on Manage > Inventory > Interfaces > FC Ports > Inventory.
| Field | Description |
|---|---|
|
Status |
Specifies the status of the endport interface. |
|
Admin Status |
Specifies the administration status of an interface, depending on the action taken on an interface. Possible states:
|
|
Fabric |
Specifies the fabric name. Click the fabric name to display the fabric status on the right-side of the page. Click the Launch icon on the top-right side of the pane to see Fabric Overview. |
|
Switch |
Specifies the name of the switch hosting the fiber chanel interface. |
|
Interface |
Specifies the interface name. |
|
Enclosure |
Specifies the enclosure. |
|
Device Name |
Specifies the device name. |
|
VSAN |
Specifies the VSAN to which the interface belongs. |
|
Type |
Specifies the interface type. |
|
Port WWN |
Specifies the port world wide name (pWWN). |
|
Speed |
Specifies the interface speed. |
|
FCID |
Specifies the interface FCID. |
Viewing Performance Information for FC Ports
You can view the performance information for fibre channel ports by first navigating to the interfaces area for a switch using any of the following methods:
-
Manage > Inventory > Interfaces > FC Ports > Performance
-
Manage > Inventory > Switches, double-click on a switch to open the Overview page for that switch, then click the Interfaces tab
-
Manage > Inventory > Hosts, double-click on a host to open the Overview page for that host, then click the Interfaces tab
-
Manage > Inventory > Storage Devices, double-click on a storage device to open the Overview page for that storage device, then click the Interfaces tab
Then click the performance icon (upward arrow) next to the fibre channel interface where you want to view the performance information.
The following table describes the fields that appear in the Interface Details and Performance Chart page for a specific fibre channel interface.
| Field | Description |
|---|---|
|
Status |
Provides the status of this interface. |
|
Fabric |
Specifies the fabric name. Click the fabric name to display the fabric status on the right-side of the page. Click the Launch icon on the top-right side of the pane to see Fabric Overview. |
|
Name |
Specifies the interface name. Click the chart icon in the Name column to view a graph of the traffic on that device according to the selected timeline. You can filter the data using the Day, Week, Month, and Year options. |
|
VSAN |
Specifies the VSAN to which the interface belongs. |
|
Switch interface |
Specified the interface name. |
|
Speed |
Specifies the interface speed. |
|
Rx/Tx |
|
|
Avg |
Specifies the average receiving or transmitting speed. |
|
Avg % |
Specifies the average percentage of receiving or transmitting speed. |
|
Peak |
Specifies the peak utilization of the receiving or transmitting speed. |
|
Peak % |
Specifies the peak utilization percentage of the receiving or transmitting speed. |
|
Rx + Tx |
Specifies the sum of Rx and Tx speeds. |
|
Errors/Discards |
|
|
In Avg |
Specifies the average of incoming errors or discards. |
|
Out Avg |
Specifies the average of outgoing errors or discards. |
|
In Peak |
Specifies the peak of incoming errors or discards. |
|
Out Peak |
Specifies the peak of outgoing errors or discards. |
In the lower part of the page, you can filter the performance data that is shown by using the Day, Week, Month, and Year options.
You can also filter the performance data that is shown using the following options:
-
Real time: Gathers performance data every 10 seconds
-
Custom: Gathers performance data based on the calendar begin and end dates that you select
You can also filter for Host Ports and Storage Ports using Show Host Ports drop-down list.
To enable Performance, navigate to the Fabric window, choose the required fabric, and choose Actions > Configure Performance.
View multiple performance charts
You can view one or more performance charts for fibre channel port interfaces using the Show Charts tab.
Follow these steps to view multiple performance charts.
-
Choose Manage > Inventory > Interfaces > FC Ports > Performance tab to display the list of Ethernet interfaces.
-
Choose the interfaces to view the performance chart for each interface. You can choose up to 4 names listed under Name.
-
Choose the Show Charts tab to view the performance charts with details.
The Show Chart tab displays 4 charts at a time. If you choose more than 4 items, the Nexus Dashboard will not display any performance charts.
Viewing Transceiver Information for FC Ports
Choose Manage > Inventory > Interfaces > FC Ports > Transceiver tab to view the transceivers in Fibre Chanel interfaces.
The following table describes the fields that appear on Manage > Inventory > Interfaces > FC Ports > Transceiver.
| Field | Description |
|---|---|
|
Enclosure |
Specifies the enclosure name. |
|
Device Alias |
Displays the alias retrieved from the switch. A device aliases is a user-friendly name for a port WWN. Device alias name can be specified when configuring features. |
|
Fabric |
Specifies the fabric name. Click the fabric name to display the fabric status on the right-side of the page. Click the Launch icon on the top-right side of the pane to see Fabric Overview. |
|
Port WWN |
Specifies the port world wide name (pWWN). |
|
Fcid |
Specifies the associated interface FCID. |
|
Switch interface |
Specifies the interface name. |
|
Link Status |
Displays the operational status of the link. |
|
Vendor |
Specifies the name of the vendor. |
|
Serial Number |
Specifies the serial number of the enclosure. |
|
Model |
Specifies the name of the model. |
|
Firmware |
The version of the firmware that is executed by this HBA. |
|
Driver |
The version of the driver that is executed by this HBA. |
|
Additional Info |
The information list corresponding to this HBA. |
Viewing FC FICON Ports
-
Verify that the FICON feature has been enabled at the system level.
-
Navigate to Feature Management. Admin > System Settings > Feature Management
-
Check the box next to FICON to enable that feature at the system level, if it is not enabled already.
-
Click Apply.
-
-
Navigate to FICON.
Manage > Inventory > Interfaces > FC Ports > FICON
The FICON page displays a list of Fiber Channel FICON interfaces and relevant data.
-
To enable or disable an interface, choose Actions > Shutdown or No Shutdown.
The following table describes the fields that appear on the FICON page. Use the Show last day drop-down list to filter the view by Day, Week, Month, and Year.
Field Description Fabric
Specifies the fabric name.
Click the fabric name to display the fabric status on the right-side of the page. Click the Launch icon on the top-right side of the pane to see Fabric Overview.
Switch
Specifies the switch.
Interface
Specifies the switch interface.
Description
Specifies the interface description.
FCID
Specifies the associated interface FCID.
Mode
Specifies the interface mode.
FICON ID
Specifies the FICON ID.
Connected To
Specifies where the interface is connected to.
VSAN
Specifies the VSAN to which the interface belongs to.
Speed
Specifies the interface speed.
Rx/Tx
Avg
Specifies the average receiving or transmitting speed.
Avg %
Specifies the average percentage of receiving or transmitting speed.
Peak
Specifies the maximum utilization of the receiving or transmitting speed.
Peak %
Specifies the maximum utilization in percentage of the receiving or transmitting speed.
Rx + Tx
Specifies the sum of Rx and Tx speeds.
Errors/Discards
In Avg
Specifies the average of incoming errors or discards.
Out Avg
Specifies the average of outgoing errors or discards.
In Peak
Specifies the maximum number of incoming errors or discards.
Out Peak
Specifies the maximum number of outgoing errors or discards.
Viewing Performance Information for Ethernet Ports
Choose Manage > Inventory > Interfaces > Ethernet tab to display the list of Ethernet interfaces.
You can also filter the performance data that is shown using the following options:
-
Real time: Gathers performance data every 10 seconds
-
Custom: Gathers performance data based on the calendar begin and end dates that you select
The following table describes the fields that appear on Manage > Inventory > Interfaces > Ethernet. Use the Show last day menu drop-down list to filter the view by Day, Week, Month, and Year.
| Field | Description |
|---|---|
|
Fabric |
Specifies the fabric name. Click the fabric name to display the fabric status on the right-side of the page. Click the Launch icon on the top-right side of the pane to see Fabric Overview. |
|
Name |
Specifies the interface name. Click the chart icon in the Name column to view a graph of the traffic on that device according to the selected timeline. You can filter the data using the Day, Week, Month, and Year options. |
|
Description |
Specifies the interface description. |
|
Speed |
Specifies the interface speed. |
|
Rx/Tx |
|
|
Avg |
Specifies the average receiving or transmitting speed. |
|
Avg % |
Specifies the average percentage of receiving or transmitting speed. |
|
Peak |
Specifies the peak utilization of the receiving or transmitting speed. |
|
Peak % |
Specifies the peak utilization percentage of the receiving or transmitting speed. |
|
Rx + Tx |
Specifies the sum of Rx and Tx speeds. |
|
Errors/Discards |
|
|
In Avg |
Specifies the average of incoming errors or discards. |
|
Out Avg |
Specifies the average of outgoing errors or discards. |
|
In Peak |
Specifies the peak of incoming errors or discards. |
|
Out Peak |
Specifies the peak of outgoing errors or discards. |
View multiple performance charts
You can view one or more performance charts for the ethernet interfaces using the Show Charts tab.
Follow these steps to view multiple performance charts.
-
Choose Manage > Inventory > Interfaces > Ethernet tab to display the list of Ethernet interfaces.
-
Choose the names of interfaces to view the performance chart for each interface. You can choose upto 4 names listed under Name.
-
Choose the Show Charts tab to view the performance charts with details.
The Show Chart tab displays 4 charts at a time. If you choose more than 4 items, the Nexus Dashboard will not display any performance charts.
Viewing Performance Information for Port Groups
Choose Manage > Inventory > Interfaces > Port Groups tab to display the list of port groups.
The following table describes the fields that appear on Manage > Inventory > Interfaces > Port Groups. Use the Show last 24 hours menu drop-down list to filter the view by 24 Hours, Week, Month, and Year.
| Field | Description |
|---|---|
|
Fabric |
Specifies the fabric name. Click the fabric name to display the fabric status on the right-side of the page. Click the Launch icon on the top-right side of the pane to see Fabric Overview. |
|
Port Group Name |
Specifies the port group name. Click the name to display the port group members. |
|
Rx/Tx |
|
|
Avg |
Specifies the average receiving or transmitting speed. |
|
Peak |
Specifies the peak utilization of the receiving or transmitting speed. |
|
Rx + Tx |
Specifies the sum of Rx and Tx speeds. |
|
Errors/Discards |
|
|
In Avg |
Specifies the average of incoming errors or discards. |
|
In Peak |
Specifies the peak of incoming errors or discards. |
|
Last Updated |
Specifies when the information was last updated. |
Port Group Member
Choose Manage > Inventory > Interfaces > Port Groups and click a port group name to view the port group members.
The following table describes the fields that appear on Port Group Member.
| Field | Description |
|---|---|
|
Port Group Member |
Specifies the port group member. Click the chart icon to view a graph of the traffic for the port group member according to the selected timeline. You can filter the data using the Day, Week, Month, and Year options. |
|
Speed |
Specifies the speed for the port group member. |
|
Rx/Tx |
|
|
Avg |
Specifies the average receiving or transmitting speed. |
|
Peak |
Specifies the peak utilization of the receiving or transmitting speed. |
|
Rx + Tx |
Specifies the sum of Rx and Tx speeds. |
|
Errors/Discards |
|
|
In Avg |
Specifies the average of incoming errors or discards. |
|
In Peak |
Specifies the peak of incoming errors or discards. |
|
Last Updated |
Specifies when the information was last updated. |
Viewing Performance Information for Optics
To view the optic metrics information of devices that are connected to all the FC ports from the Cisco Nexus Dashboard Web UI, perform the following steps:
-
Choose Manage > Inventory > Interfaces > Optics.
The Optics page displays with a panel of hamburger icons representing the total number of devices in healthy, warning, or critical conditions for each category, Temperature, Current, RxPower, TxPower, and Voltage.
-
You can sort the table using the Filter by attributes field to enable filtering by Fabric, Switch, Interface, Temperature, Current, RxPower, TxPower, and Voltage.
-
You can choose the Show All option to view all or view switches with a Warning or Critical condition by choosing Show Issues Only.
-
Click the graph icon next to the interface name in the Interface column to filter the metrics by Day, Week, Month, and Year.
-
Click a fabric name to display the fabric health status on the slide-in panel.
-
Click the Launch icon to to open the Fabric Overview page.
The following table describes the fields that appear on the Manage > Inventory > Interfaces > Optics page.
Field Description Fabric
Specifies the fabric name.
Click the fabric name to display the fabric status on the right side of the page. Click the Launch icon on the slide-in panel to view the Fabric Overview.
Switch
Specifies the switch name.
Interface
Specifies the interface name.
Click the chart icon in the Interface column to view a graph of the optics parameters on that device according to the selected timeline. You can filter the data for each interface using the Day, Week, Month, and Year options.
Temperature (C)
Value
Specifies the average, minimum, and maximum temperature.
Prediction
Specifies if the temperature is one of the following conditions:
-
Healthy
-
Warning
-
Critical
Current (mA)
Value
Specifies the average, minimum, and maximum current.
Prediction
Specifies if the current is one of the following conditions:
-
Healthy
-
Warning
-
Critical
RxPower (dBm)
Value
Specifies the average, minimum, and maximum Rx power.
Prediction
Specifies if the Rx Power is one of the following conditions:
-
Healthy
-
Warning
-
Critical
TxPower (dBm)
Value
Specifies the average, minimum, and maximum Tx power.
Prediction
Specifies if the Tx Power is one of the following conditions:
-
Healthy
-
Warning
-
Critical
Voltage (V)
Value
Specifies the average, minimum, and maximum voltage.
Prediction
Specifies if the Voltage is one of the following conditions:
-
Healthy
-
Warning
-
Critical
-
Custom Port Groups
Choose Manage > Inventory > Interfaces > Custom Port Groups tab to view and create custom port groups.
The following table describes the fields that appear on Manage > Inventory > Interfaces > Custom Port Groups.
| Field | Description |
|---|---|
|
Group Name |
Specifies the port group name. Click the name to view the performance and configure the port group. For more information, see Viewing Performance of Custom Port Groups and Configuring Custom Port Groups. |
|
Devices |
Specifies the number of devices. |
|
Interfaces |
Specifies the number of interfaces. |
The following table describes the action items, in the Actions menu drop-down list, that appear on Manage > Inventory > Interfaces > Custom Port Groups.
| Action Item | Description |
|---|---|
|
Create Port Group |
Select a port group from the table, choose Create Port Group, provide a port group name, and click Save & Exit to create a custom port group. |
|
Edit port group |
Select a port group from the table and choose Edit port group to edit port group. |
|
Delete |
Select a port group from the table and choose Delete to delete the port group. |
Viewing Performance of Custom Port Groups
Choose Manage > Inventory > Interfaces > Custom Port Groups and click a port group name to view the performance of the port group.
The following table describes the fields that appear on the Performance tab of Custom Port Groups.
| Field | Description |
|---|---|
|
Device |
Specifies the device name. |
|
Connected To |
Specifies where the interface is connected to. |
|
Speed |
Specifies the interface speed. |
|
Rx/Tx |
|
|
Avg |
Specifies the average receiving or transmitting speed. |
|
Peak |
Specifies the peak utilization of the receiving or transmitting speed. |
|
Rx + Tx |
Specifies the sum of Rx and Tx speeds. |
|
Errors/Discards |
|
|
Avg |
Specifies the average of incoming errors or discards. |
|
Peak |
Specifies the peak of incoming errors or discards. |
|
Last Updated |
Specifies when the information was last updated. |
Use the Show last day menu drop-down list to filter the view by Day, Week, Month, and Year.
Configuring Custom Port Groups
Configuring Custom Port Groups Choose Manage > Inventory > Interfaces > Custom Port Groups, click a port group name, and click the Configuration tab to configure the custom port group.
The following table describes the fields that appear on the Configuration tab of Custom Port Groups.
| Field | Description |
|---|---|
|
Device |
Specifies the device name. Click the device name to display the device status on the right-side of the page. |
|
Connected To |
Specifies where the interface is connected to. |
|
Description |
Specifies the interface description. |
The following table describes the action items, in the Actions menu drop-down list, that appear on the Configuration tab.
| Action Item | Description |
|---|---|
|
Add Interfaces |
Choose Add Interfaces to add interfaces to the port group. In the Add Interfaces window, select a device and click Next Step - Add Interfaces. Select the interfaces that you want to add to the port group and click Save & Exit. |
|
Delete |
Select a port group from the table and choose Delete to delete the port group. |
Configuring Port Monitoring
The following topics provide information on configuring port monitoring.
Port Monitoring Policy
This feature allows you to save custom Port Monitoring policies in the Cisco Nexus Dashboard database. It allows you to push the selected custom policy to one or more fabrics or Cisco MDS 9000 Series Switches. The policy is designated as active Port-Monitor policy in the switch.
This feature is supported only on the Cisco MDS 9000 SAN Switches and therefore the Cisco Nexus Dashboard user can select the MDS switch to push the policy.
Nexus Dashboard provides 12 templates to customize the policy. The user-defined policies are saved in the Cisco Nexus Dashboard database. You can select any template or customized policy to push to the selected fabric or switch with the desired port type.
You can edit only user-defined policies.
The following table describes the fields that appear on Manage > Port Monitoring.
| Field | Description |
|---|---|
|
Selected Port Monitoring Policy |
This drop-down list shows the following templates for policies:
|
|
Logical Type |
Specifies the type of port for selected policies. The available port types are:
|
|
Save |
Allows you to save your changes for the user-defined policies.
You cannot save configuration changes for default templates. |
|
Save As |
Allows you to save an existing policy as a new policy with a different name. This creates another item in the templates as Custom Policy. The customized policy is saved under this category. If you click Save As while the policy is edited, the customized policy is saved.To create new policy:
|
|
Delete |
Allows you to delete any user-defined policies. |
|
Push to switches |
Allows you to select a fabric or switch and push the selected policies with the desired port type. The following policies select the Core policy type:
The following policies select the edge policy type:
The following policies select all policy types:
Select the parameters and click Push to push the policies to the switches in the fabric. You can change the required port type for selected policy apart from the pre-defined port.
If there is an active policy with the same or common port type, the push command configures the same policy on the selected devices. This policy replaces the existing active policy with the same or common port type. A warning message is displayed for replacing the existing policy. Click Confirm to rewrite the policy. A confirmation message is displayed for policy pushed to switches. Click View logs to view log details on the switch or click OK to return to the home page. If you click Push to Switches while the policy is edited, the customized policy will not be saved. Nexus Dashboard enables Fabric Performance Monitor (FPM) feature when you push and activate the edge logical-type policy with FPIN or DIRL port guard. If you select Cisco MDS 9250i Multiservice Fabric Switch for policy with FPIN or DIRL feature counter, a warning window appears. |
|
Description |
Move the pointer to the "i" icon next to the description to view detailed information. |
|
Rising Threshold |
Specifies the upper threshold limit for the counter type. |
|
Rising Event |
Specifies the type of event to be generated when the rising threshold is reached or crossed. |
|
Falling Threshold |
Specifies the lower threshold limit for the counter type. |
|
Alerts |
Specifies type of alert for the port. The alerts are syslog, rmon, and oblf. Alert is applicable for Cisco MDS switches with release 8.5(1) only. |
|
Poll Interval |
Specifies the time interval to poll for the counter value. |
|
Warning Threshold |
Allows you to set an optional threshold value lower than the rising threshold value and higher than the falling threshold value to generate syslogs. The range is 0-9223372036854775807. |
|
Port Guard |
Specifies if the port guard is enabled or disabled. The value can be false, flap, or errordisable. The default value is "false". |
|
Congestion- signal Warning |
Indicates the building congestion between ports. This is available only for TxWait (%) counter only. |
|
Congestion- signal Alarm |
Indicates the critical congestion between ports. This is available only for Tx-Wait counter. |
|
Monitor |
Indicates the value either true or false. |
|
Edit |
Click to edit above details for each row and click tick mark to save configuration changes.
You can overwrite configuration changes saved using Save and Save As option when you edit the configuration for each row. |
Configuring SFP Counters
From Cisco MDS NX-OS Release 8.5(1), the SFP counters allow you to configure the low warning thresholds for Tx Power and Rx Power for SFPs. You will receive syslog when these threshold values drop below the configured values.
SFPs are monitored once in every 10 minutes. The rising threshold is the count of Rx or Tx Power times. This power time is less than or equal to the SFPs Rx or Tx Power low warning threshold multiplied by the percentage. Accordingly, you can increment the rising threshold once every 10 minutes. Configuring a rising threshold value that is more than the 600 multiple of the poll interval displays an error.
For example, for a polling interval of 1200, the rising threshold will be 2 (1200/600) and must be more than 2. The SFP counters are not included in the default policy and the only alert action that is available is syslog. You can configure the polling interval using the port monitor counter command.
You can choose one of the following to configure SFP counters, perform the following options:
-
Configuring a low warning threshold percentage of 100% allows this counter to trigger when the Rx Power is less than or equal to the SFP’s Rx Power low warning threshold.
-
Configuring a low warning threshold percentage less than 100% allows this counter to trigger when the Rx Power is above the SFP’s Rx Power low warning threshold.
-
Configuring a low warning threshold percentage of greater than 100% allows this counter to trigger when the Rx Power is less than the SFP’s Rx Power low warning threshold (between low warning and low alarm).
The following are the SFP counters:
-
sfp-rx-power-low-warn
Specifies the number of times a SFP’s port reached a percentage of the SFP’s Rx Power’s low warning threshold. This threshold varies depending on the type, speed, and manufacturer of the SFP and this is displayed via show interface transceiver details command. This value is percentage of each individual SFP’s Rx Power low warning threshold and not the perfect value. This percentage can be configured in the range of 50 to 150% to allow for alerting at values less than the Rx Power low warning threshold or greater than the Rx Power low warning threshold. This is an perfect value and varies between 50% to 150%. The low warning threshold value is calculated as the actual low warning threshold value of the SFP times the specified percentage. If the Rx power is lesser than or equal to the low warning threshold value, then this counter is incremented.
-
sfp-tx-power-low-warn
Specifies the number of times a SFP’s port reached a percentage of the SFP’s Tx Power’s low warning threshold. This threshold varies depending on the type, speed, and manufacturer of the SFP and this is displayed via show interface transceiver details command. This value is percentage of each individual SFP’s Tx Power low warning threshold and not the perfect value. This percentage can be configured in the range of 50 to 150% to allow for alerting at values less than the Tx Power low warning threshold or greater than the Tx Power low warning threshold. This is an perfect value and varies between 50% to 150%. The low warning threshold value is calculated as the actual low warning threshold value of the SFP times the specified percentage. If the Tx power is lesser than or equal to the low warning threshold value, then this counter is incremented.
From Cisco MDS NX-OS Release 8.5(1), the datarate burst counters monitor the number of times the datarate crosses the configured threshold datarate in one second intervals. If the number crosses the configured number for rising threshold, the configured alert actions are taken as the condition is met. Datarate burst counters are polled every second. The datarate burst counters are not included in the default policy. For configuring the datarate burst counters, see Configuring a Port Monitor Policy section in Cisco MDS 9000 Series Interfaces Configuration Guide.
Links
Cisco Nexus Dashboard allows you to configure Fibre Channel over IP (FCIP) and port channels on SAN fabrics. You can also monitor the Inter-Switch Link (ISL) traffic and errors, and view the performance of N Port Virtualization (NPV) links from the Cisco Nexus Dashboard Web UI.
To navigate to the Links window for SAN fabrics:
-
Click Manage > Inventory.
-
Click the Links tab.
View ISL information
The ISLs window provides information on ISLs that have been configured in the SAN fabrics in your Nexus Dashboard. The table in the ISLs window shows the ISLs and port channels that have been configured on the SAN fabrics. You can use the drop-down to filter the view by the last day, week, month, or year.
Click on the entry in the Name column to get more information on the entry.
You can perform the following operations from the ISLs window:
Configure FCIP
To configure FCIP:
-
Navigate to the Links window.
-
Click the ISLs tab.
-
Click Actions > Configure FCIP.
The Configure FDIP wizard appears.
FCIP is not supported on Cisco MDS 9000 24/10-Port SAN Extension Module.
-
On the Select Switch Pair screen, select two MDS switches from the drop-down list to connect via FCIP.
Each switch must have an Ethernet port that is connected to an IP network to function correctly. In case of a federation setup, both switches must belong to the fabrics that are discovered or managed by the same server.
-
Click Next to select the Ethernet ports.
-
Select the Ethernet ports to be used in FCIP ISL between the selected switches.
Down ports must be enabled to function correctly. Security can be enforced for unconfigured 14+2, 18+4, 9250i and SSN16 Ethernet ports.
-
Enter the Ethernet ports IP addresses and specify the IP Routes if the port addresses are in a different subnet.
Click Next to apply the changes to IP Address and IP Route.
-
Click Next to specify tunnel properties.
-
Specify the following parameters to tunnel the TCP connections.
-
Max Bandwidth: Enter the number between 1 to 10000. The unit is Mb.
-
Min Bandwidth: Enter the minimum bandwidth value. The unit is Mb.
-
Estimated RTT(RoundTrip Time): Enter the number between 0 to 300000. The unit is us. Click Measure to measure the roundtrip time.
-
Write Acceleration: Check the check box to enable the write acceleration.
If Write Acceleration is enabled, ensure that flows will not load balance across multiple ISLs.
-
Enable Optimum Compression: Check the check box to enable the optimum compression.
-
Enable XRC Emulator: Check the check box to enable XRC emulator.
-
Connections: Enter the number of connections from 0 to 100.
-
-
Click Next to create FCIP ISL.
-
Enter the Profile ID and Tunnel ID for the switch pair, and select the FICON Port Address from the list.
To configure FICON port numbers for FCIP ISLs, ensure that the active equals saved command is enabled on at least one of the FICON-enabled VSANs in the fabric. The active equals saved command is enabled by default when FICON is enabled on a VSAN. If not, you can still configure the ISL. However, you must manually add the FICON specific configuration details later.
-
Click View Configured to display the Profiles and Tunnels information.
-
Select the Trunk Mode from non-Trunk, trunk, and auto. Specify the Port VSAN for non-Trunk and auto, and allowed VSAN List for Trunk tunnel.
-
Click Next to the last summary page.
The Summary view displays what you have selected in the previous steps.
-
Click Finish to configuring FCIP.
Port channel overview
A port channel is an aggregation of multiple physical interfaces into one logical interface to provide higher aggregated bandwidth, load balancing, and link redundancy. Port channels can connect to interfaces across switching modules, so a failure of a switching module cannot bring down the port channel link.
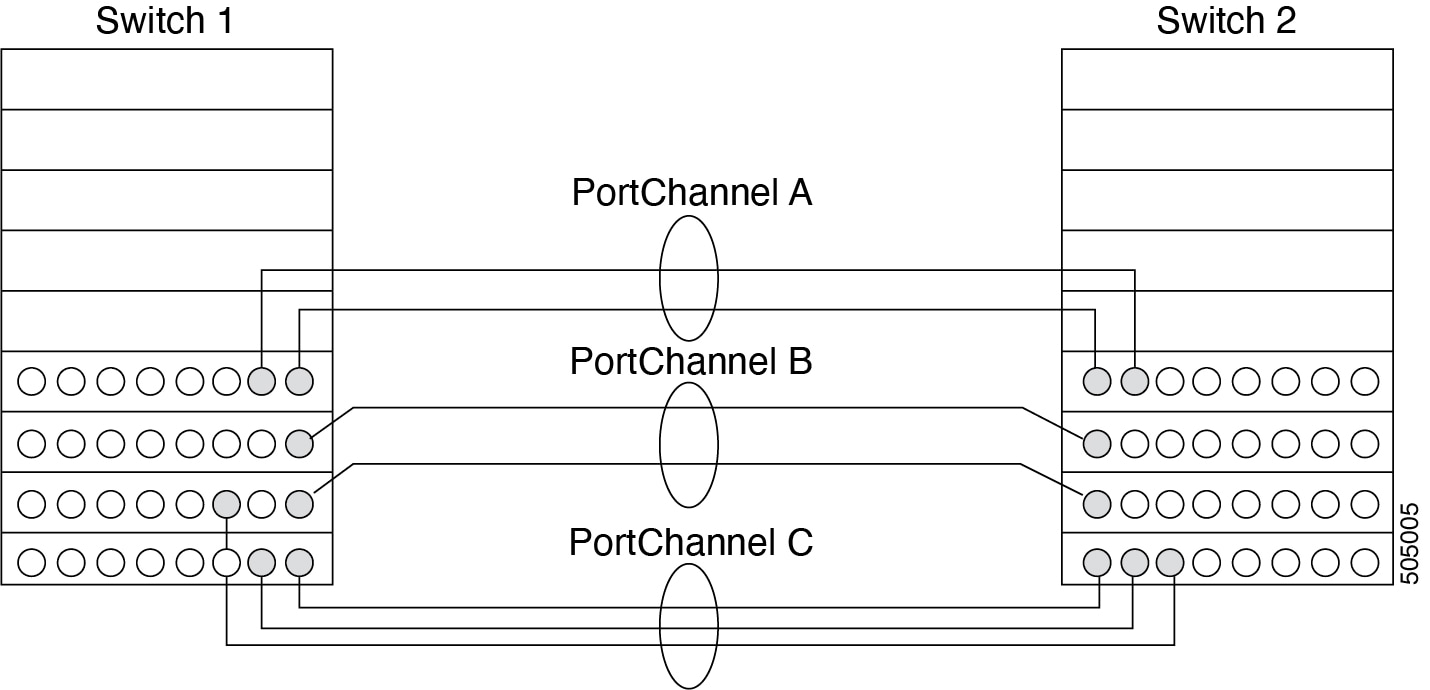
Port channels on Cisco MDS 9000 family switches allow flexibility in configuration. The figure above illustrates three possible port channel configurations:
-
PortChannel Aaggregates two links on two interfaces on the same switching module at each end of a connection. -
PortChannel Balso aggregates two links, but each link is connected to a different switching module. If the switching module goes down, traffic is not affected. -
PortChannel Caggregates three links. Two links are on the same switching module at each end, while one is connected to a different switching module on switch 2.
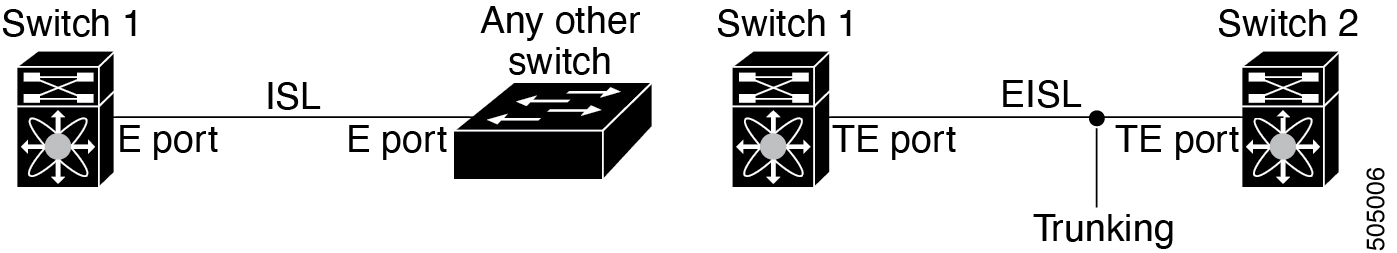
Port channeling and trunking
Trunking is a commonly used storage industry term. However, the Cisco NX-OS software and switches in the Cisco MDS 9000 Family implement trunking and port channeling as follows:
-
Port channeling enables several physical links to be combined into one aggregated logical link.
-
Trunking enables a link transmitting frames in the EISL format to carry (trunk) multiple VSAN traffic. For example, when trunking is operational on an E port, that E port becomes a TE port. A TE port is specific to switches in the Cisco MDS 9000 Family. An industry standard E port can link to other vendor switches and is referred to as a nontrunking interface.
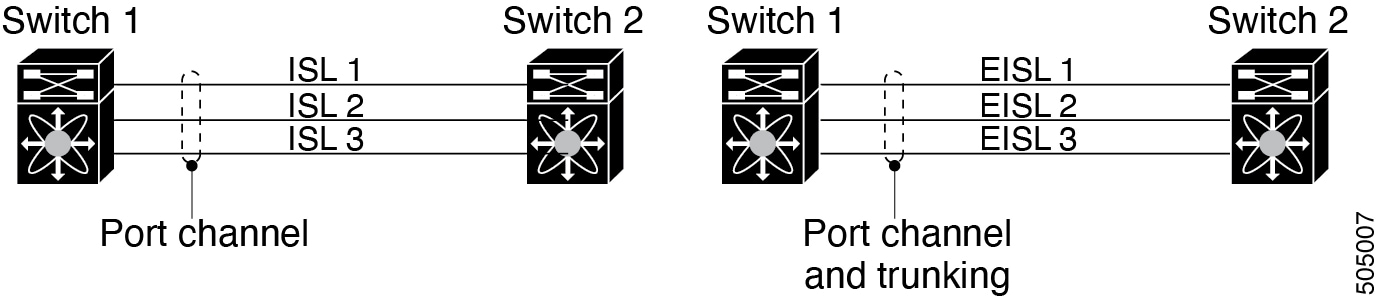
Port channeling and trunking are used separately across an ISL.
Port channeling-interfaces can be channeled between the following sets of ports:
-
E ports and TE ports
-
F ports and NP ports
-
TF ports and TNP ports
-
Trunking-Trunking permits carrying traffic on multiple VSANs between switches.
-
Both port channeling and trunking can be used between TE ports over EISLs.
-
Load balancing
Two methods support the load-balancing functionality:
-
Flow-based-All frames between a source and destination follow the same links for a given flow. That is, whichever link is selected for the first exchange of the flow is used for all subsequent exchanges.
-
Exchange-based-The first frame in an exchange picks a link and subsequent frames in the exchange follow the same link. However, subsequent exchanges can use a different link. This provides more granular load balancing while preserving the order of frames for each exchange.
The following figure illustrates how a source ID 1 (SID1) and destination ID1 (DID1)-based load balancing works. When the first frame in a flow is received on an interface for forwarding, link 1 is selected. Each subsequent frame in that flow is sent over the same link. No frame in SID1 and DID1 utilizes link 2.
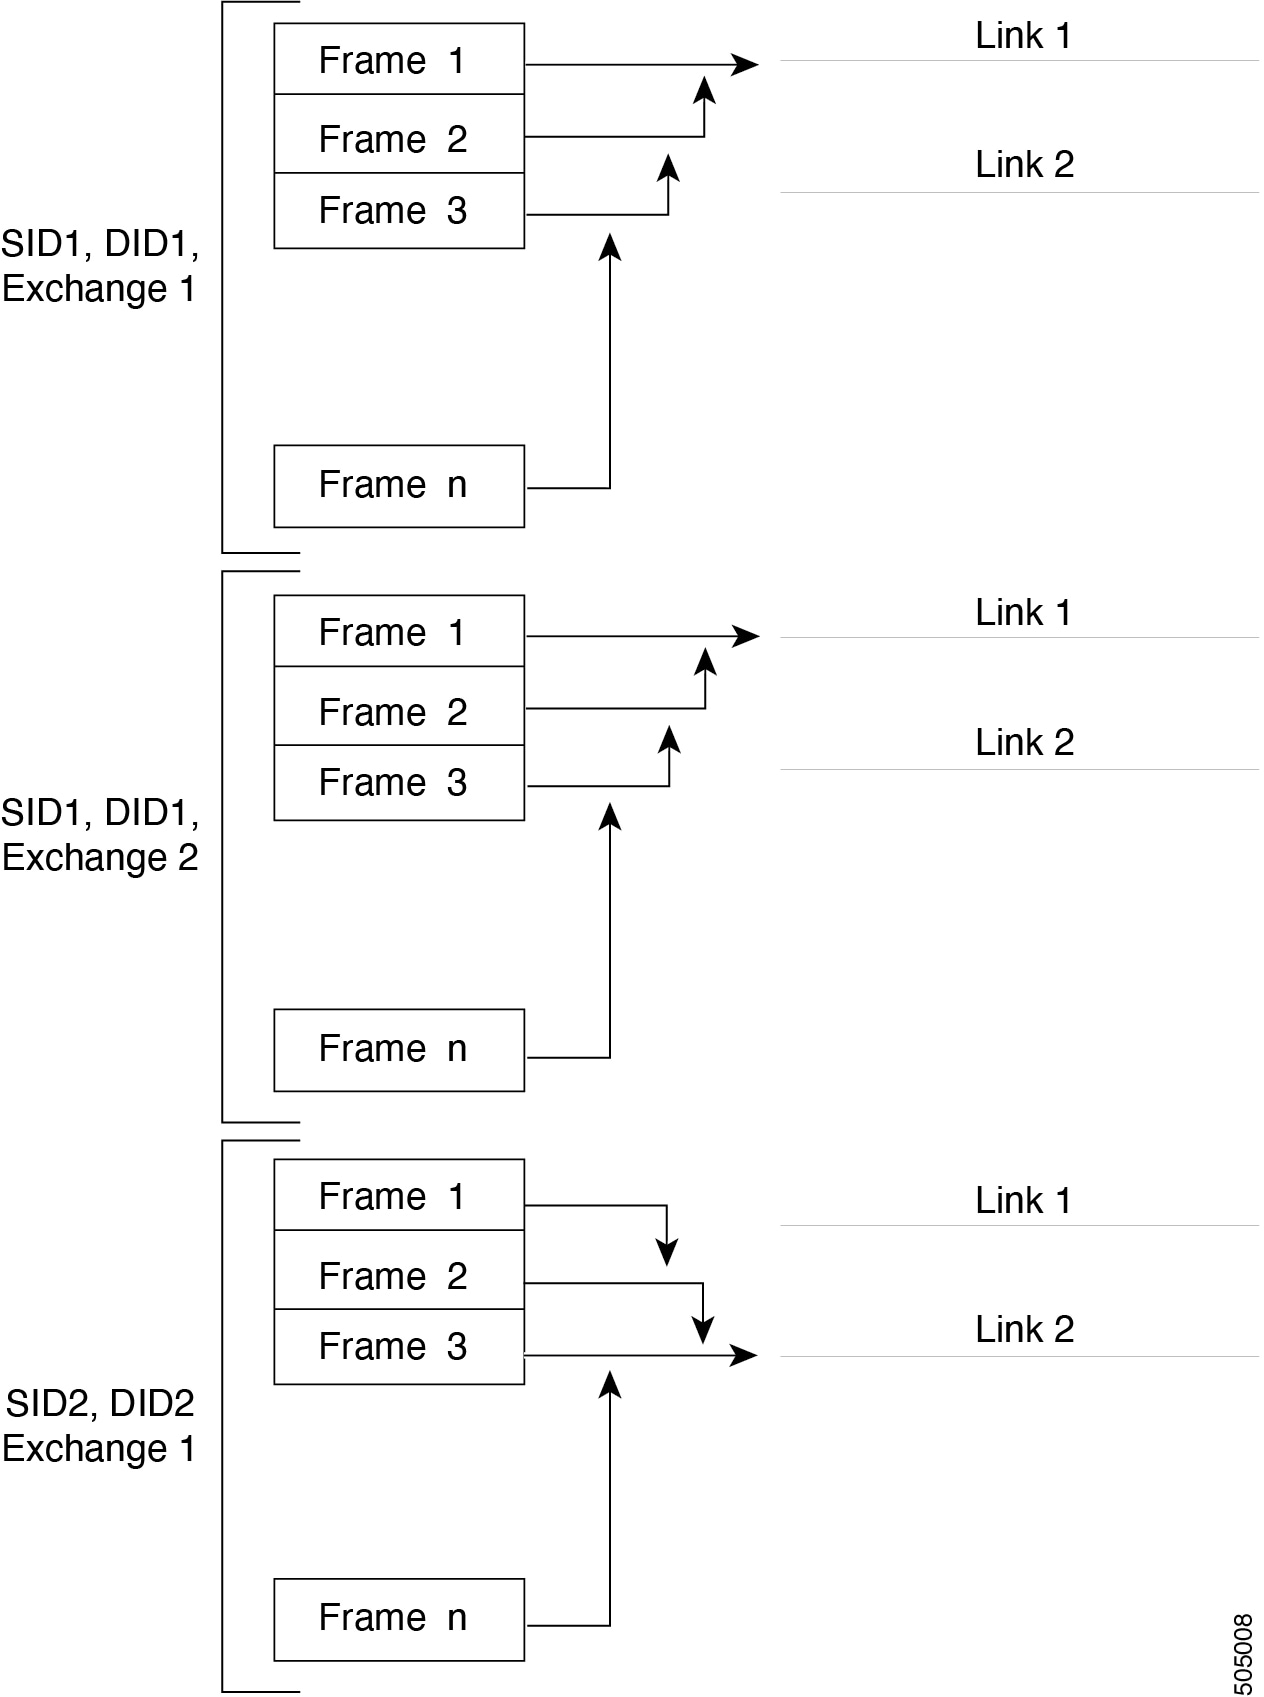
The following figure illustrates how exchange-based load balancing works. When the first frame in an exchange is received for forwarding on an interface, link 1 is chosen by a hash algorithm. All remaining frames in that particular exchange are sent on the same link. For exchange 1, no frame uses link 2. For the next exchange, link 2 is chosen by the hash algorithm. Now all frames in exchange 2 use link 2.
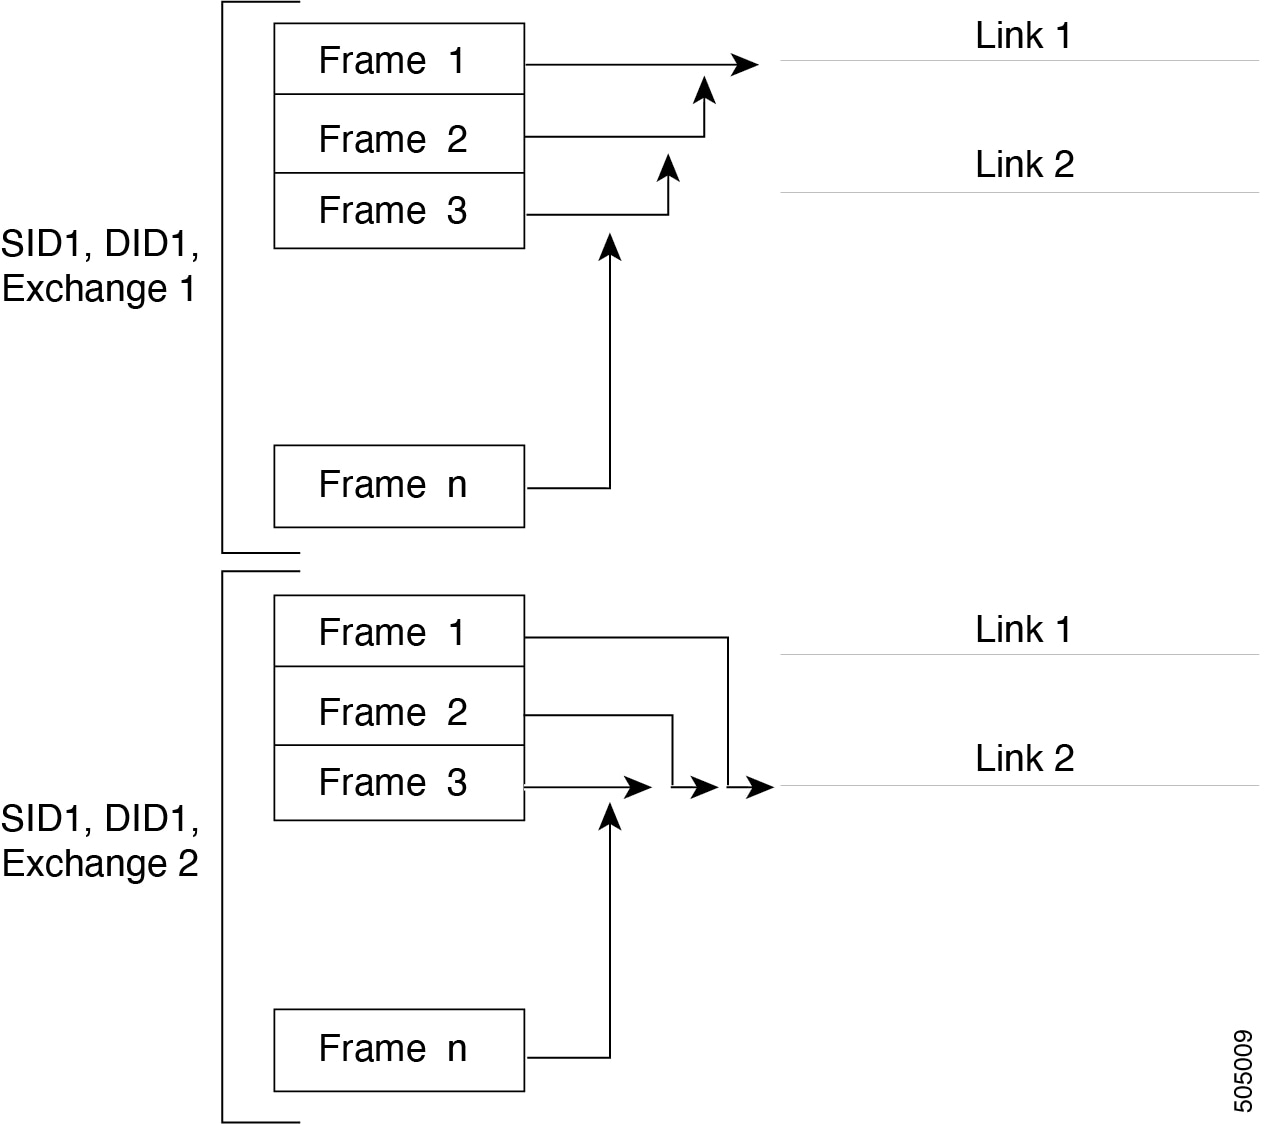
Port channel modes
You can configure each port channel with a channel group mode parameter to determine the port channel protocol behavior for all member ports in this channel group. The possible values for a channel group mode are as follows:
-
ON (default) — The member ports only operate as part of a port channel or remain inactive. In this mode, the port channel protocol is not initiated. However, if a port channel protocol frame is received from a peer port, the software indicates its nonnegotiable status. This mode is backward compatible with the existing implementation of port channels in releases prior to Release 2.0(1b), where the channel group mode is implicitly assumed to be ON. In Cisco MDS SAN-OS Releases 1.3 and earlier, the only available port channel mode was the ON mode. Port channels that are configured in the ON mode require you to explicitly enable and disable the port channel member ports at either end if you add or remove ports from the port channel configuration. You must physically verify that the local and remote ports are connected to each other.
-
ACTIVE — The member ports initiate port channel protocol negotiation with the peer ports regardless of the channel group mode of the peer port. If the peer port, while configured in a channel group, does not support the port channel protocol, or responds with a nonnegotiable status, it defaults to the ON mode behavior. The ACTIVE port channel mode allows automatic recovery without explicitly enabling and disabling the port channel member ports at either end.
The following table compares ON and ACTIVE modes.
| ON Mode | ACTIVE Mode |
|---|---|
|
No protocol is exchanged. |
A port channel protocol negotiation is performed with the peer ports. |
|
Moves interfaces to the suspended state if its operational values are incompatible with the port channel. |
Moves interfaces to the isolated state if its operational values are incompatible with the port channel. |
|
When you add or modify a port channel member port configuration, you must explicitly disable (shut) and enable (no shut) the port channel member ports at either end. |
When you add or modify a port channel interface, the port channel automatically recovers. |
|
Port initialization is not synchronized. |
There is synchronized startup of all ports in a channel across peer switches. |
|
All misconfigurations are not detected as no protocol is exchanged. |
Consistently detect misconfigurations using a port channel protocol. |
|
Transitions misconfigured ports to the suspended state. You must explicitly disable (shut) and enable (no shut) the member ports at either end. |
Transitions misconfigured ports to the isolated state to correct the misconfiguration. Once you correct the misconfiguration, the protocol ensures automatic recovery. |
Deleting a port channel
When you delete the port channel, the corresponding channel membership is also deleted. All interfaces in the deleted port channel convert to individual physical links. After the port channel is removed, regardless of the mode used (ACTIVE and ON), the ports at either end are gracefully brought down, indicating that no frames are lost when the interface is going down.
If you delete the port channel for one port, then the individual ports within the deleted port channel retain the compatibility parameter settings (speed, mode, port VSAN, allowed VSAN, and port security). You can explicitly change those settings as required.
-
If you use the default ON mode to avoid inconsistent states across switches and to maintain consistency across switches, then the ports shut down. You must explicitly enable those ports again.
-
If you use the ACTIVE mode, then the port channel ports automatically recover from the deletion.
Interfaces in a port channel
You can add or remove a physical interface (or a range of interfaces) to an existing port channel. The compatible parameters on the configuration are mapped to the port channel. Adding an interface to a port channel increases the channel size and bandwidth of the port channel. Removing an interface from a port channel decreases the channel size and bandwidth of the port channel.
This section describes interface configuration for a port channel and includes the following topics:
Adding an interface to a port channel
You can add a physical interface (or a range of interfaces) to an existing port channel. The compatible parameters on the configuration are mapped to the port channel. Adding an interface to a port channel increases the channel size and bandwidth of the port channel.
A port can be configured as a member of a static port channel only if the following configurations are the same in the port and the port channel:
-
Speed
-
Mode
-
Rate mode
-
Port VSAN
-
Trunking mode
-
Allowed VSAN list or VF-ID list
After the members are added, regardless of the mode (ACTIVE and ON) used, the ports at either end are gracefully brought down, indicating that no frames are lost when the interface is going down (see the "Generation 1 port channel Limitations" section on page -12).
Compatibility check
A compatibility check ensures that the same parameter settings are used in all physical ports in the channel. Otherwise, they cannot become part of a port channel. The compatibility check is performed before a port is added to the port channel.
The check ensures that the following parameters and settings match at both ends of a port channel:
-
Capability parameters (type of interface, Gigabit Ethernet at both ends, or Fibre Channel at both ends).
-
Administrative compatibility parameters (speed, mode, rate mode, port VSAN, allowed VSAN list, and port security).
Ports in shared rate mode cannot form a port channel or a trunking port channel.
-
Operational parameters (remote switch WWN and trunking mode).
A port addition procedure fails if the capability and administrative parameters in the remote switch are incompatible with the capability and administrative parameters in the local switch. If the compatibility check is successful, the interfaces are operational and the corresponding compatibility parameter settings apply to these interfaces.
Suspended and isolated states
If the operational parameters are incompatible, the compatibility check fails and the interface is placed in a suspended or isolated state based on the configured mode:
-
An interface enters the suspended state if the interface is configured in the ON mode.
-
An interface enters the isolated state if the interface is configured in the ACTIVE mode.
Forcing an interface to be added
You can force the port configuration to be overwritten by the port channel. In this case, the interface is added to a port channel.
-
If you use the default ON mode to avoid inconsistent states across switches and to maintain consistency across switches, then the ports shut down. You have to explicitly enable those ports again.
-
If you use the ACTIVE mode, then the port channel ports automatically recover from the addition.
When port channels are created from within an interface, the force option cannot be used. After the members are forcefully added, regardless of the mode (ACTIVE and ON) used, the ports at either end are gracefully brought down, indicating that no frames are lost when the interface is going down.
Deleting an interface from a port channel
When a physical interface is deleted from the port channel, the channel membership is automatically updated. If the deleted interface is the last operational interface, then the port channel status is changed to a down state. Deleting an interface from a port channel decreases the channel size and bandwidth of the port channel.
-
If you use the default ON mode to avoid inconsistent states across switches and to maintain consistency across switches, then the ports shut down. You must explicitly enable those ports again.
-
If you use the ACTIVE mode, then the port channel ports automatically recover from the deletion.
After the members are deleted, regardless of the mode (ACTIVE and ON) used, the ports at either end are gracefully brought down, indicating that no frames are lost when the interface is going down.
Port channel protocols
In earlier Cisco SAN-OS releases, port channels required additional administrative tasks to support synchronization. The Cisco NX-OS software provides robust error detection and synchronization capabilities. You can manually configure channel groups or they can be automatically created. In both cases, the channel groups have the same capability and configurable parameters. Any change in configuration that is applied to the associated port channel interface is propagated to all members of the channel group.
A protocol to exchange port channel configurations is available in all Cisco MDS switches. This addition simplifies port channel management with incompatible ISLs. An additional autocreation mode enables ISLs with compatible parameters to automatically form channel groups without manual intervention.
The port channel protocol is enabled by default.
The port channel protocol expands the port channel functional model in Cisco MDS switches. It uses the exchange peer parameters (EPP) services to communicate across peer ports in an ISL. Each switch uses the information that is received from the peer ports along with its local configuration and operational values to decide if it should be part of a port channel. The protocol ensures that a set of ports is eligible to be part of the same port channel. They are only eligible to be part of the same port channel if all the ports have a compatible partner.
The port channel protocol uses two subprotocols:
-
Bringup protocol-Automatically detects misconfigurations so you can correct them. This protocol synchronizes the port channel at both ends so that all frames for a given flow (as identified by the source FC ID, destination FC ID and OX_ID) are carried over the same physical link in both directions. This helps make applications such as write acceleration, work for port channels over FCIP links.
-
Autocreation protocol-Automatically aggregates compatible ports into a port channel.
This section describes how to configure the port channel protocol and includes the following sections:
Creating a channel group
Channel groups are not supported on internal ports in the Cisco Fabric Switch for HP c-Class BladeSystem and the Cisco Fabric Switch for IBM BladeSystem.
Assuming link A1-B1 comes up first (see Figure 1-9), that link is operational as an individual link. When the next link comes up, for example, A2-B2, the port channel protocol identifies if this link is compatible with link A1-B1 and automatically creates channel groups 10 and 20 in the respective switches. If link A3-B3 can join the channel groups (the port channels), the respective ports have compatible configurations. If link A4-B4 operates as an individual link, it is because of the incompatible configuration of the two end ports with the other member ports in this channel group.
The channel group numbers are selected dynamically, and as such, the administrative configuration of the ports forming the channel group at either end are applicable to the newly created channel group. The channel group number being chosen dynamically may be different across reboots for the same set of port channels based on the order of ports that are initialized in the switch.
The following table describes the differences between user-configured and auto-configured channel groups.
| User-Configured Channel Group | Autocreated Channel Group |
|---|---|
|
Manually configured by the user. |
Created automatically when compatible links come up between two compatible switches, if channel group autocreation is enabled in all ports at both ends. |
|
Member ports cannot participate in autocreation of channel groups. The autocreation feature cannot be configured. |
None of these ports are members of a user-configured channel group. |
|
You can form the port channel with a subset of the ports in the channel group. Incompatible ports remain in a suspended or isolated state depending on the ON or ACTIVE mode configuration. |
All ports included in the channel group participate in the port channel-no member port becomes isolated or suspended; instead, the member port is removed from the channel group when the link is found to be incompatible. |
|
Any administrative configuration that is made to the port channel is applied to all ports in the channel group, and you can save the configuration for the port channel interface. |
Any administrative configuration that is made to the port channel is applied to all ports in the channel group, but the configurations are saved for the member ports; no configuration is saved for the port channel interface. You can explicitly convert this channel group, if required. |
|
You can remove any channel group and add members to a channel group. |
You cannot remove a channel group, or add/remove any of its members. The channel group is removed when no member ports exist. |
Autocreation
The autocreation protocol has the following functionality:
-
A port is not allowed to be configured as part of a port channel when the autocreation feature is enabled. These two configurations are mutually exclusive.
-
Autocreation must be enabled in both the local and peer ports to negotiate a port channel.
-
Aggregation occurs in one of two ways:
-
A port is aggregated into a compatible autocreated port channel.
-
A port is aggregated with another compatible port to form a new port channel.
-
-
Newly created port channels are allocated from the maximum port channel (128 for Generation 1 or a combination of Generation 1 and Generation 2 switches, or 256 for Generation 2 switches) in a decreasing order based on availability. If all 128 (or 256) numbers are used up, aggregation is not allowed.
-
You cannot change the membership or delete an autocreated port channel.
-
When you disable autocreation, all member ports are removed from the autocreated port channel.
-
Once the last member is removed from an autocreated port channel, the channel is automatically deleted and the number is released for reuse.
-
An autocreated port channel is not persistent through a reboot. An autocreated port channel can be manually configured to appear the same as a persistent port channel. Once the port channel is made persistent, the autocreation feature is disabled in all member ports.
-
You can enable or disable the autocreation feature on a per-port basis or for all ports in the switch. When this configuration is enabled, the channel group mode is assumed to be active. The default for this task is disabled.
-
If autocreation of channel groups is enabled for an interface, you must first disable autocreation before downgrading to earlier software versions or before configuring the interface in a manually configured channel group.
When enabling autocreation in any switch in the Cisco MDS 9000 Family, we recommend that you retain at least one interconnected port between the switches without any autocreation configuration. If all ports between two switches are configured with the autocreation feature at the same time, you may face a possible traffic disruption between these two switches as the ports are automatically disabled and reenabled when ports are added to an autocreated port channel.
Manually configured channel groups
A user-configured channel group cannot be converted to an autocreated channel group. However, you can convert an autocreated channel group to a manual channel group. Once performed, this task is irreversible. The channel group number does not change, but the member ports operate according to the properties of the manually configured channel group, and the autocreation of channel group is implicitly disabled for all member ports.
If you enable persistence, be sure to enable it at both ends of the port channel.
Prerequisites for configuring port channels
These are the prequisites before configuring a port channel:
-
Configure the port channel across switching modules to implement redundancy on switching module reboots or upgrades.
-
Ensure that one port channel is not connected to different sets of switches. Port channels require point-to-point connections between the same set of switches.
On switches with Generation 1 switching modules, or a combination of Generation 1 and Generation 2 switching modules, you can configure a maximum of 128 port channels. On switches with only Generation 2 switching modules, or Generation 2 and Generation 3 switching modules, you can configure a maximum of 256 port channels.
If you misconfigure port channels, you may receive a misconfiguration message. If you receive this message, the port channel’s physical links are disabled because an error has been detected.
A port channel error is detected if the following requirements are not met:
-
Each switch on either side of a port channel must be connected to the same number of interfaces.
-
Each interface must be connected to a corresponding interface on the other side.
-
Links in a port channel cannot be changed after the port channel is configured. If you change the links after the port channel is configured, be sure to reconnect the links to interfaces within the port channel and reenable the links.
If all three conditions are not met, the faulty link is disabled.
Enter the show interface command for that interface to verify that the port channel is functioning as required.
Guidelines and limitations for configuring port channels
This section includes the guidelines and limitations for this feature:
General guidelines for Cisco MDS 9000 Series switches
Cisco MDS 9000 Family switches support the following number of port channels per switch:
-
Switches with only Generation 1 switching modules do not support F and TF port channels.
-
Switches with Generation 1 switching modules, or a combination of Generation 1 and Generation 2 switching modules, support a maximum of 128 port channels. Only Generation 2 ports can be included in the port channels.
-
Switches with only Generation 2 switching modules or Generation 2 and Generation 3 modules support a maximum of 256 port channels with 16 interfaces per port channel.
-
A port channel number refers to the unique identifier for each channel group. This number ranges from of 1 to 256.
Generation 1 port channel limitations
This section includes the restrictions on creation and addition of port channel members to a port channel on Generation 1 hardware:
-
The 32-port 2-Gbps or 1-Gbps switching module.
-
The MDS 9140 and 9120 switches.
When configuring the host-optimized ports on Generation 1 hardware, the following port channel guidelines apply:
-
If you execute the write erase command on a 32-port switching module, and then copy a saved configuration to the switch from a text file that contains the no system default switchport shutdown command, you have to copy the text file to the switch again for the E ports to come up without manual configuration.
-
Any (or all) full line rate ports in the Cisco MDS 9100 Series can be included in a port channel.
-
The host-optimized ports in the Cisco MDS 9100 Series are subject to the same port channel rules as 32-port switching modules; only the first port of each group of four ports is included in a port channel.
-
You can configure only the first port in each 4-port group as an E port (for example, the first port in ports 1-4, the fifth port in ports 5-8, and so on). If the first port in the group is configured as a port channel, the other three ports in each group (ports 2-4, 6-8, and so on) are not usable and remain in the shutdown state.
-
If any of the other three ports are configured in a no shutdown state, you cannot configure the first port to be a port channel. The other three ports continue to remain in a no shutdown state.
-
F and TF port channel limitations
The following guidelines and restrictions are applicable for F and TF port channels:
-
The ports must be in F mode.
-
Automatic creation is not supported.
-
The port channel interface must be in ACTIVE mode when multiple FCIP interfaces are grouped with WA.
-
ON mode is not supported. Only ACTIVE-ACTIVE mode is supported. By default, the mode is ACTIVE on the NPV switches.
-
Devices that are logged in through F port channel on an MDS switch are not supported in IVR non-NAT configuration. The devices are supported only in IVR NAT configuration.
-
Port security rules are enforced only on physical pWWNs at the single link level.
-
FC-SP authenticates only the first physical FLOGI of every port channel member.
-
Since the FLOGI payload carries only the VF bits to trigger the use of a protocol after the FLOGI exchange, those bits will be overridden. In the case of the NPV switches, the core has a Cisco WWN and tries to initiate the PCP protocol.
-
The name server registration of the N ports logging in through an F port channel uses the fWWN of the port channel interface.
-
DPVM configuration is not supported.
-
The port channel port VSAN cannot be configured using DPVM.
-
The Dynamic Port VSAN Management (DPVM) database is queried only for the first physical FLOGI of each member, so that the port VSAN can be configured automatically.
-
DPVM does not bind FC_IDs to VSANs, but pWWNs to VSANs. It is queried only for the physical FLOGI.
Examples of valid and invalid port channel configurations
Port channels are created with default values. You can change the default configuration just like any other physical interface. The following figure provides examples of valid port channel configurations.
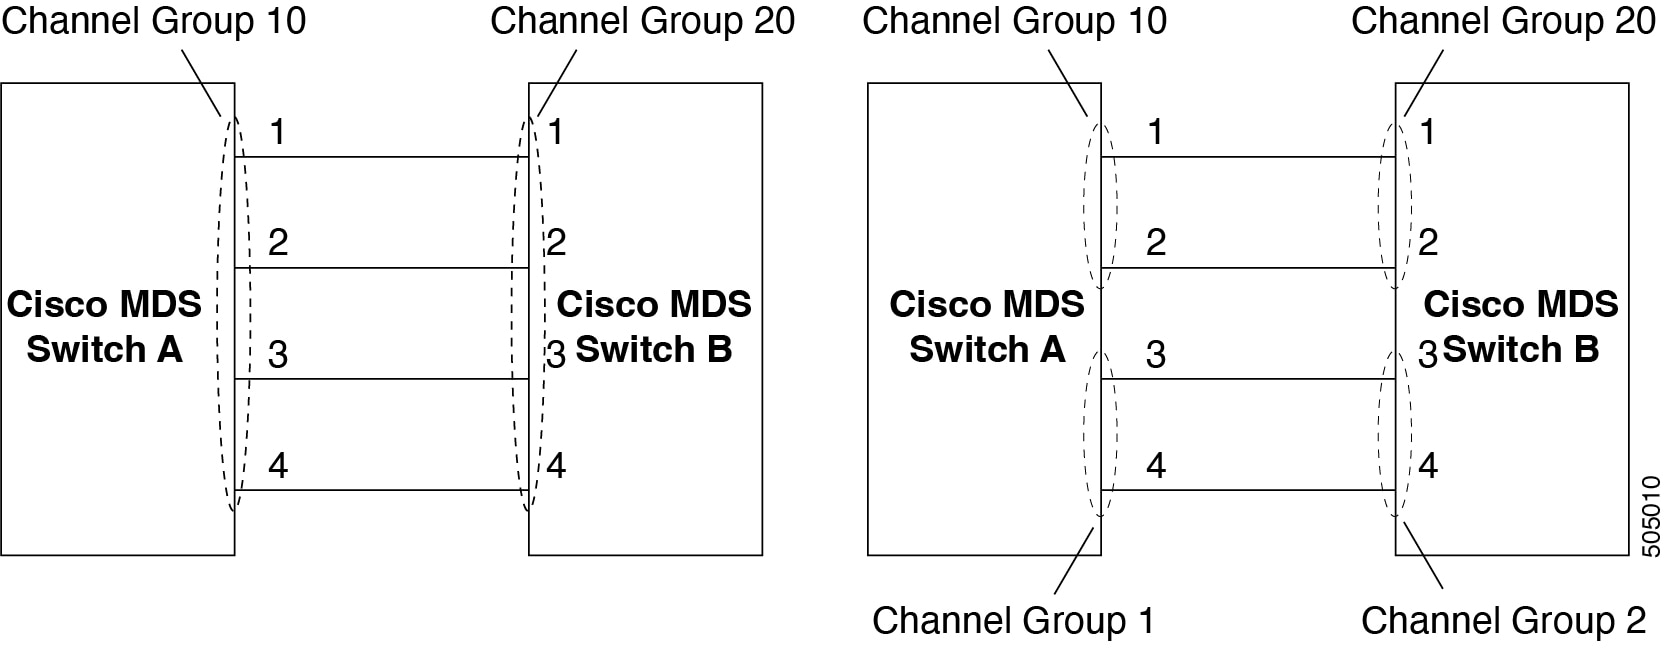
The following figure provides examples of invalid configurations. Assuming that the links are brought up in the 1, 2, 3, 4 sequence, links 3 and 4 will be operationally down as the fabric is misconfigured.
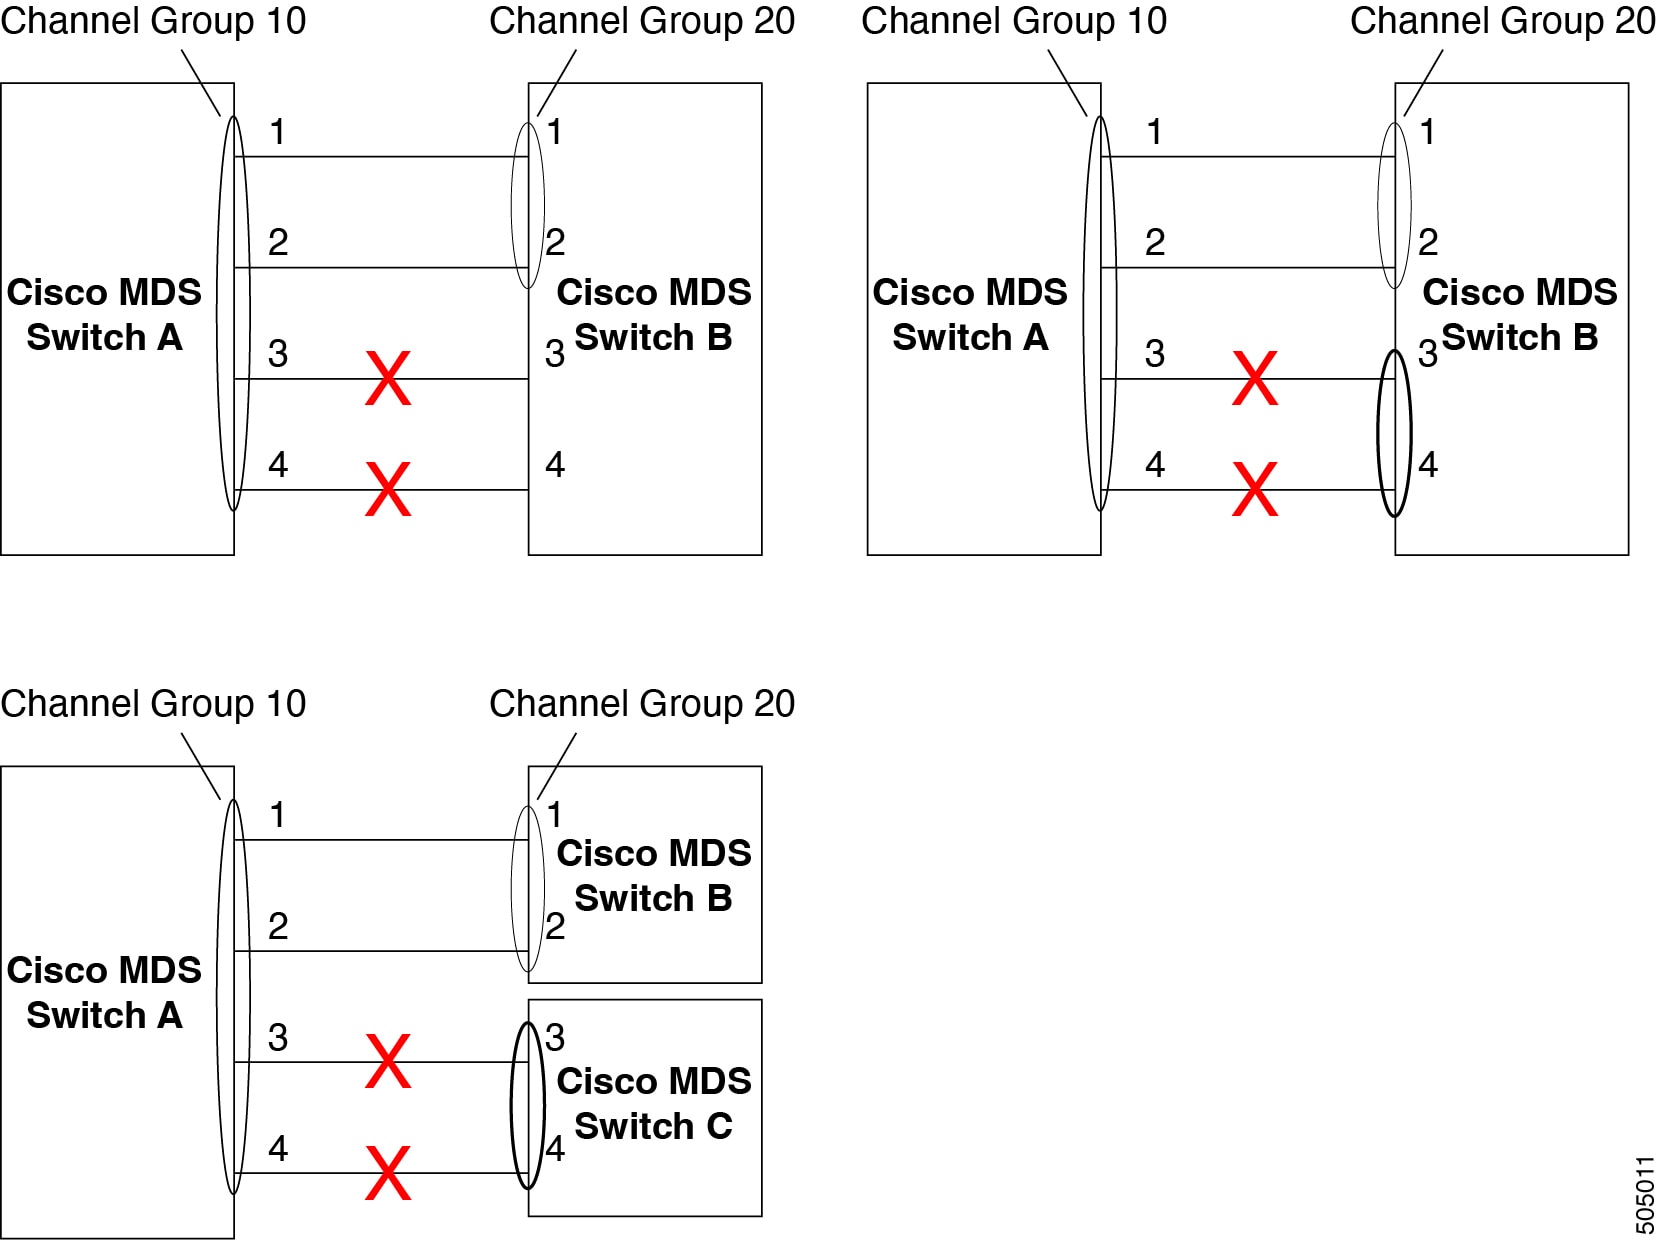
Default settings for port channels
The following table lists the default settings for port channels.
| Parameters | Default |
|---|---|
|
Port channels |
FSPF is enabled by default. |
|
Create port channel |
Administratively up. |
|
Default port channel mode |
ON mode on non-NPV and NPIV core switches.ACTIVE mode on NPV switches. |
|
Autocreation |
Disabled. |
Create a new port channel
To create a new port channel:
-
Navigate to the Links window.
-
Click the ISLs tab.
-
Click Actions > Create new port channel.
The Create new port channel wizard opens.
-
In the Select switch pair screen, perform the following steps:
-
Select the appropriate fabric from the Select a fabric drop-down.
The list contains switch pairs in the fabric that have an ISL between them, that is not already in a port channel.
-
Select a switch pair to be linked by an FC port channel.
If there are NPV links between NPIV-core and NPV switches, you must enable F Port Trunking and Channeling Protocol using the feature fport-channel-trunk command on the NPIV switch in order to see the switch-pair and the number of NPV links.
-
Click Next.
-
-
In the Select ISLs screen, select one or more ISLs or links to create a new port channel between the switch pair and click Next.
-
In the Configure Channel screen, define, or edit the channel attributes.
-
Channel Id field is populated with the next unused channel ID. Change the Channel Id or Description for each switch, if necessary.
The range of the channel Id is from 1 to 256.
-
FICON Port Address is only enabled if the switches are FICON enabled. From the drop-down list, select the appropriate FICON port address on the switch. Select the port address that you want to assign to the port channel port.
To configure the FICON port numbers for the port channel, ensure that the active equals saved command is enabled on at least one of the FICON-enabled VSANs in the fabric. active equals saved command is enabled by default. If not, you can still configure the port channel. However, you must manually add the FICON specific configuration details later.
-
In the Channel Attributes area, to configure the speed, click the appropriate radio button.
-
Select the appropriate Trunk Mode radio button to enable trunking on the links in the port channel.
-
Select Trunk if your link is between TE ports.
-
Select Non Trunk if your link is between E ports.
-
Select Auto if you are not sure.
-
-
In the Port VSAN field, enter the interface ID for port VSAN which must be used when trunking is not enabled.
Every interface must have a port VSAN even if trunking is enabled. If trunking is enabled, this port VSAN is not used. However, the switch must configure the port, so that the network knows what VSAN to use by default, if trunking is disabled.
-
VSAN List field provides a list of VSANs you want to allow the port channel to use for trunking.
This field is disabled if the Trunk Mode is set to Non Trunk or Auto.
-
In the Core Switch Bandwidth field, select Dedicated or Shared radio button to allocate the switch bandwidth.
This bandwidth is applicable only for port channels between an NPIV and NPV switch.
-
Check the Force admin, trunk, speed, VSAN attributes to be identical check box to ensure that the same parameter settings are used in all physical ports in the channel. If these settings are not identical, the ports cannot become a part of the port channel.
-
-
Click Previous to return to the previous screen and edit the settings.
-
Click Create new port channel to configure the port channel.
A success message appears.
Edit an existing port channel
To edit an existing port channel :
-
Navigate to the Links window.
-
Click the ISLs tab.
-
Click Actions > Edit port channel.
The Edit port channel window appears.
-
In the Select Switch Pair screen, do the following:
-
Select the appropriate fabric from the Fabric drop-down list.
The switch pairs that have port channels between them are listed in the area below.
-
Select a switch pair to edit the port channel.
-
Click Next.
-
-
In the Select port channel screen, choose a port channel to edit.
Click Next.
-
In the Edit port channel screen, select the desired ISL.
-
Click the right and left arrow to select the available ISLs.
The selected ISLs are contained in the port channel after you save the changes. If the Selected ISLs list is empty, the Delete port channel is Empty check box is enabled.
-
If you do not choose any ISL, check the Delete port channel if Empty check box to delete the port channel.
-
Check the Force admin, trunk, speed, VSAN attributes to be identical check box to choose identical values for admin, trunk, speed and VSAN attributes.
-
Click Next.
-
-
Click Save port channel to apply the changes.
View multiple performance charts for ISLs
View one or more performance charts for the selected ISLs using the Show Charts tab.
Follow these steps to view multiple performance charts for ISLs.
-
Navigate to Manage > Inventory > Links > ISLs tab.
-
Check the check box in the Status to select ISLs to view the performance chart.
You can choose up to 4 ISLs to view the performance charts for all 4 ISLs on a single screen.
-
Choose the Show Charts tab to view the performance charts with details.
The Show Chart tab displays 4 charts at a time. If you choose more than 4 items, the Nexus Dashboard will not display any performance charts.
About NPV links
To view NPV (N_Port Virtualization) and NPIV (N_Port ID Virtualization) links in your system:
-
Navigate to the Links window.
-
Click the NPV Links tab.
The configured NPV links are displayed.
The table shows the performance of NPV links on SAN Fabrics. You can use the Show last day drop-down to filter the view by Day (24 hours), Week, Month, and Year.
Click the chart icon in the Name column to see a list of the traffic for the past 24 hours.
There are variations to this procedure. In addition to these basic steps, you can also perform the following steps to view detailed information for NPV links:
-
You can change the time range for this information by selecting from the drop-down list in the upper-right corner.
-
To view the detailed information for a specific period, drag the slider control to choose the time interval for which you need the information.
-
Use the chart icons to view the traffic chart in varied views. You can also use the icons to Append, Predict, and Interpolate Data.
-
To export the data into a spreadsheet, click the Export icon in the upper-right corner and click Save.
-
To view real-time information, choose Real Time from the drop-down list in the Chart menu.
Configure NPV links
The NPV configuration wizard only displays and allows for the selection of NPV devices that are already NPV enabled; NPV-disabled switches are not shown in the NPV configuration wizard.
To enable NPV on a switch, navigate to:
Manage > Inventory > Switches
and double-click on the switch that you want to enable NPV on. Click on Enabled features, then click the toggle switch next to npiv to enable NPV on this switch.
You can now use the NPV configuration wizard once you have enabled the feature npiv on the appropriate switches.
To configure NPV links using the NPV configuration wizard:
-
Navigate to the Links window.
-
Click the NPV Links tab.
-
Click Actions > Configure NPV.
The Configure NPV configuration wizard appears, with Step 1. Select NPV Devices selected.
-
In the Select a fabric field, choose a fabric from the drop-down menu.
The NPV devices in that fabric appear in the table.
-
In the table, select one or more NPV devices or NPV enabled switches to pair, then click Next.
The NPV configuration wizard moves to Step 2. Select NPV Core Switches.
-
Select one or more NPIV core or NPIV capable switches from the table, if necessary.
NPIV capable switches can be configured as NPIV cores.
The NPV configuration wizard automatically selects NPIV devices that are detected as being connected to the selected NPV devices. You can modify the automatically selected devices to select as many devices as you would like to pair.
-
Click Next.
The NPV configuration wizard moves to Step 3. NPV Device/NPIV Core Switch Pairs.
-
Create an NPV pair.
The Step 3. NPV Device/NPIV Core Switch Pairs part of the NPV configuration wizard displays the devices selected from the previous two steps in the process.
-
To automatically pair the connected switches, click Add All Connected Pairs.
-
To manually create an NPV pair, select an NPV device from the left table and an NPIV core switch from the right table, then click Add Selected Pair.
The added NPV pair is displayed in the table at the bottom of the page. To remove one or more pairs from the table at the bottom of the page, click Remove All Pairs.
-
-
Click Next.
The NPV configuration wizard moves to Step 4. Configure NPV associated ports.
-
Configure the NPV-associated ports between each NPV pair.
Choose the way that you want to configure the NPV-associated ports between each NPV pair:
-
Automatic: Choose this option to have Nexus Dashboard automatically select the NP ports and their associated F ports based on the number of NP links between each NPV device and NPIV core pair. The NP ports are chosen from potential ports not connected to end devices.
If you choose the automatic option, you must also choose how many connections you would like (the number of NP links per NPV device and NPIV core pair). You will make that choice in the drop-down menu below the Automatic option box.
-
If there are enough ports based on your selection, then they are automatically paired and you are able to move to the next step in the process when you click Next.
-
If there are not enough ports based on your selection, then you can use the Manual option (described below) to configure the NPV-associated ports between each NPV pair.
-
-
Manual: Choose this option to manually select ports from the NPV devices and NPIV core switches to create pairs. Note that ports might not be listed if there are no configurable ports.
-
Select an NPV switch from the drop-down menu.
The tables below the drop-down menu are then populated with the appropriate ports for that device and the NPIV devices it is to be paired with.
-
Select an NPV device and port from the left table, and an NPIV core switch and port from the right table to make a pair.
-
Click Add Selected Pair.
The pair is displayed in the table at the bottom of the page.
-
-
-
Click Next.
The NPV configuration wizard moves to Step 5. Select VSAN.
-
Choose a VSAN for all NPV associated switches and ports.
-
Click Select Existing VSAN to choose an existing VSAN from a list of available VSANs, or
-
Click Input New VSAN ID to manually enter a VSAN ID. The VSAN ID must be a numeric value between 1 - 4093.
If you enter a VSAN ID that is already in use, a message appears, asking if you would like to use the first available match from the existing VSAN list instead or if you would like to try to manually input a new VSAN ID again.
-
Click Confirm to use the first available match from the existing VSAN list instead, or
-
Click Cancel to return to the Select VSAN screen so that you can try to manually input a new VSAN ID again.
-
-
-
Click Next.
The NPV configuration wizard moves to Step 6. Complete NPV Setup.
-
Review your configuration choices.
-
Click the Switch Actions tab to see what steps will be taken on each device.
-
Click the NPV Port Pairs tab to see a table listing the ports that are to be physically connected. This is the same information that was available at the bottom of Step 4 if you clicked on the Manual tab in that step.
-
-
Click Finish to apply the changes.
If you have the Switch Actions tab selected, you can see the progress of the actions from the Action column in real time. Click the entry in the Status column to bring up a sidebar with more details.
-
Physically connect each pair of NP and F ports.
View multiple performance charts for NPV Links
View one or more performance charts for the NPV Links using the Show Charts tab.
The Show Chart tab displays 4 charts at a time. If you choose more than 4 items, the Nexus Dashboard will not display any performance charts.
Follow these steps to view multiple performance charts for NPV Links.
-
Navigate to Manage > Inventory > Links > *NPV Links tab.
-
Check the check box in the Status column to select NPV Links to view the performance chart.
You can choose up to 4 NPV Links to view the performance charts for all 4 NPV Links on a single screen.
-
Choose the Show Charts tab to view the performance charts with details.
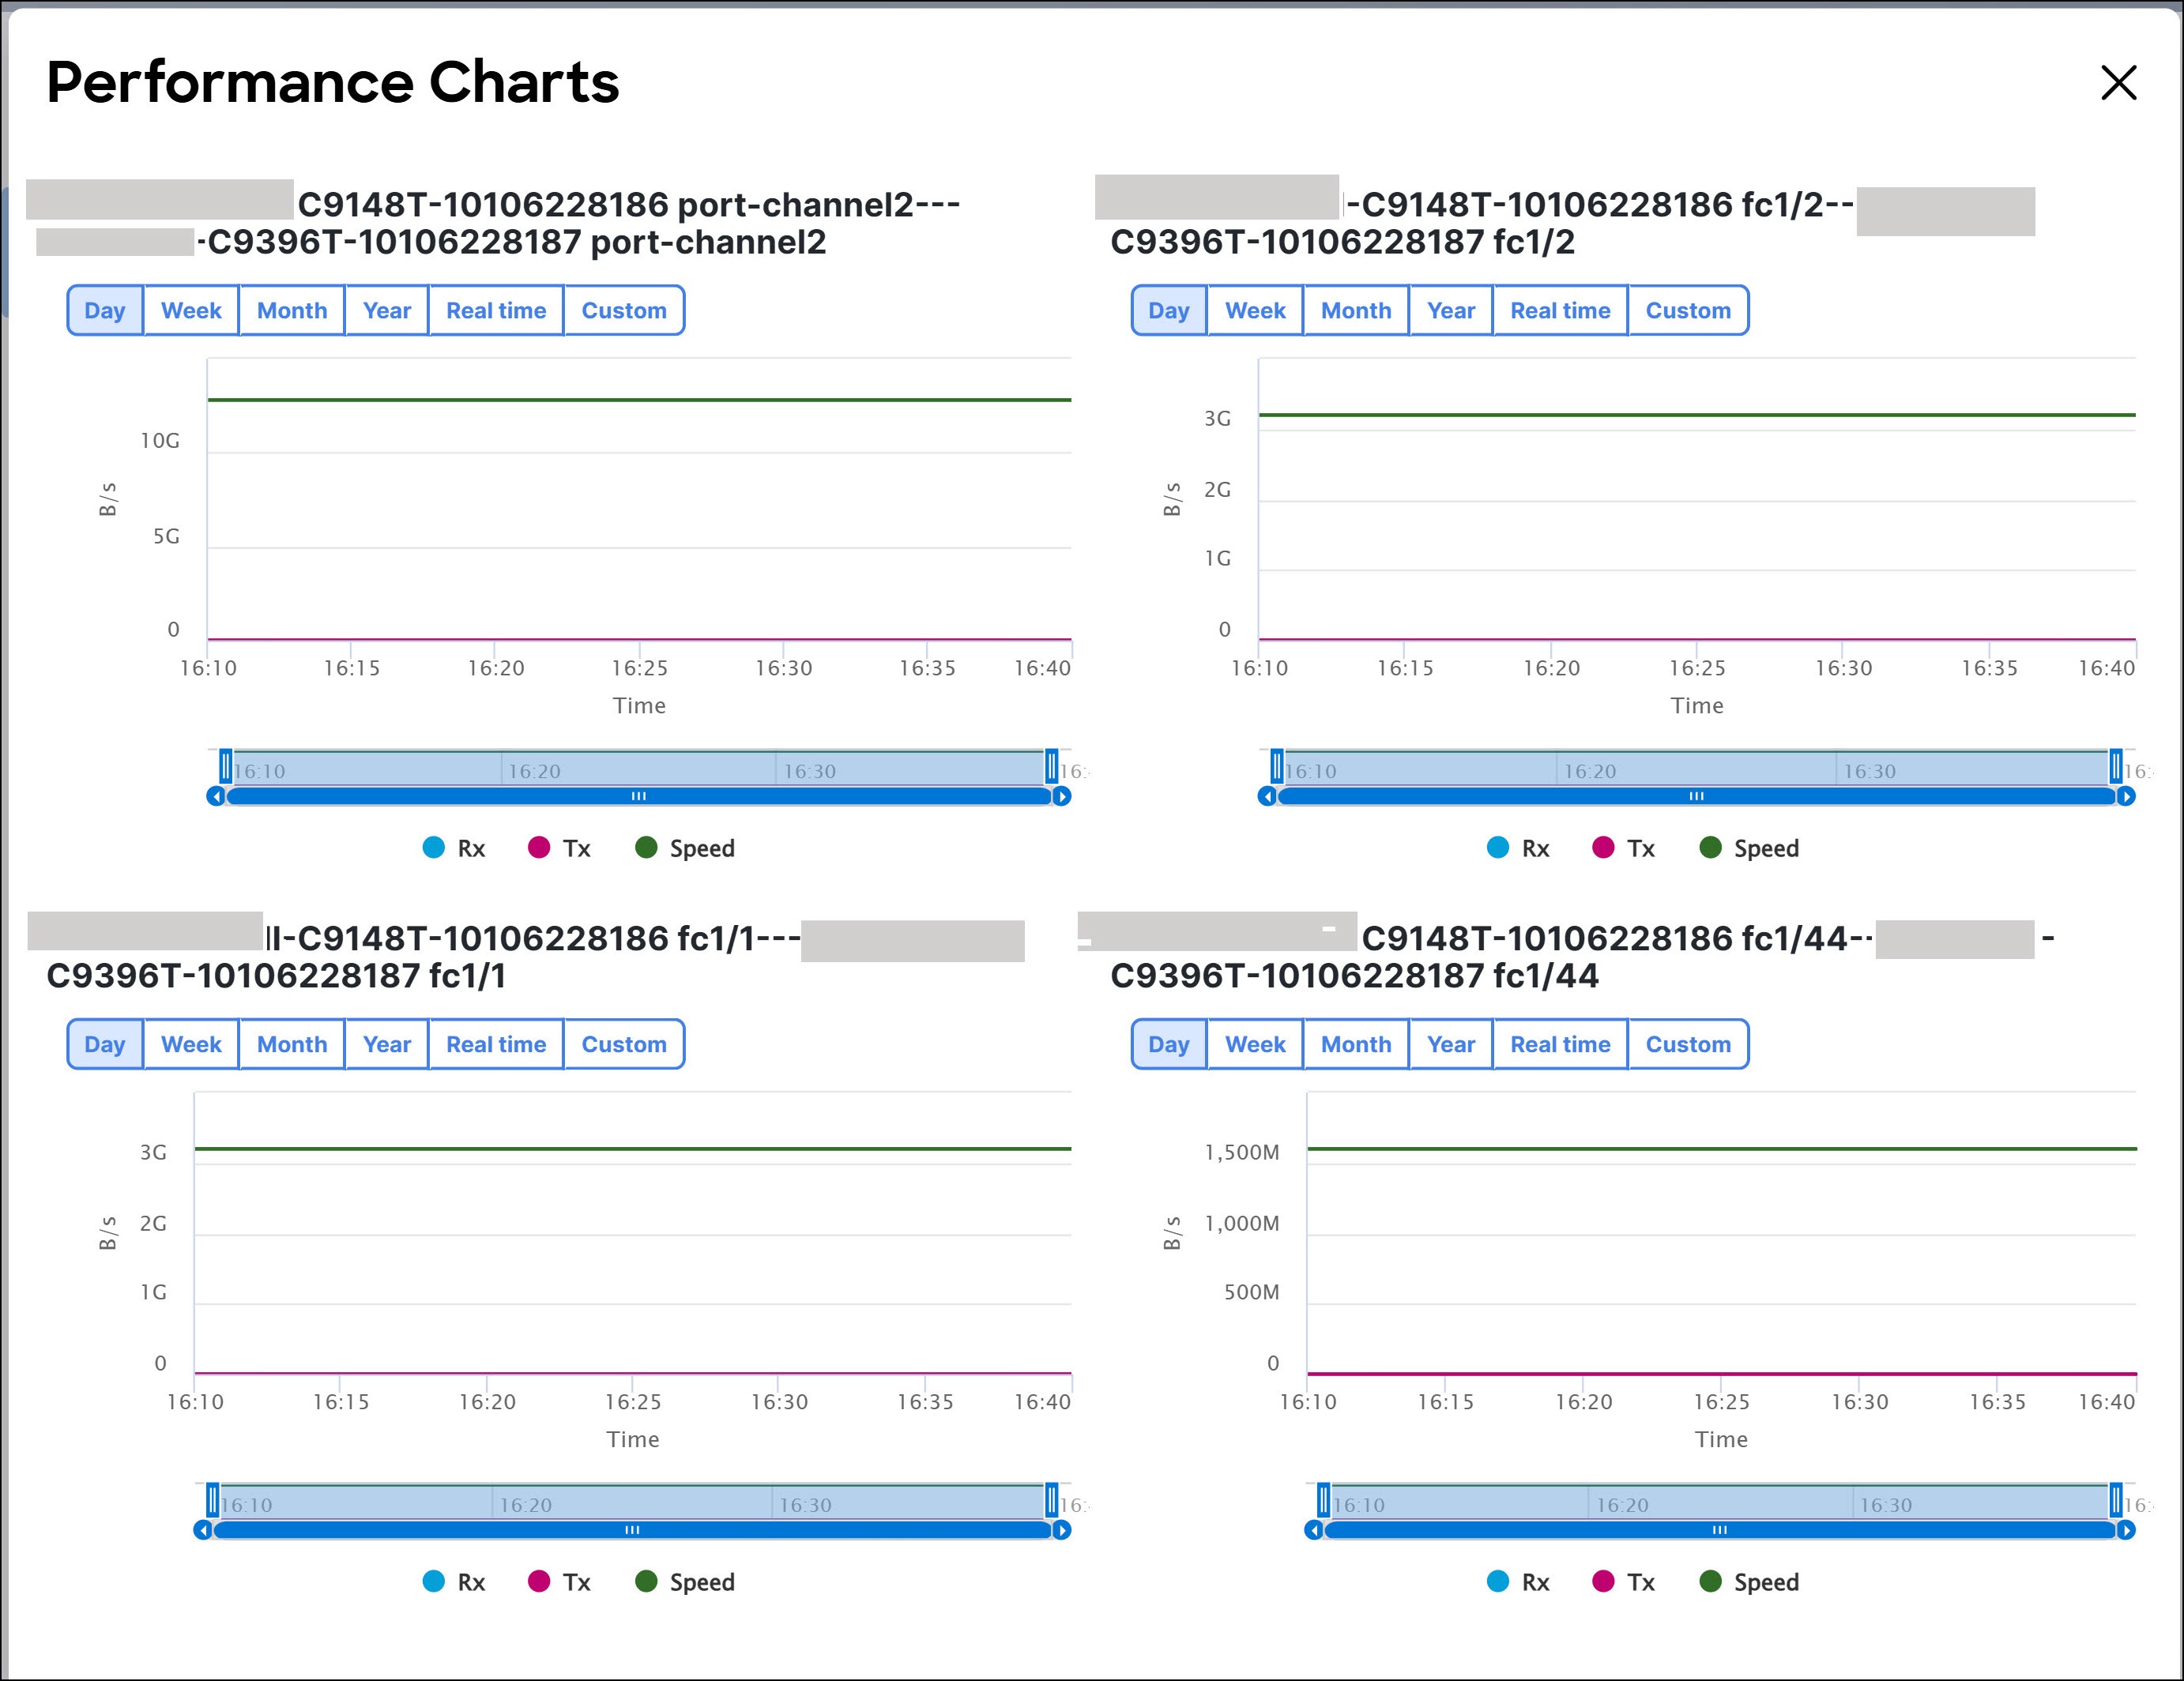
End Devices
Navigate to Manage > Inventory > End Devices to display information on devices and enclosures.
Devices
Choose Manage > Inventory > End Devices > Devices tab to display the list of host and storage devices.
Use the Show last day menu drop-down list to filter the view by Day, Week, Month, and Year.
Use the Show Host Ports menu drop-down list to filter the view by Host Ports and Storage Ports.
Use the Show Charts tab to view the performance charts for one or more fabrics. You must choose an item or multiple items listed in the Fabric column under the Devices tab before you click the Show Charts tab to view the performance chart. The Nexus Dashboard Web UI now displays multiple performance charts on a single screen if you selected multiple items.
The Show Charts tab displays 4 charts at a time. If you choose more than 4 items, the Nexus Dashboard will not display any performance charts.
The following table describes the fields that appear on Manage > Inventory > End Devices > Devices.
|
Field |
Description |
|
Fabric |
Specifies the fabric name. Click the fabric name to display the fabric status on the right-side of the page. Click the Launch icon on the top-right side of the pane to see Fabric Overview. For information on the Fabric Overview, see the section "Fabric Overview" in Understanding Fabric Overview for SAN Fabrics. |
|
Enclosure Name |
Specifies the enclosure name. |
|
Device Alias |
Specifies the device alias. Click the chart icon in the Device Alias column to view a graph of the traffic on that device according to the selected timeline. You can filter the data using the Day, Week, Month, and Year options. |
|
FCID |
Specifies the associated Fabric Channel ID (FCID). |
|
Switch interface |
Specifies the switch interface. |
|
Rx/Tx |
|
|
Avg |
Specifies the average receiving or transmitting speed. |
|
Avg % |
Specifies the average percentage of receiving or transmitting speed. |
|
Peak |
Specifies the peak utilization of the receiving or transmitting speed. |
|
Peak % |
Specifies the peak utilization percentage of the receiving or transmitting speed. |
|
Errors/Discards |
|
|
In Avg |
Specifies the average of incoming errors or discards. |
|
Out Avg |
Specifies the average of outgoing errors or discards. |
|
In Peak |
Specifies the peak of incoming errors or discards. |
|
Out Peak |
Specifies the peak of outgoing errors or discards. |
Enclosures
Choose Manage > Inventory > End Devices > Enclosures tab to display the host and storage enclosures.
Cisco Nexus Dashboard extends the fabric visibility up to the server and allows you to discover and search the end devices, SAN Storage Enclosures, and Storage Systems that are attached to the network.
Click an enclosure name in the table to view more information about the enclosure.
Storage Devices
-
In Nexus Dashboard, navigate to Manage > Inventory > Storage Devices.
The Storage Devices page displays information about storage devices.
-
To view all the storage devices or only the devices with failed links, toggle the setting between Show All Storages and Show Only Storage Devices with Down Paths.
Additionally, you can filter the enclosures based on a search criterion that you specify in the Filter by attributes field.
The following table describes the fields that appear on the Storage Devices page.
Field Description Enclosure Name
Specifies the storage name. The icon suffixed to the host name indicates the type of discovery. It displays a brown icon with fcD if the enclosure is discovered using FC discovery, or a green icon with SD if discovered using SMI-S discovery.
Click on the enclosure name to view the Storage Enclosure details.
Up/Total Paths
Displays the total available paths versus the used paths for all the devices in the enclosure.
Type
Indicates if the storage device is discovered through FC discovery or SMI-S discovery.
Peak Tx(%)
Displays the transmitting speed in percentage.
Peak Rx(%)
Displays the receiving speed in percentage.
CRC
Displays the Cyclic Redundancy Check (CRC) errors.
Corrected FEC
Displays the number of corrected Forward Error Correction (FEC) errors.
Uncorrected FEC
Displays the number of FEC errors that are not corrected.
ITW
Displays the number of Invalid Transmission Words (ITW) detected by the device.
Last Update Time
Specifies the date and time at which the storage device was last updated.
IP Address
Displays the IP address of the storage device.
Protocol
Specifies if the storage device is streaming SCSI protocol traffic or NVMe protocol traffic. This column displays data only for the devices for which data is streamed to Nexus Dashboard using SAN Insights.
Storage Overview
-
In Cisco Nexus Dashboard, go to Manage > Inventory > Storage Devices.
-
On the Storage Devices tab, double-click on any Enclosure Name item to open the Storage Overview page which provides detailed information about each storage device.
The details of a storage device depend on the type of device discovered, and the provider’s adherence to the SMI-S standards.
The tabs and their fields in the Storage Overview screen are explained in the following sections.
Summary
The Summary tab of the Storage Overview page displays information about the selected storage device, its status and path information between various storage enclosures.
|
Storage Information |
|
|
Name |
Name of the storage device. |
|
MAC Address |
Displays the MAC address of the storage device. |
|
WWNs |
Specifies the number of WorldWideNames (WWNs). |
|
IP Address |
Displays the IP address of the storage device. |
|
Protocol |
Specifies if the transmission protocol is SCSI or NVMe. |
|
OS Version |
Specifies the operating system of the storage device. |
|
FCIDs |
Specifies the associated FCID. |
|
Storage Status |
|
|
Up/Total Paths |
Displays the total available paths versus the used path details for all the devices in the enclosure. |
|
Paths |
|
|
Device Alias |
Specifies the device alias for the storage device. Check one or more items under Device Alias and click Show Charts tab to view multiple performance charts. The Nexus Dashboard Web UI displays multiple performance charts on a single screen if you selected multiple items.
The Show Charts tab displays 4 charts at a time. If you choose more than 4 items, the Nexus Dashboard will not display any performance charts. |
|
Status |
Specifies the status of the storage device. |
|
Fabric |
Displays the name of the fabric associated with the storage device. |
|
Switch Interface |
Specifies the interface on the switch that is connected with the storage device. |
|
Rx (Mbps) |
Displays the average and the maximum speed in bytes/seconds while receiving data. |
|
Tx (Mbps) |
Displays the average and the maximum speed while transmitting data. |
|
PWWN |
Specifies the assigned port WWN for the storage device. |
|
Updated Time |
Specifies the date and time at which the storage device was last updated. |
|
Topology |
Provides an end-to-end topology layout and path information between host enclosures and storage enclosures. You can hover on the device icons to see a tool tip that displays details about the device. Click on the green circle icon on the sides of the switch to display the Interface Details for the interface. It displays details about the interface. You can view performance data for the Inter-Switch Links (ISLs) and the connected storage enclosures by navigating to the Storage Overview > Summary page and clicking on the Perf. Graph button within the Topology view at the bottom of the page. When you click on the Perf. Graph button, you can see colors and percentages in the legend based on the latest record of Receive (Rx) and Transmit (Tx) usage. You can visualize performance data displayed with moving dotted lines between the connected storage enclosures. Nexus Dashboard displays the performance data in the legend of the Topology view with a color based on the latest Rx and Tx utilization percentages. If no data is available, the links display in gray. You can view a Health Graph button that displays the default topology. The Table button displays the data flow path from the host to the storage device. The Table button displays a tabular view of what is shown in the topology diagram.
The Health Graph and the Table Graph buttons do not display for SAN Insights. |
|
Custom Graphing |
Displays metrics on ECT/DAL/read/write times, active I/Os, aborts, failures etc. You can view the metrics based on two protocols, SCSI and NVMe. By default, the SCSI protocol is selected. The data is displayed for a maximum of 7 days. The refresh interval for Custom Graphing page is 5 minutes. Click on the Play icon to refresh every 5 minutes automatically. The Custom Graphing area has two tabs - Graph and Table. This is a freestyle dashboard where you can select multiple metrics and real-time data for the selected metrics is displayed in a multiline graph format and the data table displays the corresponding raw data. The data is configured to refresh every 5 minutes. You can also add multiple graphs for comparison by clicking on the Add Graph the top right. You can add a maximum of 3 graphs at a time. The Auto Refresh option is disabled by default. You must click the Play icon to enable the auto refresh. Click the Download button to download the table in .csv format. The download option is enabled only if the selected device has SAN insights feature enabled. Hover the mouse on the information (i)icon on the Initiator column. Click the icon that displays Show Flow VMs to open the Flow VMs window. You can view the VM names and IP addresses for the selected device. |
SAN Insights
The SAN Insights tab of the Storage Overview page displays the Initiator-Target (IT) pairs, topology, average and total ECT/DAL/IOPS/throughput/read/write times, VM details and the switch interface for the selected host. You can view total read/write IOPS/throughput value for the selected enclosure.
| Field | Description |
|---|---|
|
Initiator Target Pairs |
This table lists all the initiator-target pairs for the selected storage device. The flow table displays details of all the metrics on ECT/DAL/ IOPS/ Throughput/read/write times, Source Alias, SID, Destination Alias, DID, and the fabric along with their 1-hour average and baseline information. |
|
Topology |
Provides an end-to-end topology layout and path information between the host enclosures. You can view performance data for the Inter-Switch Links (ISLs) and the connected storage enclosures by clicking on the Perf. Graph button within the Topology view. When you click on the Perf. Graph button, you can see colors and percentages in the legend based on the latest record of Receive (Rx) and Transmit (Tx) usage. You can also visualize performance data displayed with moving dotted lines between the connected storage enclosures. Nexus Dashboard displays the performance data in the legend of the Topology view with a color based on the latest Rx and Tx utilization percentages. If no data is available, the links display in gray. On the View card, from the Select Layout drop-down list, you can choose one of the following layouts:
|
|
FROM: TO: |
Displays details of all the metrics on ECT/DAL/read/write times, active I/Os, IOPs and throughput along with their 1-hour average and baseline information. |
|
- |
The middle table in the bottom row displays VM name and IP address for the IT pair selected in the Initiator Target Pairs table. |
|
Switch Interface |
Click on the topology to view the associated switch interface and the 1-hour average information. |
Event Analytics
The Event Analytics tab displays all the alarms that are raised and cleared and also the events that are generated for the host devices. For more information, see Event Analytics for SAN Fabrics.
Congestion Analysis
Congestion Analysis enables you to view slow drain statistics for the storage devices. You can monitor the slow drain issue within any duration. You can view the data in a chart format and export the data for analysis. You can also view the topology that provides a high-level view of Tx wait, drops, credit loss recovery, over utilization, and port monitoring events.
Zoning
Displays the zones under which the storage device is present. Use the Show Topology icon to the left of the zone name to view the zone topology. It displays hosts and storage devices pertaining to the zone and connected to a switch.
Optics
Displays temperature, current, receiving/transmitting power and voltage data for the optics connected to the storage device.
DIRL
Displays the data collected from Dynamic Ingress Rate Limiting (DIRL) analysis for all the interfaces in the current fabric. You can view the latest DIRL data for all the configured fabrics. To get the latest DIRL data for a given fabric, select the fabric from the Fabric drop-down list and click Get latest DIRL data.
FDMI
Fabric-Device Management Interface (FDMI) retrieves management information about the attached Fiber Channel Host Bus Adapters (HBAs) and host operating systems. The FDMI table displays details about the link status, vendor, serial number, model, firmware version, and driver version of the storage device.
RDP
Read Diagnostics Parameters (RDP) displays diagnostic data from the storage devices which can be used in analyzing and troubleshooting link issues. This page displays data from the show rdp fcid [fcid_id] vsan [vsan_id] command. To view sensor related information for a particular enclosure, click the link available under the Sensors column in the table.
Not all switches support the RDP command. The switch can poll for diagnostic information from the end devices using a polling interval.
Device
This tab is available only for storage devices discovered through SMI-S discovery.
The following tabs on the Device tab provides information about the selected device.
|
Summary |
Provides information about the storage provider. Storage array serial number, storage type and number of physical disks in the array are also displayed. |
|
Components |
Lists all the components in the storage device. Click on the component Name to view total storage capacity, usage details, and physical disks details. |
|
Pools |
Lists all the pools, their status and Raw capacity. Double-click the POOL Name to view the pool details. |
|
LUNs |
Lists all the Logical Unit Numbers (LUN) in the storage array. It provides LUN ID, WWN, Status, and Capacity details for each LUN. Click on LUN Name to view further details about each LUN. Double-click a LUN Name to access the LUN Detail page. Host Interface, Zoning, and Storage Interface values in Host LUN Access table is displayed only if the host accessing this LUN is part of the Nexus Dashboard discovered fabric. |
|
Host |
Lists all the hosts in the selected storage. It provides the Host Name, Node WWN, and WWN details for each host in the Storage array. Click on a Host Name to view details about the host. You can view the relevant details on the LUNs tab and Ports tab within the Host Detail view. Fabric and Host Interface values in Host Ports table is displayed only if Host Port WWN is part of the Nexus Dashboard discovered fabric. |
|
Processors |
Lists all the processors and their status. It also displays the number of adapters for each processor. Double-click a Processor Name to open the Processor Detail page. |
|
Ports |
Lists all the ports in the storage device. Click the Port Name to view details about a port. |
Storage Providers
The Storage Providers page displays the status of the Storage Management Initiative Specification (SMI-S) storage providers. An SMI-S provider can manage more than one array. Each array appears as a separate storage enclosure in the Storage Providers tab. These enclosure names are suffixed with a green icon with a Secure Digital (SD) label indicating that the device is discovered using SMI-S discovery.
In Cisco Nexus Dashboard, go to the Admin > Integrations > Storage Providers tab.
The following table describes the fields that appear on the Storage Providers tab.
|
Field |
Description |
|
Vendor |
Specifies the vendor. Cisco Nexus Dashboard supports the following vendors:
|
|
Provider URL |
Specifies the SMI-S provider URL. |
|
Name Space |
Specifies the name space. |
|
Interop Name Space |
Specifies the interop name space. |
|
Port |
Specifies the port. |
|
Status |
Specifies the status. |
|
Secure |
Specifies if it is a secure connection. |
|
Discovery Status |
Specifies the discovery status. |
|
Last Updated Time |
Specifies the last updated time. |
The following table describes the action items, in the Actions drop-down list, that appear on the Admin > Integrations > Storage Providers page.
|
Action |
Description |
|
Add Provider |
Adds an SMI-S provider. For instructions, refer to Adding SMI-S Provider. |
|
Edit Provider |
Allows you to edit an SMI-S provider. To edit, select a provider from the table and choose Edit Provider. |
|
Delete Provider |
Allows you to delete a provider from the list. To delete, select a provider from the table and choose Delete Provider. |
|
Rediscover Provider |
Allows you to rediscover a provider. Select a provider from the table and choose Rediscover Provider to scan for any changes. This triggers the discovery cycle outside its normal periodic polling. |
|
Purge Provider |
Allows you to purge the provider information. To purge, select a provider from the table and choose Purge Provider. This removes elements that are no longer available through discovery. |
Adding SMI-S Provider
To add an SMI-S provider from the Cisco Nexus Dashboard, perform the following steps:
-
Choose the Admin > Integrations > Storage Providers tab.
-
Choose Actions > Add Provider.
The Add SMI-S page displays.
-
In the Vendor drop-down list, choose a vendor name.
All the supported vendors are available in the drop-down list. More SMI-S storage vendors are discovered through a 'best effort' handler using the Other vendor option in the drop-down list.
A minimum of one valid Nexus Dashboard license must be provisioned before adding the data sources for SMI-S storage discovery.
-
Specify the SMI-S Server IP, User Name, and Password.
-
Specify the Name Space and Interop Name Space.
-
By default, the Port number is prepopulated.
If you select the Secure check box, then the default secure port number is populated.
When using the Secure mode with EMC, the default setting is mutual authentication. For more information, see the EMC documentation about adding an SSL certificate to their trust store. Also, you can set the SSLClientAuthentication value to None in the Security_Settings.xml configuration file and restart the ECOM service.
-
Click Add.
The credentials are validated and the storage discovery starts if the credential is valid. If the credentials check fails, you will be prompted to enter valid credentials.
Hosts
To view a list of SAN hosts and their relevant details from the Nexus Dashboard Web UI, perform the following steps:
-
In Nexus Dashboard, navigate to Manage > Inventory > Hosts.
The Hosts page displays a list of available host devices, their network attributes and the associated Virtual Machines (VMs).
To view all the hosts or only the hosts with failed links, toggle the setting between Show All Hosts and Show Only Hosts with Down Paths. Additionally, you can filter the enclosures based on a search criteria that you specify in the Filter by attributes field.
The following table describes the fields that appear on the Hosts page.
Field
Description
Enclosure Name
Displays the name of the host device. The icon next to the host name displays the type of discovery. It displays if the enclosure is from a vCenter or storage or FC discovery.
Up/Total Paths
Displays the total available paths versus the used path details for all the devices in the selected enclosure.
Type
Indicates if a host or storage is discovered through fabric discovery or vCenter discovery.
Total VMs
Displays the total number of VMs.
Peak Tx(%)
Displays the maximum transmitting speed in percentage.
Peak Rx(%)
Displays the maximum receiving speed in percentage.
CRC
Specifies Cyclic Redundancy Check (CRC) errors.
Corrected FEC
Displays the number of corrected Forward Error Correction (FEC) errors.
Uncorrected FEC
Displays the number of FEC errors that are not corrected.
ITW
Displays the number of Invalid Transmission Words (ITW) detected by the port.
Last Update Time
Specifies the date and time at which the host device was last updated.
IP Address
Displays the IP address of the device.
Protocol
Specifies if the host is streaming SCSI protocol traffic or NVMe protocol traffic. This column displays data only for the Hosts for which data is streamed to Nexus Dashboard using SAN Insights.
-
Click on a host name displayed under the Enclosure Name column.
The Host enclosure slide-out pane appears.
-
Click the Launch icon to view detailed information related to that particular host.
The Host Overview page appears. The tabs and their fields in the screen are explained in the following sections.
Summary
The Summary tab of the Host Overview page displays information about the selected host device, its status and path information between various hosts enclosures.
|
Host Information |
|
|
Name |
Name of the host device. |
|
MAC Address |
Displays the MAC address of the host device. |
|
WWNs |
Specifies the number of WorldWideNames (WWNs). |
|
IP Address |
Displays the IP address of the host device. |
|
Protocol |
Specifies if the transmission protocol is SCSI or NVMe. |
|
OS Version |
Specifies the operating system of the host device. |
|
FCIDs |
Specifies the associated FCID. |
|
Host Status |
|
|
Up/Total Paths |
Displays the total number of paths available versus the number of paths used by the host devices. |
|
Alarms |
Displays the number of alarms generated, if any. |
|
VM Usage |
Displays the number of VMs in use. |
|
Events |
Displays the number of events that are generated for the host device. |
|
Paths |
|
|
Device Alias |
Specifies the device alias for the host device. Check one or more items under Device Alias and click Show Charts tab to view multiple performance charts. The Nexus Dashboard Web UI displays multiple performance charts on a single screen if you selected multiple items.
The Show Charts tab displays 4 charts at a time. If you choose more than 4 items, the Nexus Dashboard will not display any performance charts. |
|
Status |
Specifies the status of the host device. |
|
Fabric |
Displays the name of the SAN fabric. |
|
Switch Interface |
Specifies the interface on the switch that is connected with the end device. |
|
Rx (Mbps) |
Displays the average and the maximum speed in bytes/sec while receiving data. |
|
Tx (Mbps) |
Displays the average and the maximum speed while transmitting data/ |
|
PWWN |
Specifies the assigned port WWN for the host. |
|
Updated Time |
Specifies the date and time at which the host device was last updated. |
|
Topology |
Provides an end-to-end topology layout and path information between host enclosures and storage enclosures. You can hover on the device icons to see a tool tip that displays details about the device. Click on the green circle icon on the sides of the switch to display the Interface Details for the interface. It displays details about the interface. You can view performance data for the Inter-Switch Links (ISLs) and the connected host enclosures by navigating to the Host Overview > Summary page and clicking on the Perf. Graph button within the Topology view at the bottom of the page. When you click on the Perf. Graph button, you can see colors and percentages in the legend based on the latest record of Receive (Rx) and Transmit (Tx) usage. You can also visualize performance data displayed with moving dotted lines between the connected host enclosures. Nexus Dashboard displays the performance data in the legend of the Topology view with a color based on the latest Rx and Tx utilization percentages. If no data is available, the links display in gray. You can view a Health Graph button that displays the default topology. The Table button displays the data flow path from the host to the storage device. The Table button displays a tabular view of what is shown in the topology diagram.
The Health Graph and the Table Graph buttons do not display for SAN Insights. |
|
Custom Graphing |
Displays metrics on ECT/DAL/read/write times, active I/Os, aborts, failures etc. You can view the metrics based on two protocols, SCSI and NVMe. By default, the SCSI protocol is selected. The data is displayed for a maximum of 7 days. The refresh interval for the Custom Graphing page is 5 minutes. Click on the Play icon to refresh every 5 minutes automatically. The Custom Graphing area has two tabs - Graph and Table. This is a freestyle dashboard where you can select multiple metrics and real-time data for the selected metrics is displayed in a multiline graph format and the data table displays the corresponding raw data. The data is configured to refresh every 5 minutes. You can also add multiple graphs for comparison by clicking on Add Graph on the top right. You can add up to 3 graphs at a time. The Auto Refresh option is disabled by default. You must click the Play icon to enable the auto refresh. Click the Download button to download the table in .csv format. The download option is enabled only if the selected host has SAN insights feature enabled. Hover the mouse on the information (i)icon on the Initiator column. Click the icon that displays Show Flow VMs to open the Flow VMs window. You can view the VM names and IP addresses for the selected host. |
SAN Insights
The SAN Insights tab of the Host Overview page displays the Initiator-Target (IT) pairs, topology, average and total ECT/DAL/IOPS/throughput/read/write times, VM details and the switch interface for the selected host. You can view total read/write IOPS/throughput value for the selected host enclosure.
| Field | Description |
|---|---|
|
Initiator Target Pairs |
This table lists all the initiator-target pairs for the selected host. The flow table shows the details of all the metrics on ECT/DAL/ IOPS/ Throughput/read/write times, Source Alias, SID, Destination Alias, DID, and the fabric along with their 1-hour average and baseline information. |
|
Topology |
Provides an end-to-end topology layout and path information between the host enclosures. You can view performance data for the Inter-Switch Links (ISLs) and the connected storage enclosures by clicking on the Perf. Graph button within the Topology view. When you click on the Perf. Graph button, you can see colors and percentages in the legend based on the latest record of Receive (Rx) and Transmit (Tx) usage. You can also visualize performance data displayed with moving dotted lines between the connected host enclosures. Nexus Dashboard displays the performance data in the legend of the Topology view with a color based on the latest Rx and Tx utilization percentages. If no data is available, the links display in gray. On the View card, from the Select Layout drop-down list, you can choose one of the following layouts:
|
|
FROM: TO: |
Displays details of all the metrics on ECT/DAL/read/write times, active I/Os, IOPs and throughput along with their 1-hour average and baseline information. |
|
- |
The middle table in the bottom row displays VM name and IP address for the IT pair selected in the Initiator Target Pairs table. |
|
Switch Interface |
Click on the interface icon (green circle) on the topology view to view details for the selected interface on the host device. |
Event Analytics
The Event Analytics tab displays all the alarms that are raised and cleared and also the events that are generated for the host devices.
Congestion Analysis
Congestion Analysis enables you to view slow drain statistics for the hosts. You can monitor the slow drain issue within any duration. You can view the data in a chart format and export the data for analysis. You can also view the topology that provides a high-level view of Tx wait, drops, credit loss recovery, over utilization, and port monitoring events.
Zoning
Displays the zones under which the host device is present. Use the Show Topology icon to the left of the zone name to view the zone topology. It displays hosts and storage devices pertaining to the zone and connected to a switch.
Optics
Displays temperature, current, receiving/transmitting power and voltage data for the optics connected to the switch.
DIRL
Displays the data collected from Dynamic Ingress Rate Limiting (DIRL) analysis for all the interfaces in the current fabric. You can view the latest DIRL data for all the configured fabrics. To get the latest DIRL data for a given fabric, select the fabric from the Fabric drop-down list and click Get latest DIRL data.
FDMI
Fabric-Device Management Interface (FDMI) retrieves management information about the attached Fibre Channel Host Bus Adapters (HBAs) and host operating systems. The FDMI table displays details about the link status, vendor, serial number, model, firmware version, and driver version.
RDP
Read Diagnostics Parameters (RDP) displays diagnostic data from the switch and the connected end devices which can be used in analyzing and troubleshooting link issues. Displays data from the show rdp fcid [fcid_id] vsan [vsan_id] command. To view sensor related information for a particular enclosure, click the link available under the Sensors column in the table.
Not all switches support the RDP command. The switch can poll for diagnostic information from the end devices using a polling interval.
VMs
Displays details about the virtual machines that are configured on the host device.
The following table describes the information available in the VMs tab.
|
Name |
Displays the name of the VM. |
|
OS |
Displays the version of the OS that the VM is running on. |
|
IP |
Displays the IP address for the VM. |
|
MAC Address(es) |
Displays the MAC addresses for the VMs. |
|
#CPU |
Displays the number of CPUs associated with the VM. |
|
Memory |
Displays the amount of memory associated with the VM. |
|
Rx Utilization % |
Displays the Receive (Rx) and Transmit (Tx) Utilization percentage of the bandwidth of the links for the host:
|
|
Tx Utilization % |
|
|
Read |
Displays the read information for the VM. |
|
Write |
Displays the write information for the VM. |
|
Status |
Displays the status information for the VM. |
|
Data Store |
Displays the data store information for the VM. |
Select a VM from the table, and beneath the table, graphs are available that display VM charts for CPU & Memory, Disk I/O, and VM Flows for the selected virtual machine.
Inventory
Choose Manage > Inventory > End Devices > Enclosures> Inventory > Host Enclosures tab to display the host and storage inventory enclosures.
Inventory - Host Enclosures
The following table describes the fields that appear on Manage > Inventory > End Devices > Enclosures> Inventory > Host Enclosures.
|
Field |
Description |
|
Enclosure |
Specifies the enclosure name. Click the enclosure name for more information. |
|
OS |
Specifies the OS details. |
|
IP Address |
Specifies the IP address of the switch. |
|
WWNs |
Specifies the number of World Wide Names (WWNs). |
The following table describes the action items, in the Actions menu drop-down list, that appear on Manage > Inventory > End Devices > Enclosures> Inventory > Host Enclosures.
|
Action Item |
Description |
|
Edit |
Select an enclosure from the table and choose Edit to update the enclosure information. |
|
Change to Storage Enclosure |
Select an enclosure from the table and choose Change to Storage Enclosure to change the selected enclosure to storage enclosure. |
|
Import |
Allows you to import enclosures data. |
|
Export |
Allows you to export host and storage enclosures data in your inventory to your local directory in .txt file format. |
Importing or Exporting Inventory Enclosures Data
You can import and export enclosures data to a .txt file. This feature allows you to edit the exported file, and import the data to Nexus Dashboard. You can either choose to export All or Only Host Enclosures or Only Storage Enclosures data. You can also choose one Fabric or All fabrics' data while exporting.
To export Inventory Enclosures data, perform the following steps:
-
On either Host Enclosures or Storage Enclosures tab, from the Actions drop-down list, select Export.
-
Select the enclosures to export data. You can choose All or Only Host Enclosures or Only Storage Enclosures.
-
In the Exported File Name field, provide the name of the exported file.
The export file is of .txt format only.
-
From Fabric scope drop-down list, choose All Fabrics or specific Fabric from which you must export enclosures data.
-
Click Export to download the enclosures data.
Save the exported file to a local directory.
To import Inventory Enclosures data, perform the following steps:
-
On either Host Enclosures or Storage Enclosures tab, from the Actions drop-down list, select Import.
-
Upload the data file from your local directory. You can either drag and drop the file, or browse to upload the data file.
You can import data from .txt file format only.
The uploaded file appears in the Import Enclosures area.
-
Click OK to import the enclosures data. Click Cancel the discard.
Inventory - Storage Enclosures
The following table describes the fields that appear on Manage > Inventory > End Devices > Enclosures> Inventory > Storage Enclosures.
|
Field |
Description |
|
Enclosure |
Specifies the enclosure name. Click the enclosure name for more information. |
|
IP Address |
Specifies the IP address of the switch. |
|
WWNs |
Specifies the number of World Wide Names (WWNs). |
The following table describes the action items, in the Actions menu drop-down list, that appear on Manage > Inventory > End Devices > Enclosures> Inventory > Storage Enclosures.
|
Action Item |
Description |
|
Edit |
Select an enclosure from the table and choose Edit to update the enclosure information. |
|
Change to Host Enclosure |
Select an enclosure from the table and choose Change to Host Enclosure to change the selected enclosure to host enclosure. |
|
Import |
Allows you to import enclosures data. |
|
Export |
Allows you to export host and storage enclosures data in your inventory to your local directory in .txt file format. |
Importing or Exporting Inventory Enclosures data
You can import and export enclosures data to a .txt file. This feature allows you to edit the exported file, and import the data to Nexus Dashboard. You can either choose to export All or Only Host Enclosures or Only Storage Enclosures data. You can also choose one Fabric or All fabrics' data while exporting.
To export Inventory Enclosures data, perform the following steps:
-
On either Host Enclosures or Storage Enclosures tab, from the Actions drop-down list, select Export.
-
Select the enclosures to export data. You can choose All or Only Host Enclosures or Only Storage Enclosures.
-
In the Exported File Name field, provide the name of the exported file.
The export file is of .txt format only.
-
From Fabric scope drop-down list, choose All Fabrics or specific Fabric from which you must export enclosures data.
-
Click Export to download the enclosures data.
Save the exported file to a local directory.
To import Inventory Enclosures data, perform the following steps:
-
On either Host Enclosures or Storage Enclosures tab, from the Actions drop-down list, select Import.
-
Upload the data file from your local directory. You can either drag and drop the file, or browse to upload the data file.
You can import data from .txt file format only.
The uploaded file appears in the Import Enclosures area.
-
Click OK to import the enclosures data. Click Cancel the discard.
Performance
Choose Manage > Inventory > End Devices > Enclosures> Performance > Host Enclosures tab to display the host and storage performance enclosures.
Performance - Host Enclosures
Choose Manage > Inventory > End Devices > Enclosures > Performance > Host Enclosures tab to display the list of host enclosures.
Use the Show last day menu drop-down list to filter the view by Day, Week, Month, and Year.
Use the Show Charts tab to view the performance charts for one or more enclosures. You must choose an item or multiple items listed in the Enclosure Name column under the Host Enclosures tab before you click the Show Charts tab to view the performance chart. The Nexus Dashboard Web UI now displays multiple performance charts on a single screen if you selected multiple items.
The Show Charts tab displays 4 charts at a time. If you choose more than 4 items, the Nexus Dashboard will not display any performance charts.
The following table describes the fields that appear on Manage > Inventory > End Devices > Enclosures > Performance > Host Enclosures.
|
Field |
Description |
|
Enclosure Name |
Specifies the enclosure name. Click the enclosure name to view more information. Click the chart icon to view a graph of the traffic on that device according to the selected timeline. You can filter the data using the Day, Week, Month, and Year options. |
|
Rx/Tx/Errors/Discards |
|
|
Avg |
Specifies the average receiving, transmitting, errors, or discards speed. |
|
Peak |
Specifies the peak utilization of the receiving, transmitting, errors, or discards speed. |
|
Rx + Tx |
Specifies the sum of receiving and transmitting speeds. |
|
Last Updated |
Specifies the last updated time. |
Performance - Storage Enclosures
Choose Manage > Inventory > End Devices > Enclosures> Inventory > Storage Enclosures tab to display the storage enclosures.
Use the Show last day menu drop-down list to filter the view by Day, Week, Month, and Year.
Use the Show Charts tab to view the performance charts for one or more enclosures. You must choose an item or multiple items listed in the Enclosure Name column under the Storage Enclosure tab before you click the Show Charts tab to view the performance chart. The Nexus Dashboard Web UI now displays multiple performance charts on a single screen if you selected multiple items.
The Show Charts tab displays 4 charts at a time. If you choose more than 4 items, the Nexus Dashboard will not display any performance charts.
The following table describes the fields that appear on Manage > Inventory > End Devices > Enclosures> Inventory > Storage Enclosures.
|
Field |
Description |
|
Enclosure Name |
Specifies the enclosure name. |
|
Rx/Tx/Errors/Discards |
|
|
Avg |
Specifies the average receiving, transmitting, errors, or discards speed. |
|
Peak |
Specifies the peak utilization of the receiving, transmitting, errors, or discards speed. |
|
Last Updated |
Specifies the last updated time. |
Enclosure Members
The following table describes the fields that appear on Manage > Inventory > End Devices > Enclosures > Performance. Enclosure members can be viewed for Host and Storage performance enclosures. Use the Show last day menu drop-down list to filter the view by Day, Week, Month, and Year.
|
Field |
Description |
|
Fabric |
Specifies the fabric name. Click the name to view information about fabric health on the right-side of the page. |
|
Device |
Specifies the device name. |
|
Speed |
Specifies the device speed. |
|
Rx/Tx |
|
|
Avg |
Specifies the average receiving or transmitting speed. |
|
Avg % |
Specifies the average percentage of receiving or transmitting speed. |
|
Peak |
Specifies the peak utilization of the receiving, or transmitting speed. |
|
Peak % |
Specifies the peak utilization percentage of the receiving or transmitting speed. |
|
Errors/Discards |
|
|
Avg |
Specifies the average errors or discards speed. |
|
Peak |
Specifies the peak utilization of the errors or discards speed. |
|
Last Updated |
Specifies the last updated time. |
Copyright
THE SPECIFICATIONS AND INFORMATION REGARDING THE PRODUCTS IN THIS MANUAL ARE SUBJECT TO CHANGE WITHOUT NOTICE. ALL STATEMENTS, INFORMATION, AND RECOMMENDATIONS IN THIS MANUAL ARE BELIEVED TO BE ACCURATE BUT ARE PRESENTED WITHOUT WARRANTY OF ANY KIND, EXPRESS OR IMPLIED. USERS MUST TAKE FULL RESPONSIBILITY FOR THEIR APPLICATION OF ANY PRODUCTS.
THE SOFTWARE LICENSE AND LIMITED WARRANTY FOR THE ACCOMPANYING PRODUCT ARE SET FORTH IN THE INFORMATION PACKET THAT SHIPPED WITH THE PRODUCT AND ARE INCORPORATED HEREIN BY THIS REFERENCE. IF YOU ARE UNABLE TO LOCATE THE SOFTWARE LICENSE OR LIMITED WARRANTY, CONTACT YOUR CISCO REPRESENTATIVE FOR A COPY.
The Cisco implementation of TCP header compression is an adaptation of a program developed by the University of California, Berkeley (UCB) as part of UCB’s public domain version of the UNIX operating system. All rights reserved. Copyright © 1981, Regents of the University of California.
NOTWITHSTANDING ANY OTHER WARRANTY HEREIN, ALL DOCUMENT FILES AND SOFTWARE OF THESE SUPPLIERS ARE PROVIDED “AS IS" WITH ALL FAULTS. CISCO AND THE ABOVE-NAMED SUPPLIERS DISCLAIM ALL WARRANTIES, EXPRESSED OR IMPLIED, INCLUDING, WITHOUT LIMITATION, THOSE OF MERCHANTABILITY, FITNESS FOR A PARTICULAR PURPOSE AND NONINFRINGEMENT OR ARISING FROM A COURSE OF DEALING, USAGE, OR TRADE PRACTICE.
IN NO EVENT SHALL CISCO OR ITS SUPPLIERS BE LIABLE FOR ANY INDIRECT, SPECIAL, CONSEQUENTIAL, OR INCIDENTAL DAMAGES, INCLUDING, WITHOUT LIMITATION, LOST PROFITS OR LOSS OR DAMAGE TO DATA ARISING OUT OF THE USE OR INABILITY TO USE THIS MANUAL, EVEN IF CISCO OR ITS SUPPLIERS HAVE BEEN ADVISED OF THE POSSIBILITY OF SUCH DAMAGES.
Any Internet Protocol (IP) addresses and phone numbers used in this document are not intended to be actual addresses and phone numbers. Any examples, command display output, network topology diagrams, and other figures included in the document are shown for illustrative purposes only. Any use of actual IP addresses or phone numbers in illustrative content is unintentional and coincidental.
The documentation set for this product strives to use bias-free language. For the purposes of this documentation set, bias-free is defined as language that does not imply discrimination based on age, disability, gender, racial identity, ethnic identity, sexual orientation, socioeconomic status, and intersectionality. Exceptions may be present in the documentation due to language that is hardcoded in the user interfaces of the product software, language used based on RFP documentation, or language that is used by a referenced third-party product.
Cisco and the Cisco logo are trademarks or registered trademarks of Cisco and/or its affiliates in the U.S. and other countries. To view a list of Cisco trademarks, go to this URL: https://www.cisco.com/go/trademarks. Third-party trademarks mentioned are the property of their respective owners. The use of the word partner does not imply a partnership relationship between Cisco and any other company. (1110R)
© 2017-2025 Cisco Systems, Inc. All rights reserved.