
New and changed information
The following table provides an overview of the significant changes up to this current release. The table does not provide an exhaustive list of all changes or of the new features up to this release.
| Release Version | Feature | Description |
|---|---|---|
|
Nexus Dashboard 4.1.1 |
Improved navigation and workflow when reviewing system status |
Beginning with Nexus Dashboard 4.1.1, the navigation and workflow when reviewing system status in Nexus Dashboard have been enhanced. |
|
Nexus Dashboard 4.1.1 |
Support for cluster advisories |
Beginning with Nexus Dashboard 4.1.1, system status includes advisories for cluster nodes. While this release includes no active advisories for the current hardware version, Nexus Dashboard manages updates through metadata. For more information, see Advisories. |
Overview
-
Navigate to Overview in System Status.
Admin > System Status > Overview.
-
Review the information in Overview.
Field Description Anomaly level
Provides Nexus Dashboard-level anomaly information. Click the Anomaly level tile to navigate directly to the Anomalies tab in System Status. See Anomalies for more information.
Connectivity to Intersight
Provides the status for connectivity to Intersight. Click Setup Intersight to navigate to the Intersight Device Connector area. See Working With Intersight for more information.
Fabrics
Show this information:
-
The number of fabrics currently onboarded in your Nexus Dashboard
-
The connectivity status of those fabrics
-
The fabric types of all the fabrics in your Nexus Dashboard
-
The license tiers used by the fabrics in your Nexus Dashboard
Click View all to navigate directly to Manage > Fabrics.
Cluster nodes
Provides information on the nodes that are currently part of the cluster and the health status for those nodes. Click View all to navigate directly to Nodes in System Status. See Nodes for more information.
-
Nodes
-
Navigate to Nodes in System Status.
Admin > System Status > Nodes.
-
Review the information provided in Nodes.
Field Description Utilization
Provides utilization information for CPU, memory, and storage. See Storage utilization for more information.
Nodes by status
Provides additional information on each node in the cluster. Click Add node to add a node to the cluster. See Add nodes for more information.
Storage utilization
The Storage utilization value is the average allocated storage percentage of all nodes in the Nexus Dashboard cluster. It reflects disk-level allocation, not filesystem usage. This value is expected to remain stable and does not increase or decrease unless a feature or service in the cluster changes.
A high storage utilization value does not necessarily indicate a cluster issue. To verify cluster health, use the acs health command.
Add nodes
-
In Nodes in System Status, click Actions > Add node.
The Add node page opens.
-
In the Deployment details area, provide the credentials information for the node, then click Validate.
-
For physical nodes, this is the IP address, username, and password of the server’s CIMC. The CIMC will be used to configure the rest of the information on the node.
-
For virtual nodes, this is the IP address and rescue-user password you defined for the node when deploying it.
-
-
In the General area:
-
Provide the name and serial number of the node.
-
From the Type dropdown, choose Secondary.
-
-
In the Management network area, provide the management network information.
-
For physical nodes, you must provide the management network IP address, netmask, and gateway now.
-
For virtual nodes, the management network information will be pre-populated with the information pulled from the node based on the IP address and credentials you provided in the previous sub-step.
-
-
In the Data network area, provide the data network information.
You must provide the data network IP address, netmask, and gateway. Optionally, you can also provide the VLAN ID for the network. For most deployments, you can leave the VLAN ID field blank.
-
(Optional) Provide IPv6 information for the management and data networks.
-
Nexus Dashboard supports dual stack IPv4/IPv6 for the management and data networks.
-
If you want to provide IPv6 information, you must do it when adding the node.
-
All nodes in the cluster must be configured with either only IPv4 or dual IPv4/IPv6 stack.
-
-
In the Enable BGP field, click the toggle to enable this feature, if necessary.
-
Click Save to add the node.
The configuration will be pushed to the node and the node will be added to the list in the GUI.
Managing secondary nodes
You can add a number of secondary nodes to an existing 3-node cluster for horizontal scaling to enable application co-hosting.

-
Secondary nodes are not supported for cloud form factors of Nexus Dashboard clusters deployed in AWS or Azure.
-
Secondary nodes are qualified for IPFM fabric types. For more information about IPFM fabrics, see Editing IP Fabric for Media (IPFM) Fabric Settings.
Add secondary nodes
This section describes how to add a secondary node to your cluster to enable horizontal scaling.
-
Ensure that the existing primary nodes and the cluster are healthy.
-
Prepare and deploy the new node.
-
Ensure that the node you are adding is powered on.
-
If you are adding a physical node, ensure that you have the new node’s CIMC IP address and login information.
You will need to use the CIMC information to add the new node using the Nexus Dashboard GUI.
-
If you are adding a virtual node, ensure that you have the node’s management IP address and login information.
To add a secondary node:
-
Navigate to Nodes in System Status.
Admin > System Status > Nodes.
-
In the main pane, click Actions > Add node.
The Add Node page opens.
-
In the Add Node screen, provide the node information.
-
In the Deployment details area, provide the credentials information for the node, then click Validate.
-
For physical nodes, this is the IP address, username, and password of the server’s CIMC. The CIMC will be used to configure the rest of the information on the node.
-
For virtual nodes, this is the IP address and
rescue-userpassword you defined for the node when deploying it.
-
-
In the General area, provide the name and serial number of the node.
-
From the Type dropdown, choose
Secondary. -
Provide the Management network information.
For virtual nodes, the management network information will be pre-populated with the information pulled from the node based on the IP address and credentials you provided in the previous sub-step.
For physical nodes, you must provide the management network IP address, netmask, and gateway now.
-
Provide the Data network information.
You must provide the data network IP address, netmask, and gateway. Optionally, you can also provide the VLAN ID for the network. For most deployments, you can leave the VLAN ID field blank.
-
(Optional) Provide IPv6 information for the management and data networks.
Nexus Dashboard supports dual stack IPv4/IPv6 for the management and data networks.
If you want to provide IPv6 information, you must do it when adding the node.
All nodes in the cluster must be configured with either only IPv4 or dual IPv4/IPv6 stack.
-
In the Enable BGP field, click the toggle to enable this feature, if necessary.
-
-
Click Save to add the node.
The configuration will be pushed to the node and the node will be added to the list in the GUI.
Delete a secondary node
-
Ensure that the primary nodes and the cluster are healthy.
To delete an existing secondary node:
-
Navigate to Nodes in System Status.
Admin > System Status > Nodes.
-
Select the checkbox next to the secondary node you want to delete.
-
From the Actions menu, choose Delete to delete the node.
Managing standby nodes
You can add up to two standby nodes, which you can use to quickly restore the cluster functionality in case one or more primary nodes fail by replacing the failed primary node with the standby node.
Standby nodes are similar to secondary nodes in deployment, initial configuration, and upgrades. However, unlike secondary nodes, the cluster will not use the standby nodes for any workloads.
Standby nodes are not supported for single-node clusters or clusters deployed in AWS or Azure.
The following two cases are supported:
-
Single primary node failure
You can use the UI to convert the standby node into a new primary node.
-
Two primary nodes failure
You will need to perform manual failover of one of the nodes to restore cluster functionality. Then fail over the second node using standard procedure.
Add standby nodes
This section describes how to add a standby node to your cluster for easy cluster recover in case of a primary node failure.
-
Ensure that the existing primary nodes and the cluster are healthy.
-
Prepare and deploy the new node.
You can failover only between nodes of identical types (physical or virtual), so you must deploy the same type of node as the nodes in your cluster which you may need to replace. In case of virtual nodes deployed in VMware ESX, which have two node profiles (
OVA-appandOVA-data), you can failover only between nodes of the same profile. -
Ensure that the node you are adding is powered on.
-
If you are adding a physical node, ensure that you have the new node’s CIMC IP address and login information.
You will need to use the CIMC information to add the new node using the Nexus Dashboard GUI.
-
If you are adding a virtual node, ensure that you have the node’s management IP address and login information.
To add a standby node:
-
Navigate to Nodes in System Status.
Admin > System Status > Nodes.
-
In the main pane, click Actions > Add node.
The Add Node page opens.
-
In the Add Node screen, provide the node information.
-
In the Deployment details area, provide the credentials information for the node, then click Validate.
-
For physical nodes, this is the IP address, username, and password of the server’s CIMC. The CIMC will be used to configure the rest of the information on the node.
-
For virtual nodes, this is the IP address and
rescue-userpassword you defined for the node when deploying it.
-
-
In the General area, provide the name and serial number of the node.
-
From the Type dropdown, select
Standby. -
Provide the Management network information.
For virtual nodes, the management network information will be pre-populated with the information pulled from the node based on the IP address and credentials you provided in the previous sub-step.
For physical nodes, you must provide the management network IP address, netmask, and gateway now.
-
Provide the Data network information.
You must provide the data network IP address, netmask, and gateway. Optionally, you can also provide the VLAN ID for the network. For most deployments, you can leave the VLAN ID field blank.
-
(Optional) Provide IPv6 information for the management and data networks.
Nexus Dashboard supports dual stack IPv4/IPv6 for the management and data networks.
If you want to provide IPv6 information, you must do it when adding the node.
All nodes in the cluster must be configured with either only IPv4 or dual IPv4/IPv6 stack.
-
In the Enable BGP field, click the toggle to enable this feature, if necessary.
-
-
Click Save to add the node.
The configuration will be pushed to the node and the node will be added to the list in the GUI.
Replace single primary node with standby node
This section describes failover using a pre-configured standby node. If your cluster does not have a standby node, follow the steps described in one of the sections in Cisco Nexus Dashboard Troubleshooting instead.
-
Ensure that at least 2 primary nodes are healthy.
-
Ensure that you have at least one
standbynode available in the cluster.Setting up and configuring
standbynodes is described in Adding Standby Nodes. -
Ensure that the
primarynode you want to replace is powered off.
You cannot re-add the
primarynode you are replacing back to the cluster after the failover is complete. If theprimarynode you replace is still functional and you want to re-add it to the cluster after the failover, you must factory reset or re-image it as described in Cisco Nexus Dashboard Troubleshooting and add it as astandbyorprimarynode only.
To failover a single primary node:
-
Navigate to Nodes in System Status.
Admin > System Status > Nodes.
-
Select the node that you want to replace.
-
From the Actions menu, choose Failover.
Note that you must have a standby node already configured and added or the Failover menu option will not be available.
-
In the Fail Over window that opens, select a standby node from the dropdown.
You can promote a
standbynode to aprimarynode only when thestandbynode’s status isInactive.
-
Click Save to complete the failover.
The failed primary node will be removed from the list and replaced by the standby node you selected. The status will remain
Inactivewhile the services are being restored to the new primary node.It can take up to 10 minutes for all services to be restored, at which point the new primary node’s status will change to
Active.If you want to add the old node back to the Nexus Dashboard cluster as a
standbynode, you must first reset it to factory defaults by using theacs reboot factory-resetcommand and then add it back by using the procedure described in Adding Standby Nodes.
Replace two primary nodes with standby node
The option to replace two primary nodes with a standby node is not supported. Instead, if one cluster becomes unavailable, you will recover that cluster from a backup that is available on another cluster. See the section "Perform a dynamic recovery on a cluster" in Nexus Dashboard Troubleshooting for more information.
Delete standby nodes
-
Ensure that the primary nodes and the cluster are healthy.
To delete an existing standby node:
-
Navigate to Nodes in System Status.
Admin > System Status > Nodes.
-
Select the checkbox next to the standby node you want to delete.
-
From the Actions menu, choose Delete to delete the node.
Anomalies
The Anomalies tab allows you to quickly monitor platform-level anomalies detected on Nexus Dashboard. It highlights critical, high-severity events that require your prompt attention and resolution to keep the system healthy and stable.
-
Navigate to Anomalies tab in the System Status page.
Go to Admin > System Status > Anomalies.
-
Review the information provided in the Anomalies table.
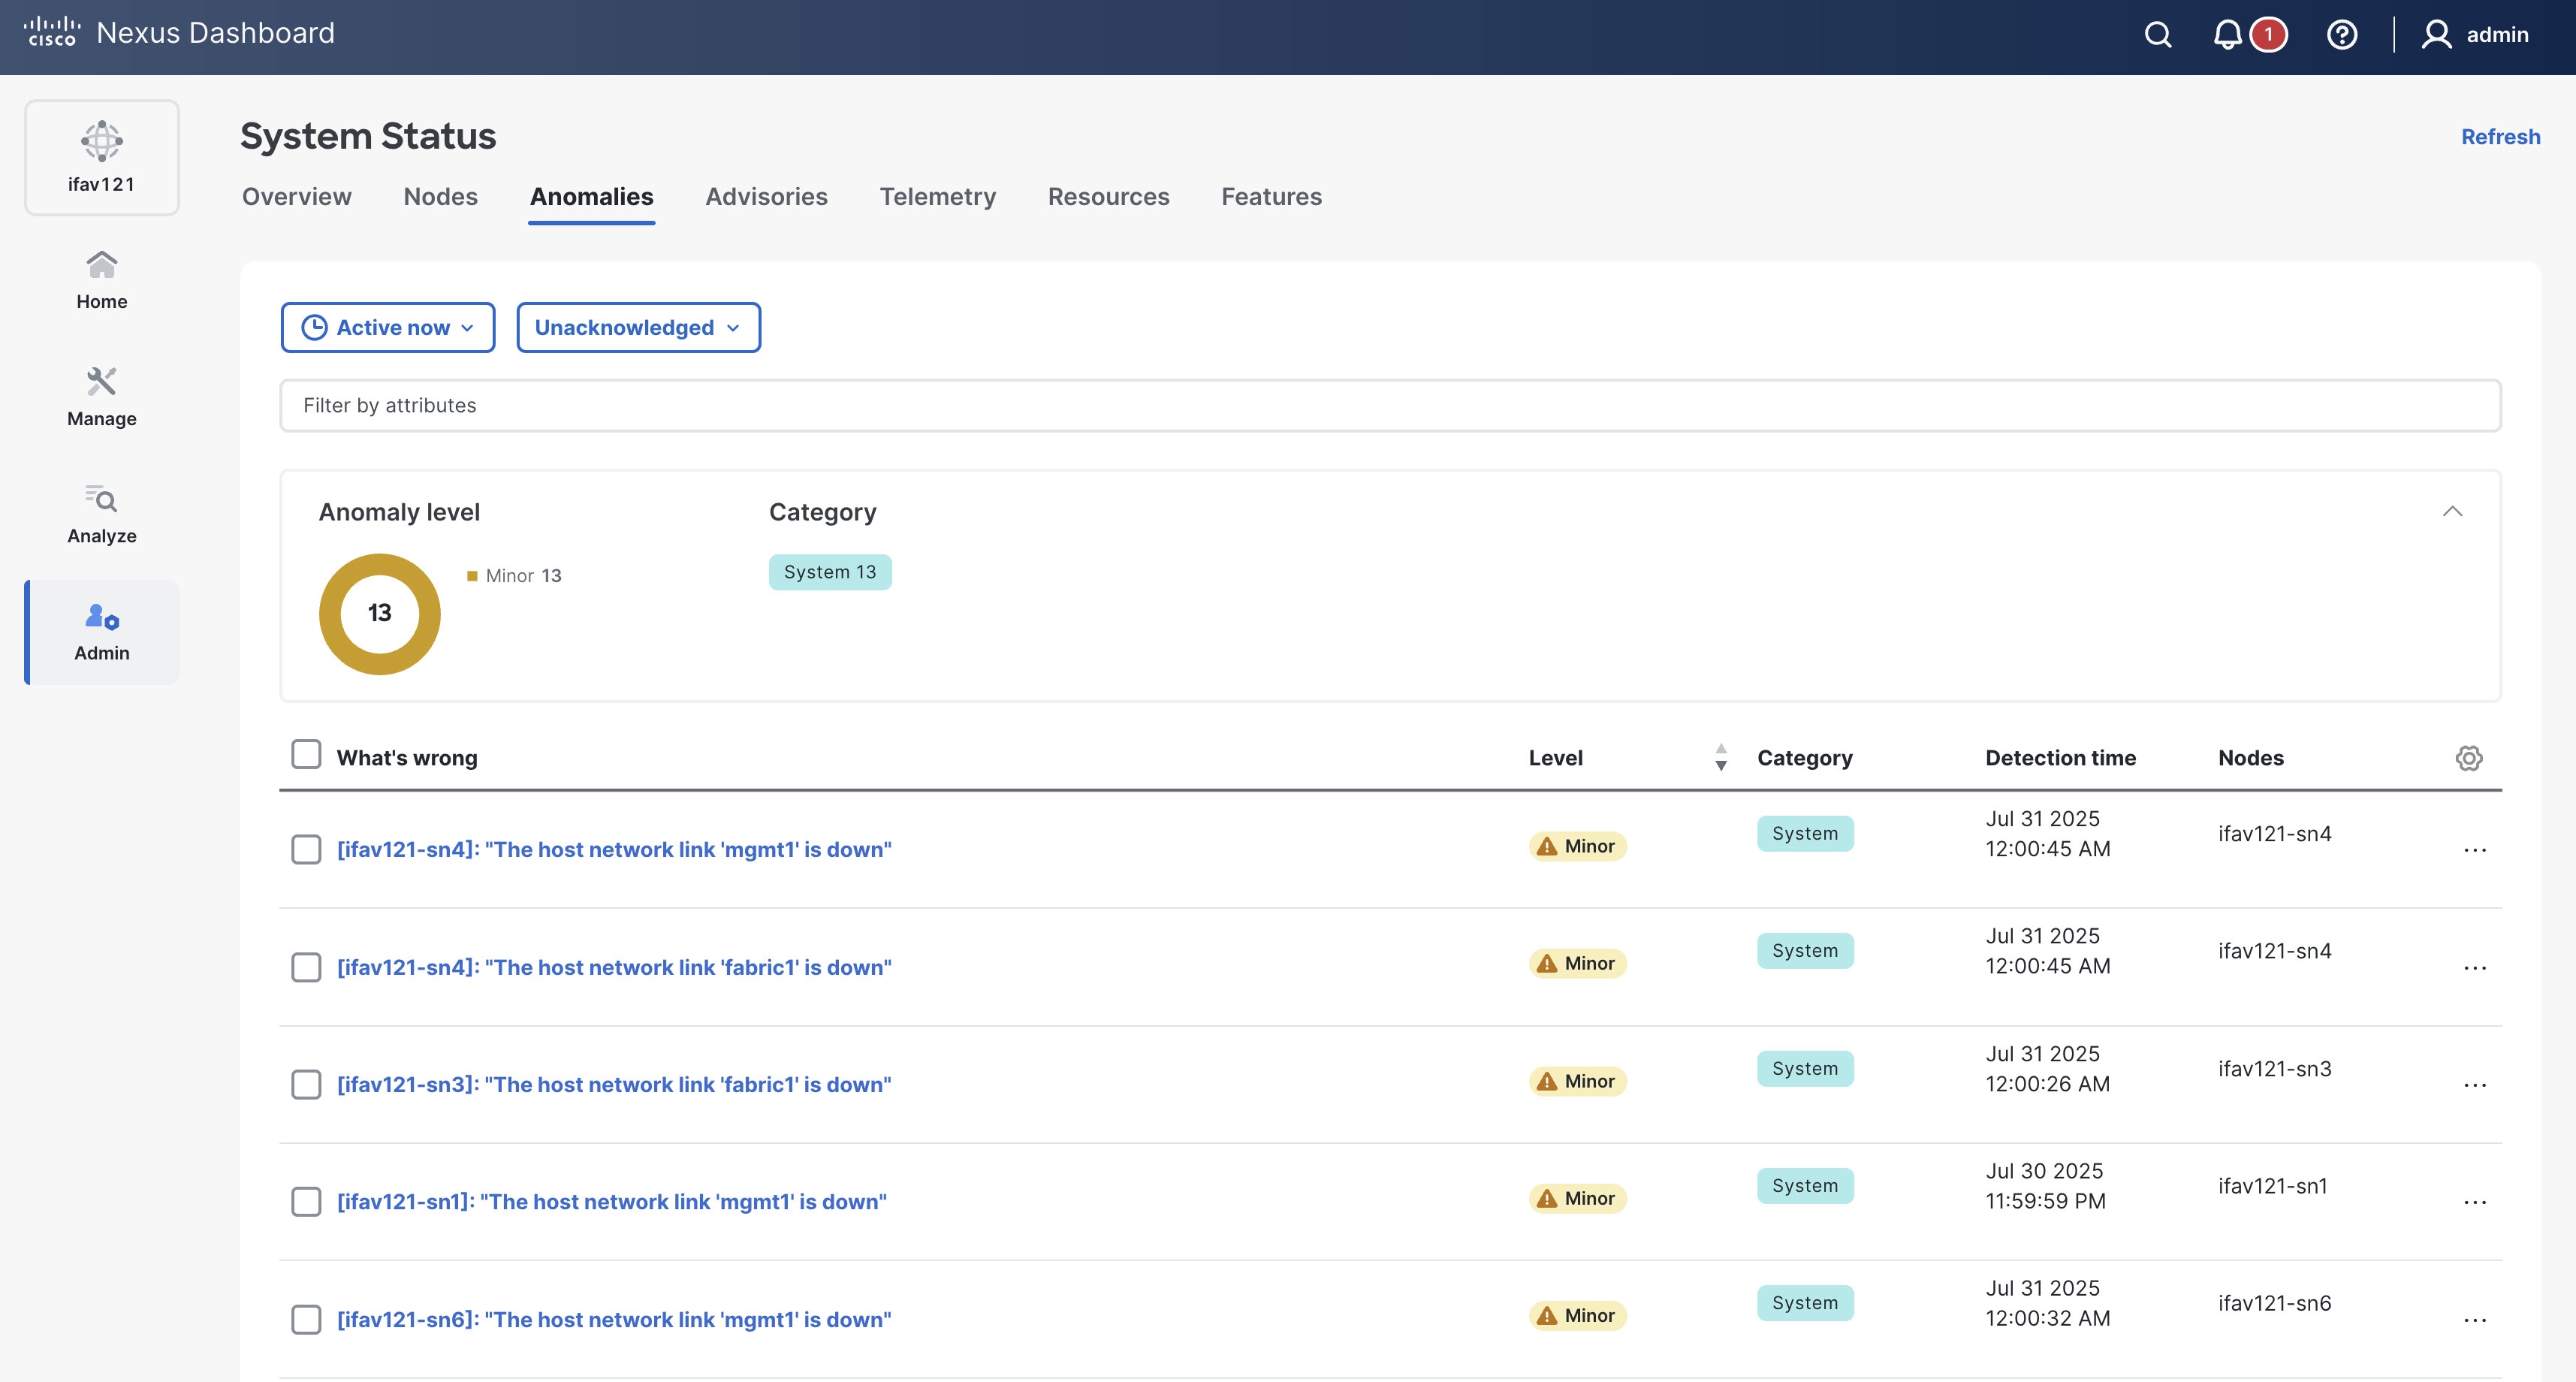
The Anomalies table displays filtered anomalies. By default, the anomalies are sorted by level. Click the column heading to sort the anomalies in the table. To view cleared anomalies, apply a filter to list anomalies from the past 15 minutes (or a similar recent time frame), and configure the table to show the Status column, where the status is displayed as either Active or Cleared. An Active status means the anomaly is present in your network, while a Cleared status means the anomaly is no longer present.
-
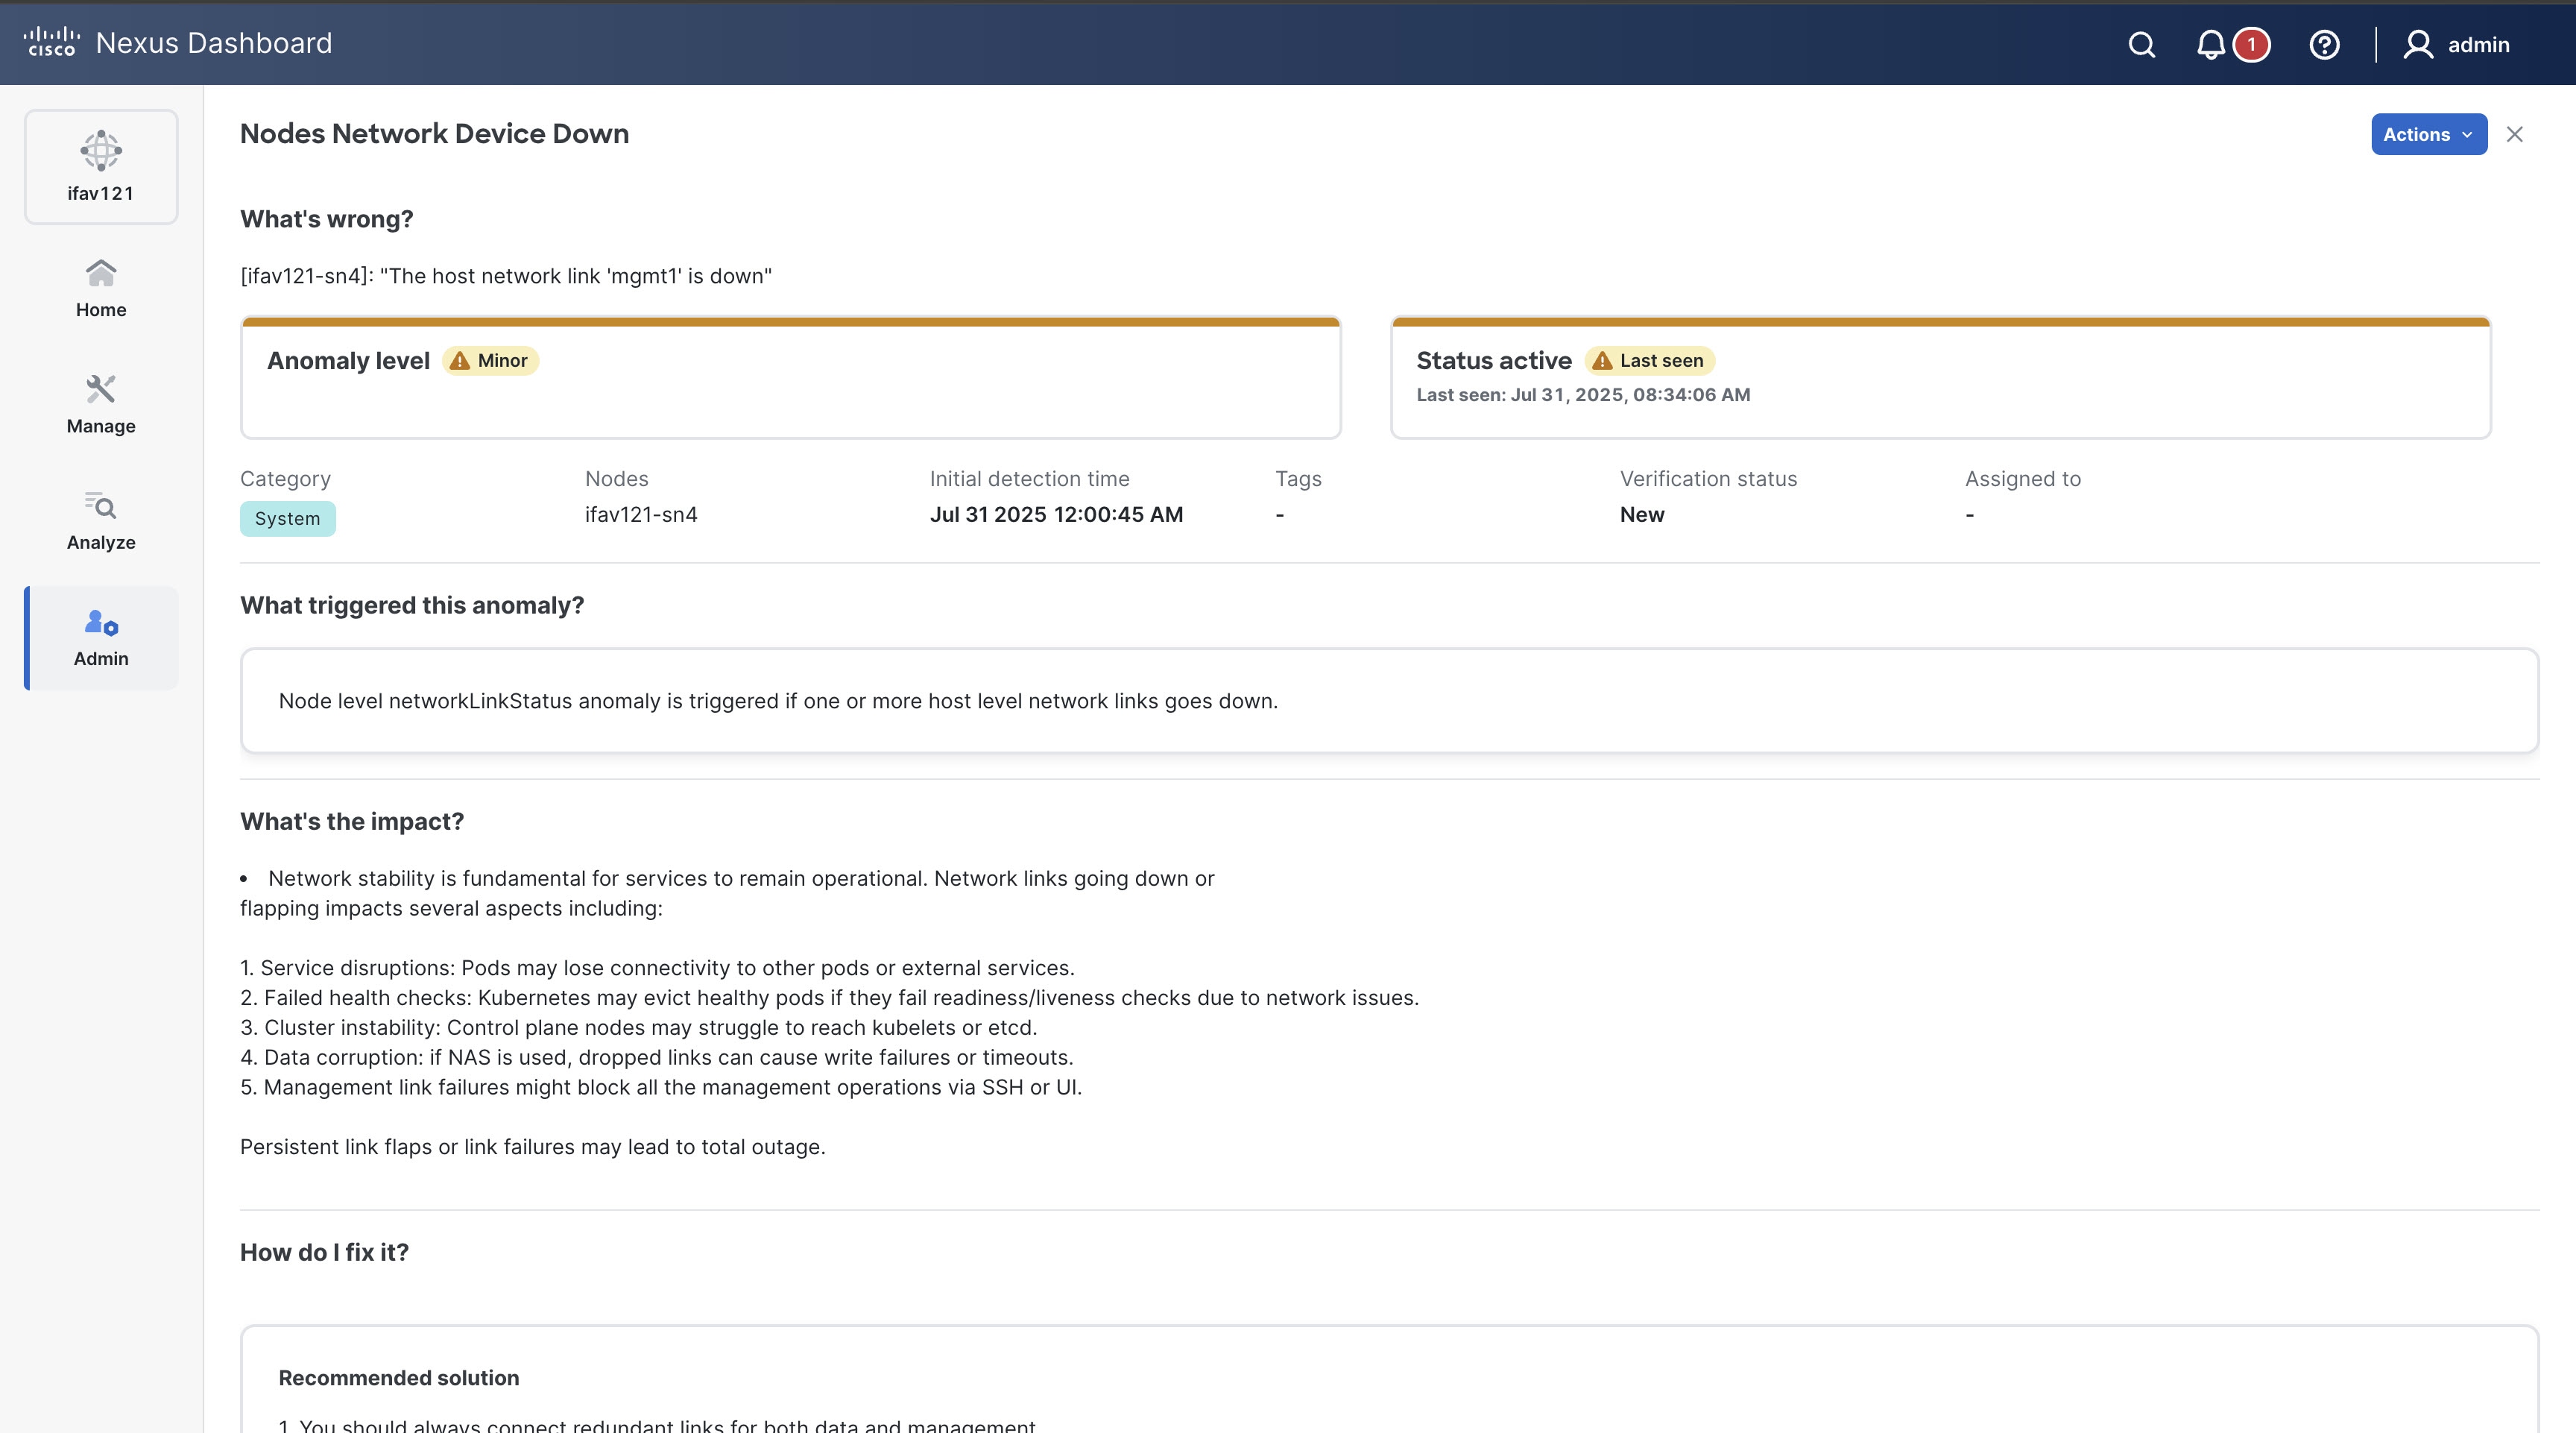
Click an anomaly to view more information.
The Anomaly name page displays these details.
-
What’s wrong? — provides a problem description with the specific affected objects.
-
What triggered this anomaly? — provides the primary source of the anomaly.
-
What’s the impact? — explains the potential impact if the problem is not fixed.
-
How do I fix it? — provides prescriptive recommendations.
For more information, see Detecting Anomalies and Identifying Advisories in your Nexus Dashboard.
-
Advisories
Nexus Dashboard uses metadata bundles to detect field notices, software and hardware end-of-life (EoL) and end-of-sale (EoS) announcements, as well as PSIRTs that affect the network cluster nodes, and it generates advisories. These advisories recommend actions to support your network for optimal performance. Previously, Nexus Dashboard limited advisories for fabric nodes. With this release, Nexus Dashboard includes advisories for cluster nodes. For more information, see Metadata support and Detecting Anomalies and Identifying Advisories in your Nexus Dashboard.
Follow these steps to view the cluster advisories.
-
Navigate to Advisories tab in the System Status page.
Go to Admin > System Status > Advisories.
-
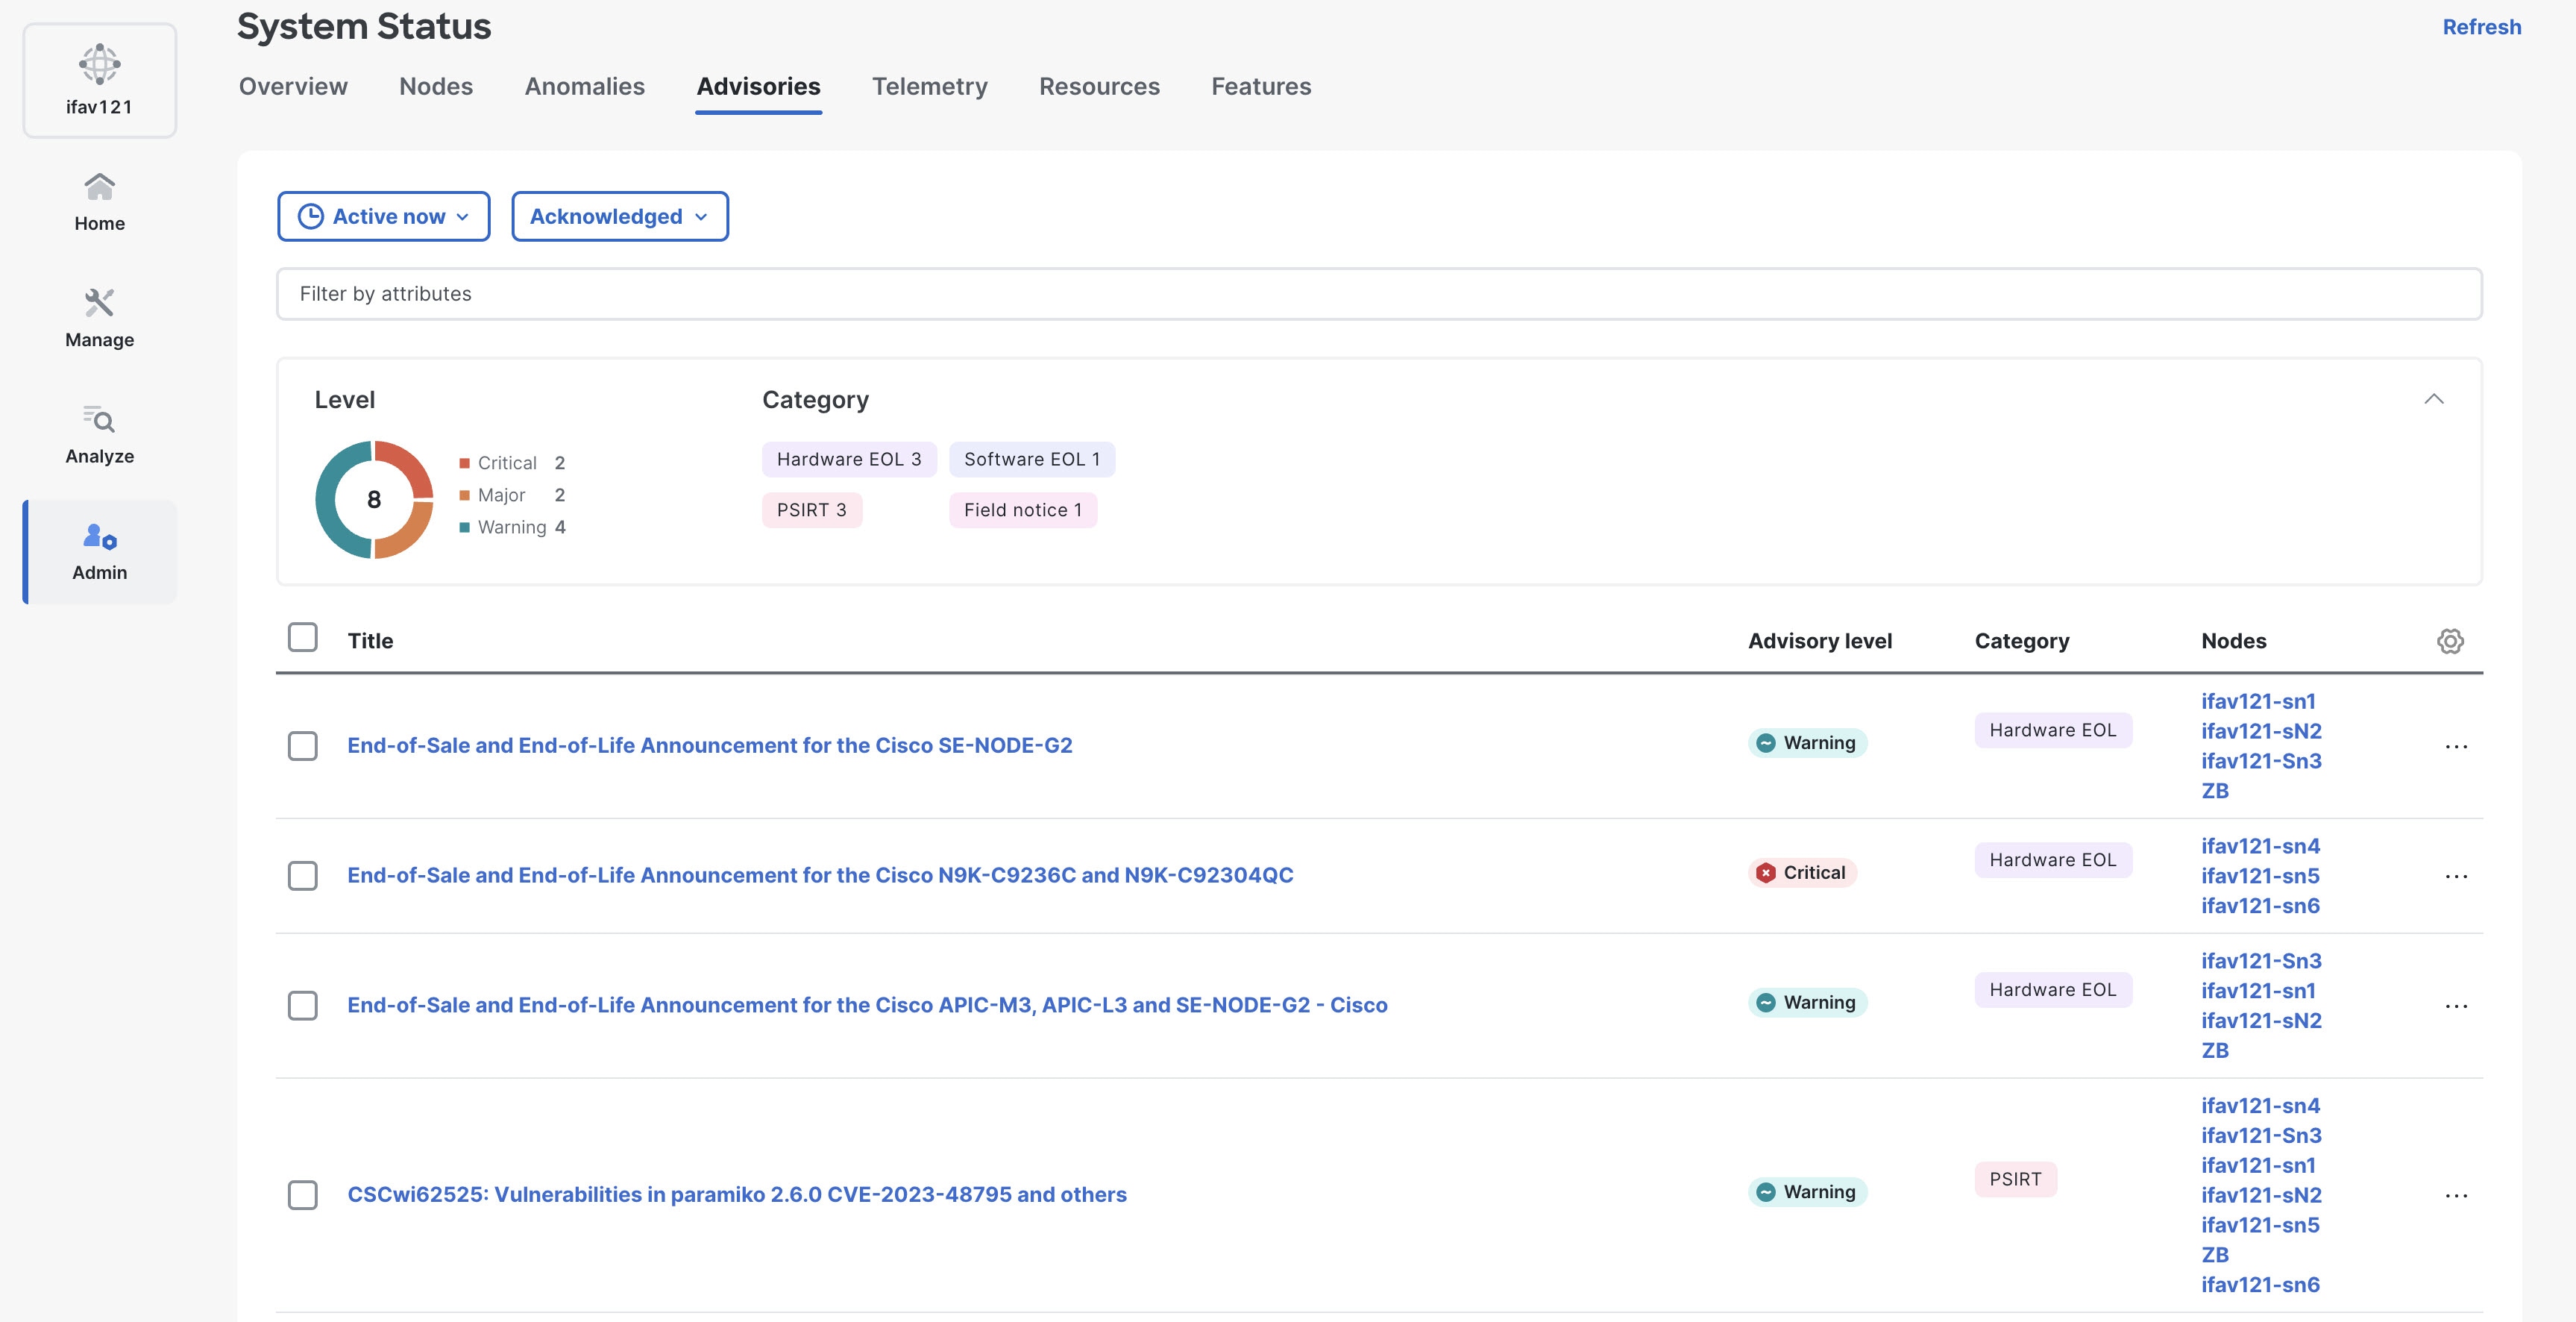
Review the information provided in the Advisories table.
Use the Filter drop-down list to choose the appropriate column name filter and display specific columns in the Advisories table.
The Advisories table displays the following information.
Field Description Title
Displays the name of the advisory as published by Cisco PSIRT or other sources.
Advisory level
Specifies if the custom dashboard is shared or private.
Category
Specifies the type of advisory, such as PSIRT, Field notice, Hardware, and Software EoL.
Nodes
Displays advisories for specific nodes.
What’s wrong
Displays advisories of a specific affected object.
Detection time
Display advisories with a specific detection time.
Last seen time
Displays only advisories with a specific last seen time. The last seen time indicates when the advisory was updated while it was active. If the Nexus Dashboard does not clear the advisory status, it stays active.
Nexus Dashboard lists nodes on the Advisories page for 30 minutes after removing them from the cluster. This intentional delay ensures proper handling of any ongoing processes or alerts related to the nodes before removing them from the Advisories table. Hence, the main Advisories page displays the nodes that are already removed from the cluster but are still within the 30-minute grace period. However, when you click on a specific advisory to view detailed information, Nexus Dashboard displays a more accurate list of nodes, excluding those that have been removed.
-
Navigate to Active now > Time Selection, to choose the date and time range.
By default, Active now is chosen. You can customize the date and time range to determine the advisories data displayed in the Advisories table.
-
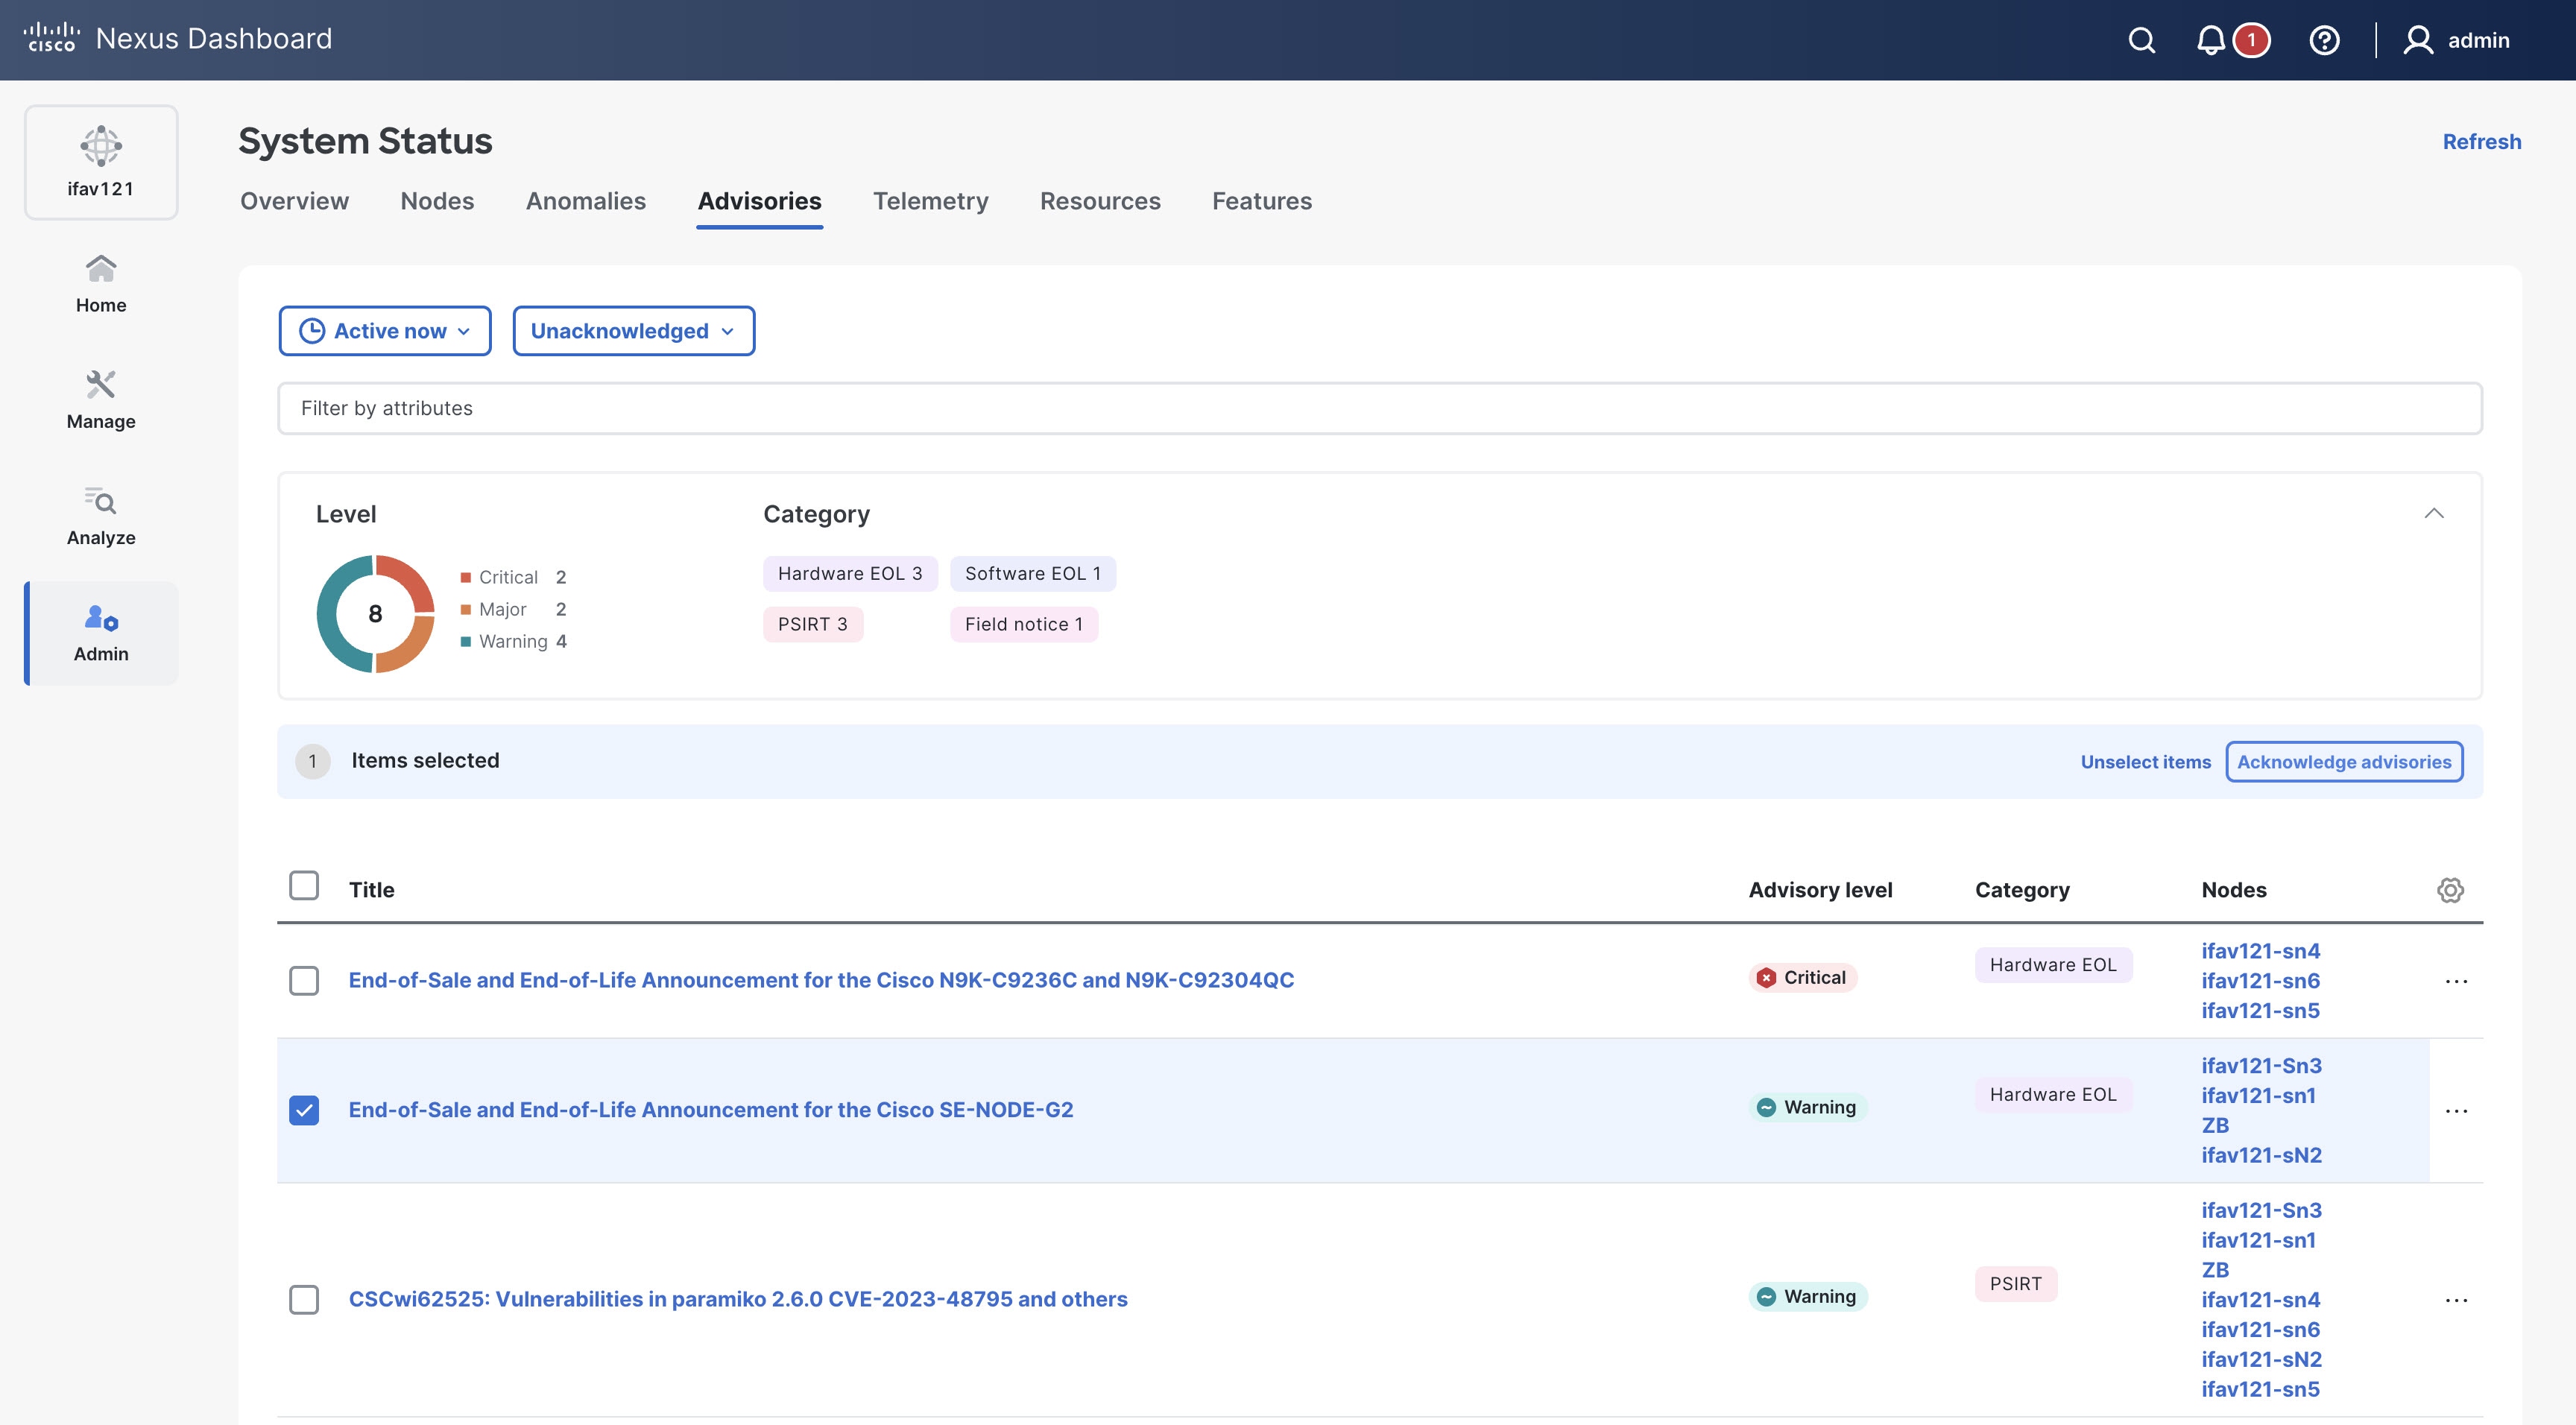
Choose the advisories from the Advisories table and click Acknowledge advisories to acknowledge advisories.
-
By default, all the unacknowledged advisories are displayed in the Advisories table. Once you acknowledge an advisory, choose Acknowledged from the drop-down list to view all the acknowledged advisories.
-
The Advisories page displays the total number of advisories by severity such as Critical, Major, and Warning in the donut chart under Level. You can view the type of advisory, such as PSIRT, field notices, hardware, and software EoL under Category.
-
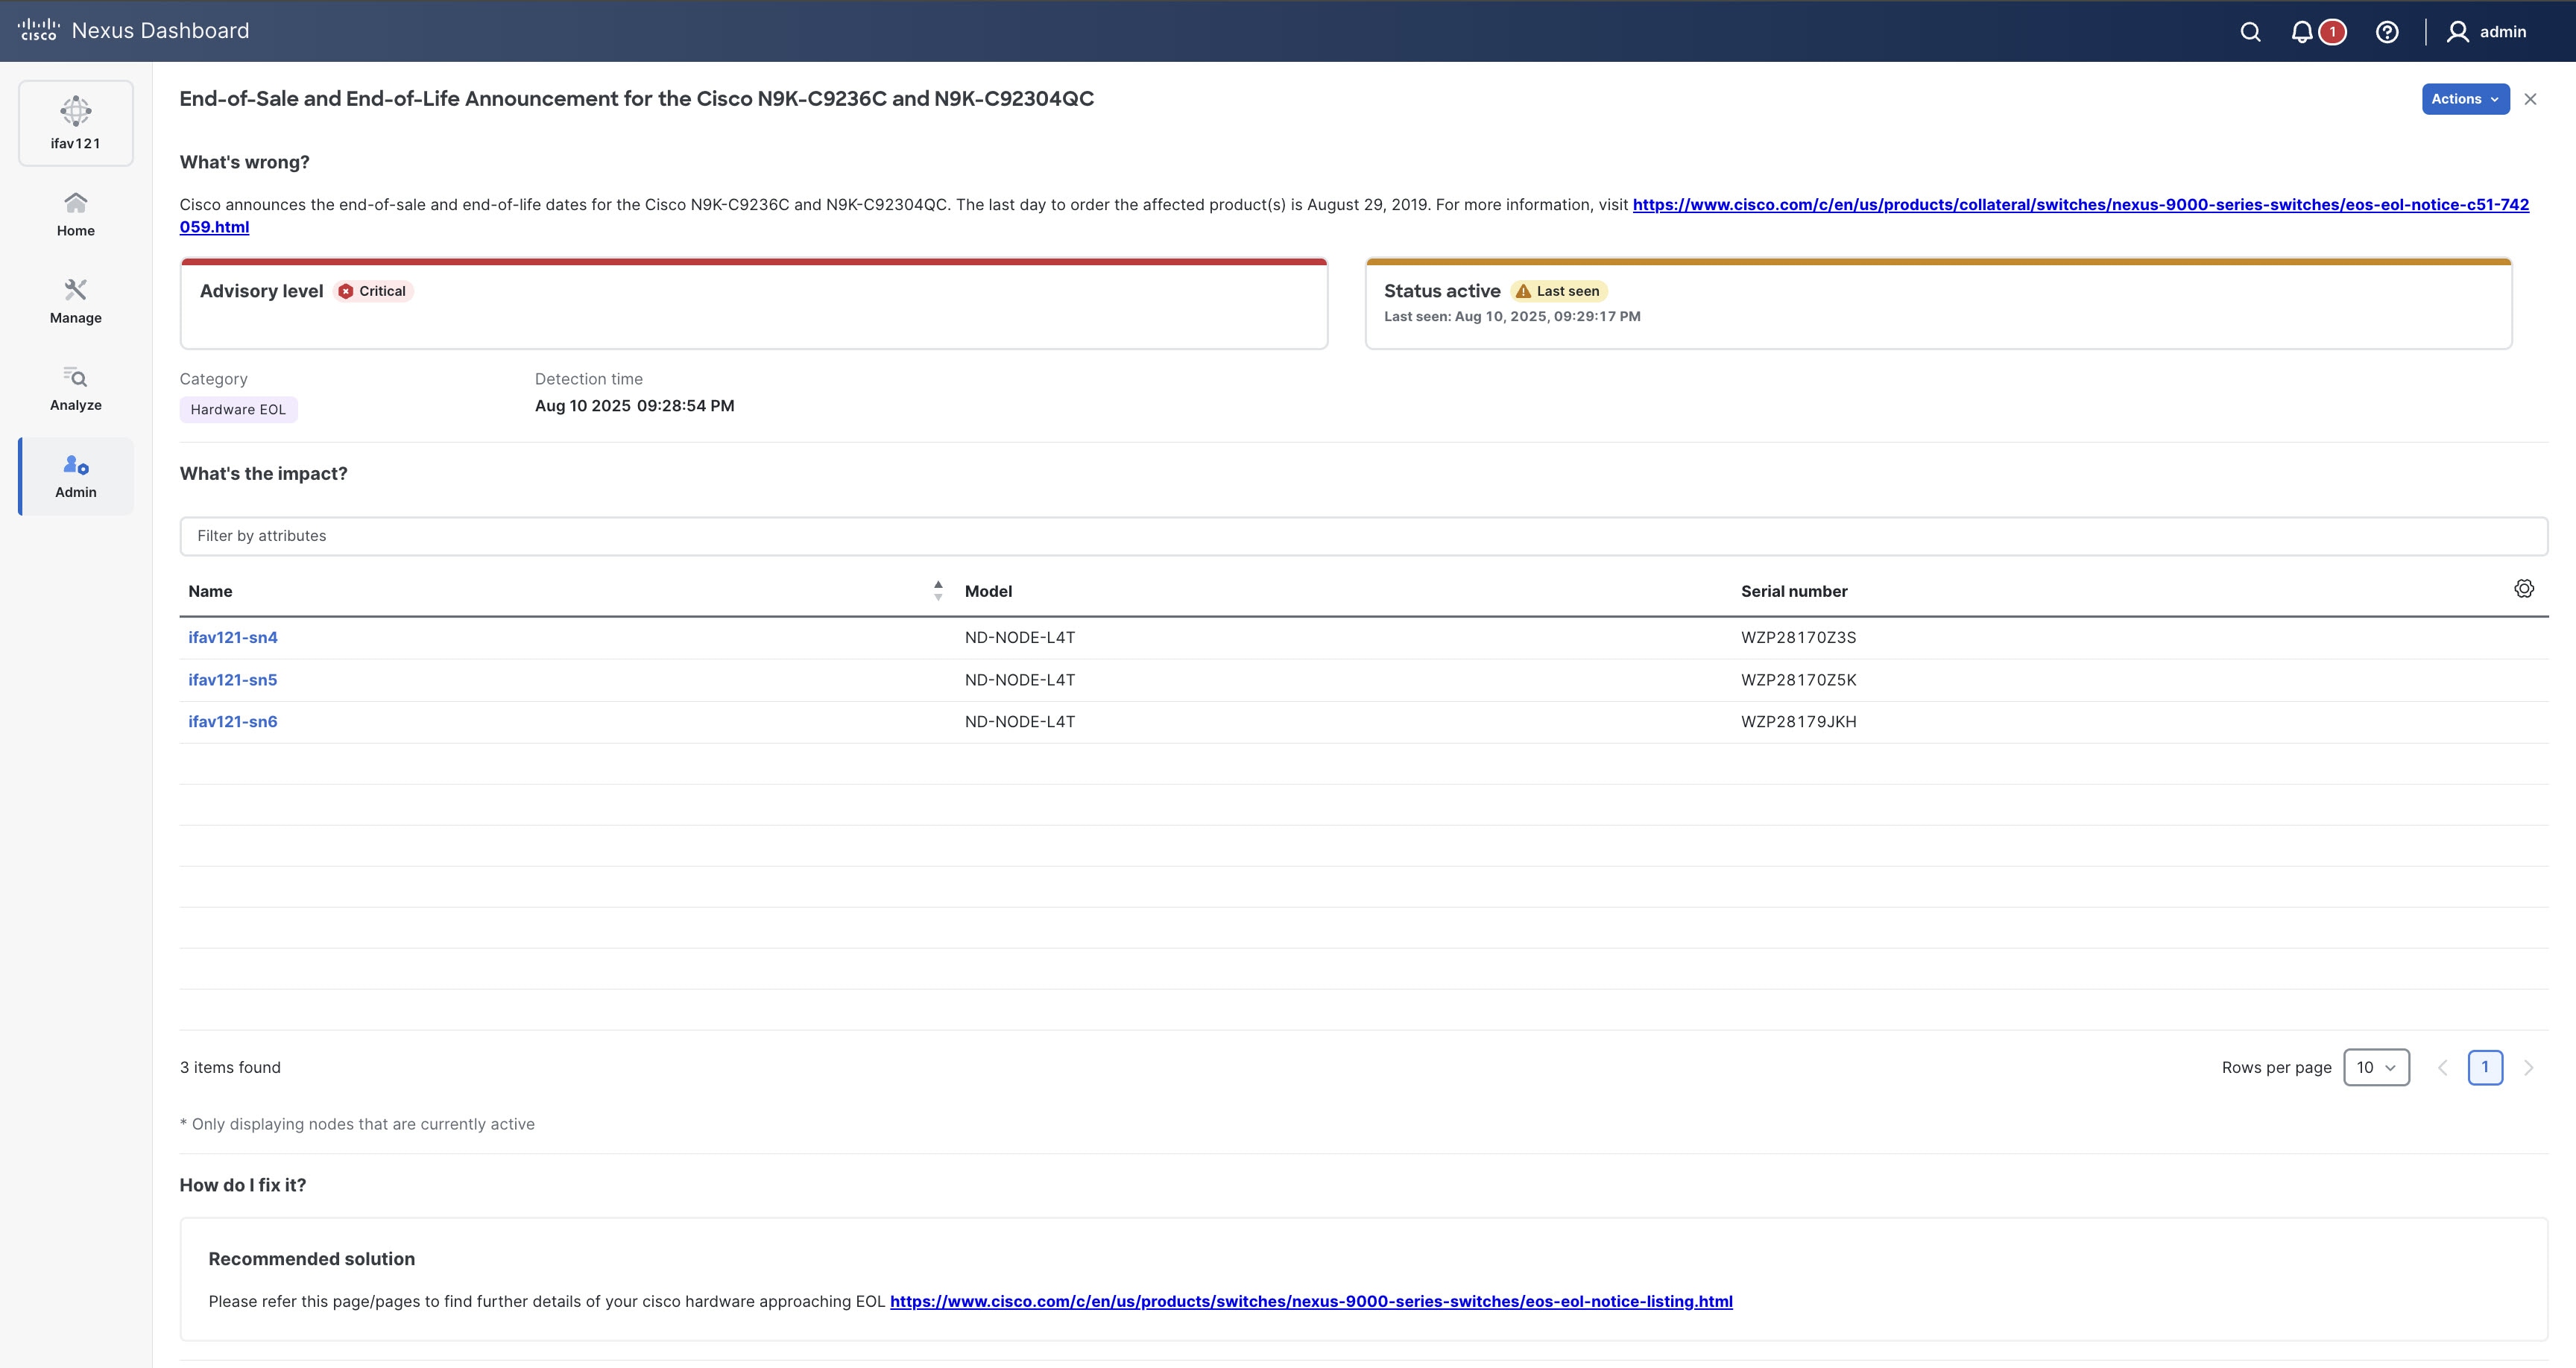
Click an advisory to view more information.
The Advisory name page displays these details.
-
What’s wrong? — provides a problem description with the specific affected objects.
-
How do I fix it? — provides prescriptive recommendations.
-
You can also view the cluster advisories by navigating to Analyze > Advisories. Click the Include system advisories toggle button to include system advisories. For more information, see Detecting Anomalies and Identifying Advisories in your Nexus Dashboard.
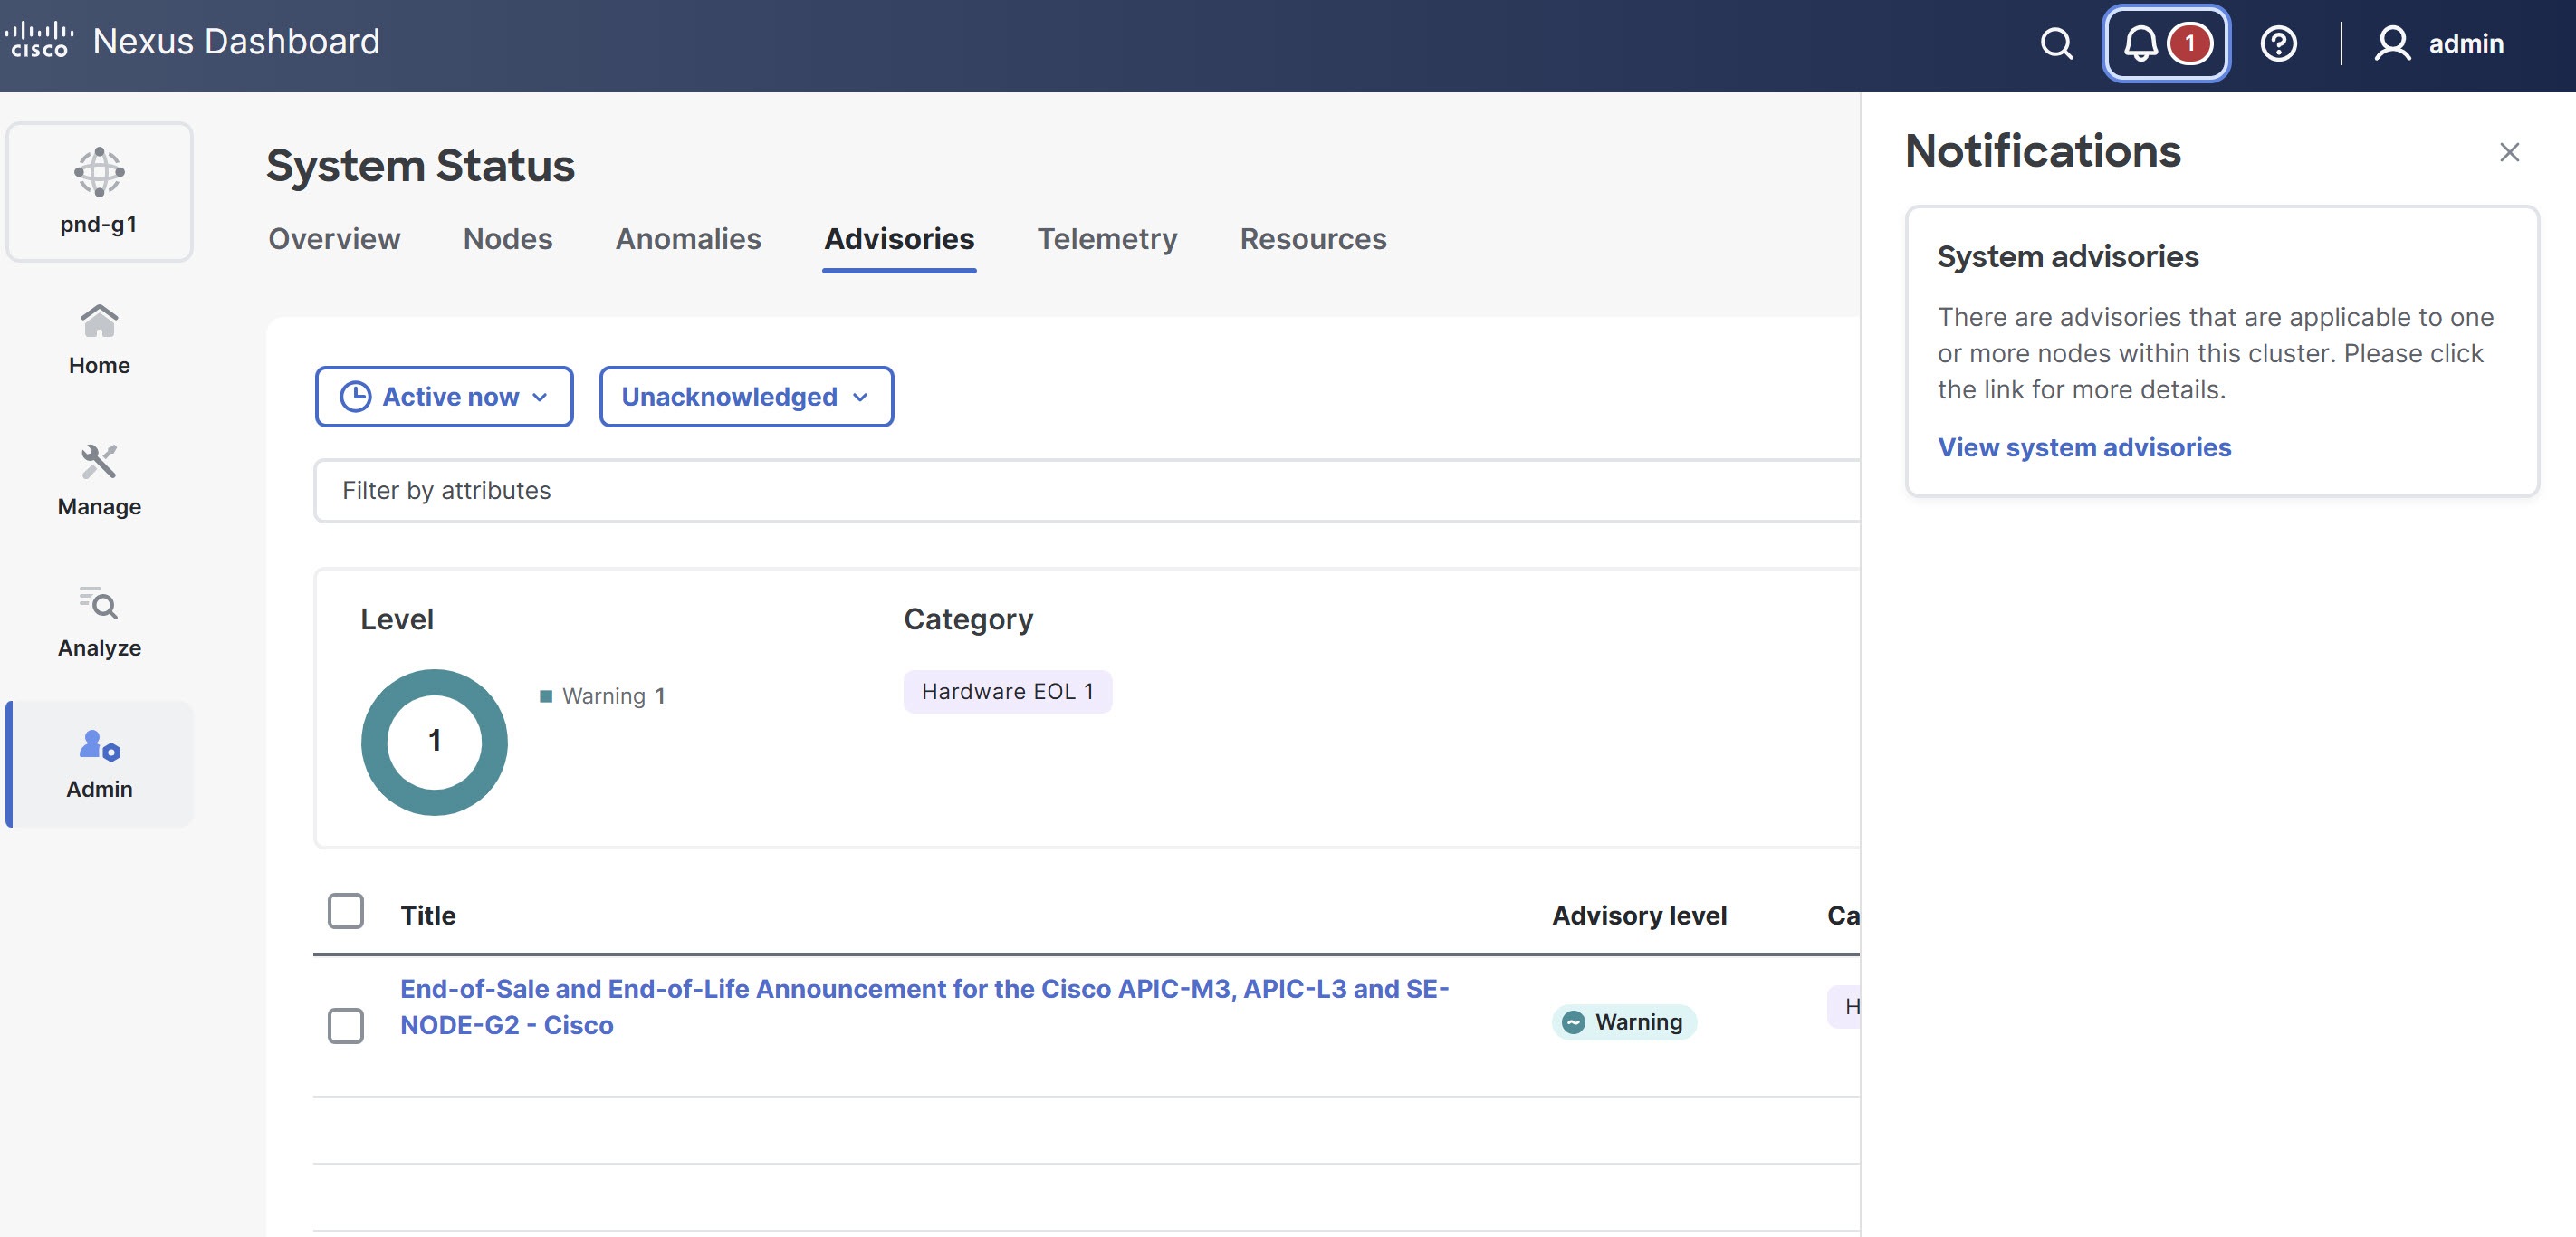
System advisory notification
When there is an active system advisory, a notification alert appears on the Notifications bell icon located in the common navigation bar at the top of the page. Click the notification bell icon to open the Notifications pane. In the Notifications pane, click View system advisories. Nexus Dashboard redirects you to the System Status page, where you can review the full list of current and past system advisories in the Advisories table.
Metadata support
Nexus Dashboard uses metadata bundles to detect latest bug signatures, PSIRTs, field notices, and end-of-life notices. Cisco Intersight Cloud regularly updates, validates, and makes metadata packages available. Nexus Dashboard connects to the Cisco Intersight Cloud via an embedded device connector, which periodically retrieves the updated metadata packages. For air-gap environments, where the Nexus Dashboard is not connected to the Cisco Intersight Cloud, you can securely and manually upload the latest metadata. You can download the bundle updates from Cisco DC App Center.
Follow these steps to check the metadata version.
-
Navigate to Admin > System Settings.
-
In the General tab, under Metadata you can view the metadata version.
-
Click Edit to update the metadata version.
The Metadata page appears. In the Update metadata version area, you can manually upload the latest metadata files.
Telemetry
-
Navigate to Telemetry in System Status.
Admin > System Status > Telemetry.
-
Click the Fabrics tab to view telemetry status information for the fabrics in your Nexus Dashboard.
-
Click the Switches tab to view telemetry status information for the fabrics in your Nexus Dashboard. NOTE: After upgrading to Nexus Dashboard 4.1.1, if any fabric shows a Telemetry configuration status as "Pending updates", all other configurations or runtime states (at both fabric and switch level) should be ignored until a redeploy is triggered.
-
Understanding system status
Nexus Dashboard processes your fabric’s telemetry through different jobs, services and tasks that reflect what you see on screen. The statuses are summarized at the fabric level. Following is a brief description for each of them:
-
Assurance: Indicates the status of the last assurance collection job. Hovering over this field will detail when assurance was last run, and whether it was a scheduled or on-demand task.
-
Capacity: Ensures all validated switch capacity limitations are in conformance. It is expected for controllers to report
No Dataas this is not applicable to these devices. -
Hardware resources: Monitors the health of all switch HW resources including CPU, memory, fans, power supplies, storage and environmental levels are healthy.
-
Statistics: Indicates the status of the collection of switch and interface level metrics. This collection is refreshed every 5 minutes.
-
Endpoints: Displays the collection status of a switches Endpoint records. Hovering over this field will display the last update timestamp. Endpoint collection is not applicable to controllers or spines switches that have no endpoints connected.
-
Bug scan: Provides the status of the previous bug scan analysis. Hovering over this field will provide the timestamp of the last run attempt.
-
Best practices: Displays the status of the last best practices scan. Hovering over this field will provide the timestamp of the last run attempt.
-
Telemetry collection status: This is available only at telemetry status in Fabric Overview (Manage > Fabrics > FabricXYZ). This is dynamically updated and represents the data streaming status.
-
Telemetry configuration status: Indicates that basic telemetry has been enabled on devices in the fabric. Status are:
-
OK: All switches have been successfully configured for telemetry streaming.
-
Not OK: Telemetry configuration for all switches in the fabric has failed or pending change control change.
-
Partial OK: Some switches have been successfully configured for telemetry streaming, some failed.
-
In progress: Telemetry configuration attempting to change state (Telemetry Pause/Resume, Pending change control).
-
Pending updates: Indicates new telemetry configurations are available, can be availed with 'redeploy' action.
-
Out of sync :Indicates a restore operation is in-progress, should be completed with 'reconfigure' action.
-
-
Software telemetry status: Displays the software telemetry status for each switch. The value for this property will show
Enabled,Disabledor aPendingstate (if Change Control is enabled). -
Flow collection: Indicates flow collection configuration status.
Resources
Resources provides real-time information about the resource utilization of your Nexus Dashboard cluster.
-
Navigate to Resources in System Status.
Admin > System Status > Resources.
In Nexus Dashboard 4.1.1, the digital news feed button is removed from the Admin > System Status > Resources page.
Features
Features provides information on the features that are enabled in your Nexus Dashboard and the health status for those features.
-
Navigate to Features in System Status.
Admin > System Status > Features.