View SR-TE Policies and RSVP-TE Tunnels on the Topology Map
Crosswork Optimization Engine visualization provides the most value by giving you the ability to easily view and manage SR-TE policies and RSVP-TE tunnels. By visually examining your network, the complexity of provisioning and managing these TE tunnels is significantly reduced.
 Note |
Throughout this document, the navigation is documented as . However, when using Crosswork Optimization Engine within the Crosswork Network Controller solution, the navigation is . |
| Callout No. | Description | |||
|---|---|---|---|---|
|
1 |
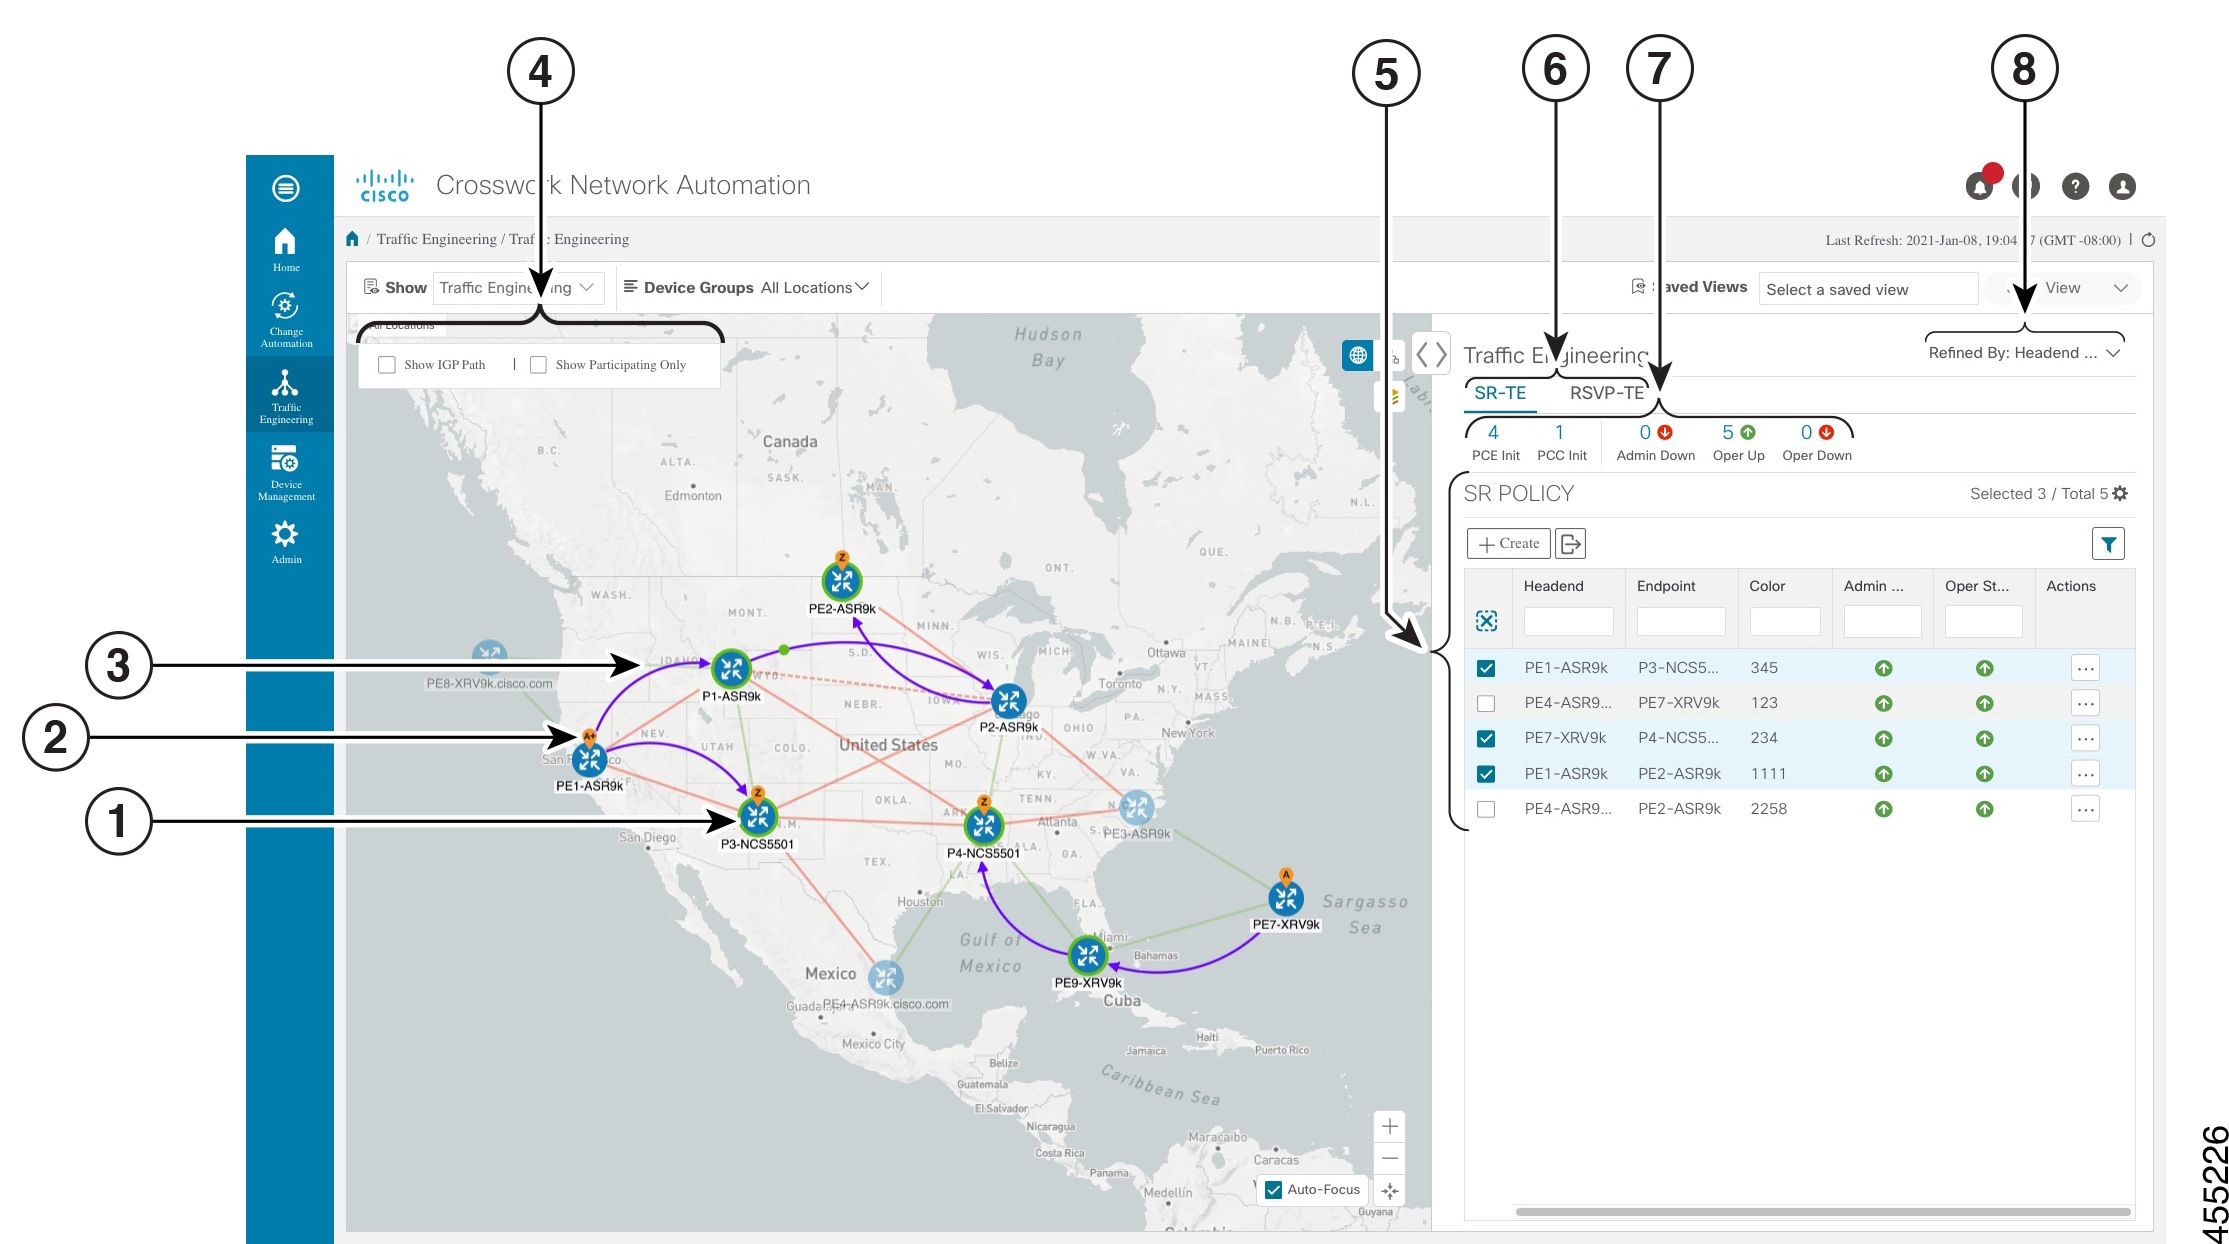
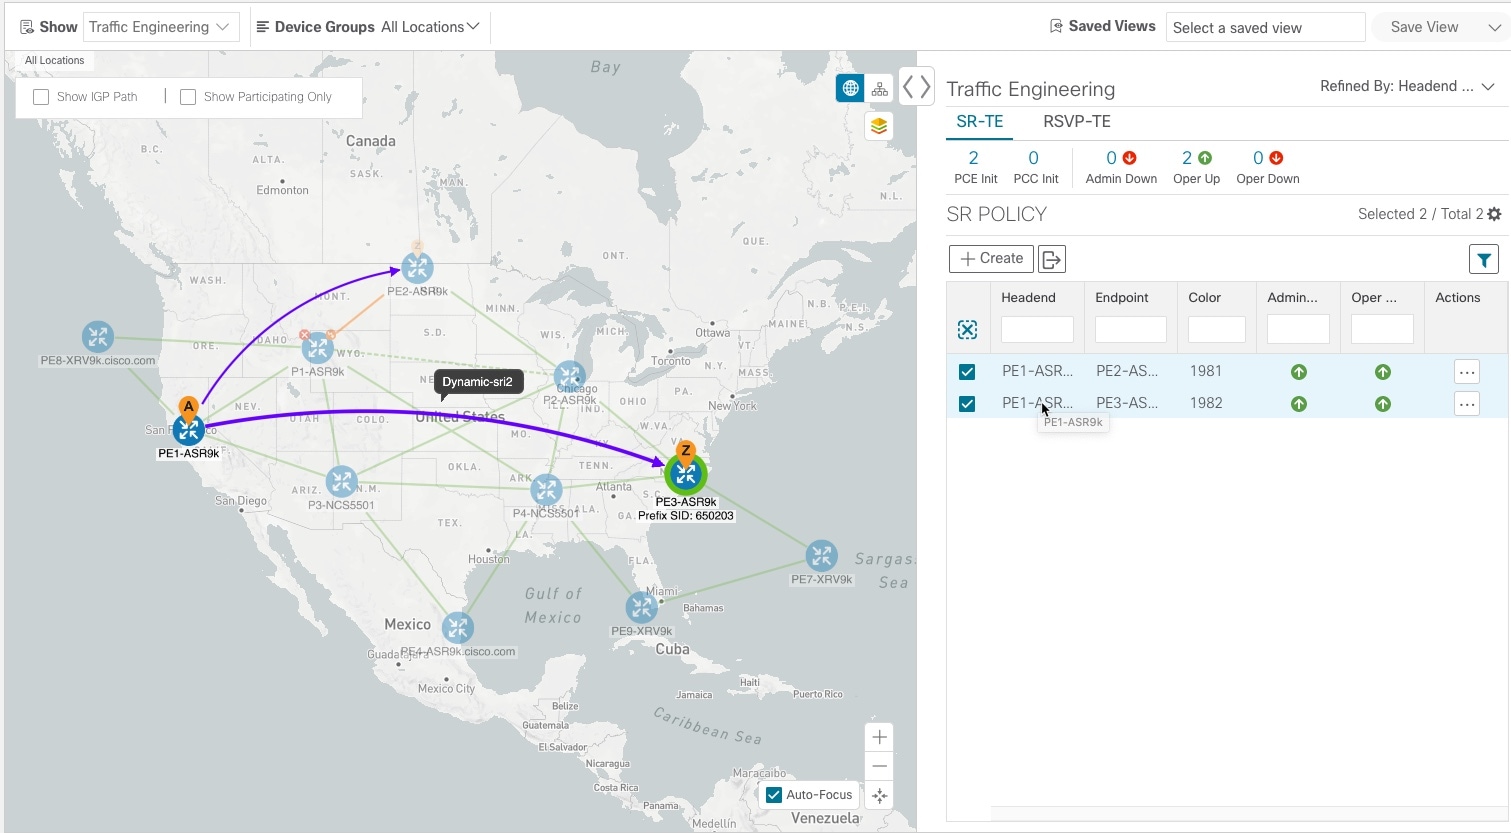
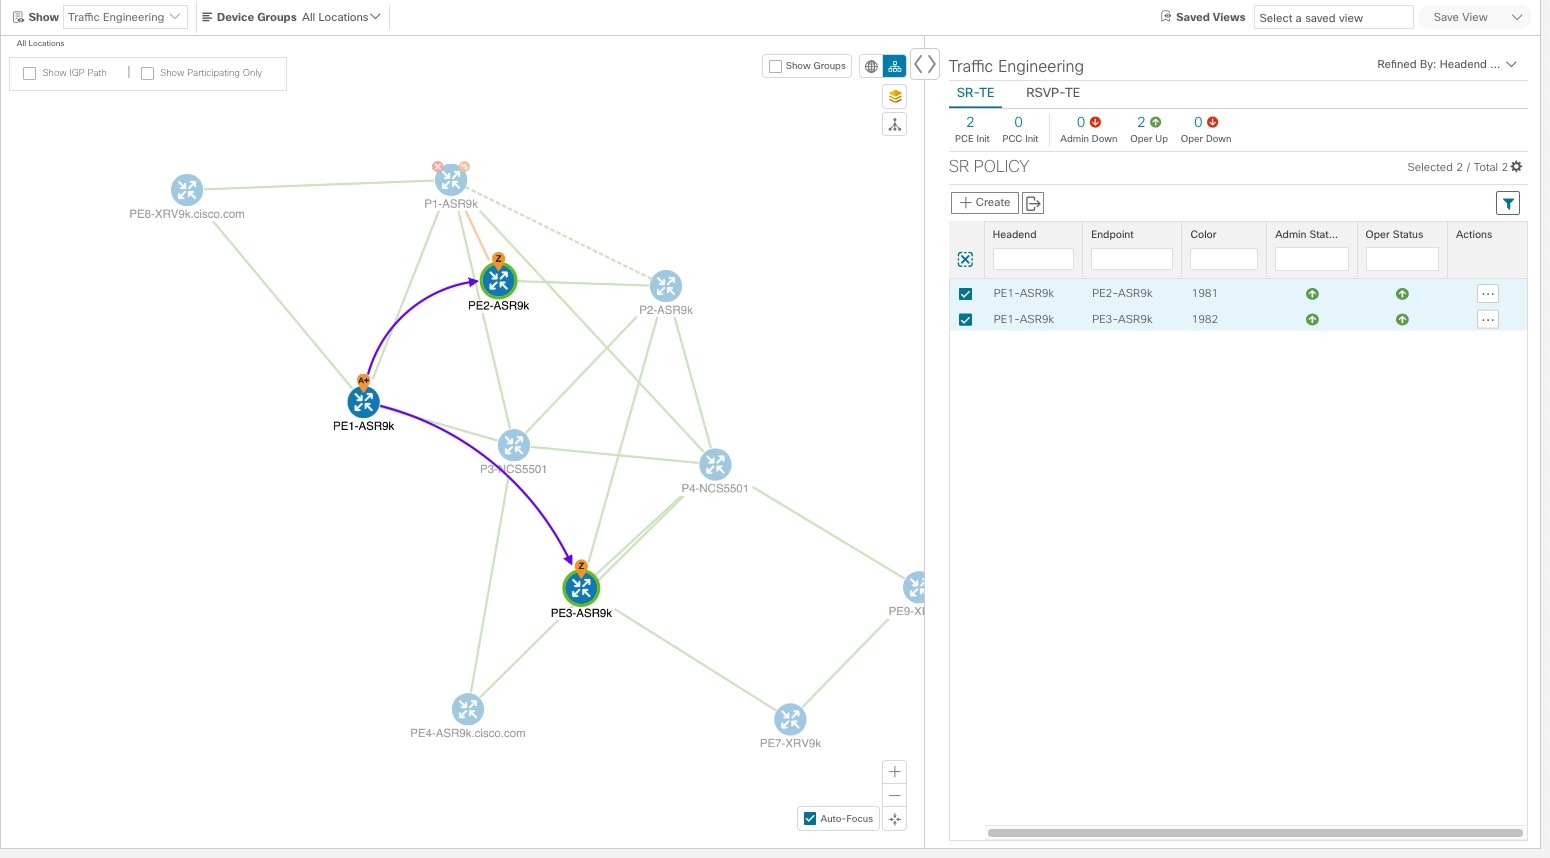
SR-TE Policies—A device with a green ( RSVP-TE Tunnels—A device with a solid orange outline (
|
|||
|
2 |
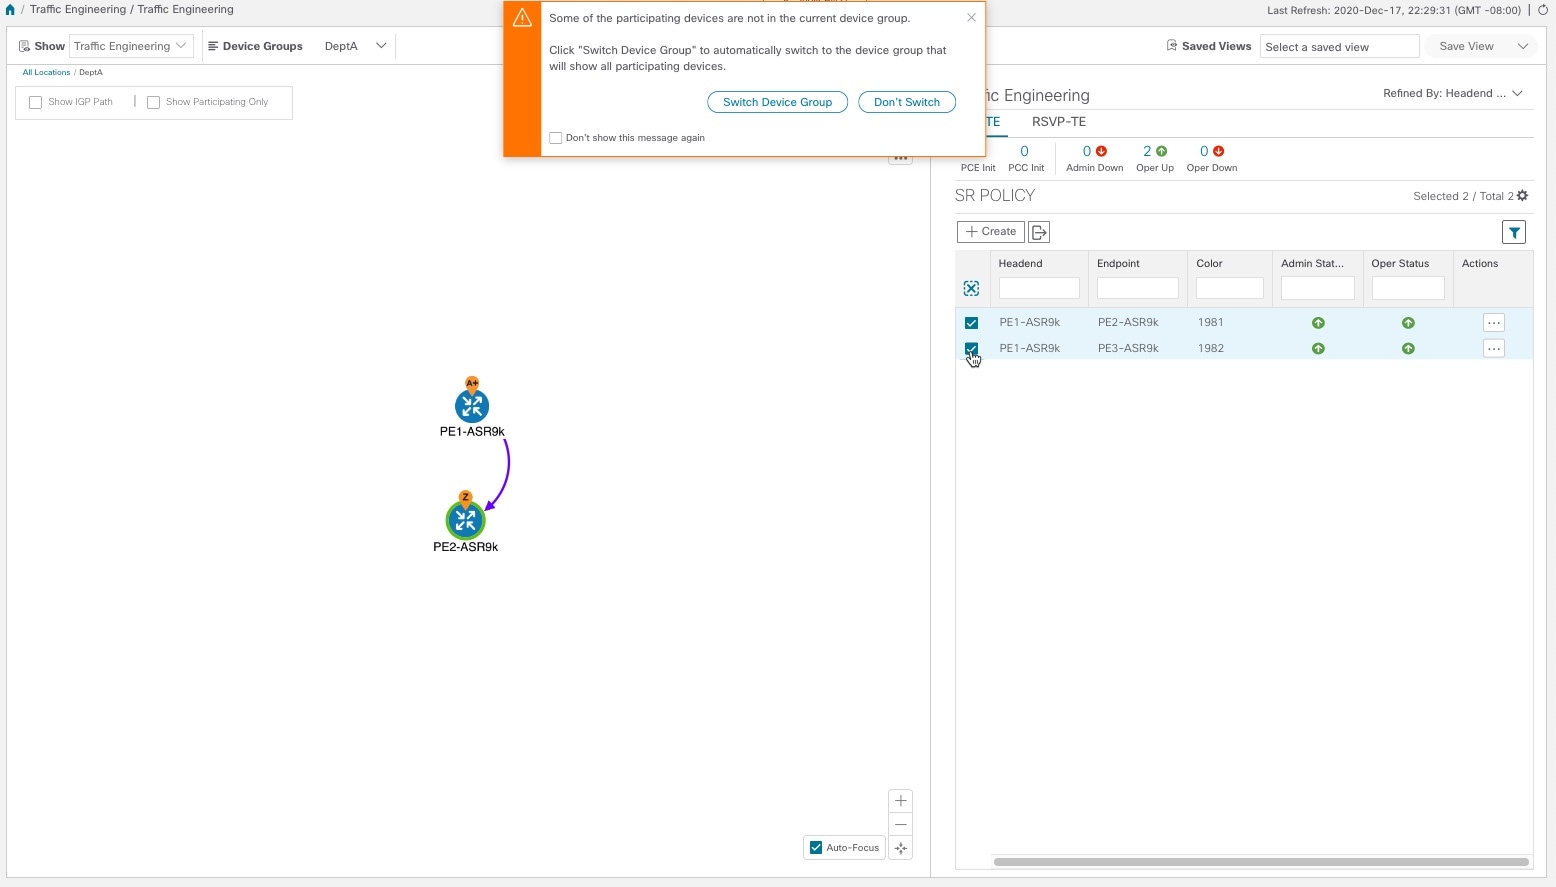
SR-TE Policy and RSVP-TE Tunnel Origin and Destination: If both A and Z are displayed in a device cluster, at least one node in the cluster is a source and another is a destination. The A+ denotes that there is more than one SR-TE policy or RSVP-TE tunnel that originates from a node. The Z+ denotes that the node is a destination for more than one TE tunnel. |
|||
|
3 |
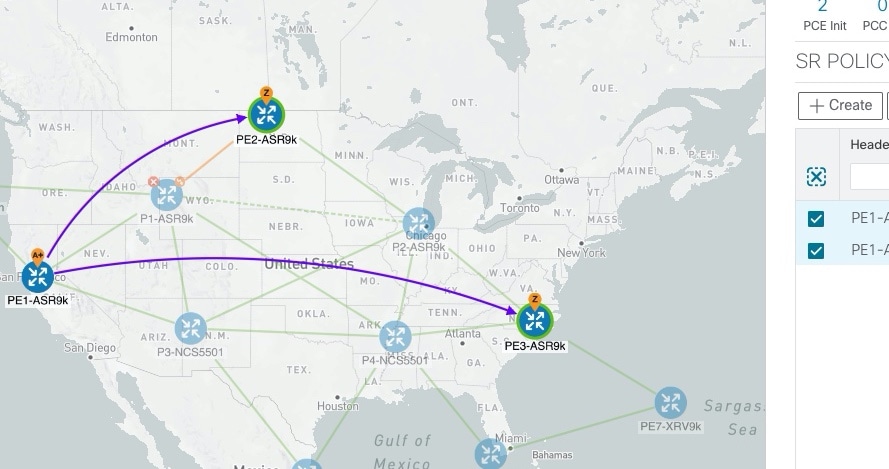
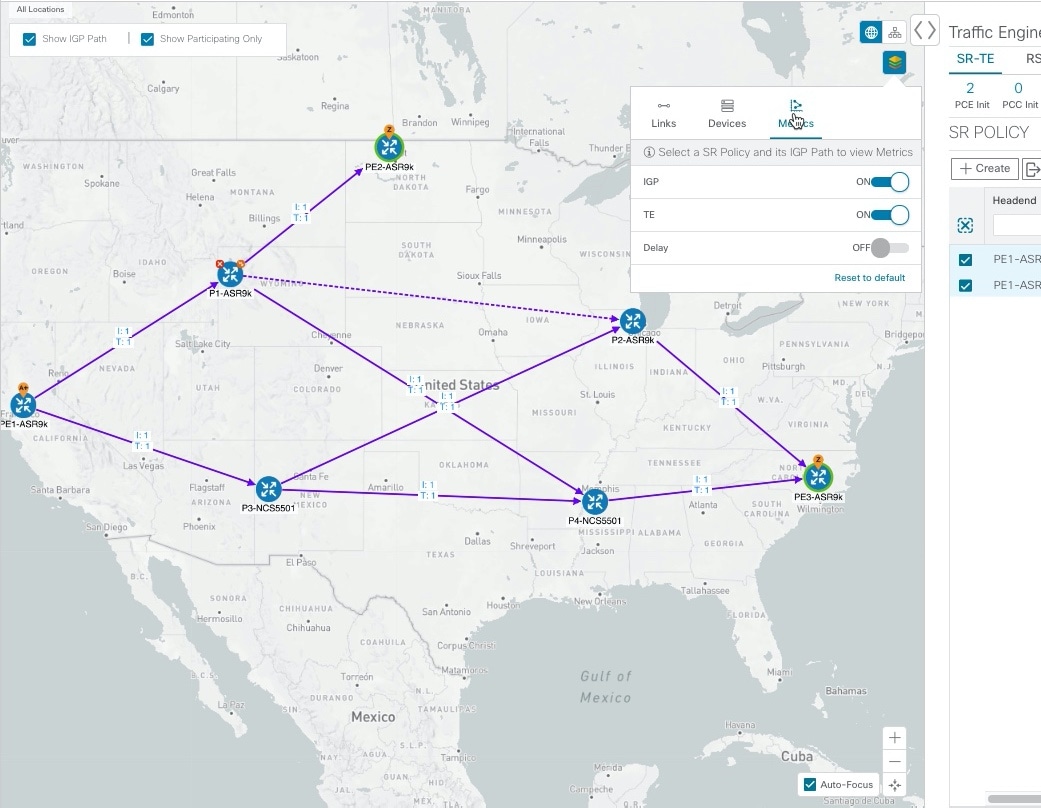
SR-TE Policies and RSVP-TE Tunnels: When SR-TE policies or RSVP-TE tunnels are selected in the SR-TE Policy or RSVP-TE Tunnel tables, they show as purple directional lines on the map indicating source and destination. An adjacency segment ID (SID) is shown as a green dot on a link along the path ( |
|||
|
4 |
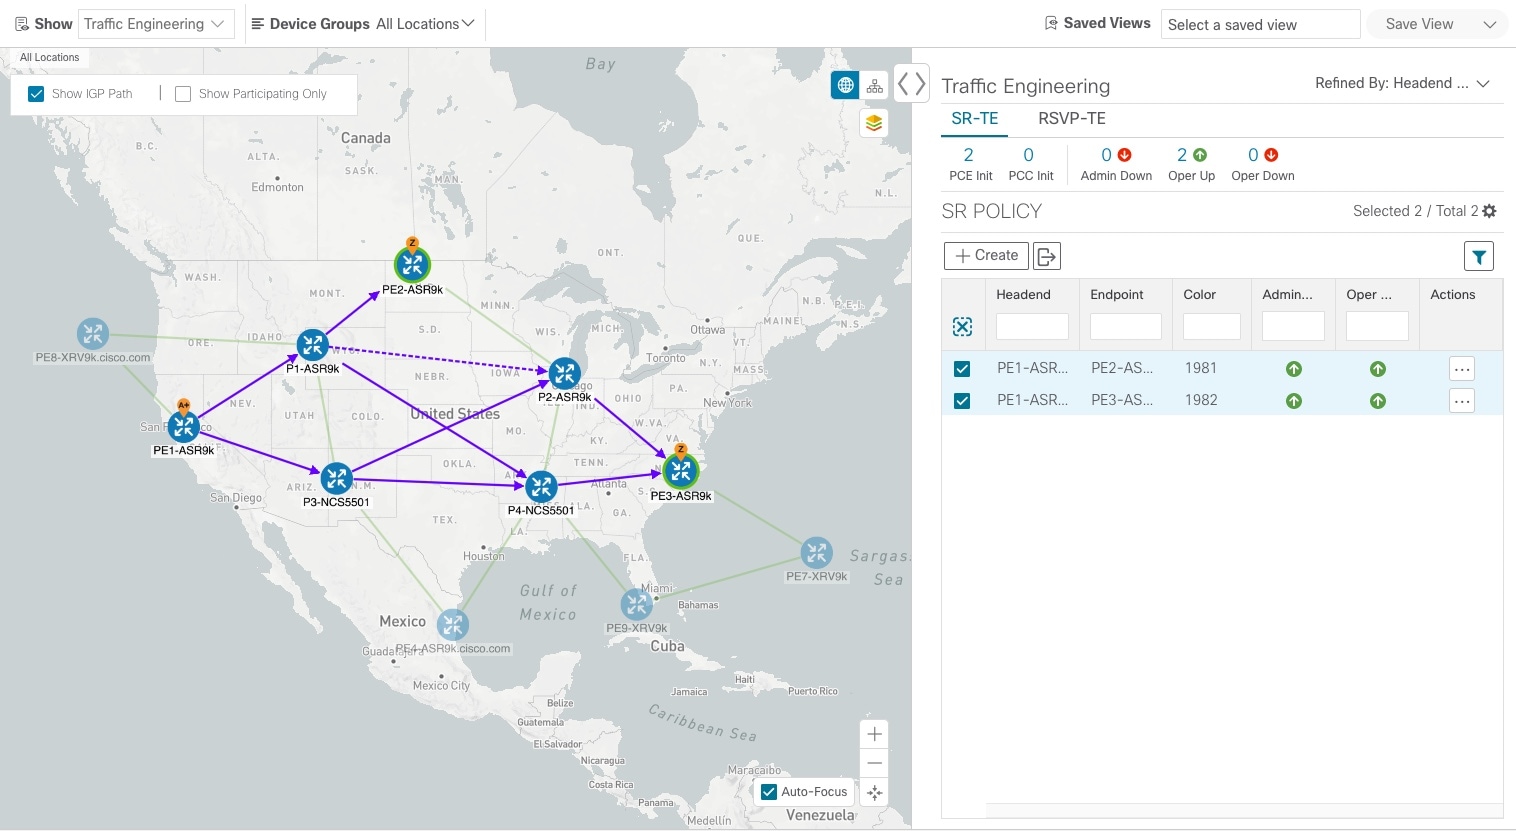
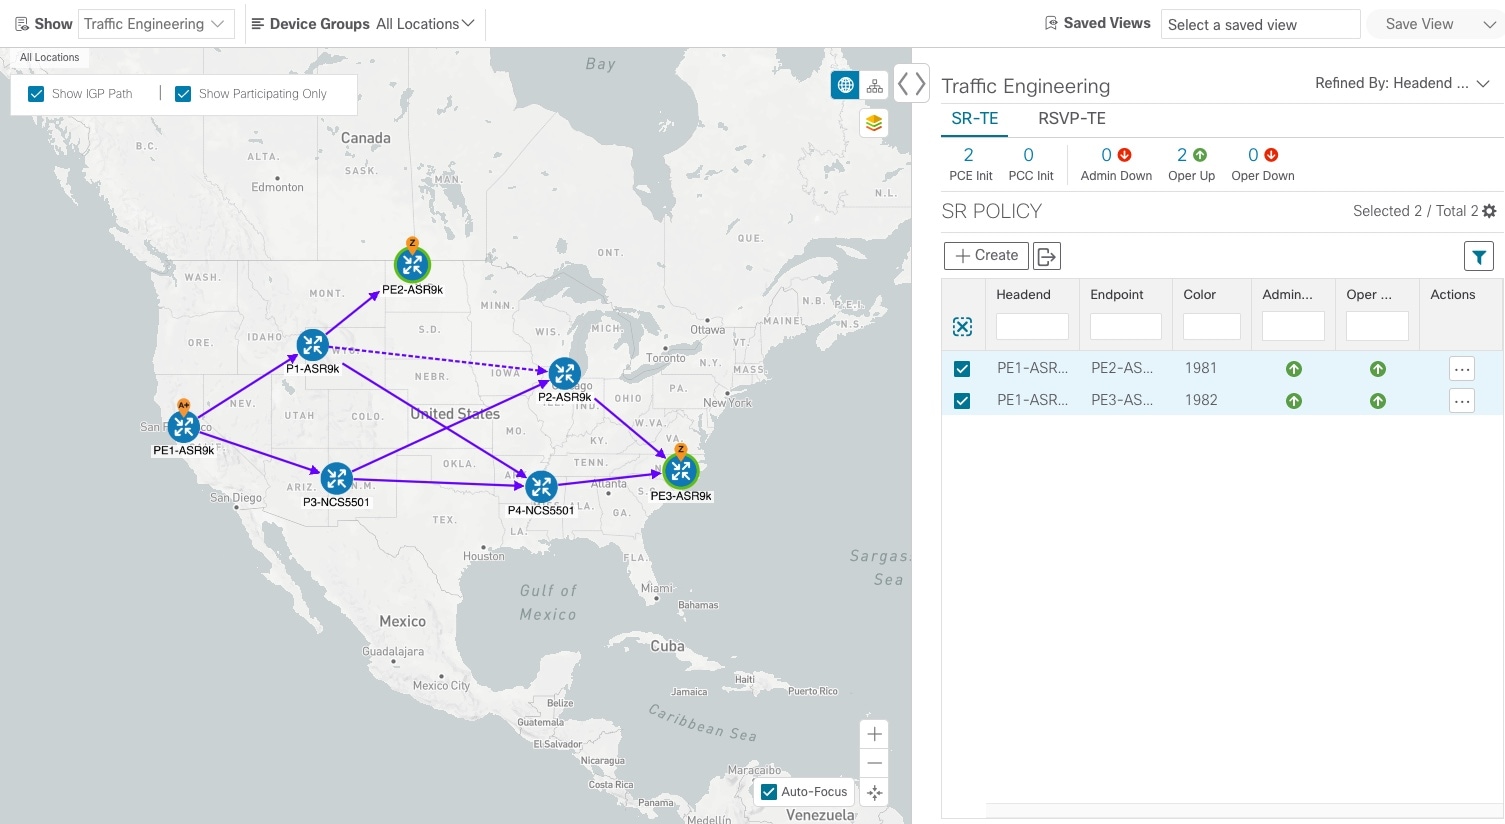
Click the appropriate check box to enable the following options:
|
|||
|
5 |
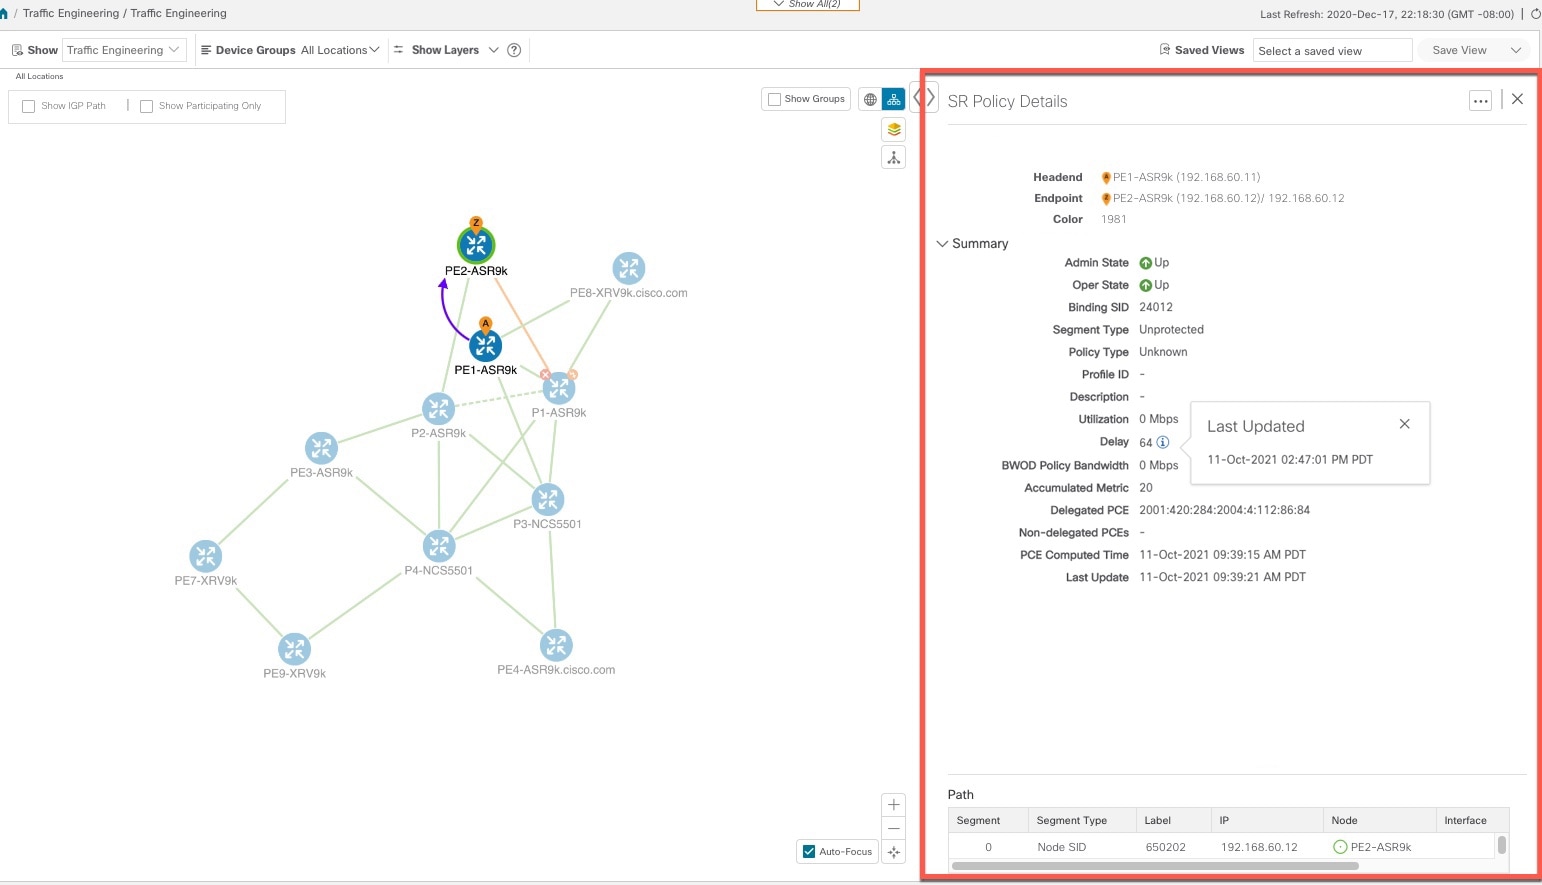
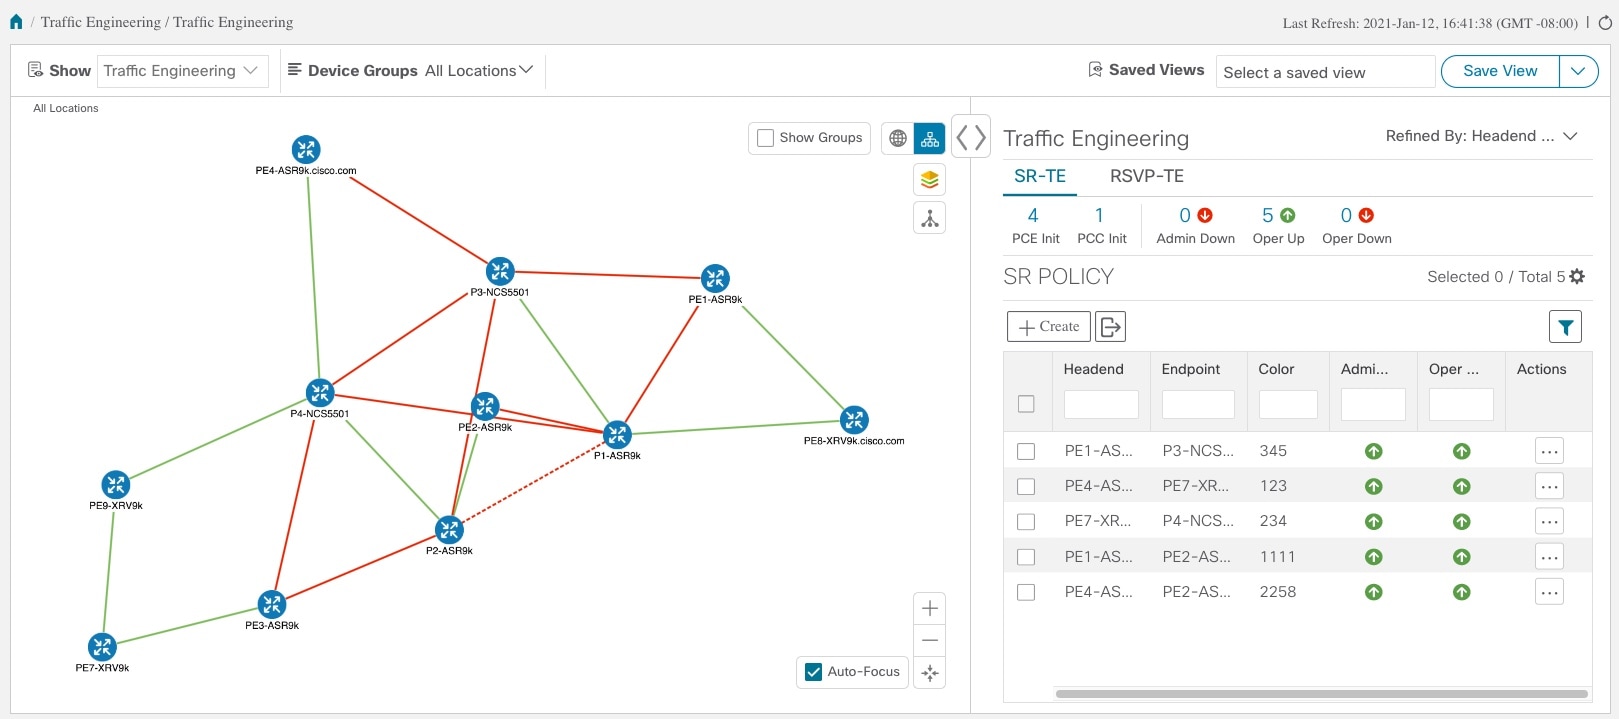
The content of this window depends on what has been selected or filtered. In this example, the SR-TE tab is selected and the SR Policy table is displayed. Depending on what is selected on the topology map, or whether you are in the process of viewing and managing TE tunnels, you can do the following: |
|||
|
6 |
Click on either the SR-TE or RSVP-TE tabs to view the respective list of TE tunnels. | |||
|
7 |
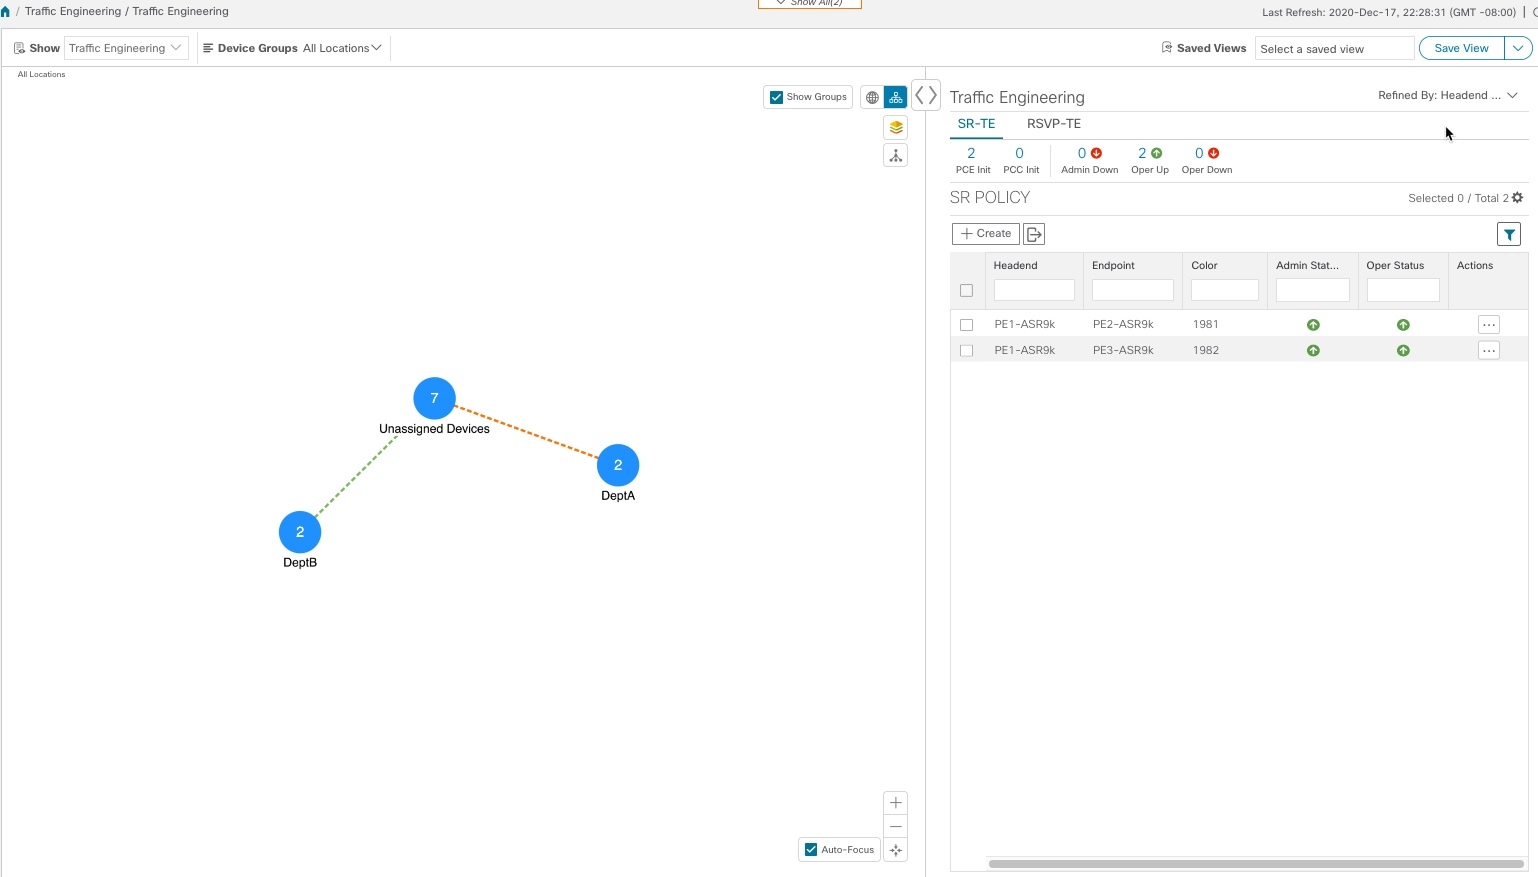
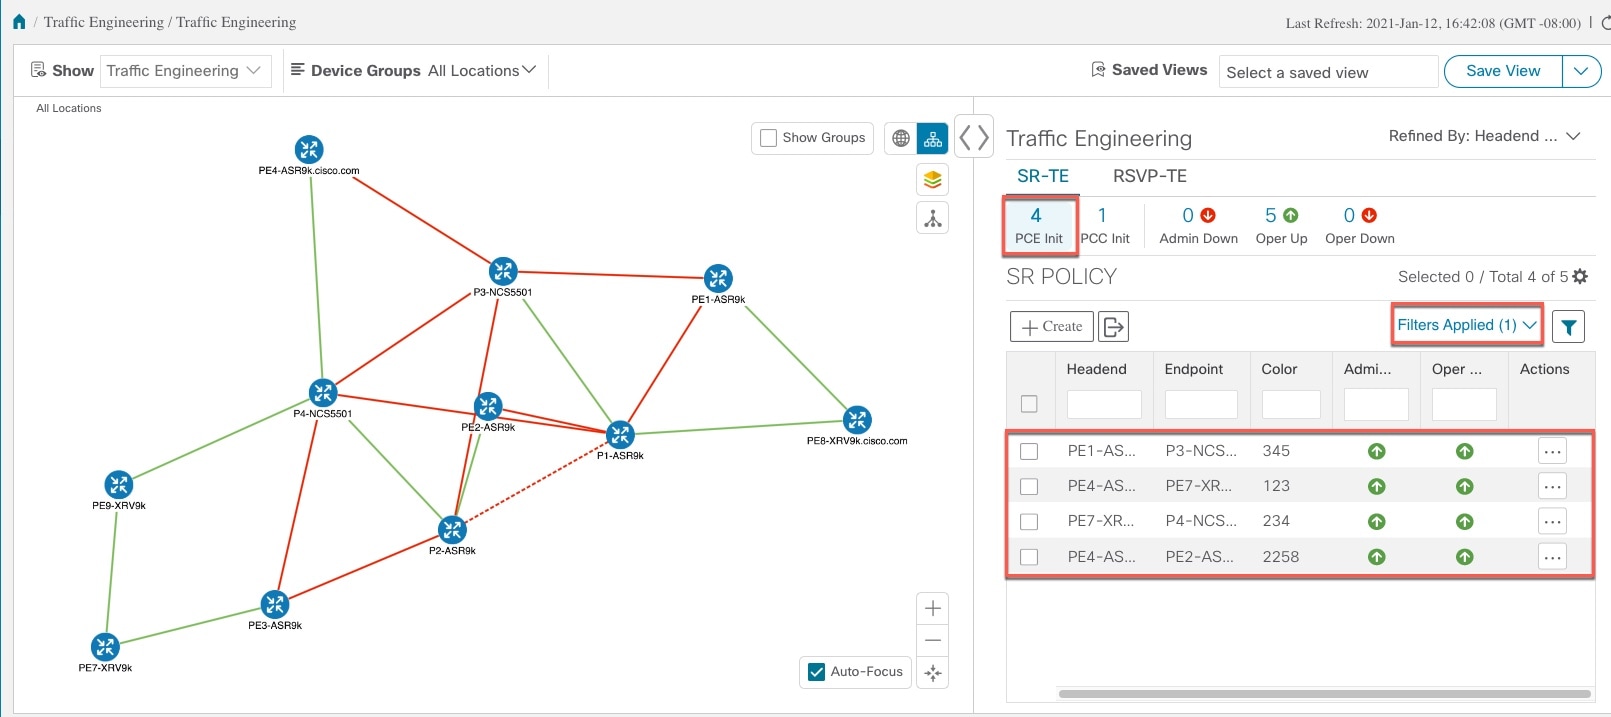
The Mini Dashboard provides a summary of the operational TE tunnel status and the number of PCC and PCE initiated tunnels that are currently listed in the SR Policy or RSVP-TE tables. If filters are applied, the Mini Dashboard is updated to reflect what is displayed in the SR Policy or RSVP-TE table. | |||
|
8 |
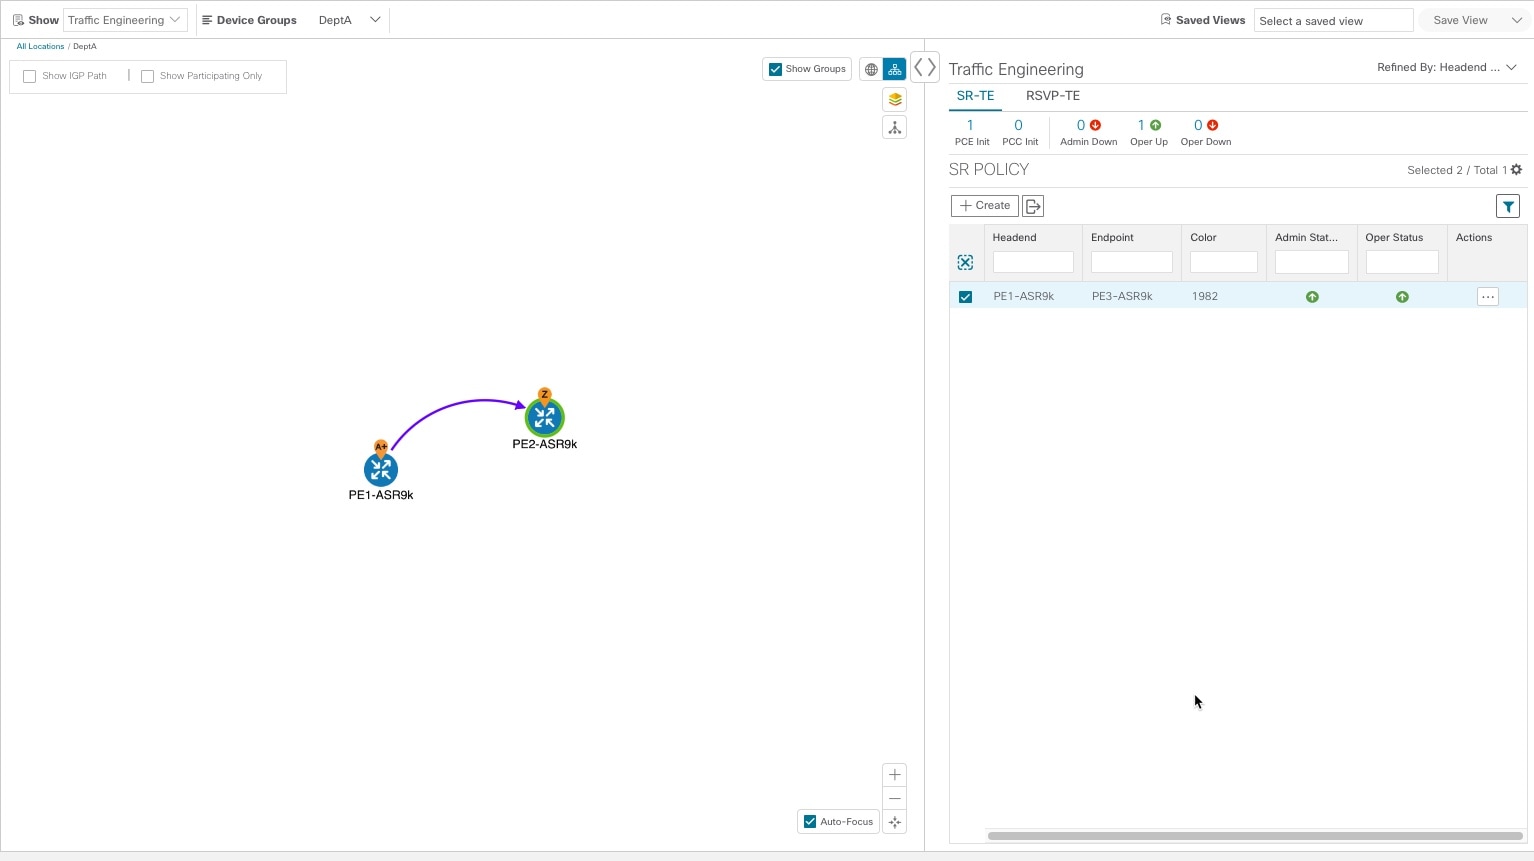
This option allows you to choose how the group filter (when in use) should be applied on the table data. For example, if Headend only was selected, then it would only display policies where the headend device of the policy is in the selected group. This filter allows you to see specific configurations and is useful when you have a large network. | |||
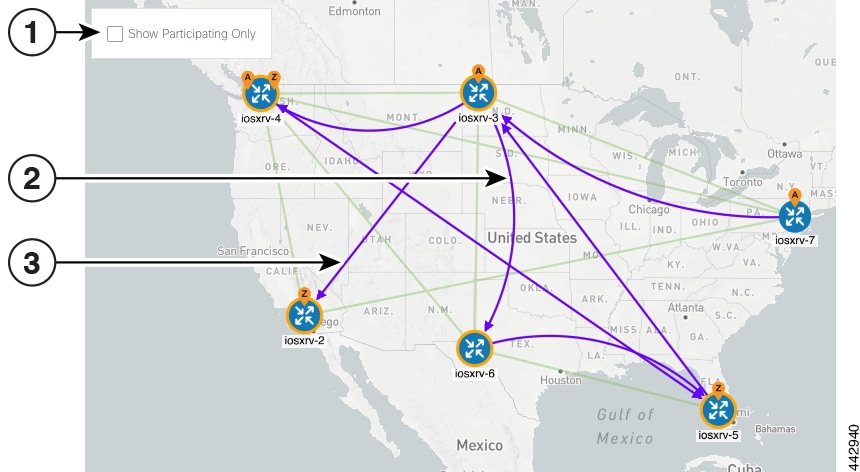
The display of RSVP-TE tunnels is similar except for the following:
| Callout No. | Description | |||
|---|---|---|---|---|
|
1 |
The Show IGP Path option is not available. |
|||
|
2 |
Record Route Object (RRO) paths are shown as straight lines. |
|||
|
3 |
Explicit Route Object (ERO) paths are shown as curved lines.
|
|||
 Feedback