Cisco Crosswork Situation Manager (6.5) Administration Guide
Available Languages
Cisco Crosswork Situation Manager Administration Guide
(Powered by Moogsoft AIOps 6.5)
First Published: 2018-08-13
Last Updated: 2018-08-13
Cisco Crosswork Situation Manager Licensing
Apply a Cisco Crosswork Situation Manager License
When you purchase Cisco Crosswork Situation Manager, Cisco provides you with a license key. After you install Cisco Crosswork Situation Manager, you can maintain your license key in the System Settings UI.
Navigate to Settings > System > Licensing to apply a new Cisco Crosswork Situation Manager license or to view details of your current license. You can set up a system notification to alert you within 1 to 120 days of a pending license expiration.
To add a new license key, copy and paste the license text into the Add New License Key text box and click Update License. A green panel confirms "Your new license key has been applied" when you enter a valid license.
Reporting and Dashboards
Insights
Operations managers can take advantage of Cisco Crosswork Situation Manager Insights to analyze trends in operational performance. Insights is built on the Stats API that exposes time-series data so you can report on:
■ Active Situations, the teams they're assigned to, and the services they impact
■ Reoccurring Situations that could indicate deeper systemic issues
■ Key performance indicators like Mean Time To Resolution
You can use the reporting tool of your choice to take advantage of the Stats API. Otherwise, check out the Moogsoft AIOps app for Grafana to view and modify the default dashboard.
Example Insights
Insights exposes a variety of statistics and metrics to help you understand your operations. For example, consider the valuable data in the default dashboard:
You can see how your teams are managing active Situations:
■ View the number of open Situations system-wide and see how many open Situations are unassigned, unacknowledged, or that have been reassigned.
■ Identify if the number of open reoccurring Situations which can highlight areas of impact that need increased attention or resource allocation.
You can monitor the distribution of your Situations over time, to see which teams handle the most Situations and which services are most impacted by Situations.
Key Performance Indicator metrics reveal how quickly Cisco Crosswork Situation Manager detects Situations and how quickly teams address open Situations over time:
■ Mean Time To Detect: the mean time to detect a Situation from the first event time.
■ Mean Time To Acknowledge: the mean time to acknowledge a Situation from the first event time.
■ Mean Time To Resolution: the mean time to resolve a Situation from the first event time.
For details on all the available Insights, see the Stats API reference.
Grafana Dashboards
You can view Cisco Crosswork Situation Manager statistics and reports in dashboards using Grafana.
To set up Grafana Dashboards, you must install Grafana, install the Moogsoft AIOps plug-in, and install the Grafana integration in Cisco Crosswork Situation Manager.
Prerequisites
Before you install the Moogsoft AIOps app, ensure you have met the following requirements:
■ You have installed Grafana or you have a hosted instance of Grafana.
■ Enable HTTPS is you are using an on-premises instance of Grafana. See the Grafana docs for how to edit the protocol, cert_file, and cert_key properties in the Grafana configuration .ini file.
Remove the initial semicolon ';' used to comment properties in the Grafana .ini files.
You can use the Grafana Setup Tutorial for an example of how to install Grafana on a host running Cisco Crosswork Situation Manager.
■ The port for Cisco Crosswork Situation Manager is open and accessible from Grafana.
Install the Moogsoft AIOps App
To install the Moogsoft AIOps app in Grafana, follow these steps:
1. Install the app.
2. Find it under Apps in your Grafana plug-ins and enter the following settings:
| Field | Value |
| URL | <Your Cisco Crosswork Situation Manager URL> |
| User | Your Graze username |
| Password | Your Graze password |
3. Enable the app. A "Test Success" message appears if successful.
After you have set up the app, you can configure your dashboards.
Create a Grafana Dashboard
You can add and configure multiple dashboards to display customized Cisco Crosswork Situation Manager statistics in Grafana. For more information see the Grafana documentation.
To create a dashboard, follow these steps:
1. Log in to your Grafana instance.
2. Click + and Dashboard.
3. Configure the dashboard to meet your requirements.
Once created, statistics from Cisco Crosswork Situation Manager appear in the dashboard.
Defaults Dashboards
There are two default dashboards that have been preconfigured to meet your needs.
One is included as part of the Cisco Crosswork Situation Manager app and another can be imported from the Grafana dashboards library.
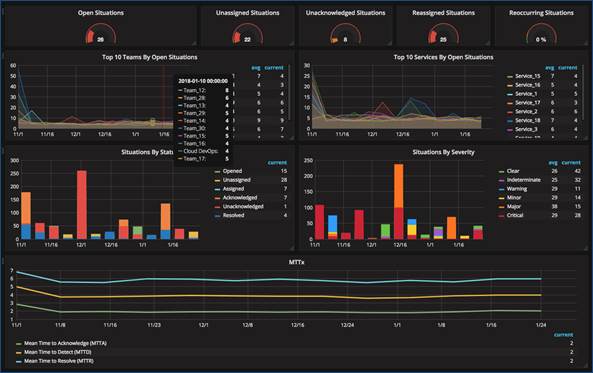
Ops Insights Dashboard
The Ops Insights dashboard is included as part of the Moogsoft AIOps app. It provides a broad overview of your Situation statistics, teams insights, and mean times to acknowledge, detect and resolve.
The dashboard's panels display the number of open Situations, unassigned Situations, reassigned Situations and reoccurring Situations. Other panels include the top 10 teams by open Situations, the top 10 services by open Situations, the number of Situations by status, the number of Situations by severity and a graph view of MTTA, MTTD and MTTR.
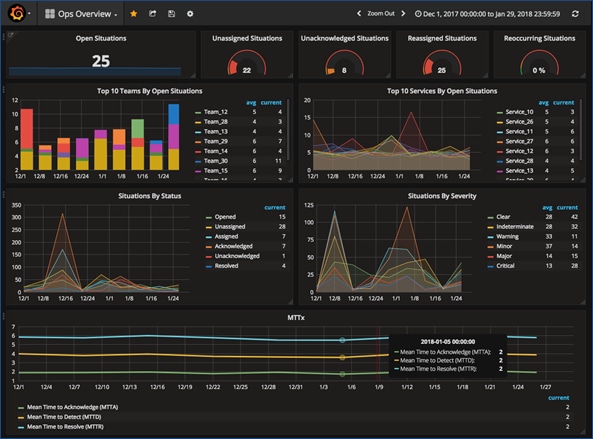
To edit the dashboard, click the header of any panel and edit the statistic endpoint or add a query. Alternatively, click Add Row at the bottom of the screen.
Noise Reduction Dashboard
The Noise Reduction dashboard displays an overview of the noise reduction performance of Cisco Crosswork Situation Manager.
This dashboard shows statistics including the number of accumulated events reduced into alerts and Situations over a period of time, the percentage reduction of events to alerts, the percentage reduction of alerts to Situations and the overall reduction.
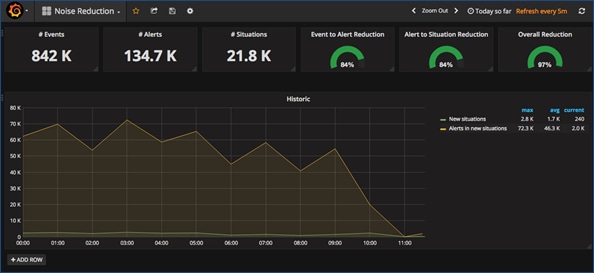
It can be imported from the Grafana dashboards library. See Noise Reduction dashboard for more information.
Legacy Dashboards
Cisco is deprecating support for the legacy built-in Cisco Crosswork Situation Manager Dashboards. Use the Cisco Crosswork Situation Manager Insights feature built on the Stats API. You can get started with the default Insights dashboard built for Grafana.
Dashboards are screens comprising a series of Portlets that offer overviews and statistics for different aspects of Cisco Crosswork Situation Manager.
This allows you to analyze statistics such as the average number of Alerts per Situation and offers visual diagrams displaying the distribution of open Alerts etc.
Click to open the different 'Dashboards' in the top-left corner of the screen. By default these are the Management Dashboard and the Cisco Crosswork Situation Manager Dashboard.
You can toggle the Dashboard between full screen and standard size using the resize arrows in the top-right corner of your screen.
Portlets
Portlets are the configurable components of the Dashboard, similar to widgets, which offer different overviews and statistics relating to the Alerts, Situations and other aspects of Cisco Crosswork Situation Manager.
These include: Bar Charts, Numbers, Tables, Self Monitoring, and so on.
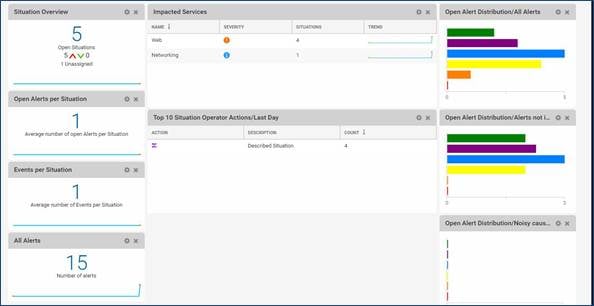
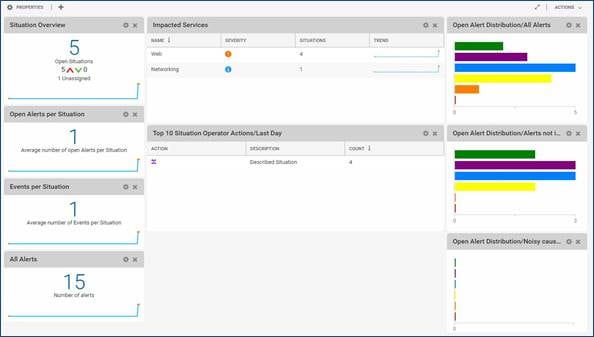
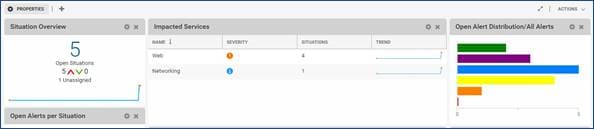
Cisco Crosswork Situation Manager Dashboard
The Cisco Crosswork Situation Manager Dashboard is displayed by default when you open Dashboards.
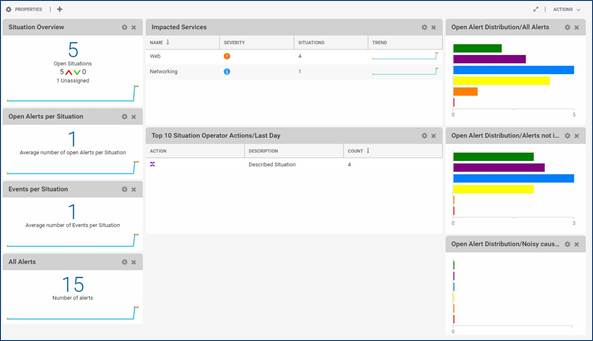
This Dashboard features the following Portlets: Situation Overview, Open Alerts per Situation, Events per Situation, All Alerts, Impacted Services, Top 10 Situation Operator Actions, Open Alert Distribution (All Alerts), Open Alert Distribution (Alerts not in Situations) and Open Alert Distribution (Noisy Causal Alerts).
Management Dashboard
The Management Dashboard offers a Manager's perspective and overview of useful Cisco Crosswork Situation Manager statistics.
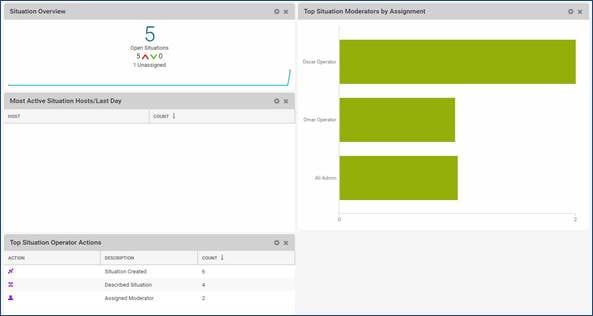
This Dashboard includes the following Portlets:
| Portlet | Description |
| Situation Overview | This shows if the number of Situations is increasing or decreasing and if they are being assigned and resolved in a timely manner. |
| Most active Situation hosts | This monitors which hosts are experiencing the most operational issues. |
| Top Situation operator actions | This helps you to understand the amount of effort involved in maintaining Situations. |
| Top moderators | This determines which moderators have the highest workload. |
Legacy Dashboard Configuration
Cisco is deprecating support for the legacy built-in Cisco Crosswork Situation Manager Legacy Dashboards. Use the Cisco Crosswork Situation Manager Insights feature built on the Stats API. You can get started with the default Insights dashboard built for Grafana.
Each Dashboard is customizable so different Portlets can be added and removed as required and the columns in each Dashboard can be resized.
Portlets can also configured to display different statistics and moved around on the Dashboard.
Actions that can be performed by Administrators are listed in the table below:
| Icon | Action |
|
| Edit Properties: This allows you to edit the properties of the Dashboard or Portlet. |
|
| Close Panel: This closes the Portlet panel and removes it from the Dashboard. |
|
| Add Portlet: This can be used to add a new Portlet to the Dashboard. |


Add Dashboards
To add a new Dashboard, click + Add Dashboard in the top-left corner of the screen.
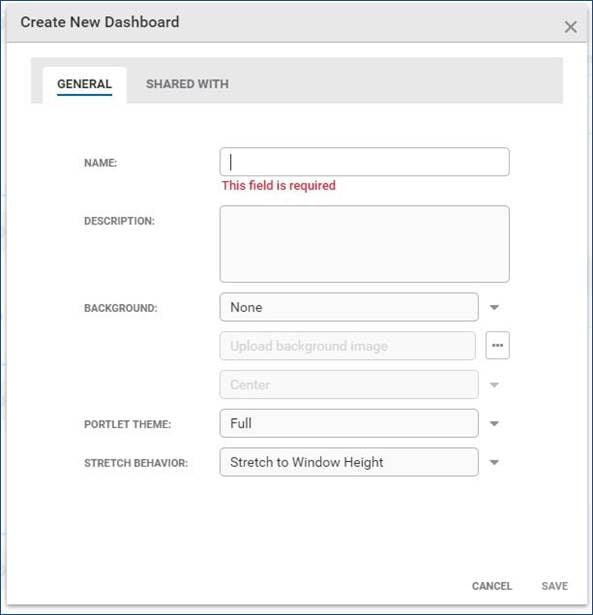
On the 'General' tab you can configure the Dashboard with the following fields:
| Field | Input | Description |
| Name | String | A name for the new Dashboard. |
| Description | String | A text description of the new Dashboard. |
| Background | None Uploaded Image | Select whether to have no background or an uploaded image as the background. |
| Uploaded Image | Fill Window Fit to Window Stretch to Fill Window Center | After uploading an image, select the position of the image in the background. |
| Portlet Theme | Minimal Full (default) | Select a theme: · Full to show Portlet borders and title bars · Minimal to hide Portlet borders, title bars, and so on |
| Stretch Behavior | Stretch to Window Height Stretch to Longest Column | Select the stretch behavior of the Dashboard: · Stretch to Window Height means all available space is filled with the Portlets · Stretch to Longest Column means all Portlets expand to match the longest column in the Dashboard |
On the 'Shared with' tab you can select who the new Dashboard is shared with. The options are either 'Everyone' or 'Specific Teams'.
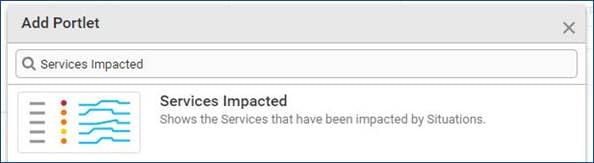
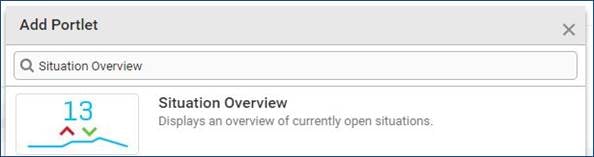
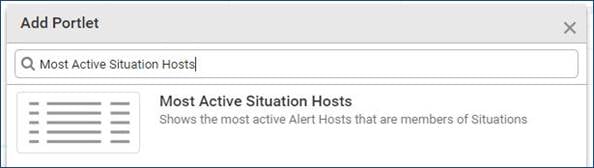
Add Portlets
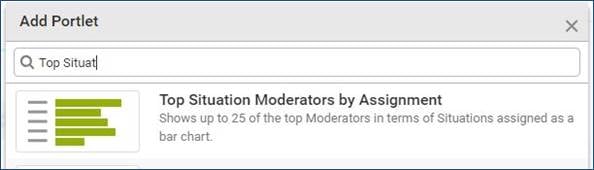
Click the + Add Portlet... icon to add a new Portlet to the Dashboard that is open. This opens the Add Portlet pop-up window:
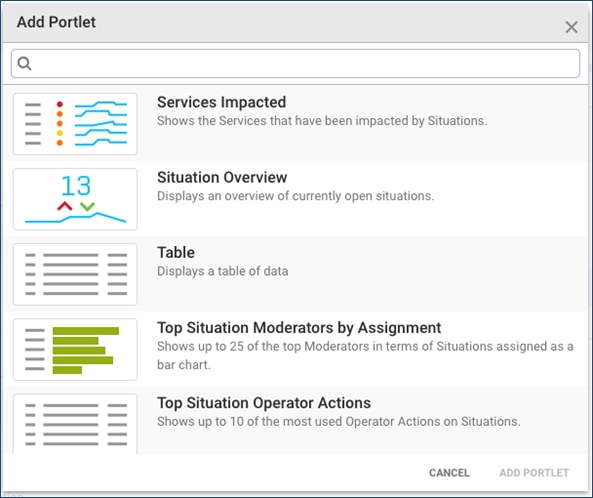
Type the name of the Portlet you want to add in the search bar at the top or scroll down and select the required Portlet. Then click Add Portlet to continue.
Depending on the Portlet type, you may need to enter further details to configure the Portlet.
Portlets
Portlets are the configurable components of the Dashboard, similar to widgets, which offer different overviews and statistics relating to the Alerts, Situations, and other aspects of Cisco Crosswork Situation Manager.
Note: Administrators can add, remove, and configure different Portlets depending on your requirements.
Portlet Actions
There are a number of common actions that can be performed on most Portlets relating to resizing and reordering. These include:
| Icon | Description |
|
| Click and hold to move a Portlet to a new location in the Dashboard. |
|
| Click and drag the edge or column of any Portlet to increase or decrease the column or the Portlet width. |
|
| Click and drag the edge of a Portlet to increase the height of a Portlet. |
|
| Click to sort the Portlet rows in alphabetical ascending order. |
|
| Click to sort the Portlet rows in alphabetical descending order. |
|
| Click and then check or uncheck the columns you want to be shown or hidden. |


Portlet Types
There are a different types of Portlets that can be added to your Dashboards.
Bar Chart Portlet
The Bar Chart Portlet is like a standard chart that presents data in horizontal rectangular bars with lengths proportional to their respective values.
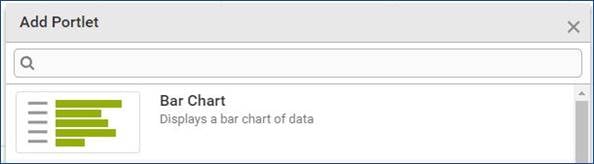
The statistics displayed in the Bar Chart Portlet update dynamically as Alerts and Situations change.
Examples
Some examples of the different Bar Chart Portlets are shown below:
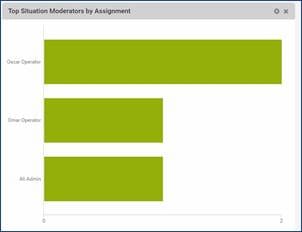
Top Situation Moderators by Assignment
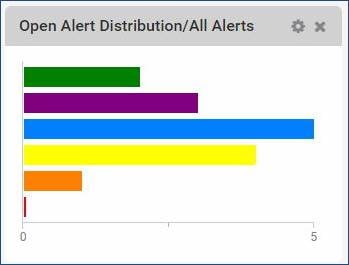
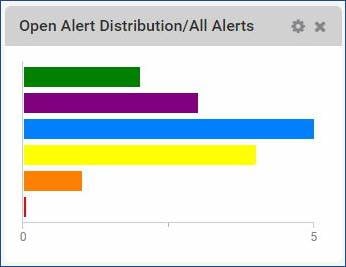
Open Alert Distribution/All Alerts
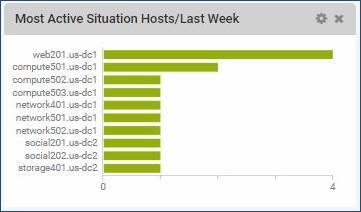
Most Active Situation Hosts/Last Week
Click any of the bars in the Bar Chart Portlets to open a Filter view of that specific value. For example, clicking the orange bar in Open Alerts Distribution opens a Filter of all open Alerts with major severity.
Configure a Bar Chart
Enter a title for the Bar Chart under 'Title'. If you don't manually enter a title, it automatically adopts the name of the statistic.
Next, click the ellipsis next to 'Statistic' to choose which statistics are displayed. These include the following:
| Statistic | Options |
| Most Active Situation Host | Last Day, Last Hour, Last Month, Last Week |
| Open Alert Distribution | Alerts not in Situations, All Alerts, Noisy Causal Alerts, Custom Filter* |
| Process Impacted | All Situations, Open Situations with Impacted Services, Custom Filter* |
| Service Impacted | All Situations, Open Situations with Impacted Services, Custom Filter* |
| Top Situation Moderators by Assignment | — |
| Top Situation Operators by Assignment | Last Day, Last Month, Last Day |
*Note: You can click the + icon to add a Custom Filter for these three statistics
Select a 'Value' and then choose whether to hide category labels or not. Finally, click Save to continue.
Number Portlet
The Number Portlet displays a single numeric statistic as a number or a state and its trend over time.
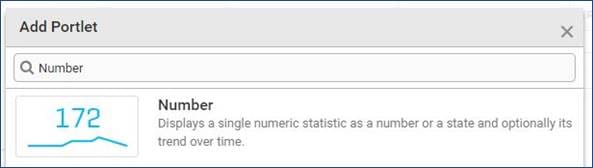
This Portlet displays dynamically updated data on Events, Alerts, and Situations attributes.
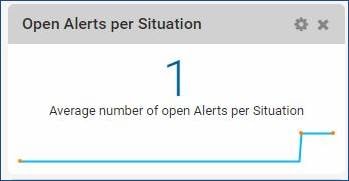
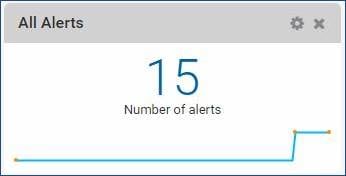
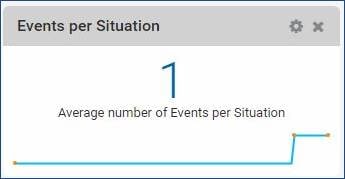
Examples
Some examples of the default Number Portlets are displayed below:
Open Alerts per Situation
All Alerts
Events per Situation
Configure Number Portlet
You can configure the different fields and which statistics are displayed when adding a Number Portlet:
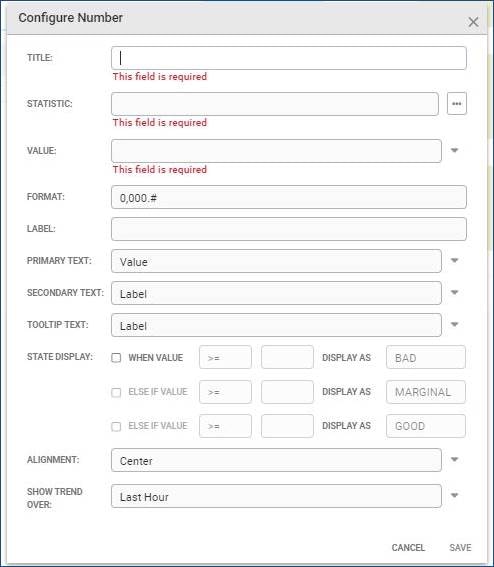
| Field | Input | Description |
| Title | String | A title or name for the Portlet. If none is entered, this is the name of the statistic. |
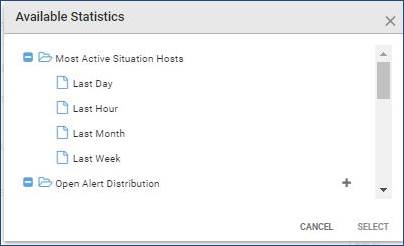
| Statistic | Selection | For more information, see “Available Statistics.” |
| Value | — | The values available depend of the statistic selected. |
| Format | Integer | This defines how the number is displayed in the Portlet. For example, 0.00 displays the number with two decimal places. |
| Label | String | This is a description of the Portlet number. For example, "Critical Situations" for a Portlet using the pre-defined Situation Filter 'Severity is Critical'. |
| Primary Text | Value Label Hidden | Select whether the large primary text displayed on the Portlet shows the 'Value' or the 'Label'. By default this is set to 'Value'. Select 'Hidden' to have not primary text displayed. |
| Secondary Text | Value Label Hidden | Select whether the smaller text displayed on the Portlet shows the 'Value' or the 'Label'. By default this is set to 'Label'. Select 'Hidden' to have not secondary text displayed. |
| Tooltip Text | Value Label | Select whether the Portlet number or the 'Label' is displayed on the tooltip. |
| State Display | Condition | Define whether a status icon appears in the Portlet and the threshold values for indicating good, marginal or bad status. |
| Alignment | Left Center Right | The alignment of the number, primary and secondary text in the Number Portlet. |
| Show Trend Over | Do not show trend Last Hour 6 Hours 12 Hours 24 Hours | This shows a line indicating whether the monitored statistic number is rising or falling over the specific time period. |
Available Statistics
The following statistics can be chosen for the Number Portlet:
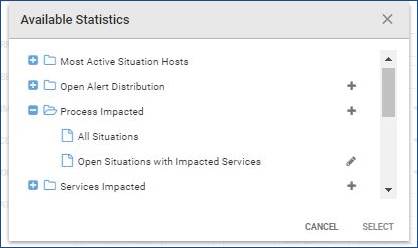
| Statistic | Options |
| Open Alert Distribution | Alerts not in Situations, All Alerts, Noisy Causal Alerts, Custom Filter* |
| Process Impacted | All Situations, Open Situations with Impacted Services, Custom Filter* |
| Services Impacted | All Situations, Open Situations with Impacted Services, Custom Filter* |
| Situation Filter Summary | All Situations, Open Situations with Impacted Services, Custom Filter* |
| System Summary Statistics | — |
| Top Situation Operator Actions | Last Day, Last Month, Last Week |
*Note: You can click the + icon to add a Custom Filter for these three statistics.
Open Alert Distribution Portlet
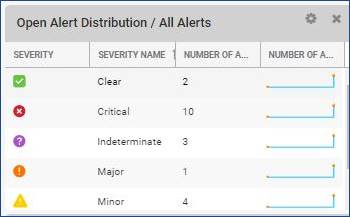
The Open Alert Distribution Portlet displays a graphical bar chart showing the open Alert distribution by severity.
When adding this Portlet, it shows all Open Alerts and their distribution by severity by default:
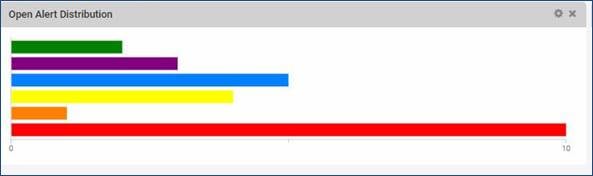
Click any of the bars to open the Situations with that severity in a Situation Filter.
Information: The number in the bottom-right corner is the number of Alerts with the severity that represents the largest proportion of the distribution.
Configure Open Alert Distribution
Click the gear icon to configure the Portlet. The Configure Open Alert Distribution window opens:
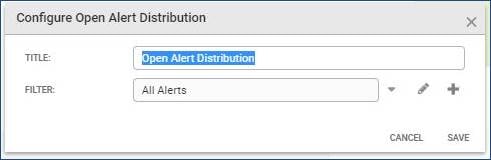
| Field | Input | Description |
| Title | String | Edit this to change the name of the Portlet. |
| Filter | Alerts not in Situations All Alerts Noisy Causal Alerts | Select whether the Portlet displays either: Alerts not in Situations, All Alerts or Noisy Causal Alerts. |
Configure Open Alert Distribution Portlet
Click the gear icon to configure the Portlet. The Configure Open Alert Distribution window opens:
| Field | Input | Description |
| Filter | Alerts not in Situations All Alerts Noisy Causal Alerts | Select whether the Portlet displays either: Alerts not in Situations, All Alerts or Noisy Causal Alerts. |
| Title | String | Edit this to change the name of the Portlet. |
Self Monitoring Portlet
The Self Monitoring Portlet displays dynamically updating icons that indicate the current health of the Cisco Crosswork Situation Manager processes.
This is useful for monitoring the overall health and status of your Cisco Crosswork Situation Manager system.
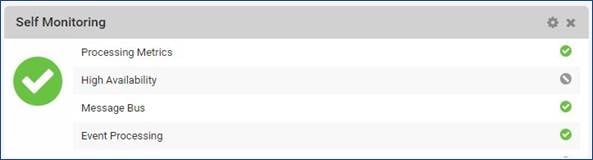
The status of each component of Cisco Crosswork Situation Manager listed in the Portlet is indicated by icons on the right of the window:
| Icon | Meaning |
|
| At least one unreserved (optional) process not running. These are not all expected to be running. |
|
| All processes running normally. |
|
| At least one reserved process has missed some heartbeats. This could indicate a potential problem and ought to be investigated. |
|
| At least one reserved process either not running or has missed their last heartbeat. The process may have failed or has not been started. This could be a critical error and Cisco Crosswork Situation Manager may not be working properly. |


The larger icon on the left is the overall status indicator and its color indicates the health of the least healthy process.
In the example above, High Availability has one or more unreserved process not running, indicated by the grey icon. All other processes are running normally, indicated by the green icons. As not all unreserved processes are expected to be running, the large overall status indicator on the left is green.
Configure Self Monitoring Portlet
Click the gear icon to configure the Portlet. The only configuration that can be done to Self Monitoring is changing the name of the Portlet:
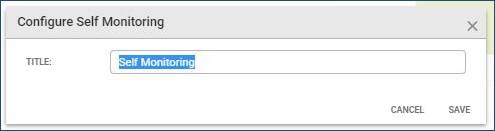
Delete the current Title and change the text as required. Click Save to continue.
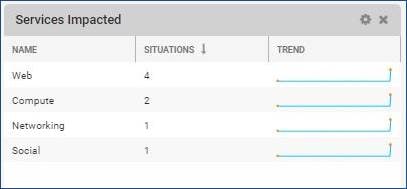
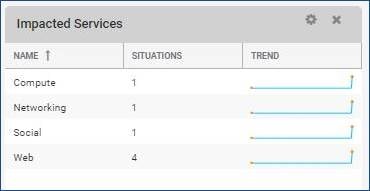
Services Impacted Portlet
The Services Impacted Portlet shows all Services that have been impacted by Situations.
By default, this Portlet displays three columns: the Service name, the number of Situations that are impacting it, and the trend.
Portlet Actions
To change the order in which the columns are displayed or to show or hide different columns, click the drop-down arrow in the top-right corner of a column:
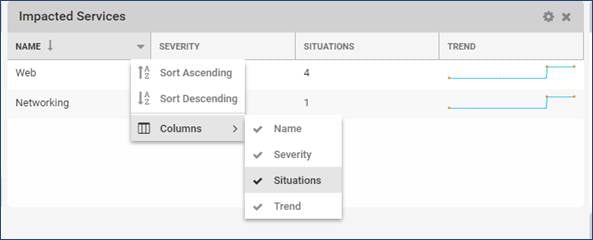
You can select whether to order by ascending or descending and select which columns are visible by checking or unchecking them.
Double-click any row to view the Situations as a list in the Situation Filter view.
Configure Services Impacted Portlet
Click the gear icon to configure the Portlet. The configuration window is the same for the Table Portlet:
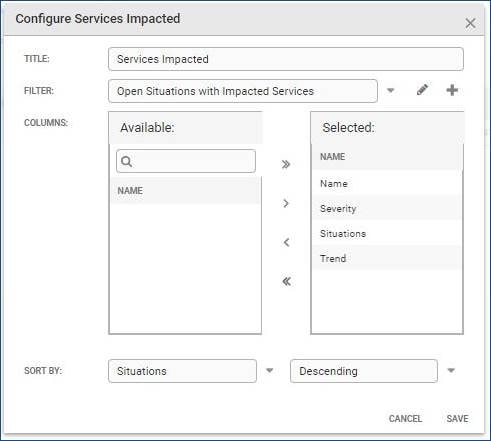
| Field | Input | Description |
| Title | String | The name of the Portlet. |
| Statistic | - | The statistic you want shown in the Portlet. |
| Columns | - | The columns you want shown in the table. These depend on the statistic shown. |
| Sort By | Selection | The values depend on the statistic that was selected. You can also select whether the results are ordered in ascending or descending order. |
Click Save to continue and create the Portlet.
Configure Services Impacted Portlet
Click the gear icon to configure the Portlet. This opens the configuration window for the Portlet:
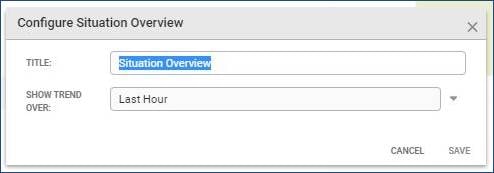
| Field | Input | Description |
| Title | String | The name of the Portlet. |
| Show Trend Over | Do not show trend Last Hour 6 Hours 12 Hours 24 Hours | The trend you want shown in the Portlet. |
Click Save to continue and create the Portlet.
Situation Overview Portlet
The Situation Overview Portlet displays dynamically updated data on the number of open Situations in the system.
This Portlet also shows the number of unassigned Situations and a Situations trend line. This is useful to see if the number of Situations and their severity is increasing or decreasing and if they are being assigned and resolved in a timely manner.
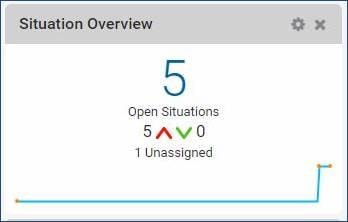
Note: The number of Situations in this Portlet does not include superseded Situations.
Portlet Actions
You can click different components of the Portlet to display the information in a new window:
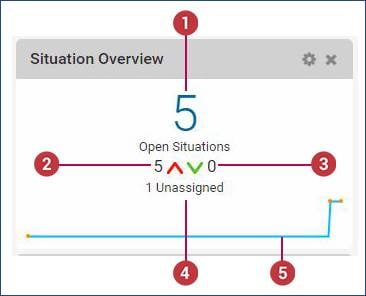
The different screens and information that are opened by clicking the different components of the Situation Overview Portlet are listed below:
| Icon | Description |
|
| Click the 'Open Situations' number to open a Situation Filter showing all Open Situations. |
|
| Click the green arrow or the number alongside it to open a Situation Filter showing all Open Situations trending down. |
|
| Click the red arrow or the number alongside it to open a Situation Filter showing all Open Situations trending up. |
|
| Click the unassigned number to open a Situation Filter showing all unassigned Open Situations. |
|
| The trend line shows the trend from when the Dashboard was opened. Point along the line to see the details of the number of Situations trending up or down, as well as the date and time. |


Table Portlet
The Table Portlet displays dynamically updated data on Alerts and Situations attributes.
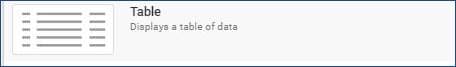
Table portlets can be configured by an Administrator to stretch vertically, automatically filling the space available.
Portlet Actions
To change the order in which the columns are displayed or to show or hide different columns, click the drop-down arrow in the top-right corner of a column:
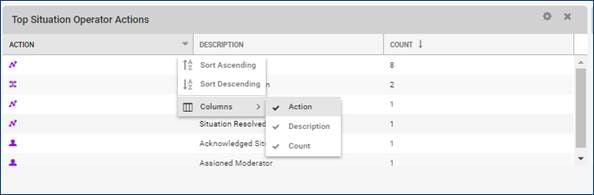
You can select whether to order by ascending or descending and select which columns are visible by checking or unchecking them.
Double-click any row to view the Situations as a list a Situation Filter view.
Examples of Table Portlets
Open Alert Distribution/ All Alerts
Impacted Services
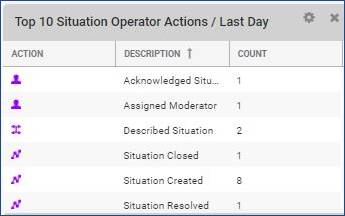
Top 10 Situation Operator Actions/Last Day
Configure Table Portlet
The Configure Table window opens when you add a Table Portlet for the first time.
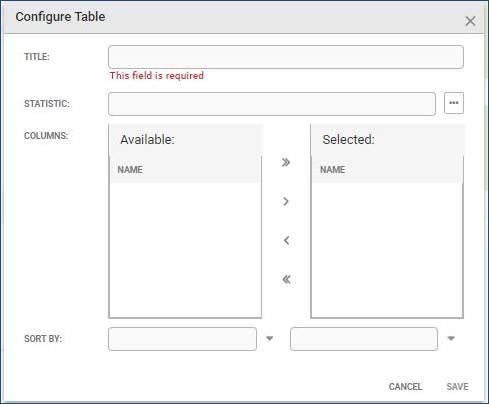
| Field | Input | Description |
| Title | String | The name of the Portlet. |
| Statistic | - | The statistic you want shown in the Portlet. |
| Columns | - | The columns you want shown in the table. These depend on the statistic shown. |
| Sort By | Selection | The values depend on the statistic that was selected. You can also select whether the results are ordered in ascending or descending order. |
Click Save to continue and create the Portlet.
Top Situation Moderators by Assignment Portlet
The Top Situation Moderators by Assignment Portlet is a bar chart which dynamically updates to display the top 25 moderators with the most Situations assigned to them.
This Portlet is useful for determining which moderators have the highest workload.
Portlet Actions
Hover your mouse cursor over each bar to view the number of Situations each moderator has assigned to them.
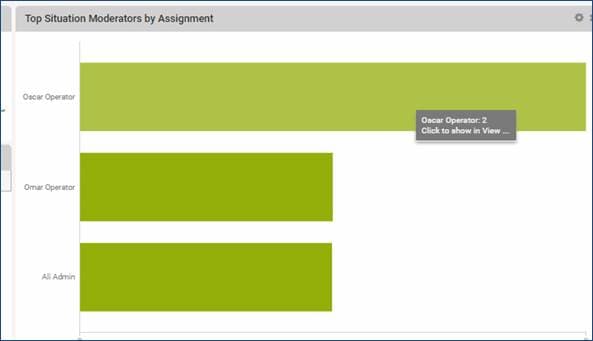
Click the bar to open and view the Situations in the Situation Filter.
Top Situation Operator Actions Portlet
The Top Situation Operator Actions Portlet displays dynamically updated list of the top 10 actions carried out by Operators on Situations within the last day, week, or month.
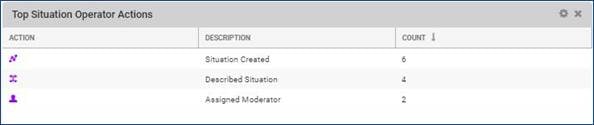
This information helps understand the amount of manual (user) effort involved in maintaining Situations.
Portlet Actions
To change the order in which the columns are displayed or to show or hide different columns, click the drop-down arrow in the top-right corner of a column:
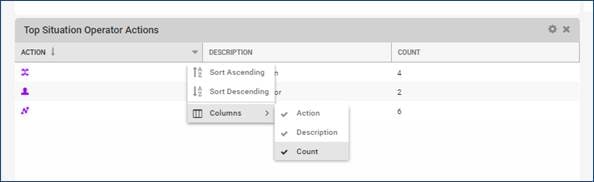
You can select whether to order by ascending or descending and select which columns are visible by checking or unchecking them.
Double-click any row to view the Situations as a list in the Situation Filter view.
Configure Top Situation Operator Actions Portlet
Click the gear icon to configure the Portlet. The configuration window is the same for the Table Portlet:
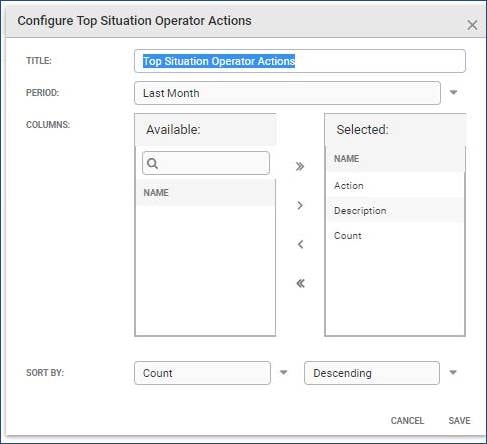
| Field | Input | Description |
| Title | String | The name of the Portlet. |
| Statistic | - | The statistic you want shown in the Portlet. |
| Columns | - | The columns you want shown in the table. These depend on the statistic shown. |
| Sort By | Selection | The values depend on the statistic that was selected. You can also select whether the results are ordered in ascending or descending order. |
Click Save to continue and create the Portlet.
Most Active Situation Hosts Portlet
The Most Active Situation Hosts Portlet counts the number of Alerts that are associated with each host, and shows the hosts with the highest number of Alerts that are in Situations.
This is useful for gaining an overview of which hosts, the systems monitored by Cisco Crosswork Situation Manager, are experiencing the most operational issues.
The portlet displays up to the top 10 hosts and includes data from all open and closed Situations, but not superseded Situations.
By default, each host has a row in the table, with the total count of Alerts associated with that host.
Examples
See an example of the Most Active Situation Hosts Portlet below:
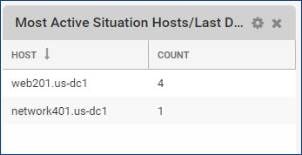
Double-click any of the hosts to view them in a Filter view.
Configure Most Active Situation Hosts
To configure the Portlet, add it to the Dashboard and then click the gear icon.
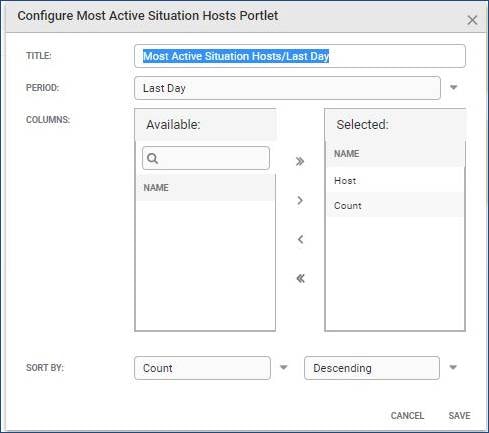
You can change the following information displayed in the Portlet:
| Field | Input | Description |
| Title | String | The name of the Portlet. |
| Period | Last Hour Last Day Last Week Last Month | The time period: Last Hour, Last Day, Last Week, Last Month. |
| Columns | Host AND/OR Count | Choose whether to display the 'Host' name, the 'Count' or both. |
| Sort By | Count OR Host Ascending OR Descending | Choose whether to sort by 'Host' or 'Count' and by 'Descending' or 'Ascending' order. |
Click Save to continue.
User Access
Manage Users
As with most software systems, you use user credentials to provide secure access to Cisco Crosswork Situation Manager for your personnel. You can use the System Settings UI to manage the various attributes that define users and the actions they're allowed to perform inside Cisco Crosswork Situation Manager.
As an alternative to managing users in the UI, you can configure the system to allow Single Sign-On (SSO) via the Security Assertion Markup Language (SAML) protocol. If you have a large number of users, enabling SSO saves you from setting them up individually. It also improves security by requiring users to remember a single complex password instead of multiple credentials for multiple systems.
Within the SAML configuration you can specify a role, primary group and team to assign to users when they authenticate for the first time. See SAML 2.0 for further information. You can also authenticate users with Lightweight Directory Access Protocol (LDAP).
Manually Create and Edit Users
To view a list of users, navigate to Settings > Users. Use the search box on the left to filter the list. You can click the person icon to toggle the display of inactive users.
Click + to create a new user or select a user to view and edit their attributes.
You cannot delete users. The system retains a history of all user activity, including collaboration posts and ownership of alerts and Situations. You can set obsolete users to inactive in the Personal tab.
Cisco Crosswork Situation Manager includes the following predefined users:
■ Administrator: Super user role.
■ Graze API user. Grazer role. This user is intended for system integration purposes, it is not a UI user.
■ System Owner: Super user role.
■ Moog. An anonymous system account used for unassigned alerts and Situations.
We recommend that you change the default password for each predefined user. Once you have set up your own users or enabled user authentication you may wish to deactivate the predefined users.
Edit User Details
Navigate to the Personal tab to view or edit the following user details:
■ Username with 32 characters maximum. Mandatory.
■ Full name.
■ Password. If you do not enter a password the user is created as an LDAP user.
■ Primary group. Mandatory.
■ Department.
■ Time zone if different to the system time zone.
■ Active status. Inactive users cannot log into the UI. New users are active by default.
■ Timeout. You can use the role timeout of 60 minutes or define a custom timeout period between 60 and 480 minutes (8 hours).
You can view or edit the user's email address or telephone number on the Contact tab.
Manage a User's Roles
Roles group the permissions users need to perform a set of tasks within Cisco Crosswork Situation Manager. You must assign at least one role to each user.
Assign a User Competencies
You can use competency rankings to indicate the user's level of expertise. Double-click the ranking and use the up and down arrows to adjust the number.
Assign a User to Teams
You can optionally group users into teams, to ensure that users working together view the Situations that are relevant to them. You can configure Cisco Crosswork Situation Manager to assign Situations to a particular team if they impact selected services or meet other criteria.
Manage Teams
You can use the optional Teams feature in Cisco Crosswork Situation Manager to allow users working together to view the Situations that are relevant to them.
You can configure the system to automatically create teams based on certain Situation data, or you can manually create teams.
Create and Edit Teams
To view a list of teams, navigate to Settings > Teams. Use the search box on the left to filter the list. You can click the people icon to toggle the display of inactive teams.
■ Click + to create a new team.
■ Click a team name and then the copy icon to duplicate a team.
You cannot delete teams. The system retains a history of all team activity. You can set obsolete teams to inactive in the General tab.
To create a team, you must assign the team a name of maximum 64 characters. You can optionally provide a description of the team.
By default, teams are active. Deselect the Active check box to deactivate a team. Inactive teams don't appear in team rooms and cannot have Situations assigned to them.
Navigate to the Users tab to select the users to belong to this team. You can define an alternative landing page for the team members on the Settings tab.
Create Automatic Teams
You can configure Cisco Crosswork Situation Manager to create teams based on current Situation data.
Creating automatic teams sets all existing teams to inactive.
You can create teams based on any of the following Situation fields:
■ Description
■ Services Impacted
■ Process Impacted
■ Queue
After Cisco Crosswork Situation Manager creates a team, you can view and edit the team settings and membership.
Configure Team Permissions
You can filter data visible to team members according to services, Situations or alerts:
■ Create a Service Filter in General to select services for which the team views affected Situations. Adding more than 200 services may affect system performance and stability.
■ Create a Situation Filer in General to select the Situations to be viewed by the team.
■ Create an Alert Filter in Settings to select the alerts to be viewed by the team.
Permissions are additive. Therefore if you set several filters, Situations and alerts that meet any one of them are included. For example, you could set up a team's permissions so that the team views critical Situations affecting a database service, a messaging service, and a web service.
The 'all_data' permission in a user role overrides the filters in team settings. Users with the 'all_data' permission can view all Situations and alerts.
If you want users to see only the alerts and Situations that are assigned to their team, configure roles and users as follows:
1. Create a role without the 'all_data' permission.
2. Assign the role to your users.
3. Add the users to the team.
Manage Roles
Roles group the permissions users need to perform a set of tasks within Cisco Crosswork Situation Manager. You can create roles for specific job functions and assign them the permissions to perform certain operations. For example, you could create a role named Situation Manager and assign it the permissions to perform certain operations. For example, you could create a role named Situation Manager and assign it the permissions for managing alerts and Situations.
You must assign at least one role to every user. You can do this manually when you create the user or you can map roles to users if you use SAML.
Cisco Crosswork Situation Manager contains a set of predefined roles with a predefined set of permissions.
Create, Edit, and Delete Roles
To view a list of roles, navigate to Settings > Roles. You can use the search box on the left to filter the list.
Select a role to view and edit its configuration. You can edit the following:
■ Selected permissions.
■ Session timeout. You can use the system timeout of 60 minutes or define a custom timeout period.
■ Landing page. You can choose to inherit the landing page from the system configuration or select an alternative page.
You can also perform the following operations:
■ Click + to create a new role.
■ Click a role name and then - to delete a role.
You cannot delete a role that is assigned to users. Remove the role from all users first.
Role Permissions
Cisco Crosswork Situation Manager contains the following predefined roles: Super User, Administrator, Manager, Operator, Customer, and Grazer.
The REST LAM Sender role is designed for use with REST LAM integrations. The role restricts UI functionality, so you should not assign it to UI users.
| Permission | Description | Super User | Admin | Manager | Operator | Customer | Grazer |
| add_media | Attach files to the collaborate tab in Situations. Upload a photo to a user avatar. | X | X | X | X | X | X |
| alert_assign | Assign alerts. | X | X | X | X |
| X |
| alert_close | Manage alerts including changes to significance and severity. | X | X | X | X |
| X |
| alert_modify | View all data. Users without this permission can only view Situation and alert data related to their teams. | X | X | X | X |
| X |
| all_data | Create and edit the user's own personal Situation and alert filters. | X | X | X | X | X | X |
| filters | Log in to the Graze API. | X | X | X | X | X | X |
| graze_login | Access the Integrations tab. |
|
|
|
|
| X |
| manage_integrations | Manage maintenance windows. | X |
|
|
|
|
|
| manage_maint | Access the Cisco Crosswork Situation Manager application on a mobile device. | X | X | X | X |
| X |
| mobile | Access the Cisco Crosswork Situation Manager application on a mobile device. |
|
|
|
|
|
|
| moderator_assign | Assign a Situation owner. | X | X |
| X |
| X |
| prc_feedback | Mark alerts with Probable Root Cause feedback. | X | X | X | X |
| X |
| sig_close | Close Situations. | X | X | X | X |
| X |
| sig_create | Create Situations manually and from alerts. | X | X | X | X |
| X |
| sig_modify | Manage Situations including changes to severity, queues and alerts. | X | X | X | X |
| X |
| super_privileges | Super user privileges. Enables access to all system settings and the ability to manage dashboards, alert and Situation filters, templates, users, and roles. | X |
|
|
|
| X |
| thread_create | Deprecated permission. | X | X | X | X | X | X |
Automate Situation Workflow
Action States
Action States are the different states which Alerts are placed into as they pass from the Alert Builder into the Alert Rules Engine. See Alert Rules Engine for a standard link-up link down example use of action states.
The different states define how long the Alerts are retained in a certain state and whether they are forwarded to any Moolets or Sigalisers.
The default or base state is called 'Ground' and is required for the system to function correctly. This is the state that Alerts are passed into when they enter the Alert Rules Engine.
Create an Action State
Click + to create a new Action State. The available fields are as follows:
| Field | Input | Description |
| Name | String (Mandatory) | The name of the new Action State (up to a maximum of 64 characters). |
| Description | String | The description of the new Action State. |
| Remember Alerts For | Integer | The time in seconds that the system remembers the alerts in this state for. Any number less than 0 (<0) means do not remember it, so the state never retains a memory of the alert. 'Ground' has -1 because you do not want to accumulate a memory of every alert in the system. By default, you want the alert to pass through onto the Sigaliser. The purpose of the state engine is to spot specific alerts and do different things with them. |
| Cascade on Expiry | Boolean | This tells the system what to do if you have set a time to remember alerts for. Example: The Alert goes into the state and then after the set time of 30 seconds, it is taken out of the state whether you dispose of it manually or return it back to its original state. |
| Forward Alerts | Boolean | If enabled the Alerts that enter this state are forwarded to the chain Moolet. |
| Close Filter | Filter | The close filter defines which Alerts are closed when they enter the state. |
| Entry Action | String | The entry function is the MooBot function that is called when an Alert enters the state. |
| Exit Action | String | The exit function is the MooBot function that is called when an Alert exits the state. |
Click Save Changes to continue. Alternatively, click Revert Changes to undo any changes.
The new Action State appears on the list to the left.
Delete an Action State
Select the Action State you want to delete from the list on the left.
Note: It is not possible to delete the default 'Ground' state as this is required for the system to function correctly.
Click - to delete the Action State. The pop-up confirmation window appears.
Click Yes to confirm the deletion.
Auto Close
The Cisco Crosswork Situation Manager Auto Close feature lets you define criteria for automatically closing alerts and Situations.
Auto Close enables you to use filtering rules to organize your data and keep it current so you can focus on the most important active alerts and Situations. You also see performance improvements because automatically closing old alerts and Situations reduces the amount of data involved in Cisco Crosswork Situation Manager statistic calculations.
Auto Close lets you define the conditions using filters and determine how often Cisco Crosswork Situation Manager checks which alerts and Situations to close. Any alerts and Situations older than a certain time and that meet the defined criteria are closed.
Configure Auto Close for Situations
The Housekeeper Moolet must be configured and running within moogfarmd in order for Auto Close to work. To configure which Situations should never be auto closed, create an exclusion filter as follows:
1. Click Edit Filter to open the filter editor.
2. Clear the filter using Empty Filter and Add Clause. Alternatively, you can manually type in your filter rules.
3. Apply the changes to continue and click Done.
After you add the filter, define the behavior for automatically closing Situations as follows:
■ Close the Situation and all of the alerts it contains.
■ Close the Situation and all unique alerts it contains. Unique alerts are any alerts that are not part of any other Situations.
■ Close the Situation only.
You can create tasks to configure:
■ The age when Situations are suitable for Auto Close.
■ The number of Situations to close in each Auto Close run.
■ Situations only close if all associated alerts are closed.
Edit the default task or click Add Task. The available settings are as follows:
| Setting | UI Text | Input | Options | Description |
| Situation Age | When they are older than | Integer | Minutes Hours Days | Defines the age of the Situation before it can be closed. Must be a number greater than 1. |
| All Alerts Closed | And when all alerts in the Situation are closed | Boolean | - | If enabled, only Situations with no open alerts qualify for automatic closure. |
| Match filter | And all Situations match the following filter | Filter | - | Defines the criteria a Situation must meet to qualify for automatic closure. |
| Batch size | Every time this task runs, close a maximum of | Integer | - | Defines the maximum number of Situations to auto close in each Auto Close run. 1000 by default. Must be a number greater than 1. |
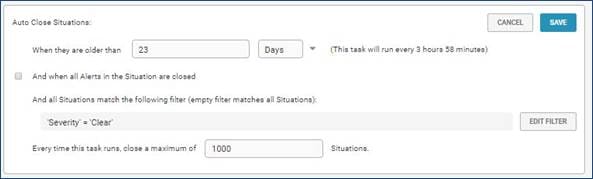
Once saved, the Auto Close task runs after a set period of time. This time period is between five minutes and four hours depending on the age of the Situation. The older the Situation age, the closer the frequency of the task gets to four hours (see the example below).
There is no limit on the number of tasks, so you can add any as many as you need meet your requirements.
The example below demonstrates how you can configure an Auto Close task to close a maximum of 1000 Situations per run that meet the following criteria:
■ Older than 23 hours
■ All associated alerts are closed
■ Have a clear severity
Configure Auto Close for Alerts
To configure which Alerts should never be auto closed, select the Alerts tab and create an exclusion filter as follows:
■ Click Edit Filter to open the filter editor.
■ Clear the filter using Empty Filter and Add Clause. Alternatively, you can manually type in your filter rules.
■ Apply the changes to continue and click Done.
You can create tasks to configure:
■ The age when Alerts are suitable for Auto Close.
■ The number of Alerts to close in each Auto Close run.
Edit the default task or click Add Task. The available settings are as follows:
| Setting | UI Text | Input | Options | Description |
| Alert age | When they are older than | Integer | Minutes Hours Days | Defines how old the alert must be to be auto closed. Must be a number greater than one. |
| Match filter | And all alerts match the following filter | Filter | - | Defines which alerts to include in the batch being auto closed. |
| Batch size | Every time this task runs, close a maximum of | Integer | - | Defines the maximum number of alerts to auto close in each Auto Close run. Must be a number greater than one. This is 1000 by default. |
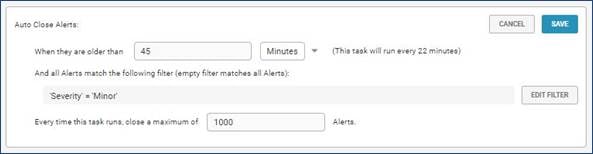
Once saved, the Auto Close task runs after a set period of time. This time period is between five minutes and four hours depending on the age of the alert. The older the alert age, the closer the frequency of the task gets to four hours.
There is no limit on the number of tasks, so you can add any as many as you need meet your requirements.
The task example below demonstrates how you can configure a task to Auto Close a maximum of 1000 alerts per run that meet the following criteria:
■ Older than 45 minutes
■ Have a clear severity or a minor severity
Transitions
Transitions are user-configurable set of conditions that move an alert from one state to another within the Alert Rules Engine (ARE).
To create and configure different transitions, go to System Settings.
Create a New Transition
Click + to create a new transition and edit the fields to meet your requirements:
| Field | Input | Description |
| Name | String | Name of the transition. This can be up to 64 characters. Mandatory. |
| Description | String | Description of the transition. |
| Priority | Integer | Determines the priority of the transition if there are multiple transitions. The higher the value, the higher the priority. |
| Active | Boolean | Sets the transition to active. |
| First Match Only | Boolean | Transition only occurs once if an alert meets the trigger conditions. |
| Trigger Filter | Filter | Filter that triggers the transition if an alert meets the defined trigger filter parameters. Mandatory. |
| Inclusion Filter | Filter | Filter that passes additional alerts to the end state if they arrive after the initial trigger and meet the defined inclusion filter parameters. |
| Start State | - | Determines the action state of the alerts in the inclusion filter. The start state and end state must be different. Mandatory. |
| End State | - | Determines the action state of the alerts if they match the inclusion or trigger filters. The start state and end state must be different. Mandatory. |
When you have configured the transition, click Save to continue.
Delete a Transition
To delete a transition from the list of available transitions:
1. Select the transition to delete.
2. Click the - to delete the transition.
3. Confirm the deletion to continue.
Troubleshooting and Diagnostic Tools
Implement Generic Server Tools
Generic Server Tools in Cisco Crosswork Situation Manager are tools that allow a user to execute a utility on a remote host.
These tools specify a command that is run using the Tool Runner servlet (which is configured to connect to the remote host). The command can be anything you can run on the host in a Linux terminal command line, such as an inbuilt part of the OS (ping, cat etc) or your own script.
In Cisco Crosswork Situation Manager, the Generic Server Tools managed here are only available from Situation Room ChatOps feature. See “Take Additional Actions” in the Operator Guide.
The steps below describe how to create a Generic Server Tool and its command. Any arguments required are defined by the user when the tool is run.
Manage Generic Server Tools
Go to System Settings > Tools and then Generic Server Tools to open the configuration window:
1. Click the + to create a new tool
2. Fill in the available fields to define the tool. These are listed in the table below:
| Field | Input | Description |
| Name | String (Mandatory) | The name for the Generic Server Tool (up to 100 characters). This appears in ChatOps when accessing the tool. |
| Description | String (Optional) | The text description of the tool. |
| Command | String | The file path of the command. Note: This command must be an accessible path on the host system. The host system and access information is defined in the Tool Runner servlet. |
| Run For | Boolean + String | Select a duration in the spin box (minimum of 5 seconds). This sets how long to allow the tool to run for before it is stopped. If no time is set, the tool runs until it completes (or indefinitely). |
3. Click Save Changes to create the tool, which appears in the list on the left.
4. Alternatively, click Revert Changes to discard your changes and confirm when prompted.
Edit a Generic Server Tool
1. To edit a Generic Server Tool, click the required tool you want from the list on the left. Alternatively, type in the search box in the top-left corner to search for the tool you want to edit.
2. Edit fields as described above.
Note: You cannot edit the tool name. If you need to do this, create a duplicate with the name you want. You can then delete the original.
3. Click Save Changes.
4. If you want to discard your changes, click Revert Changes.
Examples
The picture above shows a Generic Server Tool with the command:
This tool runs the script myTests.sh which is located on the remote host at the path /home/moog/bin/, using remote host access information defined in the Tool Runner servlet.
Implement Situation Server Tools
Situation Server Tools in Cisco Crosswork Situation Manager are tools that enable a user to execute a utility on a remote host.
These tools specify a command and arguments that are run using the Tool Runner servlet (which is configured to connect to the remote host).
■ The command can be anything you can run on the host in a Linux terminal command line, such as an inbuilt part of the OS (e.g ping) or your own script.
■ The arguments are extracted from Situation attributes by prefixing the attribute name with '$', such as $description for the Situation description.
Note: In Cisco Crosswork Situation Manager, the Situation Server Tools managed here are only available from ChatOps in the Situation Room. See “Take Additional Actions” in the Operator Guide.
The steps below describe how to create a Situation Server Tool, its availability filter, command and arguments.
You can also create Situation Server Tools via a command prompt.
Manage Situation Server Tools
Go to System Settings > Tools > Situation Server Tools to open the configuration window:
1. Click the + to create a new tool
2. Fill in the available fields to define the tool. These are listed in the table below:
| Field | Input | Description |
| Name | String (Mandatory) | The name for the Situation Server Tool (up to 100 characters). This appears in ChatOps when accessing the tool. |
| Description | String (Optional) | The text description of the tool. |
| Context Filter | Filter (Optional) | Click the pencil icon to create a filter for specific criteria which Situations must match for this tool to be available. |
| Command | String (Mandatory) | This is the file path of the command. Note: This command must be an accessible path on the host system. The host system and access information is defined in the Tool Runner servlet. |
| Arguments | String | This is the specific input for the command, which can use Situation attributes. To use Situation attributes, type '$' as a prefix and enter the attribute you want from the drop-down list. |
| Run For | Boolean + Integer | If enabled, you can define the number of seconds the tool runs for. The minimum value for this field is 5 seconds. |
Note: To prevent substitution with potentially malicious commands, arguments are escaped using a backslash. For example:
Command: echo
Argument: $args (where $args is echo_something; rm file.txt)
This results in the following command being executed:
The semicolon is escaped to prevent the rm command from being run.
3. Click Save Changes to create the new tool, which appears in the list to the left of the screen.
4. To discard any changes, click Revert Changes and confirm when prompted.
Note: You can also create Situation Server Tools via a command prompt.
Example
The screenshot below shows a Situation Server Tool called 'LogSitnDetails' with the Command: /home/moog/bin/logger.sh
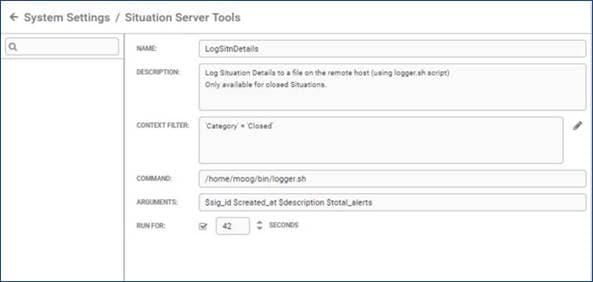
This tool runs the script logger.sh on the remote host which logs Situation details to a file.
The details logged are the Situation ID, created time, description and total number of Alerts, which are defined with the Arguments:
Each Situation attribute name is prefixed with $. The Context Filter makes this tool available only for Closed Situations.
Create a Tool with a Command Prompt
You can create Situation Server Tools via a command prompt.
This is useful for efficient creation of multiple tools using a scripted process, for example.
1. Open a new Terminal window on the Cisco Crosswork Situation Manager system and type the following:
2. Type any flags and arguments for the tool settings. See the examples below.
Cisco Crosswork Situation Manager command line tools are located here:
/usr/share/moogsoft/bin/utils
To display the help information for this tool, type moog_add_sitn_server_tool and press Enter.
Use a double-dash prefix "--" to define all following text as arguments. This ensures arguments are not misinterpreted as flags.
For example, "-- -c" to define the argument "-c", which would otherwise be interpreted as the command flag.
3. When you have defined the tool, press Enter.
If successful, “Tool was added” appears.
If there is a mistype, the help information appears.
If the tool name already exists, the following error appears: “Error: A tool named: [toolname] already exists.”
If a Run for time of less than 5 seconds is typed, the following error appears: “Error: The run_for value is too small. Please provide a value no smaller than 5 seconds.”
Once the UI is refreshed, newly created tools appear in the Situation Server Tools configuration window.
Examples
■ Name: Sitn ID (--name "Sitn ID"). Quotes are required because there is a space in the name
■ Description: Get the Situation ID (--desc "Get the Situation ID")
■ Context Filter: none
■ Command: echo (--cmd echo)
■ Arguments: display 'Situation ID = ID'
■ (--args "Situation ID = \$sig_id"). The backslash is required to escape the '$' because it is an environment variable
■ Run for: 42 seconds (--run_for 42)
This creates a tool with the following settings:
■ Description: five pings (-d "five pings")
■ Context Filter: ID < 10 (-m "sig_id<10")
■ Command: ping (-c ping)
■ Arguments: ping five times (-- -c 5). The argument starts with -c which is itself a tool flag. Therefore the "--" double-dash prefix is used to interpret -c 5 as an argument, and not a flag
■ Run for: no time set (no -r flag and argument)
■ Name: ping. The name is not defined here (no -n flag and argument) so the Command is used as the name by default
Available Situation Attributes
These are the Situation attributes available:
Implement Alert Server Tools
Alert Server Tools are tools that allow a user to execute a utility. The tools available are relevant to the Alert selected. Each tool executes on a remote host, which is defined when it is running.
The arguments passed to the utilities are extracted from the Alert attributes. For example, testing the reachability (ping) of hardware using the source attribute of the Alert.
The configuration steps described below define the Alert Server Tool (its command and argument).
Manage Alert Server Tools
Go to System Settings > Tools > Alert Server Tools to open the configuration window.
To create a new Alert Server Tool;
1. Click the + icon. This opens a clear configuration window.
2. Fill the available fields to define the tool. These are listed in the table:
| Field | Input | Description |
| Name | String (Mandatory) | The name for the Alert Server Tool (up to 100 characters). |
| Description | String | The text description of the Alert Server Tool. |
| Alert Type filter | String | The Alert Types for which the Alert Server Tool is available. Note: Enter .* to make it available for all alert types. |
| Filter using Regex | Boolean | If enabled, the Alert Type filter uses regular expression. |
| Command | String (Mandatory) | The command to carry out using alert information. Note: This command must be an accessible path on the host system. This is defined when you run the tool. |
| Arguments | String | This is the specific input for the command. |
| Run for | Boolean + Integer | If enabled, you can define the number of seconds the tool runs for. The minimum value for this field is 5 seconds. |
Example
The screenshot below shows an Alert Server Tool that tests the reachability of the source the Alert and returns the results.
The Command ping is used with Arguments $source and -c5 which specify the source (from the Alert attribute) and the number of times to ping (five).
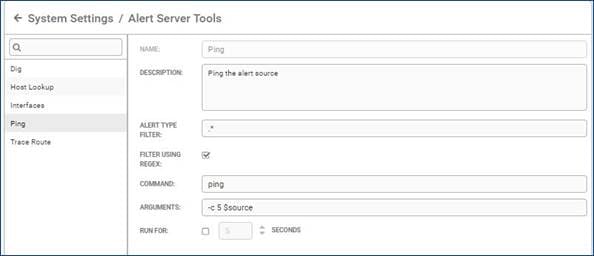
The Alert Type Filter uses a regular expression '.*' to make the tool available for all Alerts.
Configure Hotkey Shortcuts
Hotkeys are keyboard shortcuts you can use on the Alert View, Situation View, and Situation Room screens in Cisco Crosswork Situation Manager. The default hotkey shortcuts are as follows:
| Key | Action |
| A | Assign |
| D | Show Details |
| I | Invite User |
| M | Own |
| T | Open Server Tools |
You can add more custom hotkeys for additional actions to make navigation easier for you and your team.
Add a Hotkey
Click + Create Hotkey in the top-left corner of the window to add a new hotkey shortcut.
Under 'Key' select a number between 0-9 or a letter between A-Z then select an action for it to represent.
The new hotkey is highlighted with orange markers. Click Save Changes to continue.
Delete a Hotkey
Select any unwanted hotkey from the list, default hotkeys included, and click - Remove Hotkey.
The selected hotkey disappears from the list. Click Save Changes to continue or click Revert Changes to undo the action.
Configure ChatOps Shortcuts
The ChatOps feature enables Cisco Crosswork Situation Manager users to run tools from the Collaborate tab in the Situation Room. For more information, see “Take Additional Actions” in the Operator Guide.
The ChatOps shortcuts can be set up to give your Cisco Crosswork Situation Manager users quick access to the available tools. To do this, go to System Settings > ChatOps Shortcuts.
Any existing shortcuts are listed under the Tools panel to the right of the window.
Create a ChatOps Shortcut
Click the + Create Shortcut button to get started
Next, enter a name for your new ChatOps shortcut in the Shortcut text box. This is what users type to run the ChatOps tool.
Note: You can use 0-9, lowercase a-z, dash (-), underscore (_) and period(.) If the name already exists, the name highlights in red in the list on the left and you cannot save until the name is edited to be unique.
Select the check box for the tool you want (to search for a tool, type text to the right of the search icon.
Note: Default Alert and Situation workflow tools (such as ping, nslookup) are available.
Repeat the steps above to create as many shortcuts as required.
Click Save Changes when you are finished.
Remove a ChatOps shortcut
Select the ChatOps shortcut you want to delete from the list on the left.
Click the - Remove Shortcut button to remove the shortcut from the list.
If you accidentally remove the wrong shortcut, you can click Revert Changes to undo this. However, remember that this action discards all changes since the last save.
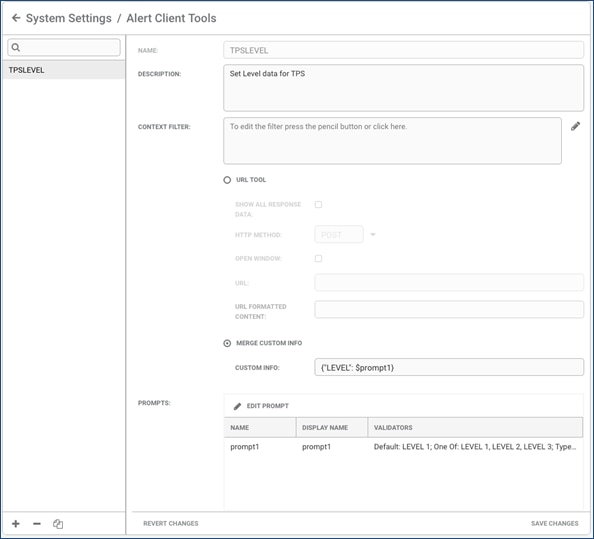
Implement Client Tools
You can create Client Tools in Cisco Crosswork Situation Manager to use Situation and Alert data to execute actions through a specified URL.
Client Tools can be set to return response data; providing a more detailed response in the UI that includes response status and data, which can yield useful and important information. Another example is for the tools to link to an external trouble ticket system (via its URL) which then opens a new ticket using data from the selected Situation.
There are two different types of Client Tools which can be run: Alert Client Tools and Situation Client Tools.
Configure Client Tools
Go to System Settings > Tools and then either Alert Clients Tools or Situation Client Tools to open the configuration window (this is the same for both Alert and Situation Client Tools).
1. Click the + icon to create a new Client Tool.
2. Fill the available fields to define the tool. These are listed in the table below:
| Field | Input | Description |
| Name | String (Mandatory) | The name for the Client Tool (up to 100 characters). |
| Description | String | The text description of the tool. |
| Context | Filter (Optional) | Click the pencil icon to create a filter for specific criteria which the Alerts or Situations must match for this tool to be available. |
3. Next select one of the radio button options to choose one of the following options:
■ URL Tool - If you want to create a tool that uses a URL.
■ Merge Custom Info - If you want to create a tool that uses custom_info fields.
URL Tool
The different fields used to configure a URL Tool are described below:
| Field | Input | Description |
| Show All Response Data | Boolean | If enabled, the tool returns more a more detailed response in the UI, including the response status and data. |
| HTTP Method | GETPOST | Select GET if the tool needs to retrieve information or select POST if the tool needs to send information. Note: Choose the method appropriate for the URL service you are interacting with. |
| Open Window | Boolean | If enabled, this opens a new browser window when using the GET HTTP Method. Note: This disables the Show All Response Data. |
| URL | String | This is the URL of the Client Tool. |
| URL Encoded Content | String | This is the payload data that is to be posted when the tool is run when using the POST HTTP Method. Note: The payload data must be URL encoded and can include Situation and alert attributes and prompt variables. |
Merge Custom Info
Select Merge Custom Info and in the Custom Info box, enter valid JSON for the custom_info you want the tool to add.
The example JSON blob below adds a set of custom_info called "TPS data" that contains a string "From MOOG", the Situation ID and the timestamp for when the Situation was created:
The JSON in the box can include Situation and Alert attributes and prompt variables.
When creating a client tool, entries in the URL, URL Encoded Content, or Custom Info boxes can contain Situation or Alert attributes (for example, $description for the contents of the Situation or Alert description field) and prompt variables.
Prompt Variables
Prompt variables open a message box when the tool is run, prompting the user to type text, a number, or select from a list.
In the URL, URL Encoded Content, or Custom Info boxes, enter prompt variables in the following format:
The prompt name cannot be any of the existing Situation or Alert attribute names.
To add a new prompt:
1. When entering text in the URL, URL Encoded Content, or Custom Info box, type a prompt variable as described above. The prompt name appears in the Prompts table.
2. To edit the prompt, double-click it or select it and then click Edit Prompt.
3. Type a Display Name into the box. This name appears in the prompt message.
Next, choose from one of the three prompt options: Text, Number, and List.
■ Text - this prompts for string text. The optional text settings are described below:
| Setting | Input | Description |
| Default Value | String | This is the default prompt text. |
| Minimum Length | String | This is the minimum length of text which users can enter into the prompt. |
| Maximum Length | String | This is the maximum length of text which users can enter into the prompt. |
■ Number - this prompts users for a number. The optional number settings are described below:
| Setting | Input | Description |
| Default Value | String | This is the default number value. |
| Minimum Length | String | This is the minimum number which users can enter into the prompt. |
| Maximum Length | String | This is the maximum number which users can enter into the prompt. |
Note: Numbers can be integers or floating point, in which case they are truncated to two decimal places.
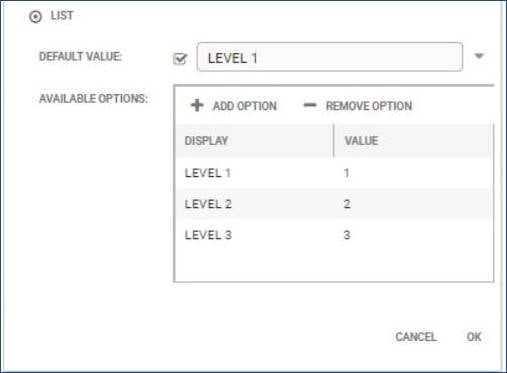
■ List - this prompts users to select from a list. The list settings are:
| Setting | Input | Description |
| Available Options | String | These are the other available options. |
| Default Value | String | The default list value. |
Click Add Option to add new options to the Available Options list. In the 'Display' column type what you want to appear for selection. In the 'Value' column, type what data you want to be added to the custom_info when the option is selected from the list. Click Update to add the option to the list.
Finally, click OK when you have finished. The new prompt is added to the Prompts table.
When you have finished, click Save Changes. The new tool appears in the list on the left.
Edit a Client Tool
1. Select the client tool you want to edit. Alternatively, type into the search bar to find the tool.
2. Edit fields as described above.
Note: You cannot edit the tool Name. If you need to do this, create a duplicate with the name you want. You can then delete the original.
3. Click Save Changes.
4. If you want to discard your changes, click Revert Changes.
Run Client Tools
The Client Tools can be accessed from the following areas:
■ Alert Client Tools: on the Alert Tools Menu, see Alerts Overview (right-click menu). Or via "Situation Alerts" in a Situation Room.
■ Situation Client Tools: The Situation Tools Menu, from Tools menu on the Situation Room or via ChatOps in Collaborate.
If you want to run Client Tools using Safari, go to Safari > Preferences > Security and uncheck 'Block pop-up windows' as this is checked by default.
Examples
Client tools can also be configured to alter custom_info fields. For example, running a tool to raise a ticket on a third party system can be configured to prompt for entries of pre-defined (custom_info) values to provide more information in the ticket raised in the third party system.
Client Custom_info Tool with a Prompt Variable
To create a Client custom_info tool with a prompt variable, select the Merge Custom Info option:
In this example, the custom_info entered is:
The screenshot below shows how the prompt variable settings can be configured:
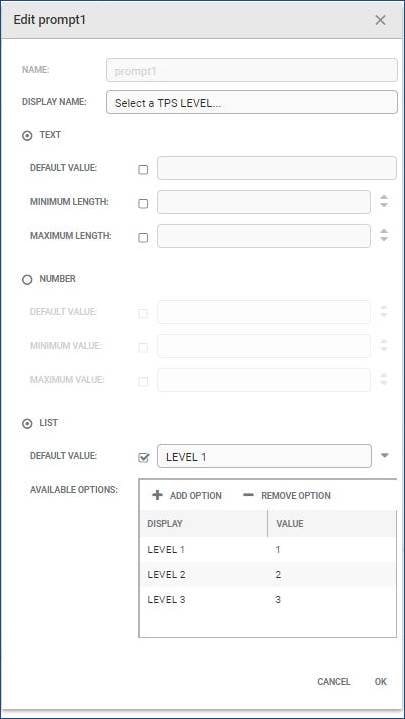
To run the tool, go to an Alert, right-click or click Tools > Tools > Set LEVEL data for TPS.
The following prompt appears.
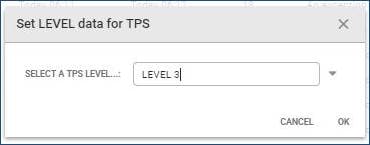
Click OK to continue.
Additional System Configuration
Configure Alert and Situation Columns
You can change the columns to display on Situation and Alert Views and add new columns based on custom_info fields.
Optionally add link definitions to custom_info columns, for example, to link the custom_info data to a third-party system.
Navigation
Click the Columns drop-down menu in the top-right corner to display which columns are displayed by default.
Check or uncheck columns to add or remove them from the default column layout.
| Icon | Description |
|
| Click the border of any column and drag left or right to make the column narrower or wider. Double-click to auto-resize the column to the current content. |
|
| Click and drag any column to another position to change the order the columns appear in. |
Click any column and edit the text next to 'Header' to change the column header.
Create a New Column
Click Columns > Add Column to add a new custom column to the default layout.
Edit the available fields to configure the column:
| Field | Input | Description |
| Field | String | This is where you can type the custom_info field you want to use or show in the column. Note: This entry must start with custom_info. (added when creating a new column). For example, to use a Custom_info field 'TPS_ID' enter: custom_info.TPS_ID |
| Header | String | This is the header name of the column. |
| Type | Number OR Text | Select 'Number' if the column content is numeric or 'Text' if the column context is text string. |
| Link Definition | Selection | Select the Link Definition from the list (if required). |
| Indexed | Boolean | If enabled, the column data are indexed in the database. When new columns are added they are filterable and sortable by default. This improves performance of filtering and sorting, but may affect the performance of additions. If you are planning to use this custom_info field in Alert or Situation filters or you are planning to sort using this column, we recommend you enable the indexed option to aid filter loading performance. Too many indexed columns may impact performance. |
Adjust the column width as required and change the order by dragging and dropping the new column where you would like it to be.
Click Save Changes to continue and confirm when prompted.
Alternatively, click Revert Changes to discard your changes.
Example
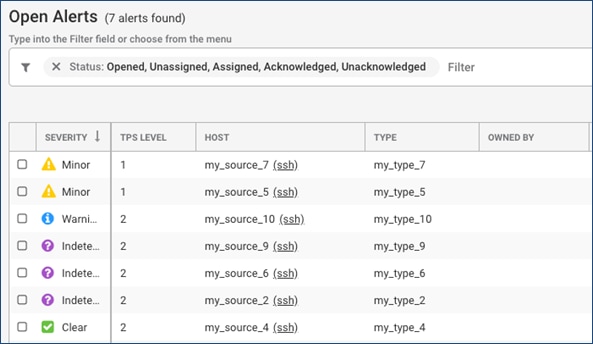
This example walks you through setting up an Alert Column with Custom_info Data from Prompt. The custom_info field 'TPSLEVEL' is added to Alerts using a client tool with a prompt variable: 'Set TPS Level'.
1. Right-click and select Tools > Set TPS Level tool or Tools > Tools > Set TPS Level to run the tool on an Alert.
2. Select the TPS level on the prompt window.
3. Right-click the Alert, select Show Details... and Custom Info...
4. Navigate to System Settings > Columns > Alert Columns to create the custom_info column.
5. Click Columns > Add Column and then configure the column.
6. Click Save Changes to continue.
The Alert Views displays display the TPS Level column display custom_info data in the second column:
Create Shared Alert and Situation Filters
You can use filters configure which alerts and Situations you want to access and display from your Cisco Crosswork Situation Manager Workbench. Administrators can create, edit and delete global filters for all users, and team filters for selected teams. If you share a filter with a specific team, only the users in the team can access the filter in the filter list.
Individual users can create personal filters for alerts or Situations. Only the creator can see personal filters.
Navigate to System Settings > Filters and either Alert Filters or Situation Filters to open the configuration window.
Create a Filter
1. Click the + icon to create a new filter.
2. Fill the available fields to configure the filter. These are listed in the table below:
| Field | Input | Description |
| Name | String (Mandatory) | The name of the new filter (up to a maximum of 100 characters). |
| Description | String | The text description of the filter. |
| Show in | Navigation Dashboards | Select whether to show the filter in Navigation and/or Dashboards. |
3. Click Add Clause to start building the filter.
4. Click the drop-down menu arrow and select a parameter.
5. Click the drop-down menu below this and select an operator.
6. Depending on the parameter selected, enter or select a value in the final box and then click Apply.
7. To add more clauses, click the clause and then click AND, OR, or NOT and fill in the boxes as before.
8. Click Save Changes to create the filter.
Configure Labs Features
Cisco Crosswork Situation Manager labs offers a preview of unreleased features. Navigate to Settings > Labs > Configure to view available labs features for the current release.
Team Insights
You can enable the Team Insights feature if you want to see statistics and metrics related to your team's Situations in the Team Room.
When enabled, Team Insights displays graphs showing Situations in the last week and Situation Severity data for the last week.
Customize User Experience and Workflow
Customization is where you can configure the functionality and default tabs of Cisco Crosswork Situation Manager for Situation Rooms, Workflow, System Settings and Interface Settings.
Situation Room
The Situation Room tab is where you can select the default tab that displays when any user opens the Situation Room.
By default the tab is Next Steps. You can choose between Next Steps, Alerts and Collaborate.
Click Save Changes to continue.
Workflow
The Workflow tab is allows you to alter the standard workflow of all Situations.
Propagate Situation Actions to Alerts
When enabled, this mirrors any actions to the Situation down to its Alerts. Click Enable to continue and then define the scope:
| Setting | Description |
| Any unassigned alerts | Action applies to any currently unassigned Alerts in the Situation. |
| Any unassigned Alerts and any assigned but not acknowledged Alerts | Action applies to any unassigned Alerts and any assigned but not acknowledged Alerts. |
| All Alerts | Action applies to all of the Alerts in the Situation. |
Close Situations
These settings determine the behavior when closing Situations:
| Setting | Description |
| Close Situation and Open Alerts | Closes the Situation and all open Alerts within it. |
| Close Situation and Unique Open Alerts | Closes the Situation and all unique open Alerts. |
| Close Situation Only (Not recommended for normal operation) | Closes the Situation but not its Alerts. |
Click Save Changes to continue.
System Settings
The System Settings tab if where you can set when Cisco Crosswork Situation Manager times out, either with the system default or a custom timeout:
| Setting | Description |
| Use System defined timeout | The system default timeout of one hour (60 minutes). |
| Custom timeout | A custom-defined timeout (any time between 60 and 480 minutes). |
Click Save Changes to continue.
Interface Settings
The Interface Settings section is where you configure the default time format, landing page and theme for the Cisco Crosswork Situation Manager interface.
| Setting | Input | Description |
| Default time format | US (hh:mm:ss MM/DD/YYYY) International (hh:mm:ss DD/MM/YYYY)* Sortable (YYYY-MM-DD hh:mm:ss) | The default time format that applies throughout Cisco Crosswork Situation Manager. |
| Landing page | Summary* Management Dashboard Cisco Crosswork Situation Manager Dashboard My Situations Open Situations Open Situations with Impacted Services | The default landing page that opens when you launch Cisco Crosswork Situation Manager or click the Cisco Crosswork Situation Manager logo in the top-left corner. |
| Default theme | Dark* Light | The color scheme of Cisco Crosswork Situation Manager (dark or light). |
| Allow users to select theme | Boolean | If enabled, users can select their own color scheme. |
| Select Custom Logo | - | Upload an image such as a logo to display on the login page and on the top bar of the workbench. |
Note: These are the default settings for Cisco Crosswork Situation Manager.
Click Save Changes to continue.
Upload a Logo
You can upload a custom image such as a company or brand logo to appear on the login page and on the top bar of the workbench.
Click Upload and select the desired image file from your computer. Click Save Changes for the changes to be applied.
Note: Currently only PNG, JPG, and GIF files up to 5 MB in size are supported.
Clicking the image takes you to the default or configured landing page.
Create Link Definitions
Link Definitions is where you can make links available directly in Situation and Alert Views using Situation and Alert data and custom_info.
This is useful for linking directly to a corresponding ticket on a third-party system.
Create a new Link Definition
To create a new Link Definition, click the + icon in the bottom-left corner.
Fill in the three available fields to define the Link Definition:
| Field | Input | Description |
| Name | String (Mandatory) | This is the text name that appears in Situation/Alert column configuration. |
| Link | String (Mandatory) | This is the destination of the link, including any query terms. There is no limit to the number of characters. |
| Display | String (Optional) | This is the text that appears in Situation and Alert Views when the link definition is used. |
Note: The Link value can contain a $ reference to Alert or Situation fields. Display fields only allows $value substitution.
Example
The screenshot below illustrates a link definition to carry out a Google search on the $value query term. When used in a Situation or Alert column, it displays a link "Google <$value>".
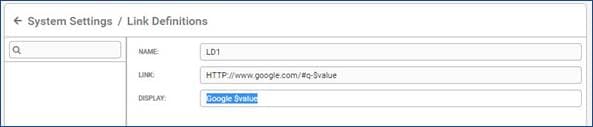
Configure and Retrain Probable Root Cause
Probable root cause (PRC) for Cisco Crosswork Situation Manager is enabled by default. This means that you can mark Situation Alerts as having a root cause or not and Cisco Crosswork Situation Manager shows a root cause estimate in Next Steps in the Situation Room.
Navigate to System Settings > Configure & Retrain to enable or disable PRC.
To configure which users can mark Alerts for PRC, go to Security > Roles. Select the role you want to edit and under Permissions, move 'prc_feedback' to 'Selected' using the direction arrows.
This permission is enabled for Administrator and Super User roles by default.
Root Cause
The PRC Model gives each Alert within a Situation a root cause estimate. Retrain recalculates the estimates with the current data.
You can choose which features your model uses when predicting the root cause of an Alert. The default PRC configuration uses two types of Severity. The other features are listed below:
| Feature | Description |
| Agent | The agent of the Alert represented as an enumeration. Each value of 'agent' is considered to be independent from all other values. |
| Alert Arrival Order | Represents the arrival order of the Alert in a Situation. |
| Alert Time | Represents the Alert time as the components of the 'time of day' e.g. hours of day, minutes of hour. |
| Class | The class of the Alert, represented in a way that identifies naming conventions in the class name. |
| Description | Tokenizes the description into words and uses those words to identify key words and phrases that may indicate root cause. |
| Host | The host of the Alert, represented in a way that identifies naming conventions in the class name. |
| Manager | The manager of the Alert represented as an enumeration. Each value of 'manager' is considered to be independent from all other values. |
| Severity & Arrival Order (default) | The severity of the Alert represented as independent values and when the alert arrived for each value of severity. For best results use in conjunction with 'Severity Raw'. |
| Severity Enum | The severity of the alert represented as independent values. For best results use in conjunction with 'Severity Raw'. |
| Severity Raw (default) | The severity of the alert represented as a continuous value such that 'Warning' < 'Major' < 'Critical'. For best results use in conjunction with 'Severity Enum' or 'Severity & Arrival Order'. |
| Situation Alert Time | Represents the Alert time as the components of time e.g. hours of day, minutes of hour but relative the first event in the Situation. |
| Type | The type of the Alert, represented in a way that identifies naming conventions. |
Reset all Feedback
To clear all feedback from your Cisco Crosswork Situation Manager instance, click the Reset button.
Self Monitoring
Monitor Your Cisco Crosswork Situation Manager System
Administrators can use Self Monitoring to view the status, health and processing metrics of the Cisco Crosswork Situation Manager processes. The different tabs show the state of Processing Metrics, Event Processing, Web Services, Event Ingestion and Message Bus.
Heartbeats are one of the key concepts in Self Monitoring. A heartbeat is an internal message sent by a process every 10 seconds to inform Self Monitoring that it is still running.
All data displayed in this screen is live and updates continually.
Package States
The table below describes the possible states for a package:
| Icon | Description |
|
| The process is running (reserved or unreserved). |
|
| The reserved process has missed some heartbeats. This could indicate a potential problem and should be investigated. |
|
| The reserved process is either not running or has missed its last heartbeat. This could indicate the process has failed, has not started or that Cisco Crosswork Situation Manager is not working properly. |
|
| The unreserved process is not running. |
|
| The process is in passive mode. This is for High Availability deployments only. |


You can set processes reserved or unreserved in the system.conf file ($MOOGSOFT_HOME/config/system.conf). If a package's 'reserved' setting is 'true', the self monitoring reports a warning if the package is not running. Stopped unreserved processes do not generate warnings.
Controls
There are a number of controls which appear in Self Monitoring can be used to stop. start and restart moogfarmd and the LAM services. These are as follows:
| Button | Description |
|
| Restart |
|
| Stop Note: Stop works only if moogfarmd is started and running as a process rather than a service. |
|
| Start |


These can be configured by users with Super User permissions.
Self Monitoring Tabs
The Self Monitoring screen is divided into five tabs. Each section displays the states of the various processes, indicating which are running or which have issues:
Processing Metrics
This tab, which is open by default when Self Monitoring is launched, displays Event processing times and other metrics.
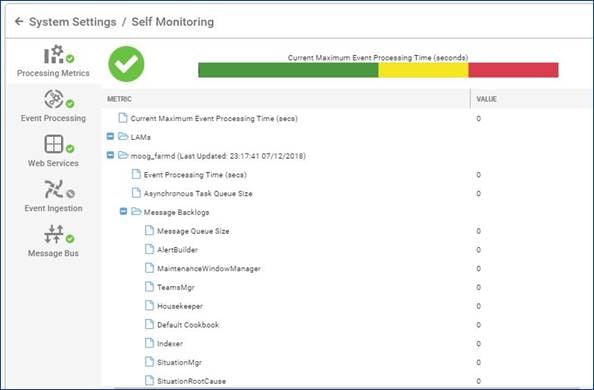
The icon in the top-left corner indicates the overall state of Event processing, this is determined by the Current Maximum Event Processing Time in seconds.
This time is indicated by the position of the gray bar on the colored bullet graph shown below. The Current Maximum Event Processing Time is 1.917s in this example:
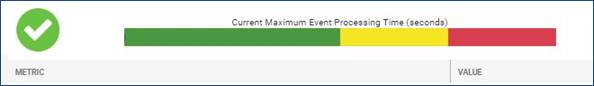
The default bullet chart color values are as follows:
■ GREEN (0 - 10 seconds): Good performance
■ YELLOW (10 - 15 seconds): Marginal performance
■ RED (15 - 20 seconds): Poor performance
The time values are configurable in the web.conf file.
Use Processing Metrics
To use the Processing Metrics tab, open the LAMs and moog_farmd folders and look for deviations from normal values.
The numeric value itself may not be an absolute measurement of health, so as a general rule, look for unusual or sudden changes in the values or behavior. See the examples below:
■ If a particular LAM becomes a data flow bottleneck, expect to see substantial increases in the values for the Message Queue Size and/or Socket Backlog metrics for that LAM. This leads to an increasing Event Processing Time for the appropriate moog_farmd (which is expecting data from the LAM).
■ If an AlertRulesEngine in a moog_farmd instance becomes a data flow bottleneck, expect to see a substantial increase in the Message Backlog and possibly the Messages Processed decreasing for that AlertRulesEngine. This also leads to an increasing Event Processing Time for the moog_farmd.
Both of these result in the bullet chart (at the top) showing increasing Current Maximum Event Processing Time, from green to yellow to red.
Event Processing
This tab contains a process group including moog_farmd (the core Cisco Crosswork Situation Manager application) and the Moolets (AlertBuilder, Alert Rules Engine, Sigalisers etc).
The icon in the top-left corner indicates the overall state (running normally in the example above).
The group and cluster names are displayed in the top-right corner. The time and date of the last heartbeat is displayed above the list of Moolet processes.
Web Services
This tab contains all processes related to Tomcat web applications: moogsvr, moogpoller, toolrunner and Graze.
Each row displays the following information:
| Column | Description |
| + | Click this button to expand or collapse the row for further information. E.g 'No reported problems'. |
| State | This shows an indicator icon showing whether the process is running as normal or not. |
| Process | The name of the Cisco Crosswork Situation Manager component. |
| *Instance | The name of the instance (in High Availability there are multiple instances of Cisco Crosswork Situation Manager). |
| *Group | The name of the Process Group the component belongs to. |
| *Cluster | The name of the Cluster the component's Process Group belongs to. |
| Last Heartbeat | The time of the last received heartbeat. A heartbeat indicates a health component. |
*These only apply to High Availability deployments where there are more than one instance of Cisco Crosswork Situation Manager and its component processes.
Event Ingestion
This tab displays information about the state of all processes relating to the LAMs and the individual processes which process raw data and create events.
The controls in the far-right column can be used to stop and restart active LAM processes or to start inactive LAMs.
Message Bus
The final tab provides a link to the Message Bus Console. This is hosted by message-queueing software RabbitMQ.
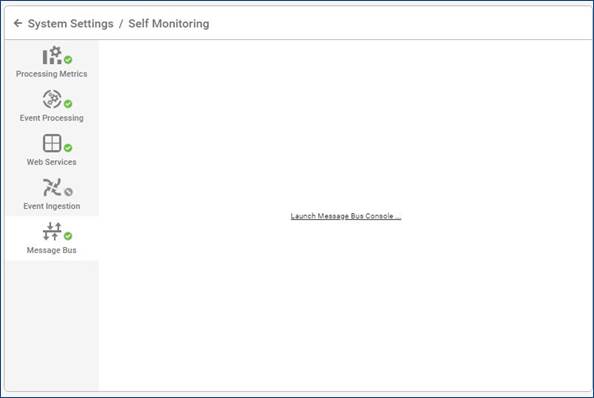
Click the link to proceed to the RabbitMQ management console.
Note: The username and password to login are specified and can be configured in $MOOGSOFT_HOME/config/system.conf (under mooms.username and mooms.password in the JSON) & correspondingly in RabbitMQ.
Once logged in, RabbitMQ displays information about message rates, connections, channels, queued messages, and so on.
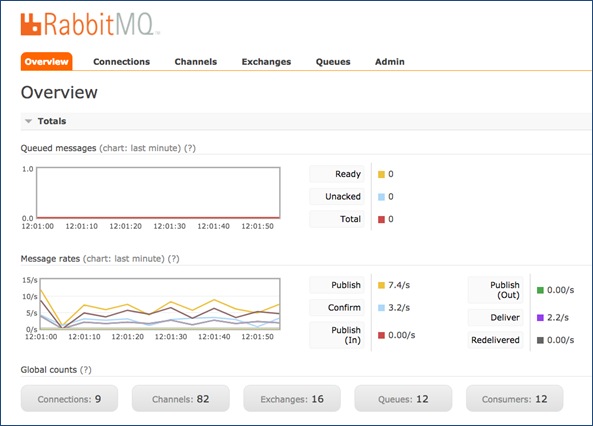
Configuration
The 'Restart/Stop/Start' feature uses the moogfarmd/LAM service scripts under /etc/init.d (eg: /etc/init.d/moogfarmd and /etc/init.d/logfilelamd) in combination with the apache-tomcat 'toolrunner'.
Note: You need Super User role permissions to configure this feature of Cisco Crosswork Situation Manager.
A user needs to be present on the system which is in the 'moogsoft' group and this is the user that must be used by the toolrunner and the services in order to start/stop services via the UI. e.g.:
■ /etc/init.d/moogfarmd - PROCESS_OWNER set to 'controluser'
■ $APPSERVER_HOME/webapps/toolrunner/WEB-INF/web.xml - toolrunneruser set to 'controluser' (toolrunnerpassword needs to be the password for that user)
We recommend that you do not use the default 'moogsoft' user because that is a system user and does not allow you to login using password.
Update the /etc/init.d/ service scripts to have the correct:
■ SERVICE_NAME (to make the services unique)
■ PROCESS_OWNER (must be the same user as the toolrunner user)
■ INSTANCE/CLUSTER/GROUP (unless already configured via relevant the LAM/farmd/system.conf config file). These need to be provided to the 'daemon' lines as command line parameters. e.g.: --instance MY_INSTANCE --group MY_GROUP--cluster MY_CLUSTER
Add the name of the service script into the 'service_name' field in $MOOGSOFT_HOME/config/system.conf for that Cisco Crosswork Situation Manager process. To ensure the service appears in the right Self Monitoring tab, the process_type field must be set. See the default system.conf file for examples.
Note: If a moogfarmd service or LAM service is run that does not match a configuration block in system.conf/'processes', it still appears within the UI 'Self Monitoring' dialog, but it isn’t possible to start/stop/restart the service.
The 'toolrunner' is used to control the services (requires configuring $APPSERVER_HOME/webapps/toolrunner/WEB-INF/web.xml):
■ The 'toolrunneruser' must match the PROCESS_OWNER specified within the relevant service script. This is because only root can run services as a different user.
■ The 'toolrunnerpassword' must be the password of the 'toolrunneruser'.
■ The 'toolrunnerhost' value must match the host of the machine which contains the moogfarmd/LAM services and the PROCESS_OWNER user.
It is more likely that an existing LAM/farmd service already ran in upgrade scenarios. If the service is one that needs to be controlled via the UI, the service log file and PID (if present) need to be 'chowned' to the new service script PROCESS_OWNER/toolrunner user before it will work. For example:
See the example of a $MOOGSOFT_HOME/config/system.conf file below:
Glossary
| Term | Description |
| Alert | An alert is a de-duplicated event or an instance of new data that has been detected by a monitor and passed into Cisco Crosswork Situation Manager. |
| ChatOps | The ChatOps feature enables users to run tools, such as executing utilities on remote hosts, from Collaborate tab using shortcuts. |
| Event | Any log file, status or change event generated by third-party monitoring tools. |
| Sigaliser | Sigalisers are the algorithms which cluster Alerts together based on factors such as time, language, topology, and similarity. |
| Situation | A Situation is a cluster of alerts that has been run through one or more of the Sigalisers. |
| Warning | The warning severity indicates that a number of potential or imminent service affecting faults have been detected. Warning is indicated by the color blue and the industry standard severity level number 2. |
Obtain Documentation and Submitting a Service Request
For information on obtaining documentation, using the Cisco Bug Search Tool (BST), submitting a service request, and gathering additional information, see What’s New in Cisco Product Documentation.
To receive new and revised Cisco technical content directly to your desktop, you can subscribe to the What’s New in Cisco Product Documentation RSS feed. The RSS feeds are a free service.
Cisco and the Cisco logo are trademarks or registered trademarks of Cisco and/or its affiliates in the U.S. and other countries. To view a list of Cisco trademarks, go to this URL: www.cisco.com/go/trademarks. Third-party trademarks mentioned are the property of their respective owners. The use of the word partner does not imply a partnership relationship between Cisco and any other company. (1110R)
© 2018 Cisco Systems, Inc. All rights reserved.
 Feedback
Contact Cisco
- Open a Support Case

- (Requires a Cisco Service Contract)