Cisco Crosswork Hierarchical Controller 7.1 Analytics Guide
Available Languages
Bias-Free Language
The documentation set for this product strives to use bias-free language. For the purposes of this documentation set, bias-free is defined as language that does not imply discrimination based on age, disability, gender, racial identity, ethnic identity, sexual orientation, socioeconomic status, and intersectionality. Exceptions may be present in the documentation due to language that is hardcoded in the user interfaces of the product software, language used based on RFP documentation, or language that is used by a referenced third-party product. Learn more about how Cisco is using Inclusive Language.
- US/Canada 800-553-2447
- Worldwide Support Phone Numbers
- All Tools
 Feedback
 Feedback
◦
This document is a how-to-use guide for the analytics applications of Cisco Crosswork Hierarchical Controller.
The following table lists the analytics applications. The Legend column indicates if the application falls into one of the following categories:
● Common: Common to all layers and multi-layer
● IP: Relevant to IP links and services
● Optical: Relevant to fibers, optical links, OTN/ETH connections
Table 1. Analytics Applications
| Category |
Application name |
Legend |
Description |
| Analytics |
Common |
Enables a user to plan a maintenance event, finding which connections will be impacted by taking resources down and if there is an alternative path. When found, comparing existing and alternative path latency, cost, hops. Supported for OTN, ETH, RSVP-TE tunnels. |
|
| Common |
Enables a user to select a group or specific tunnels or connections and run path calculation to optimize their path. Show results by comparing existing to optimized path based on latency, hops, cost. Applied to OTN/ETH connection, RSVP-TE and SR policies, VPNs. |
||
| Common |
Find if there are commonly shared resources (node, site, link, card) between selected group of links in any layer. Group can be selected explicitly or as SHQL rule. |
||
| IP |
Find if there will be network routing parts that will be isolated from rest of the network given current failures and simulated failures. |
Table 2. Terms
| Term |
Definition |
| Adapter |
The software used by Crosswork Hierarchical Controller to connect to a device or to the manager, to collect information required by the network model and configure the device. |
| Agg link |
Agg is Link Aggregation Group (LAG) where multiple ETH links are grouped to create higher bandwidth and resilient link. |
| BGP |
Border Gateway Protocol |
| Circuit E-Line |
An Ethernet connection between two ETH client ports on Transponder or Muxponder over OTN signal. |
| CNC |
Crosswork Network Controller. |
| Device |
Optical network element, router, or microwave device. |
| Device Manager |
The application that manages the deployed adapters. |
| eMBB |
Enhanced Mobile Broadband. |
| ETH chain |
A link whose path is a chain of Ethernet links cross-subnet-connected (found using Crosswork Hierarchical Controller cross-mapping algorithm). Eth-chain is a replacement for R_PHYSICAL link in cases where one side of the link is in devices out of the scope discovered by Crosswork Hierarchical Controller. |
| ETH link |
ETH L2 link, spans from one ETH UNI port of an optical device to another, and rides on top of ODU. |
| Fiber |
Chain of fiber segments that spans from one optical device to another. |
| Fiber segment |
Physical fiber line that spans from one passive fiber endpoint (manhole, splice etc.) to another and is used as a segment in a fiber link. |
| IGP |
IGP is the link between two routers that carries IGP protocol messages. The link represents an IGP adjacency. |
| IP-MPLS |
IP multi-protocol label switching. |
| L3 physical |
L3 physical is the physical link connecting two router ports. It may ride on top of an ETH link if the IP link is carried over the optical layer. |
| L3-VPN |
A virtual private network based on L3 routing for control and forwarding. |
| L3-VPN link |
The connection between two sites of a specific L3-VPN (can be a chain of LSP connections or IGP path). |
| LDP Endpoint |
The endpoint of the LDP path (router name). LDP is a signaled path for services between two routers in the MPLS network. The path is signaled by routers using the Label Distribution Protocol. |
| Logical link, IGP, LSP |
Logical link connects VLANs on two IP ports. |
| LSP |
Label Switched Path, used to carry MPLS traffic over a label-based path. LSP is the MPLS tunnel created between two routers over IGP links, with or without TE options. |
| NMC (OCH-NC, OTSiMC) |
NMC is the link between the xPonder facing ports on two ROADMs. This link is the underlay for OCH and it is an overlay on top of OMS links. This is relevant only for disaggregation cases where the ROADM and OT box are separated. |
| NMS |
Network Management System. |
| OC/OCG |
SONET/SDH links that span from one optical device to another and carry SONET/SDH lower bandwidth services, the links ride on top of OCH links and terminate in TDM client ports. |
| OCH |
OCH is a wavelength connection spanning between the client port one OT device (transponder, muxponder, regen) and another. 40 or 80 OCH links can be created on top of OMS links. The client port can be a TDM or ETH port. |
| ODU |
ODU links are sub-signals in OTU links. Each OTU links can carry multiple ODU links, and ODU links can be divided into finer granularity ODU links recursively. |
| OSPF |
Open Shortest Path First, an Interior Gateway Protocol between routers. |
| OTN-Line |
An OTN connection between two ODU client ports over OTN path. |
| OTS |
OTS is the physical link connecting one line amplifier or ROADM to another. An OTS can be created over a fiber link. |
| OTU |
OTU is the underlay link in OTN layer, used for ODU links. It can ride on top of an OCH. |
| Packet E-Line |
A point-to-point connection between two routers or transponders/muxponders over MPLS-TP or IP-MPLS. |
| PCC |
Path Computation Client. Delegated to controller. Router is responsible for initiating path setup and retains the control on path updates. |
| PCE |
Path Computation Element. Controller-initiated. |
| Policy |
A group of rules and shared risk resource types. |
| Radio Channel |
Multiple radio channels can be on top of radio media, each channel represents a different ETH link with its own rate. |
| Radio Media |
The media layer as a carrier of radio channels. |
| RD |
Route Distinguisher. |
| RSVP-TE |
Resource Reservation Protocol to control traffic engineered paths over MPLS network . |
| RT |
Route Target. |
| Rule |
A group of two or more diverse links/connections. |
| SCH |
A super-channel is an evolution of DWDM in which multiple, coherent optical carriers are combined to create a unified channel of a higher data rate, and which is brought into service in a single operational cycle. |
| SDN Controller |
Software that manages multiple routers or optical network elements. |
| Shared Risk Resource Type |
The type of the resource that the shared risk analysis application checks if objects in the rule share. The types are Link, Device, Shelf, Card, and Port. |
| SHQL |
The Sedona Hierarchical Query Language (SHQL) is used to easily query the model across all dimensions (Vendors, Topologies, Layers, Domains, Status and Time). |
| SR Policy |
Segment Routing Policy. A segment routing path between two nodes, with mapping to the IGP links based on SIDs list. |
| SRLG |
The Shared Risk Link Group are the links or connections that may suffer from a common failure if they share a common risk, such as a device, link or card. |
| STS |
Large and concatenated TDM circuit frame (such as STS-3c) into which ATM cells, IP packets, or Ethernet frames are placed. Rides on top of OC/OCG as optical carrier transmission rates. |
| uRLLC |
Ultra-Reliable Low Latency Communications. |
| Violation |
Any case where a resource, identified by its shared risk resource type, is shared between two links/connections. |
| VRF |
Virtual Routing Function, acts as a router in L3-VPN. |
| ZR Channel |
Multiple ZR channels can be on top of ZR media, each channel represents a different IP link with its own rate. |
| ZR Media |
The media layer as a carrier of ZR channels, on top of OCH link. |
This application helps to enforce diversity policy rules on predefined links or connection groups or on ad-hoc selected links/connections.
The application identifies any lower layer resources shared by a pair or group of links, or by any connection between selected endpoints. This helps you to ensure that diverse links or connections are not using the same underlying resources.
The LDP Endpoint test looks for the shortest IGP path between the two pairs of routers and then analyses the shared risk between the paths found.
You can define one or more policies and use them for testing. A policy includes the shared risk resource type, the test type and the applicable rules.
● Shared Risk Resource Type – The type of resource that according to policy should not be shared by the links/connections paths. One or more of the following resource types can be selected: Device, Shelf, Card, Port, Link, or SRLG.
● Test scenario – The test type, either multiple links or a single protected link.
● Rules – Groups of links or connections by specific type. Users can select links/connections to a group and give each group a name or use SHQL rule to define the group. The group is retrieved at the time of execution. If there are any network changes, you can use the time machine and network inventory app to identify these changes.
To run a test, you can select a policy or ad-hoc select links/connection pairs to check if they share common resources.
Results are displayed as risks, where each row in the results table is a risk found that impacts a pair of links/connection of the selected policy or ad-hoc selection. The results table displays the names of the rules, the links that are at risk, the link type, the number, or resources they share and the total bandwidth at risk.
You can run a test on specific links, checking for shared risk resources of type link, device, shelf, card, and port. You can select whether to check:
● Multiple links
● Single protected link
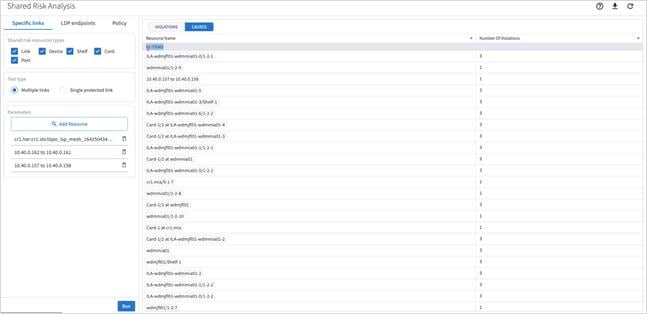
To run a specific links test:
1. In the applications bar in Crosswork Hierarchical Controller, select Shared Risk Analysis.
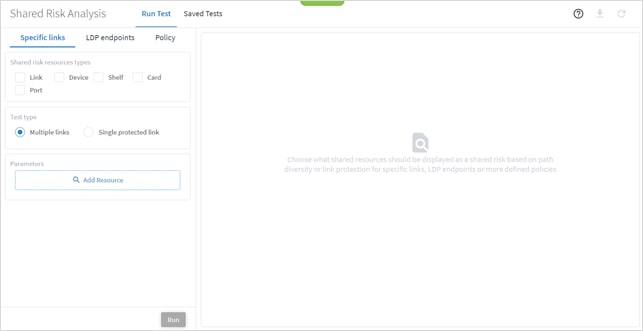
2. Select the required Shared risk resources types.
3. Select the Test type (Multiple links or Single protected link).
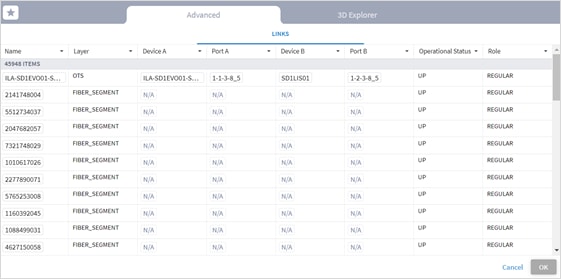
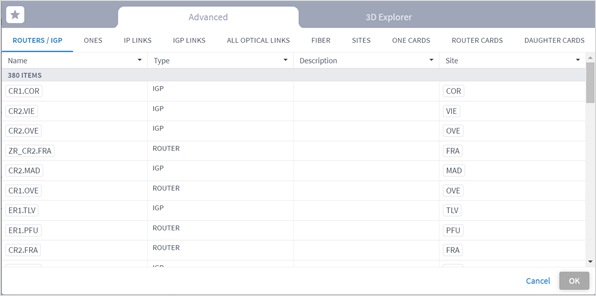
4. Click Add Resource to add a link.
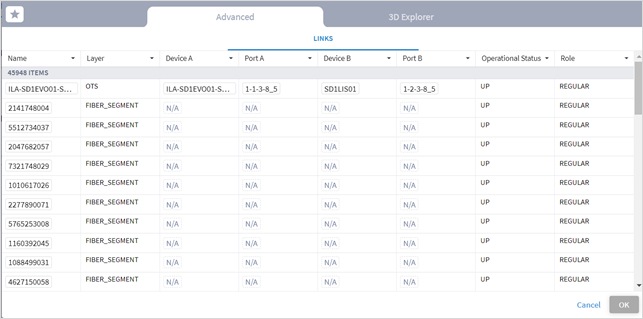
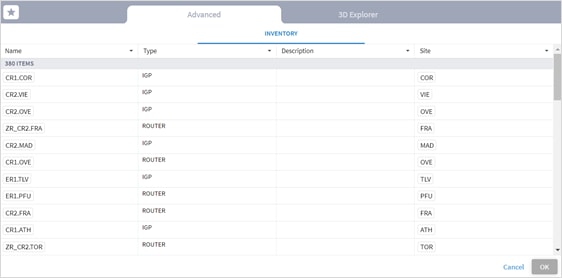
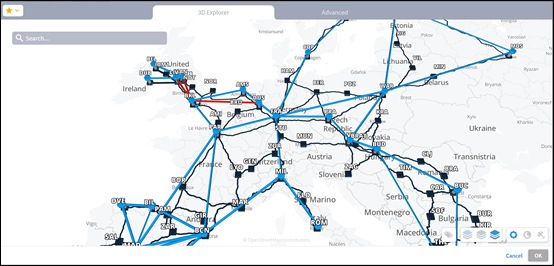
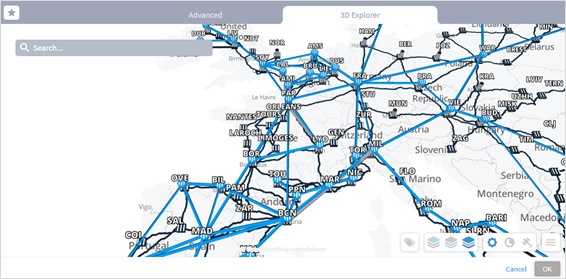
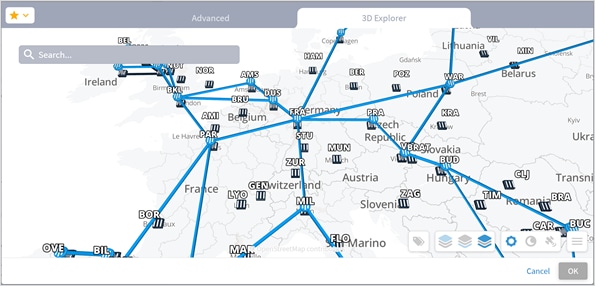
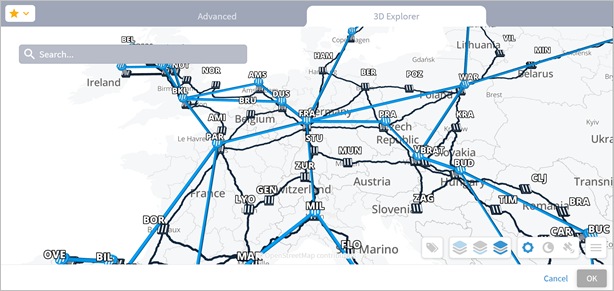
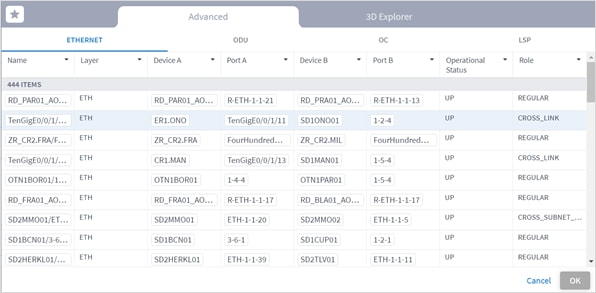
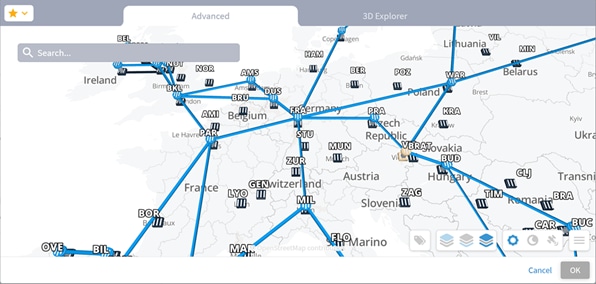
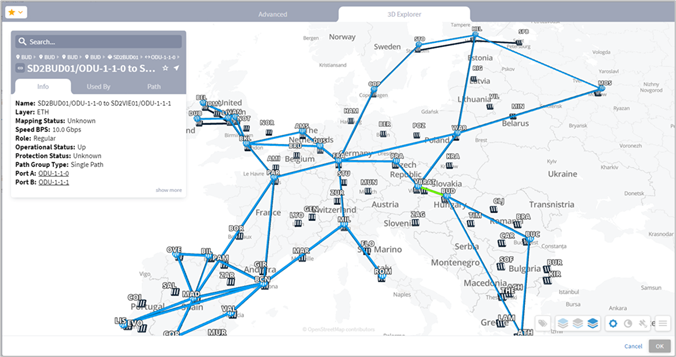
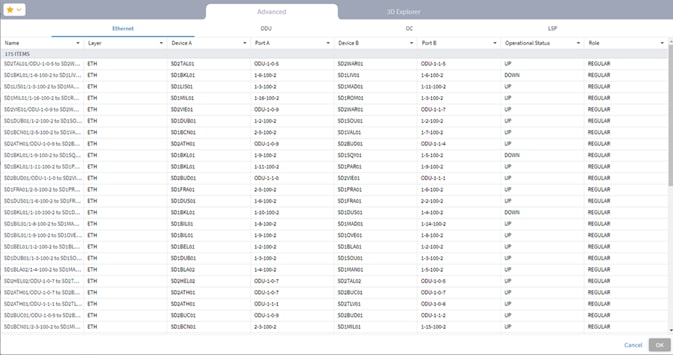
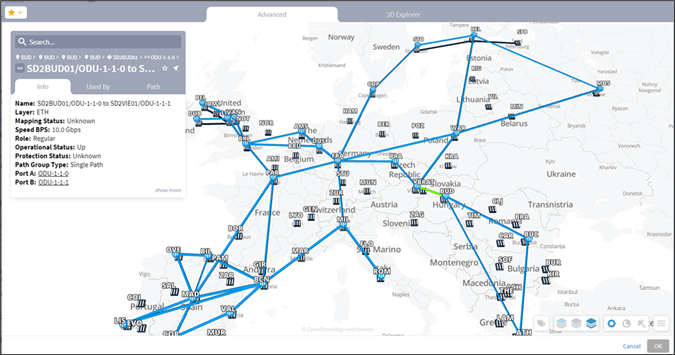
Or select the 3D Explorer tab.
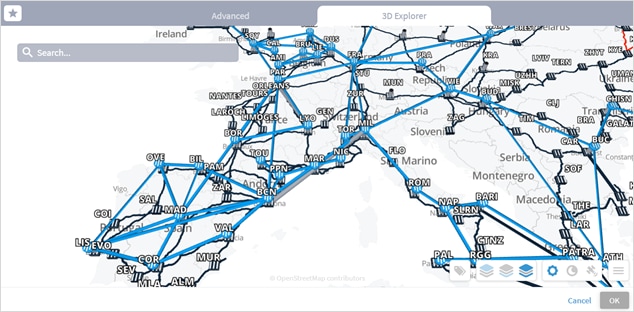
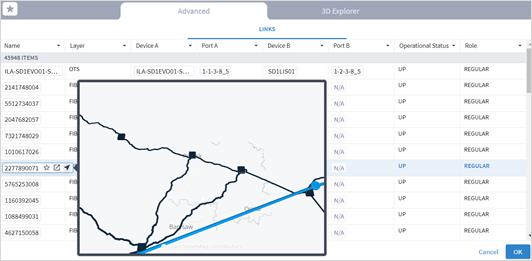
In the Advanced tab, you can select a link and click to view the link in the popup map.
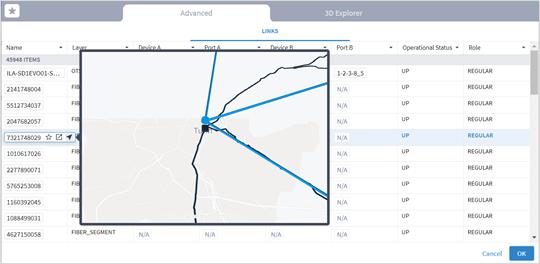
5. Select a link and click OK.
6. Add more links (by repeating the steps above for other links to analyze).
7. Click Run. In the test results, you see the VIOLATIONS.
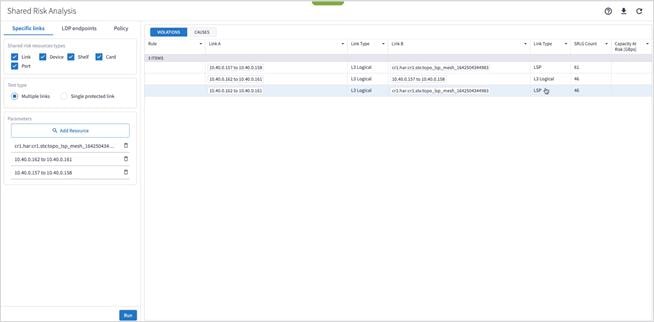
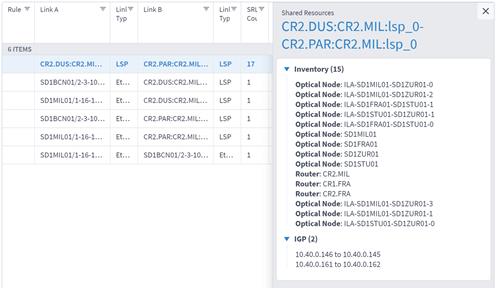
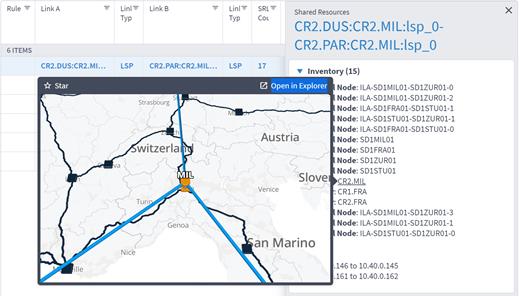
8. You can select a link and view the link in the popup map and select a row (and click ![]() to expand) in the test results to see more details on the shared resources.
to expand) in the test results to see more details on the shared resources.
Note: For a single protected link, the Link B and Link Type columns are empty, and the Capacity At Risk column is likely to be N/A.
9. To view the causes, select the CAUSES tab.
10. (Optional) For multiple links, to remove a link from the test, select ![]() and click Run.
and click Run.
You can run a test on two pairs of routers acting as LDP endpoints, checking for shared risk resources of type link, device, shelf, card, and port. You need to select two endpoint device pairs.
This test looks for the shortest IGP path between the two pairs of routers and then analyses the shared risk.
To run LDP endpoints test:
1. In the applications bar in Crosswork Hierarchical Controller, select Shared Risk Analysis.
2. Select the LDP endpoints tab.
3. Select the required Shared risk resource types.
4. Click ![]() to add an endpoint.
to add an endpoint.
Or select the 3D Explorer tab.
5. Select an endpoint.
6. Click OK.
7. Add more endpoints.
8. Click Run.
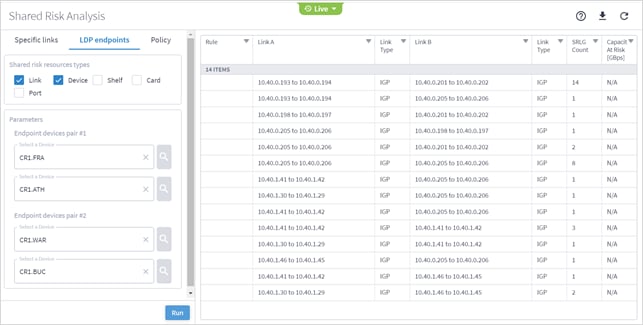
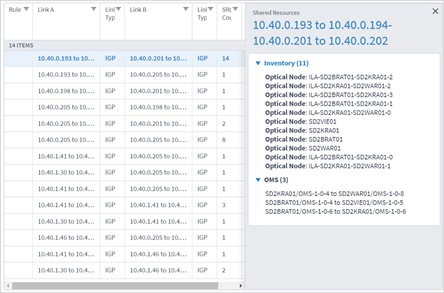
9. In the test results, you can select a link and view the link in the popup map and select a row (and click ![]() to expand) in the test results to see more details on the shared resources.
to expand) in the test results to see more details on the shared resources.
The tabular test results can be exported into a CSV file for offline analysis.
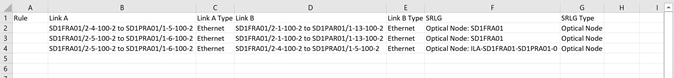
To export the test results:
1. In the applications bar in Crosswork Hierarchical Controller, select Shared Risk Analysis.
2. Run the required test.
3. Click ![]() . The file is downloaded automatically.
. The file is downloaded automatically.
The time machine provides a snapshot of the state of the network as it was at a date in the past. In this mode, all applications reflect data and analysis that apply to this point in time.
You can use the time machine to execute the tests on the model as at a date in the past.
To change the model date:
1. In the applications bar in Crosswork Hierarchical Controller, select Shared Risk Analysis.
2. Click Live, select a date and click Confirm.
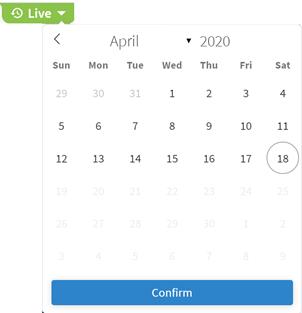
3. Run the required test.
You can define one or more policies and use them for testing. A policy includes the shared risk resource type and the applicable rules.
● Shared Risk Resource Type – The type of resource that according to policy should not be shared by the links/connections paths. The following resource types can be selected: Device, Shelf, Card, Port, Link, or SRLG.
● Test type– Either test multiple links or a single protected link.
● Rules – Groups of links or connections by specific type. You can select links/connections to a group and give each group a name.
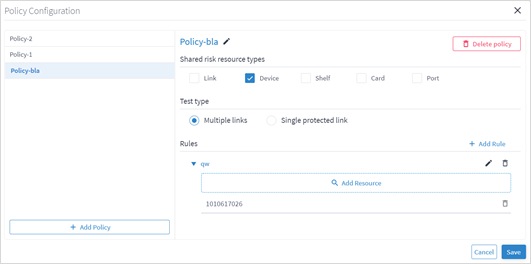
You can add a policy, and then add rules to it. You must add at least one rule to save a new policy.
You can add a rule to an existing policy. Alternatively, you can add rules using the Shared Risk API and SHQL query (see Add Rules using the Shared Risk API).
To add a policy:
1. In the applications bar in Crosswork Hierarchical Controller, select Shared Risk Analysis.
2. Select the Policy tab.
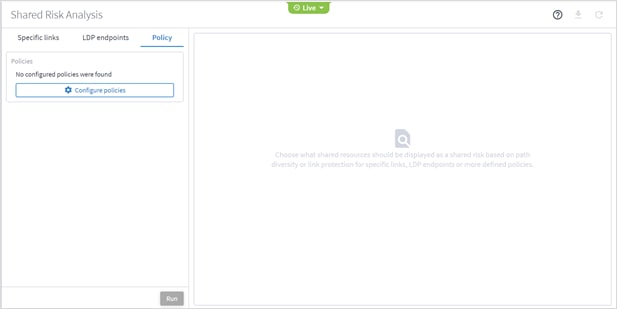
3. Click ![]() Configure Policies.
Configure Policies.
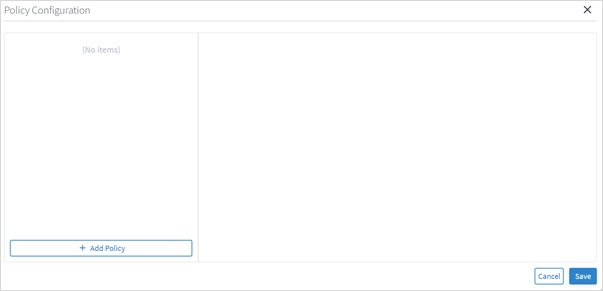
4. In the Policy Configuration window, click Add Policy.
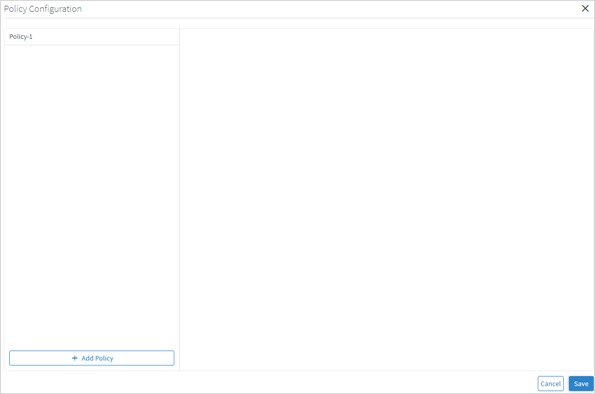
5. Select the policy.

6. (Optional) To change the policy name, select the new policy, click ![]() , modify the policy name and then click
, modify the policy name and then click ![]() .
.
7. Select the required Shared risk resource types.
8. Select whether you want to test Multiple links or Single protected link.
9. Click Add Rule.
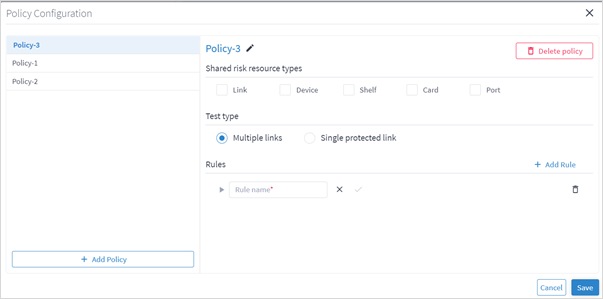
10. Enter a rule Name.
11. Click ![]() .
.
12. Click ![]() to expand the rule.
to expand the rule.
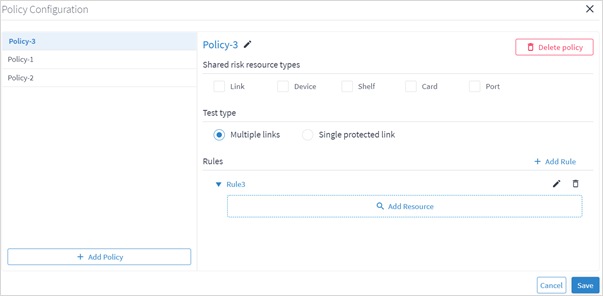
13. Click Add Resource to add a resource.
Or select the 3D Explorer tab.
In the Advanced tab, you can select a link and view the link in the popup map.
14. Select a link and click OK.
15. If required, add more links to the rule.
16. Click Save.
Add Rules using the Shared Risk API
You can add a rule to an existing policy using the Policy API. This enables you to add rules using both GUIDs and/or an SHQL query. For more details, see the Crosswork Hierarchical Controller NBI and SHQL Guide.
To add a rule using APIs:
1. Get a list of the policies. See Get Policies.
2. Add a rule to a policy. See Add a Rule to a Policy.
3. You can view the SHQL query in the rule in the Policy Configuration window. See Edit Policy.
You can remove a rule from a policy.
To remove a rule from a policy:
1. In the applications bar in Crosswork Hierarchical Controller, select Shared Risk Analysis.
2. Select the Policy tab.
3. Click ![]() Configure Policies.
Configure Policies.
4. Select the required policy.
5. In the Rules area, click ![]() .
.
6. Click Save.
You can edit a policy.
To edit a policy:
1. In the applications bar in Crosswork Hierarchical Controller, select Shared Risk Analysis.
2. Select the Policy tab.
3. Click ![]() Configure Policies.
Configure Policies.
4. Select the required policy.
5. Modify the policy.
6. Click Save.
You can delete a policy.
To delete a policy:
1. In the applications bar in Crosswork Hierarchical Controller, select Shared Risk Analysis.
2. Select the Policy tab.
3. Click ![]() Configure Policies.
Configure Policies.
4. Select the required policy.
5. Click Delete policy.
6. Click Save.
You can run a test on a policy, checking for shared risk resources of type link, device, shelf, card, and port. Each policy includes one or more rules.
To run a policy test:
1. In the applications bar in Crosswork Hierarchical Controller, select Shared Risk Analysis.
2. Select the Policy tab.
3. Select the required policy.
4. Click Run.
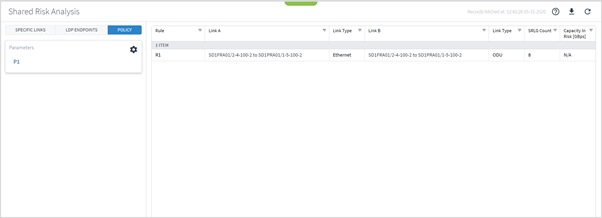
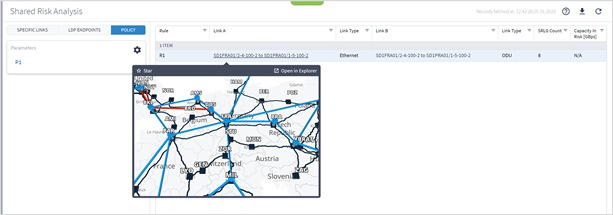
5. In the test results, you can select a link and view the link in the popup map and select a row (and click ![]() to expand) in the test results to see more details on the shared resources.
to expand) in the test results to see more details on the shared resources.
Crosswork Hierarchical Controller provides APIs to administer shared risk policies and rules.
You can access the Shared Risk API using Swagger: https://<host>/api/v2/apps/srlg-app/rest/doc
The APIs include:
● Get a specific policy
● Get all policies
● Create a policy
● Delete a policy
● Change the shared risk type of the policy
● Change a policy type
● Add a new rule to a policy
● Update the rule resources
● Delete a rule from a policy
Use this API to get the list of all the policies. This returns a list of all the policies and their rules.
Request Method
GET
Request URL
https://example-host/api/v2/apps/srlg-app/rest/policy
Request Parameters
None
Response Example
{
"name": "policy-1",
"shared_risk_types": [
"Link",
"Port",
"Card",
"Shelf",
"Device"
],
"policy_type": "MULTIPLE-LINKS",
"rules": [
{
"name": "rule-1",
"resources": [
"LI/eth/000fc44c94a1f2cd/51308dfd752c1574/df753d953c1e1c8f/f8e7b20537ce03b7"
]
},
{
"name": "rule99",
"resources": [
"inventory[.name=\"CR1.PAR\"]|port|link[.layer=\"R_LOGICAL\"]"
]
}
]
},
{
"name": "test",
"shared_risk_types": [
"Link",
"Device",
"Shelf",
"Port",
"Card"
],
"policy_type": "MULTIPLE-LINKS",
"rules": [
{
"name": "rule001",
"resources": [
"inventory[.name=\"ILA-SD1EVO01-SD1SEV01-1\"]|port|link[.layer=\"R_LOGICAL\"]"
]
}
]
},
{
"name": "policy-3",
"shared_risk_types": [
"Link"
],
"policy_type": "SINGLE-PROTECTED",
"rules": [
{
"name": "rule-99",
"resources": [
"link[.layer=\"R_LOGICAL\"]"
]
}
]
}
Use this API to retrieve a policy.
Request Method
GET
Request URL
https:// example-host/api/v2/apps/srlg-app/rest/policy/{policyGuid}
Request Parameters
| Parameter Name |
Data Type |
Description |
| policyGuid |
string |
The policy guid. Use the guid returned by the Get Policies method. |
Response Example
{
"name": "policy-1",
"shared_risk_types": [
"Link",
"Port",
"Card",
"Shelf",
"Device"
],
"policy_type": "MULTIPLE-LINKS",
"rules": [
{
"name": "rule-1",
"resources": [
"LI/eth/000fc44c94a1f2cd/51308dfd752c1574/df753d953c1e1c8f/f8e7b20537ce03b7"
]
},
{
"name": "rule99",
"resources": [
"inventory[.name=\"CR1.PAR\"]|port|link[.layer=\"R_LOGICAL\"]"
]
}
]
}
Use this API to create a policy.
Request Method
POST
Request URL
https://example-host/api/v2/apps/srlg-app/rest/policy/{policyGuid}
Request Parameters
| Parameter Name |
Data Type |
Description |
| policyGuid |
string |
The policy guid. Use the guid returned by the Get Policies method. |
Request Body
| Parameter Name |
Data Type |
Description |
| shared_risk_types |
string |
Link, Port, Card, Shelf, Device |
| policy_type |
string |
SINGLE-PROTECTED or MULTIPLE-LINKS. |
Request Body Example
{
"shared_risk_types": [
"Link"
],
"policy_type": "SINGLE-PROTECTED"
Response Example
201 Successful Operation
Use this API to delete a policy.
Request Method
DELETE
Request URL
https://example-host/api/v2/apps/srlg-app/rest/policy/{policyGuid}
Request Parameters
| Parameter Name |
Data Type |
Description |
| policyGuid |
string |
The policy guid. Use the guid returned by the Get Policies method. |
Response Example
200 Successful
Update Policy Shared Risk Types
Use this API to change the policy shared risk types.
Request Method
PUT
Request URL
https://example-host/api/v2/apps/srlg-app/rest/policy/{policyGuid}/shared_risk_types
Request Parameters
| Parameter Name |
Data Type |
Description |
| policyGuid |
string |
The policy guid. Use the guid returned by the Get Policies method. |
Request Body
| Parameter Name |
Data Type |
Description |
| shared_risk_types |
string |
Link, Port, Card, Shelf, Device |
Request Body Example
{
"shared_risk_types": [
"Link"
]
}
Response Example
200 Successful Operation
Use this API to update credentials.
Request Method
PUT
Request URL
https://example-host/api/v2/apps/srlg-app/rest/policy/{policyGuid}/policy-type
Request Parameters
| Parameter Name |
Data Type |
Description |
| policyGuid |
string |
The policy guid. Use the guid returned by the Get Policies method. |
Request Body
| Parameter Name |
Data Type |
Description |
| policy_type |
string |
SINGLE-PROTECTED or MULTIPLE-LINKS. |
Request Body Example
{
"policy_type": "SINGLE-PROTECTED"
}
Response Example
200 Successful Operation
Use this API to add a rule to a policy. You can use an array of GUIDs and/or an SHQL query to create the rule.
Request Method
POST
Request URL
https://example-host/api/v2/apps/srlg-app/rest/policy/{policyGuid}/rules{ruleName}
Request Parameters
| Parameter Name |
Data Type |
Description |
| policyGuid |
string |
The policy guid. Use the guid returned by the Get Policies method. |
| ruleName |
string |
The rule name. Use one of the rule names returned by the Get Policies method. |
Request Body
| Parameter Name |
Data Type |
Description |
| resources |
array(string) |
A list of GUID links and/or an SHQL query. If you use an SQHL query, make sure that the expression is valid and returns a result. See the SQHL User Guide. When you pass an SQHL query, ensure that you wrap "…." with a pair of \s, for example: "link[.layer=\"R_LOGICAL\"]" |
Request Body Example
{
"resources": [
"link[.layer=\"R_LOGICAL\"]"
]
}
or
{
"resources": [
"LI/guid1",
"LI/guid2"
]
}
or
{
"resources": [
"inventory[.name=\"CR1.PAR\"]|port|link[.layer=\"R_LOGICAL\"]"
]
}
Response Example
201 Successful Operation
Use this API to update the rule's resources. You can use an array of GUIDs and/or an SHQL query to create the rule.
Request Method
PUT
Request URL
https://example-host/api/v2/apps/srlg-app/rest/policy/{policyGuid}/rules{ruleName}
Request Parameters
| Parameter Name |
Data Type |
Description |
| policyGuid |
string |
The policy guid. Use the guid returned by the Get Policies method. |
| ruleName |
string |
The rule name. Use one of the rule names returned by the Get Policies method. |
Request Body
| Parameter Name |
Data Type |
Description |
| resources |
array(string) |
A list of GUID links and/or an SHQL query. If you use an SQHL query, make sure that the expression is valid and returns a result. See the SQHL User Guide. When you pass an SQHL query, ensure that you wrap "…." with a pair of \s, for example: "link[.layer=\"R_LOGICAL\"]" |
Request Body Example
{
"resources": [
"link[.layer=\"R_LOGICAL\"]"
]
}
or
{
"resources": [
"LI/guid1",
"LI/guid2"
]
}
or
{
"resources": [
"inventory[.name=\"CR1.PAR\"]|port|link[.layer=\"R_LOGICAL\"]"
]
}
Response Example
201 Successful Operation
Use this API to delete a rule from a policy.
Request Method
DELETE
Request URL
https://example-host/api/v2/apps/srlg-app/rest/policy/{policyGuid} /policy/{policyGuid}/rules/{ruleName}
Request Parameters
| Parameter Name |
Data Type |
Description |
| policyGuid |
string |
The policy guid. Use the guid returned by the Get Policies method. |
| ruleName |
string |
The rule name. Use one of the rule names returned by the Get Policies method. |
Response Example
200 Successful
The Crosswork Hierarchical Controller Failure Impact application allows simulation of resource failures in a multidomain network, pointing to the specific domain in which the failure originated and the impact on services and network resources.
This application simulates the impact of a failure in a selected resource (link, device or site) on one or more network objects in the network where the application searches for alternative path to links or services (both, customer-based and resource-based) over the selected resource and provides results to show the impact on the services. The alternative path can be minimized by latency, number of hops, or admin costs and it is displayed with a comparison of the current path to the alternative found path.
You can also exclude resources from the calculated alternative path by selecting specific resources (objects such as devices, ports, and links) or by using tags as reference to group of resources.
This solves the failure impact problem by providing detailed results that can be acted on. For example, additional links can be added to vulnerable points, and any required changes can be made to the topology. This results in reduced failure impact and increased network reliability.
You can run a failure impact test on one or more devices, links and/or sites. The Failure Impact application creates a list of affected services/connections and, if an alternative path exists, the application shows the current and the alternative path for each service/connection.
You can set various options for the test:
● The path optimization criteria (path minimization) can be configured as the number of hops, latency, or admin cost.
● Whether to assess the failure impact by services path or by connections path.
● Depending on the path type selected:
◦ Which services to filter by, either E-Line and/or OTN Line or specific services.
◦ Which connection type, Ethernet, ODU, OC, and/or LSP, or specific connections.
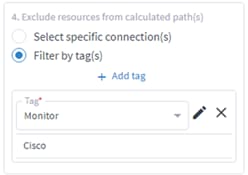
● Whether to exclude resources from the calculated path(s) selected by:
◦ Specific resources selected by the model selector.
◦ Use tags.
To run a failure impact test:
1. In the applications bar, select Failure Impact.
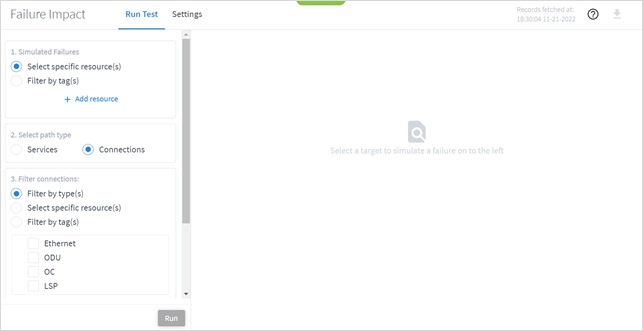
2. In the Simulated Failures area, do one of the following:
◦ Choose Select specific resource(s) and then click Add resource. In the Advanced tab, select a resource, or click on the 3D Explorer tab to select a resource. You can add up to 10 items.
Note: For more information on 3D Explorer, see the Cisco Crosswork Hierarchical Controller Network Visualization Guide.
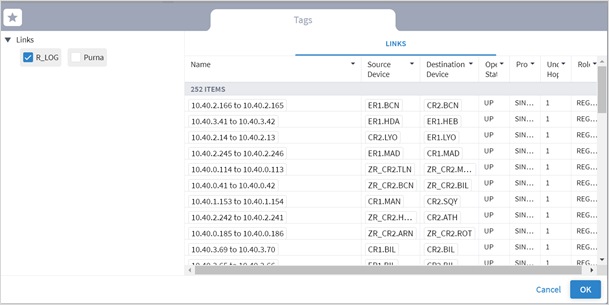
◦ Choose Filter by tag(s) and then click Add Tags, then select a tag and click OK. Select more tags if required.
3. Select the Select path type (either Services or Connections).
4. Select the Filter by type(s):
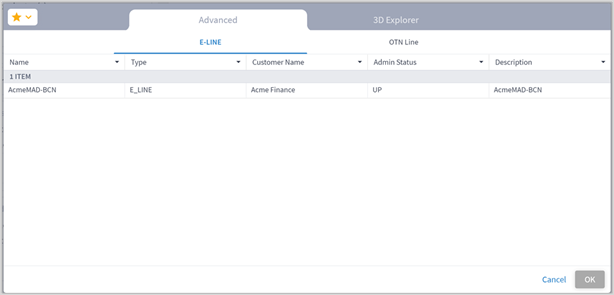
◦ For services, E-LINE and/or OTN LINE.
◦ For connections, Ethernet, ODU, OC, and/or LSP.
5. (Optional) For services, select the Select specific services and then click Add service. In the Advanced tab, select a service, or click on the 3D Explorer tab to select a service. You can add up to 10 items.
6. (Optional) For connections, select the Select specific resource(s) and then click Add resource. In the Advanced tab, select a resource, or click on the 3D Explorer tab to select a resource. You can add up to 10 items.
7. (Optional) In the Exclude resources from calculated path(s) area, and then:
◦ Choose Select specific resource(s) and then click Add resource. In the Advanced tab, select a resource, or click on the 3D Explorer tab to select a resource. You can add up to 10 items.
◦ Choose Filter by tag(s) and then click Add tag, then select a tag, select the required tag value and click OK. Add more tags if required.
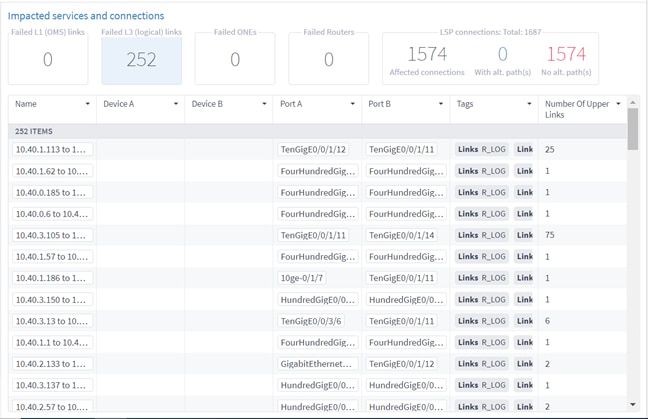
8. Click Run. The impacted services and connections appear, with the root causes listed in the lower pane.
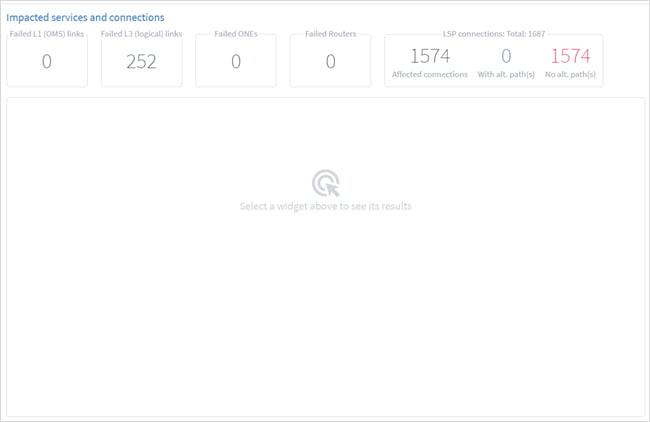
9. Select a widget to see its results.
10. To filter the table, click ![]() and select the required options.
and select the required options.
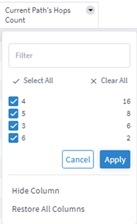
11. To remove a column, click Hide Column.
12. To restore all columns, click Restore All Columns.
13. To sort the table, click on a column heading.

![]()
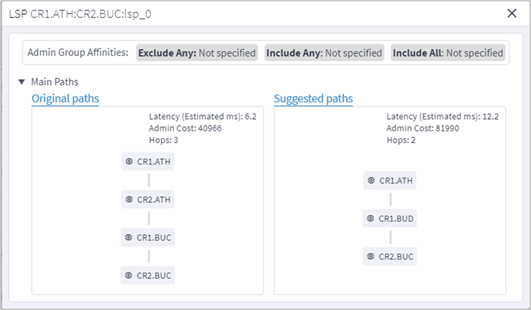
14. Click to select an item in the list. A list of the Original paths and Suggested paths appears. The simulated failed links show in purple.
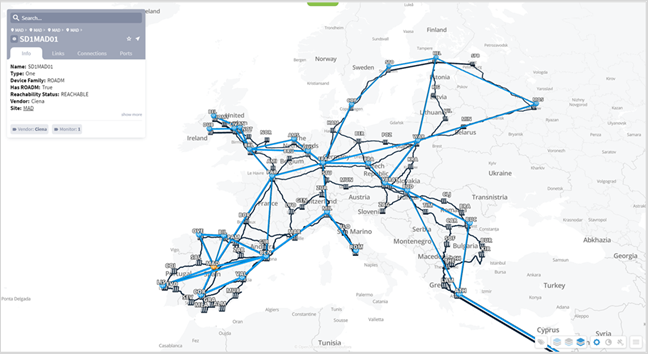
15. Click a resource to view the resource in the 3D Explorer map.
Configure the Failure Impact Settings
You can configure various failure impact settings.
When the actual latency of all the links in a path is not known, a fudge factor for optimal paths latency setting is used to set a best guess distance multiplier for the links with missing latency. This multiplier is applied to the geographical distance between the endpoints of the link, and the factored distance is used to estimate the latency of the link.
Note: Setting a high value for the fudge factor means that such a path is only selected if it is significantly shorter than all other alternatives.
The algorithm for computing approximate latency only uses the fudge factor for the links in the path where the distance and latency are missing and is applied as follows:
● Let L(X,Y) be the geographical distance between endpoints X and Y divided by speed of light in fiber.
● For an OTS link between X and Y, if the latency is missing, use F*L(X,Y)
● If a higher layer link Z between X and Y has a direct latency value – use it as it is the most accurate value. Otherwise:
◦ If Z has a full path – use the sum of latencies of the links along the path (some of which may have been recursively estimated).
◦ If Z has a gap in its path between site X and Y – compute the latency of the gap the same way: F*L(X,Y).
◦ If Z does not have a path – use F*L(X,Y) for the latency.
To set the failure impact settings:
1. In the applications bar, select Failure Impact.
2. Select the Settings tab.
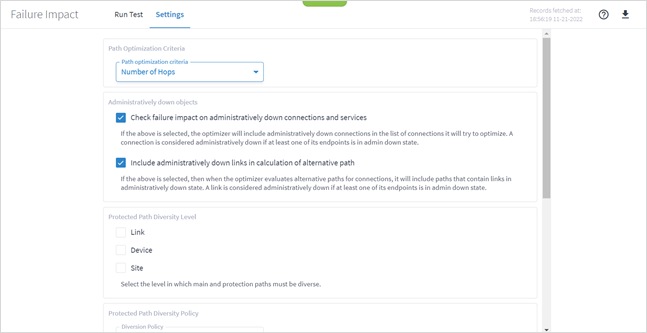
3. Select the Path Optimization Criteria:
◦ Number of Hops: Optimize by the number of hops.
◦ Latency [milliseconds]: Optimize by the latency.
◦ Admin Cost: Optimize by the admin cost
4. Select how to handle Administratively down objects:
◦ Check failure impact on administratively down connections and services: Select this option to include in recalculation, connections or services that are down (connections and services that at least one of their end ports is administratively down are considered down).
◦ Include administratively down links in calculation of alternative path: Select this option to include links that are down in the calculation of new alternative paths for impacted connections or services (links with at least one of their end ports administratively down are considered down.
5. Sets the level in which the main and protection paths must be diverse by selecting the Protected Path Diversity Level (Link, Device, and/or Site). The diversity level selected implies the diversity in all layers, down to fiber path. For example, if link is selected, the algorithm checks that no link is shared in all L3 to L1 layers, down to the physical fiber path (if discovered by Crosswork Hierarchical Controller).
6. Select the Protected Path Diversity Policy:
◦ Strict: Only find strictly diverse protection paths.
◦ Best Effort: Find the “best effort” diverse protection paths. This first tries to optimize the protected path diversity taking devices, sites and links into account. If this fails, it tries to optimize the protected path diversity taking devices and links into account. If this fails, it tries to optimize for links only. If this fails, the protected path diversity does not take devices, sites or links into account.
7. Set the Unknown Latency Path options:
◦ Fudge factor for the current paths latency: This is the fudge factor for the current paths latency. Set this fudge factor to high number means that the estimated latency of some links on the current path will be high, and Crosswork Hierarchical Controller will offer potentially optimal paths even if they are not highly likely to be more optimal.
◦ Fudge factor for the optimal paths latency: This is the fudge factor for optimal paths latency. Setting this fudge factor to a high number means that these links will be selected as an alternative only when there is a high likelihood that such a path is indeed shorter than other alternatives.
8. Click Save Changes.
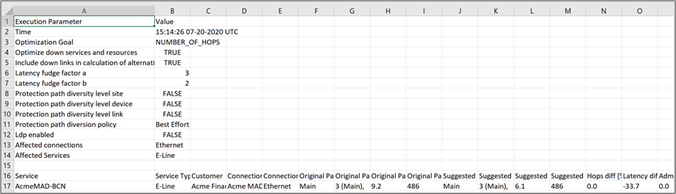
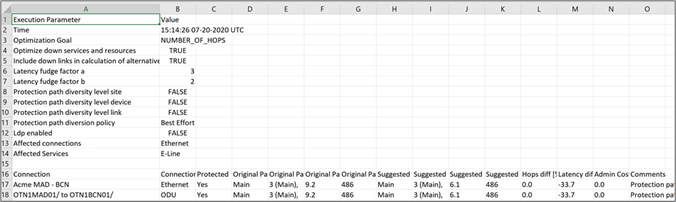
The tabular test results can be exported into a zip file with one or two CSV files for offline analysis. One file includes the services (if you selected the services path type) and the other includes the connections.
To export the test results:
1. In the applications bar, select Failure Impact.
2. Run the required test.
3. Click ![]() . The file is downloaded automatically
. The file is downloaded automatically
A key challenge for operators is how to identify network vulnerabilities and the risk of isolation of routers in case of failures.
This type of problem may arise due to discrepancies between the design and implementation, or simply from design failures. This may cause a whole network domain to be disconnected due to a single failure. These gaps are difficult to identify, leaving the network vulnerable, with a major impact on business.
The NetFusion Network Vulnerability application checks for router segmentation in the event of any combination of L1-3 device/link failures.
The testing can be executed for current conditions, as well as for simulated failures (single and dual), and identifies very specific failures.
This solves the network vulnerability problem by providing detailed results that can be acted on. For example, additional links can be added to vulnerable points, and any required changes can be made to the topology. This results in reduced network vulnerability and increased network reliability.
The Network Vulnerability application discovers routers that are disconnected from the rest of the network, under current network conditions, or those that would be disconnected under one or more simulated resource failures. These conditions are called "network segmentation" or “clustering”.
The application finds segmentations that are caused by current network failures. It also uses simulated resource failures to identify potential segmentations that would be caused by these failures.
The application keeps the historical simulations for further analysis.
You can run the Network Vulnerability application in real time and select whether to:
● Identify current segmentations in the entire network.
● Check if a single failure will cause a segmentation in the network.
● Test if a dual failure will cause a segmentation.
Each failure can be a simulation of a failure for resource types or for specific resources. You can choose whether to test all routers, optical nodes, IP links, and/or optical links, or you can specify a list of up to 20 resources to test by adding their entity names.
The test, based on the selected options, returns a list of scenarios. A scenario is a specific group of one or more routers that will be disconnected due to one or more failed resources. Each scenario may include a list of routers that currently are disconnected or would be isolated/disconnected due to simulated failures (single or dual), given the selected resources types or resources. Scenarios are ordered by the total number of disconnected routers per scenario and the total bandwidth lost. For a specific scenario, the causes list the resources that were they to fail, would cause the routers to be disconnected.
Tests are run on the network as it appears in the network model. Networks that are already segmented and split into isolated islands with no links between them, are not considered a failure. The largest group of linked routers is ‘the’ network and any smaller groups that are vulnerable to being parted from the network are counted as disconnected.
To run the vulnerability test:
1. In the applications bar, select Network Vulnerability.
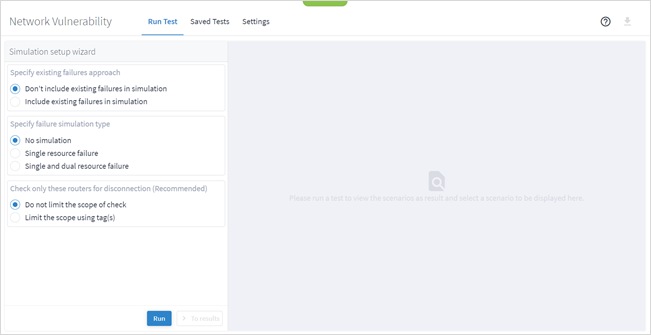
2. In the Run Test left pane, choose the existing failures approach for simulations:
◦ Don’t include existing failures in simulations: Select this option to treat all routers or links as “up” for the purposes of the simulation.
◦ Include existing failures in simulation: Select this option to check if there are routers that are currently isolated/disconnected due to any IP or optical link with operational state down and include them as such in the simulation.
For example, if there is a router with two links, and the status of one of the links is down, if the Include existing failures in simulation option is selected, the router is isolated. If the Don’t include existing failures in simulation option is selected, and the Single resource failure or Single and dual resource failure option is selected, the router is connected.
3. Select the type of test and which resources to run the test on:
◦ No simulation: Only run current failures.
◦ Single resource failure: Checks if there is any router or group of routers that will be disconnected from the network on failure of a single resource of the selected types (routers, optical nodes, IP links, and/or optical links).
◦ Single and dual resource failure: Checks if there is any router or group of routers that will be disconnected from the network on failure of a single resource or dual resources of the selected types (routers, optical nodes, IP links, and/or optical links). You can select different types for the first and second failure.
4. If you selected Single resource failure or Single and dual resource failure select the required inventory types.
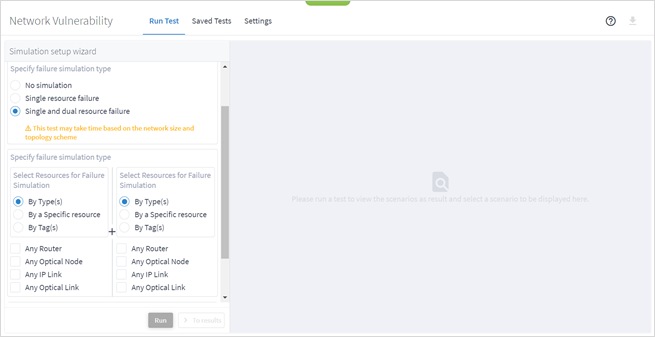
5. (Optional) Select By a specific resource. You can add up to 20 resources. This checks if there are routers that will be disconnected from the network on failure of the selected resources.
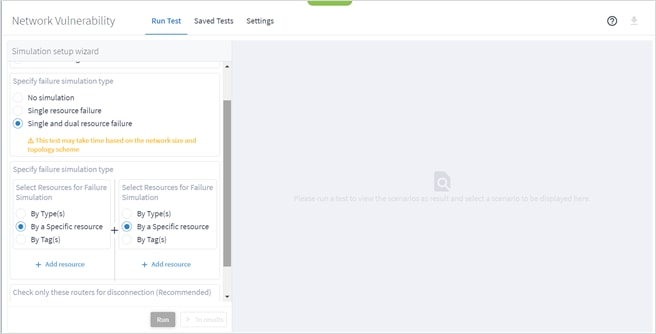
6. Click Add resource to select the required resources.
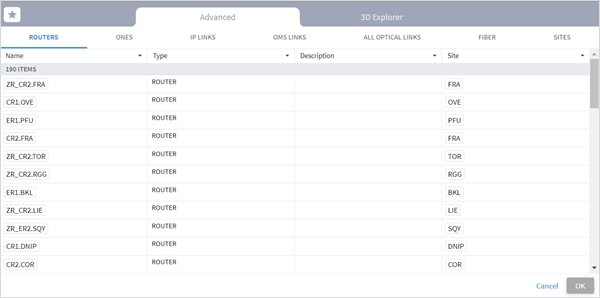
7. Select a resource and click OK.
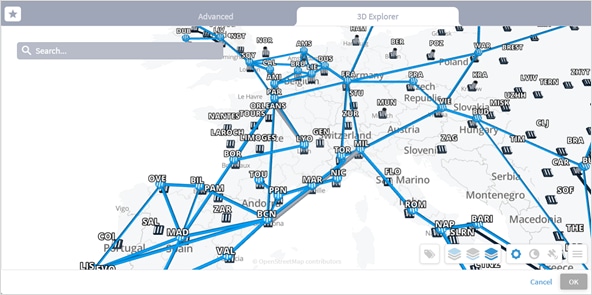
Or
Select the 3D Explorer tab and select the required resource and click OK.
Note: You cannot run the test on an LSP link or an L3 Logical link.
8. (Optional) You can add up to 20 items. Click Add resource and repeat the steps above.
9. (Optional) To delete a failed item, click ![]() .
.
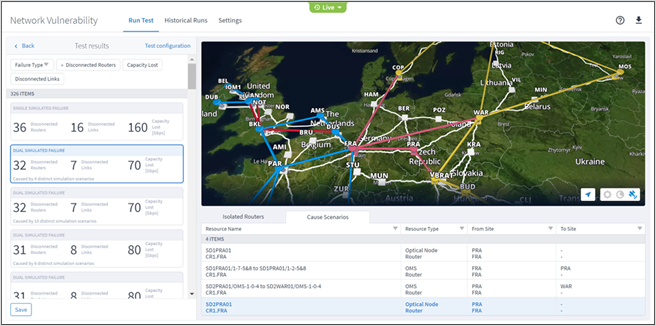
10. Click Run Test. The test runs and a list of scenarios appears. A scenario is any group of one or more routers that will be disconnected due to one or more failed resources.
Note: If you close the application or log out while the test is running, the test continues running and is saved in the test list (with the results) so that you can see it when you log in the next time.
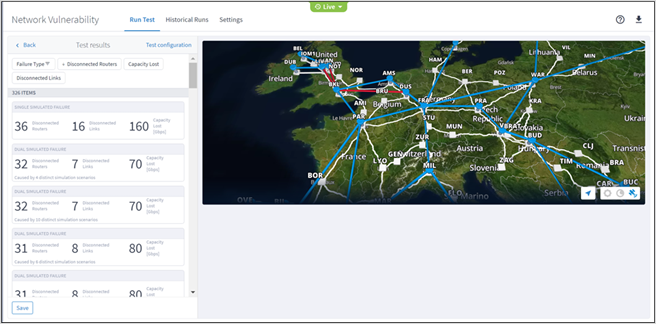
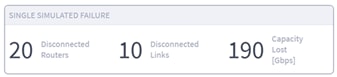
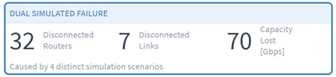
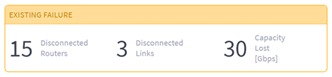
A simulated failure lists the following:
◦ The failure type – Dual Simulated Failure or Single Simulated Failure or Existing Failure.
◦ The number of disconnected routers.
◦ The number of disconnected links.
◦ The capacity lost (Gbps).
◦ The number of distinct simulation scenarios.
11. Click an item to view the details for the required scenario.
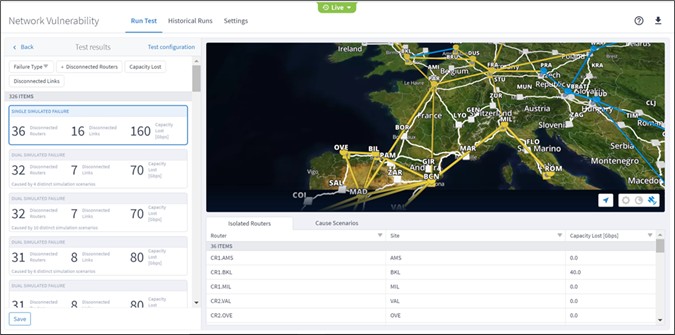
12. The Isolated Routers tab lists the routers, sites and lost capacity. Click on a router to zoom in on the Explorer map.
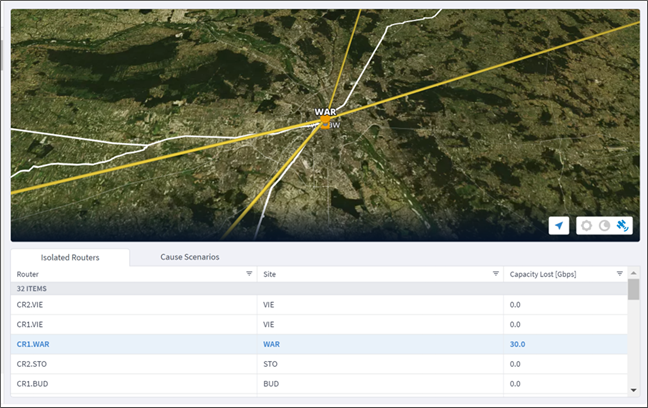
13. Select the Cause Scenarios tab to view a list of the scenarios with the resource names, resource type, from site and to site.
14. Click to select a scenario in the list. The isolated routers are shown in yellow and the underlying scenario that causes the failure is shown in pink.
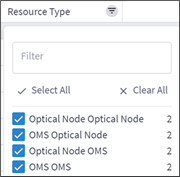
15. To filter the table, click ![]() and select the required options.
and select the required options.
16. To sort the table, click on a column heading.
17. To return to the test setup, click Back.
You can save your test. Enter a unique name for the test. You can then view the test results or use it as a basis for an automatic periodic test. See Network Vulnerability Settings. You can save up to 20 historical tests.
To save a test:
1. In the applications bar, select Network Vulnerability.
2. Run the test. See Run Vulnerability Test.
3. Click Save.
4. Enter a unique test name.
5. Click Save.
View Saved Tests
Up to 20 tests can be saved and displayed. If you apply the time machine in Explorer, the list of the runs includes tests that were saved before the selected time.
To view historical runs:
1. Click Saved Tests. A list of the tests appears in the left pane.
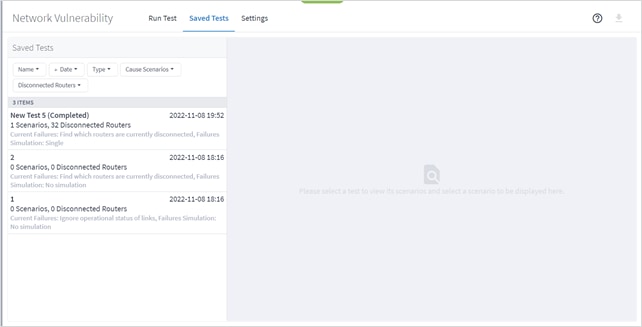
The list details:
◦ Test name
◦ Test date and time
◦ No. of scenarios
◦ Total no. of disconnected routers (for all scenarios)
◦ Test type
2. Select a test to view the test details. The same details appear for the historical runs as for the real time test. For details on this page, see Run Vulnerability Test.
3. To view the test configuration, click Test configuration.
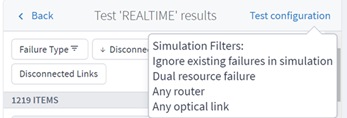
4. To return to the list of tests, click Back.
5. To re-run the test, click Re-run test.
6. To delete the test, click Remove Test.
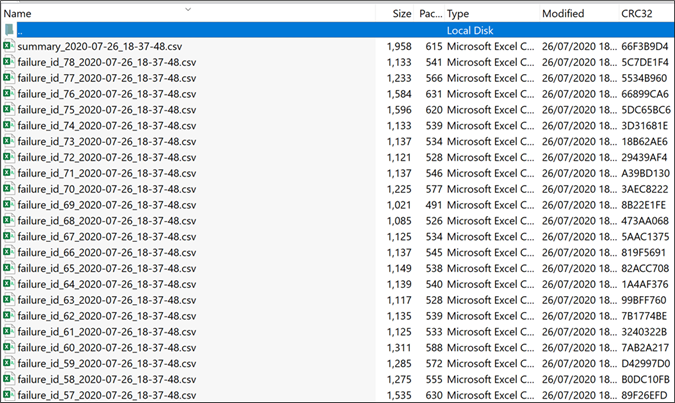
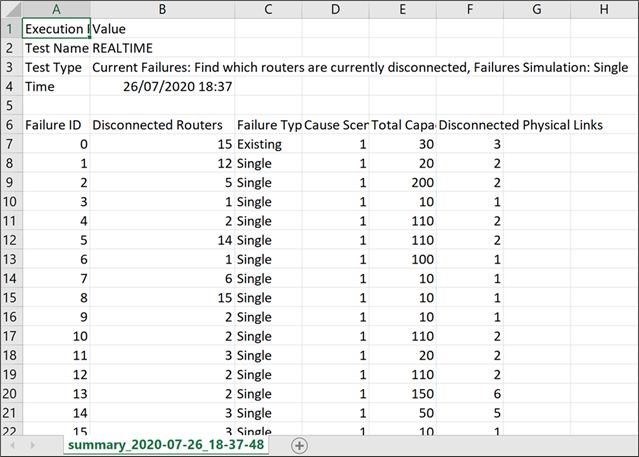
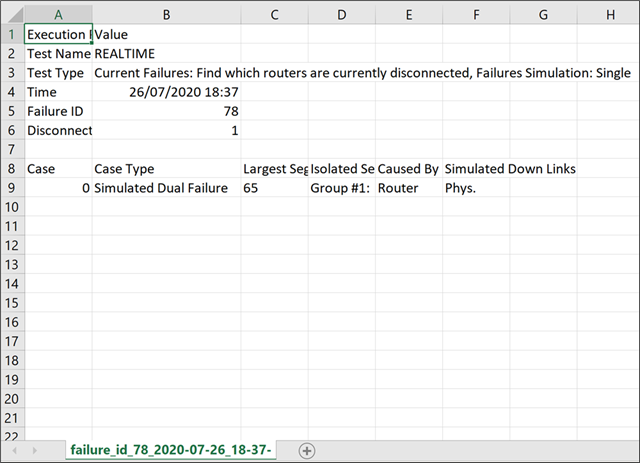
The tabular test results can be exported into a zip file with one summary CSV file and one CSV file per failure.
To export the test results:
1. In the applications bar, select Network Vulnerability.
2. Run the required test or locate the historical test.
3. Click ![]() . The file is downloaded automatically.
. The file is downloaded automatically.
You can save up to 20 historical tests. If you try to save a test once 20 tests are saved, you will be required to delete a test before you can save another one.
To delete a test:
1. In the applications bar, select Network Vulnerability.
2. Click Historical Runs.
3. Select a test.
4. Click to delete the test.
Network Vulnerability Settings
You can select a historical test and automatically execute it periodically (once a day or once a week). The test results are automatically saved, overwriting the previous automatic test results. You can view a list of automatic tests. The list details the test name, execution period and last execution time.
The test runs at the time of day that it was created, for example, if a test is added at 14:31:07, it will be executed on a daily base starting at 14:31:07.
To add an automatic test:
1. In the applications bar, select Network Vulnerability.
2. Click Settings.
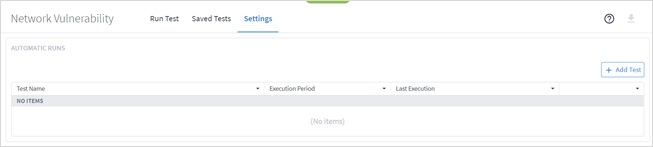
3. Click Add Test.
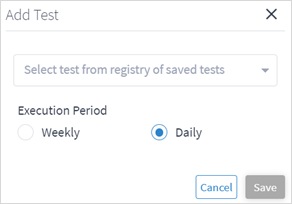
4. Select the test.
5. Select whether to execute the test Weekly or Daily.
6. Click Save.
To delete an automatic test:
1. In the applications bar, select Network Vulnerability.
2. Click Settings.
3. Click ![]() .
.
The Path Optimization application suggests optimization in the path of L1 to L3 connections and services. You can select the criteria for optimization and the connection or service targeted for optimization. The criteria are latency, number of hops, and admin costs.
Connections and service can be:
● All connections (resource-based services) of specific type (Ethernet, ODU. OC or LSP)
● All services (customer-based services) of specific type (E-Line or OTN line)
● Select specific connections or services
You can also exclude resources from the calculated path by selecting specific resources (objects such as devices, ports, and links) or by using tags as reference to group of resources.
Based on the options selected, the application recalculates the paths for selected services and connections according to the selected criteria.
The results include the full list of the affected services and connections, the improvement (if any) according to the selected criteria, for example, the current and suggested path latency, and the percentage difference in latency (before versus after) as a percentage.
There is also a view per connection and service that shows the original and the optimized path. Per path, the list shows the latency, admin cost, and no. of hops, with the full path for devices and links.
You can run a test on one or more devices, links and/or sites. The Path Optimization application creates a list of affected services/connections and, if an alternative path exists, the application shows the current and the alternative path for each service/connection.
You can set various options for the test:
● The path optimization criteria can be configured as the number of hops, latency, or admin cost.
● Whether to assess the path optimization by services path or by connections path.
● Depending on the path type selected:
◦ Which services to filter by, either E-Line and/or OTN Line or specific services.
◦ Which connection type, Ethernet, ODU, OC, and/or LSP, or specific connections.
● Whether to exclude resources from the calculated path(s) selected by:
◦ Specific resources selected by the model selector.
◦ Use tags.
To run a path optimization test:
1. In the applications bar, select Path Optimization.
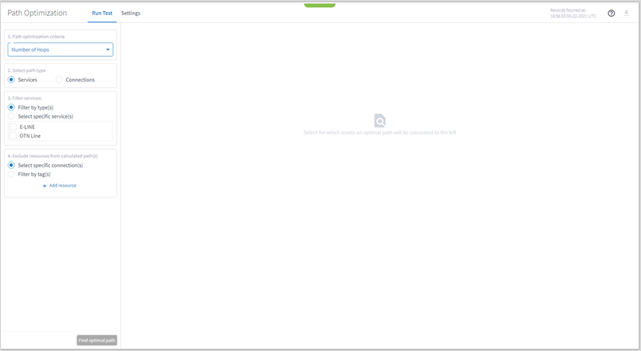
2. Select the Path optimization criteria:
◦ Number of Hops: Optimize by the number of hops.
◦ Latency [milliseconds]: Optimize by the latency.
◦ Admin Cost: Optimize by the admin cost.
3. Select the Select path type (either Services or Connections).
4. Select the Filter by type(s):
◦ For services, E-Line and/or OTN Line.
◦ For connections, Ethernet, ODU, OC, and/or LSP.
5. (Optional) For services, select the Select specific services and then click Add service. In the Advanced tab, select a service, or click on the 3D Explorer tab to select a service. You can add up to 10 items.
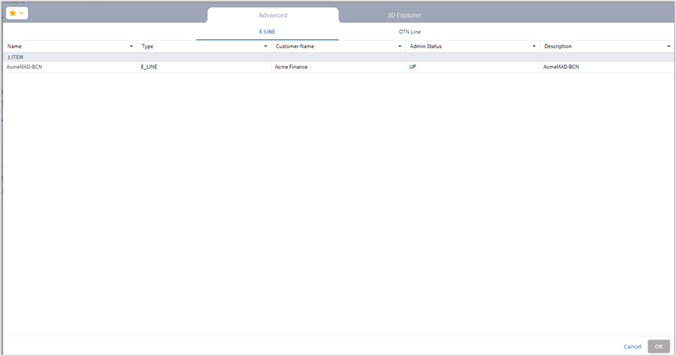
6. (Optional) For connections, select the Select specific connections and then click Add resource. In the Advanced tab, select a resource, or click on the 3D Explorer tab to select a resource. You can add up to 10 items.
7. (Optional) In the Exclude resources from calculated path(s) area, and then:
◦ Choose Select specific connection(s) and then click Add resource. In the Advanced tab, select a resource, or click on the 3D Explorer tab to select a resource. You can add up to 10 items.
◦ Choose Filter by tag(s) and then click Add tag, then select a tag, select the required tag value and click Confirm. Add more tags if required.
8. Click Find optimal path.
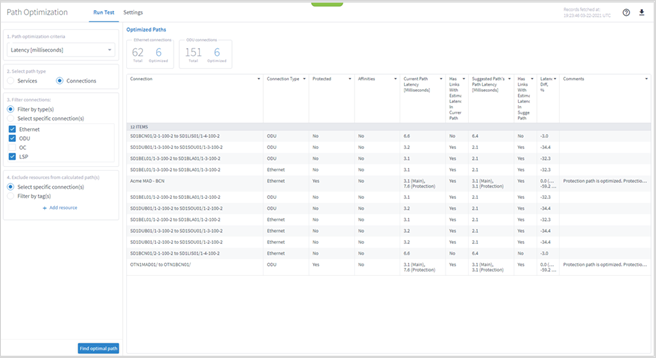
9. To filter the table, click ![]() and select the required options.
and select the required options.
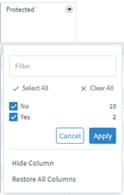
10. To remove a column, click Hide Column.
11. To restore all columns, click Restore All Columns.
12. To sort the table, click on a column heading.

![]()
13. Click to select an item in the list. A list of the Original paths and Suggested paths appears.
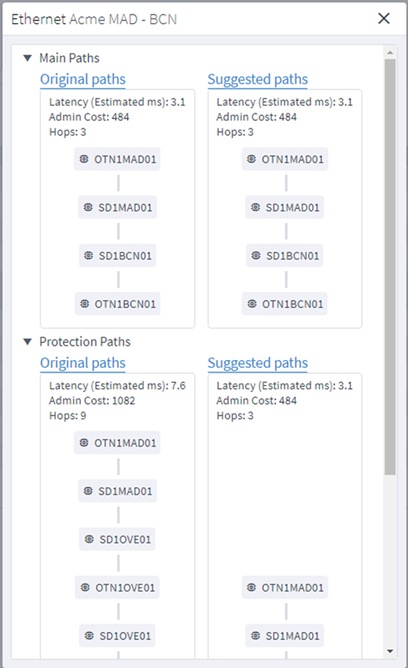
14. Click a resource to view the resource in the 3D Explorer map.
Configure the Path Optimization Settings
You can configure various path optimization settings.
When the actual latency of all the links in a path is not known, a fudge factor for optimal paths latency setting is used to set a best guess distance multiplier for the links with missing latency. This multiplier is applied to the geographical distance between the endpoints of the link, and the factored distance is used to estimate the latency of the link.
Note: Setting a high value for the fudge factor means that such a path is only selected if it is significantly shorter than all other alternatives.
The algorithm for computing approximate latency only uses the fudge factor for the links in the path where the distance and latency are missing and is applied as follows:
● Let L(X,Y) be the geographical distance between endpoints X and Y divided by speed of light in fiber.
● For an OTS link between X and Y, if the latency is missing, use F*L(X,Y)
● If a higher layer link Z between X and Y has a direct latency value – use it as it is the most accurate value. Otherwise:
◦ If Z has a full path – use the sum of latencies of the links along the path (some of which may have been recursively estimated).
◦ If Z has a gap in its path between site X and Y – compute the latency of the gap the same way: F*L(X,Y).
◦ If Z does not have a path – use F*L(X,Y) for the latency.
To set the path optimization settings:
1. In the applications bar, select Path Optimization.
2. Select the Settings tab.
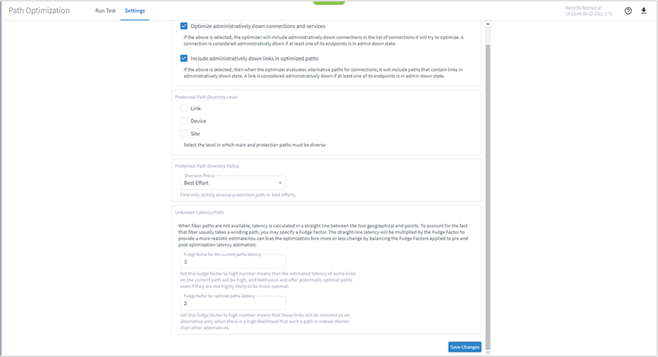
3. Select how to handle Administratively down objects:
◦ Optimize administratively down connections and services: Select this option to include in recalculation connections or services that are down (connections and services that at least one of their end ports is administratively down are considered down).
◦ Include administratively down links in optimized path: Select this option to consider links that are down (links with at least one of their end ports administratively down are considered down) as a valid alternative paths for connections or services.
4. Set the level in which the main and protection paths must be diverse by selecting the Protected Path Diversity Level (Link, Device, and/or Site). The diversity level selected implies the diversity in all layers, down to fiber path. For example, if link is selected, the algorithm checks that no link is shared in all L3 to L1 layers, down to the physical fiber path (if discovered by NetFusion).
5. Select the Protected Path Diversity Policy:
◦ Strict: Only find strictly diverse protection paths.
◦ Best Effort: Find the “best effort” diverse protection paths. This first tries to optimize the protected path diversity taking devices, sites and links into account. If this fails, it tries to optimize the protected path diversity taking devices and links into account. If this fails, it tries to optimize for links only. If this fails, the protected path diversity does not take devices, sites or links into account.
6. Set the Unknown Latency Path options:
◦ Fudge factor for the current paths latency: This is the fudge factor for the current paths latency. Set this fudge factor to high number means that the estimated latency of some links on the current path will be high, and NetFusion will offer potentially optimal paths even if they are not highly likely to be more optimal.
◦ Fudge factor for the optimal paths latency: This is the fudge factor for optimal paths latency. Setting this fudge factor to a high number means that these links will be selected as an alternative only when there is a high likelihood that such a path is indeed shorter than other alternatives.
7. Click Save Changes.
The tabular test results can be exported into a zip file with one or two CSV files for offline analysis. One file includes the services (if you selected the services path type) and the other includes the connections.
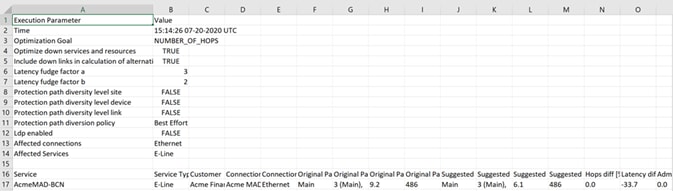
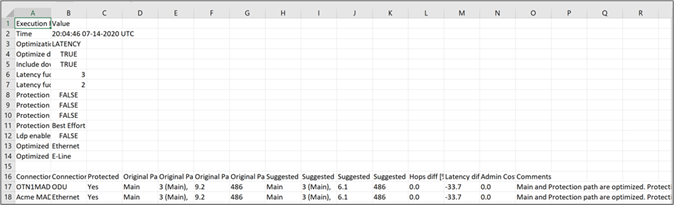
To export the test results:
1. In the applications bar, select Path Optimization.
2. Run the required test.
3. Click ![]() . The file is downloaded automatically.
. The file is downloaded automatically.