Introduction
This document describes a step-by-step walkthrough for configuring FTD to send syslogs to Splunk and using those logs to build custom dashboards and alerts.
Prerequisites
Requirements
Cisco recommends that you have knowledge of these topics before going through this configuration guide:
- Syslog
- Basic knowledge of Splunk's Search Processing Language (SPL)
This document also assumes that you already have Splunk Enterprise instance installed on a server and have access to the web interface.
Components Used
The information in this document is based on these software and hardware versions:
-
Cisco Firepower Threat Defense (FTD) running on version 7.2.4
-
Cisco Firepower Management Center (FMC) running on version 7.2.4
-
Splunk Enterprise instance (version 9.4.3) running on a Windows machine
The information in this document was created from the devices in a specific lab environment. All of the devices used in this document started with a cleared (default) configuration.
Background Information
Cisco FTD devices generate detailed syslogs covering intrusion events, access control policies, connection events, and more. Integrating these logs with Splunk enables powerful analysis and real-time alerting for network security operations.
Splunk is a real-time data analytics platform designed to ingest, index, search, and visualize machine-generated data. Splunk is especially effective in cybersecurity environments as a Security Information and Event Management (SIEM) tool due to its ability to:
-
Ingest log data at scale
-
Perform complex searches with SPL
-
Create dashboards and alerts
-
Integrate with security orchestration and incident response systems
Splunk processes data through a structured pipeline in order to make unstructured or semi-structured machine data useful and actionable. The key stages of this pipeline are often referred to as IPIS which stands for:
-
Input
-
Parsing
-
Indexing
-
Searching
The main broad components of the underlying architecture which are used to realize the IPIS pipeline are shown in this diagram:
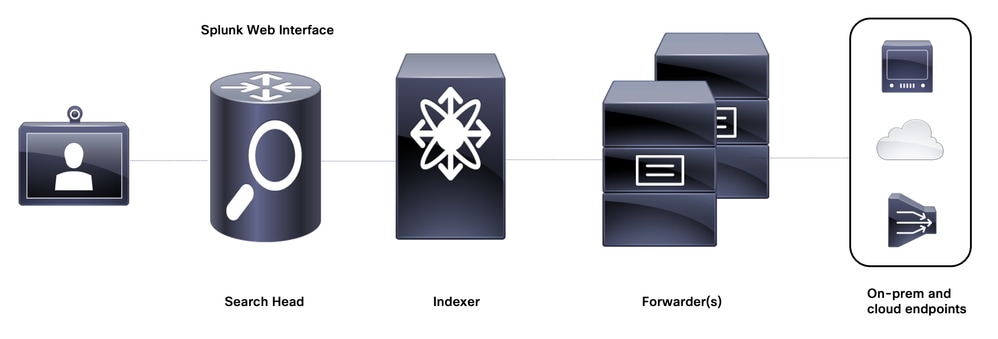 Splunk underlying architecture
Configure
Network Diagram
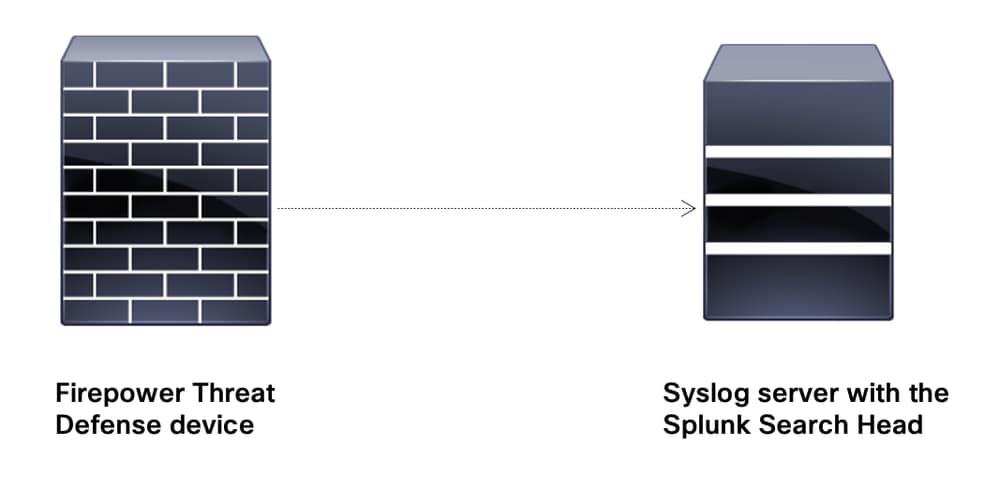 Network Diagram

Note: The lab environment for this document does not require separate forwarder and indexer instances. The windows machine, that is, the syslog server on which the Splunk Enterprise instance is installed is acting as the indexer and the search head.
Configurations
Configure Syslog Settings for the FTD
Step 1. Configure the preliminary syslog settings on FMC for the FTD under Devices > Platform Settings in order to send the logs to the syslog server on which the Splunk instance is running.
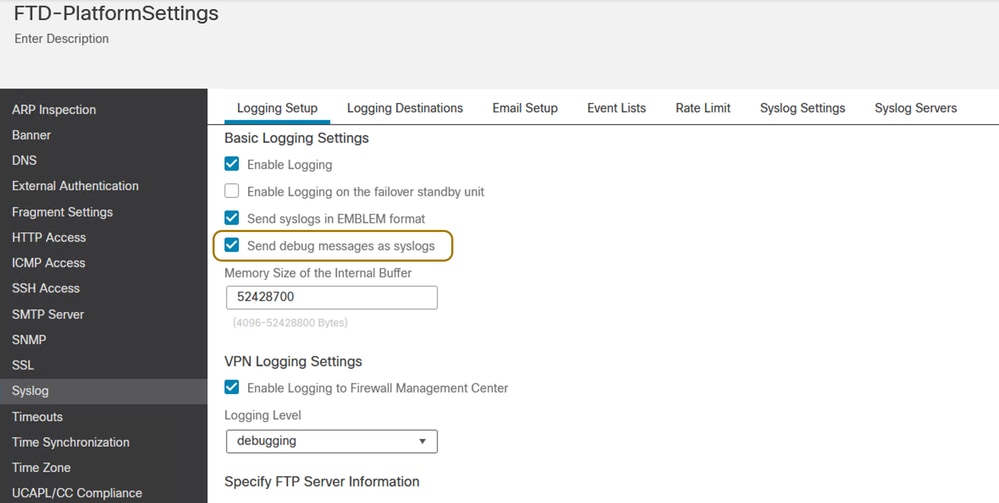 Platform Settings on FTD - Syslog
Step 2. Configure the IP address of the machine where the Splunk Enterprise instance is installed and running as a Syslog Server. Define the fields as mentioned.
IP Address: Fill in the IP address of the host acting as the syslog server
Protocol: TCP/UDP (usually UDP is preferred)
Port: You can choose any random high port. In this case 5156 is being used
Interface: Add the interface(s) through which you have connectivity to the server
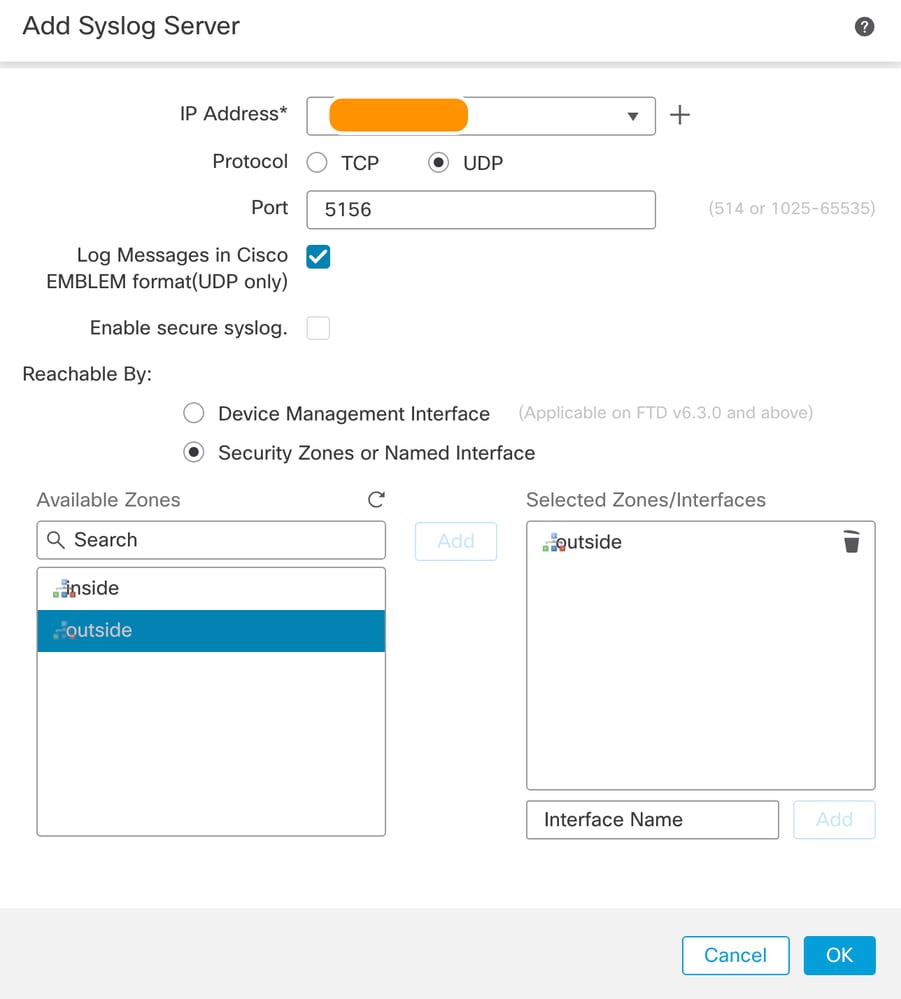 Platform Settings on FTD - Add Syslog Server
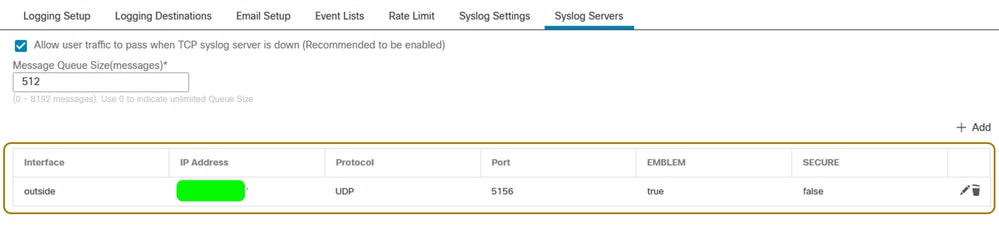 Platform Settings on FTD - Syslog server added
Step 3. Add a logging destination for Syslog Servers. The logging level can be set according to your choice or use case.
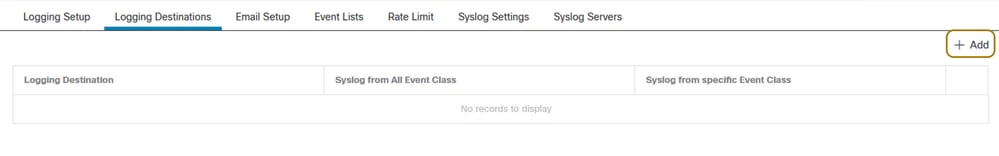 Platform Settings on FTD - Add Logging Destination
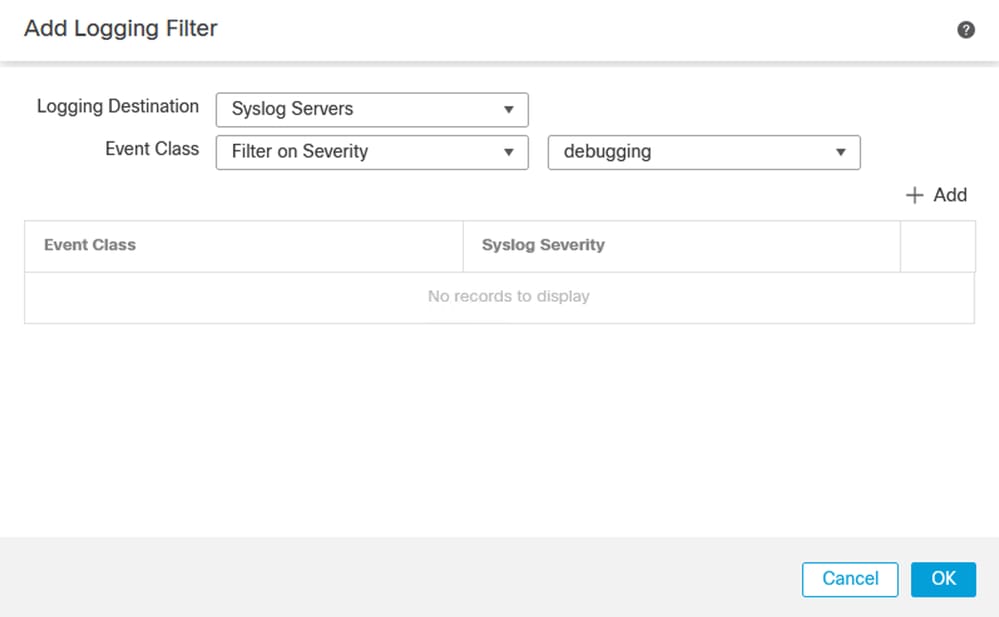 Platform Settings on FTD - Set Severity Level for Logging Destination
Deploy the platform setting changes onto the FTD after completing these steps.
Configure a Data Input on the Splunk Enterprise Instance
Step 1. Login to your Splunk Enterprise instance web interface.
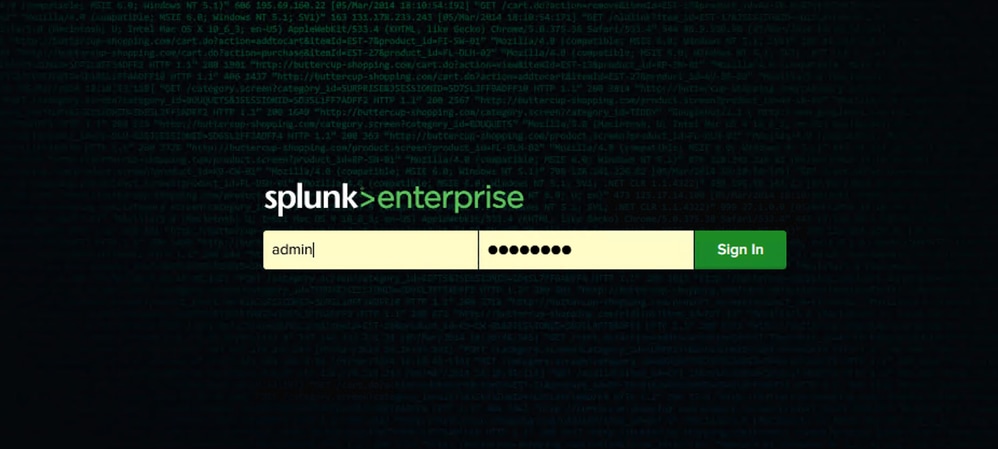 Splunk Web Interface Login Page
Step 2. You must define a Data Input so that you can store and index the syslogs on Splunk. Navigate to Settings > Data > Data Inputs after logging in.
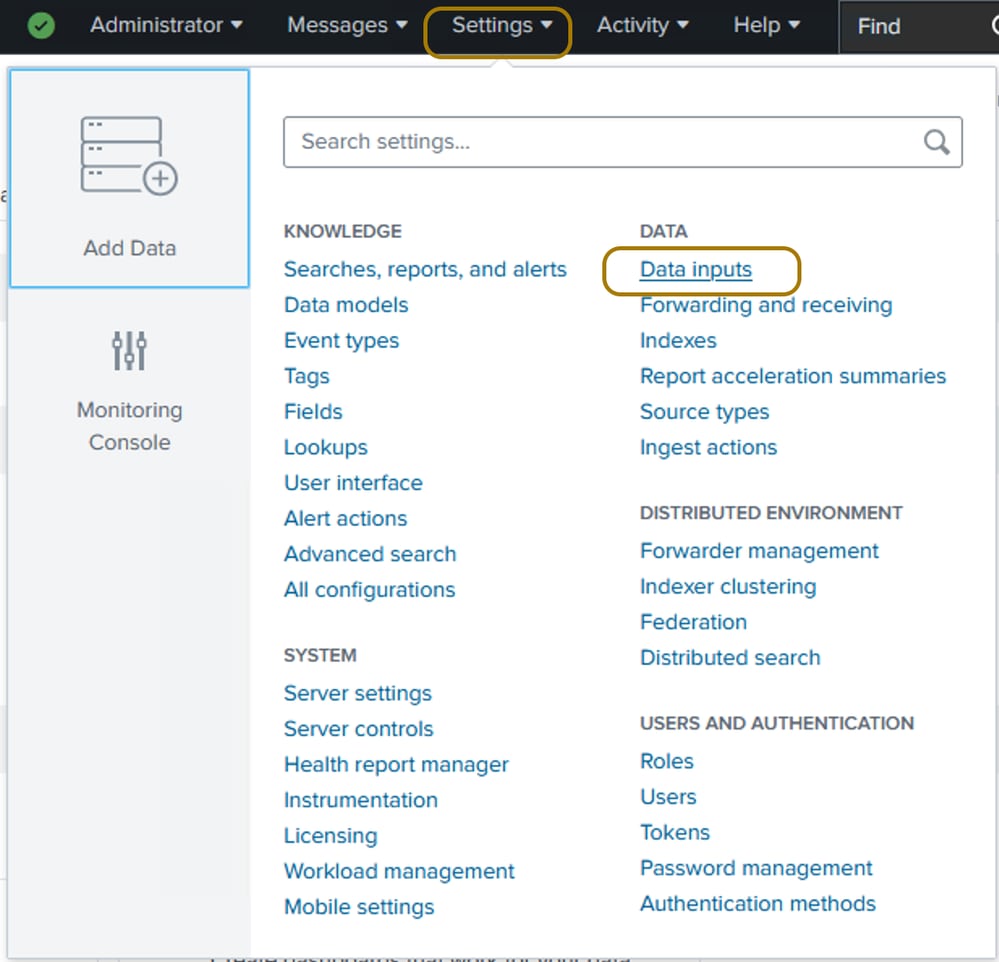 Navigate to Data Inputs on Splunk
Step 3. Choose UDP and then click on New Local UDP on the next page that appears.
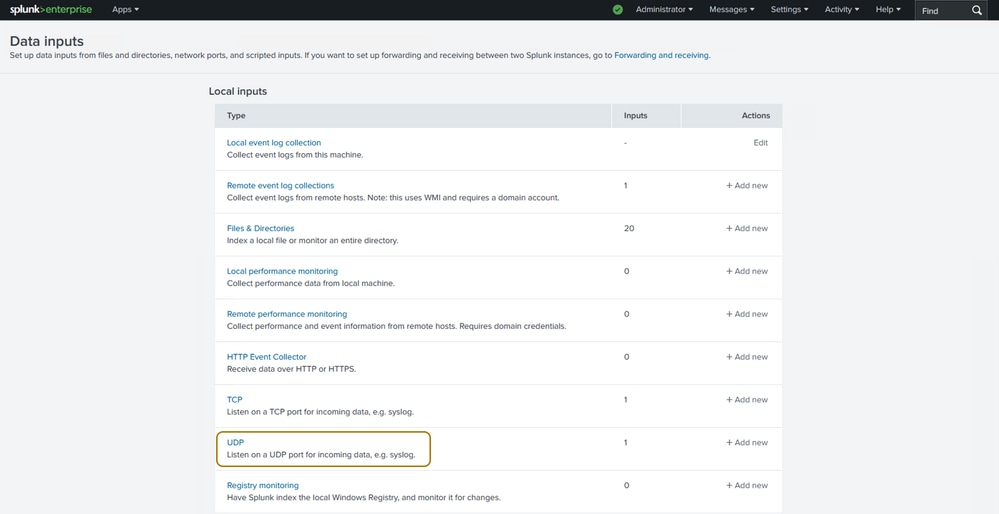 Click on 'UDP' for a UDP Data Input
 Create a 'New Local UDP' Input
Step 4. Enter the port on which the syslogs are being sent. It must be the same as the port configured on the FTD syslog settings, in this case 5156. In order to accept the syslogs only from one source (the FTD), set the Only Accept Connection From field to the IP of the interface on the FTD that is communicating with the Splunk server. Click Next.
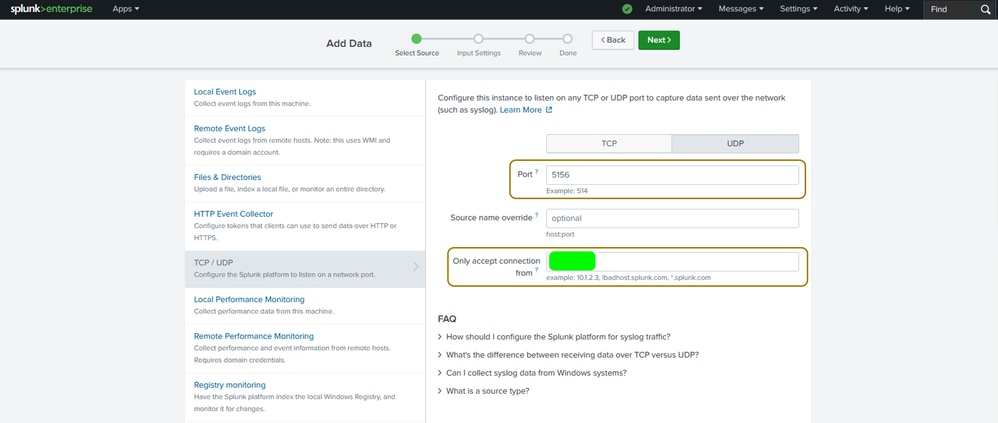 Specify Port and FTD IP address
Step 5. You can search and choose the source type and index field values from the pre-defined ones on Splunk as highlighted in the next image. The default settings can be used for the remaining fields.
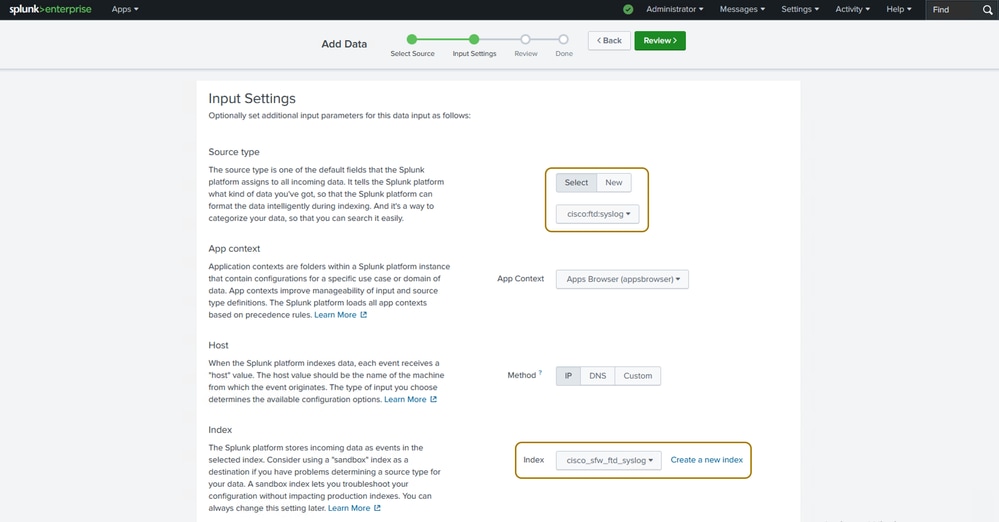 Configure Data Input Settings
Step 6. Review the settings and click Submit.
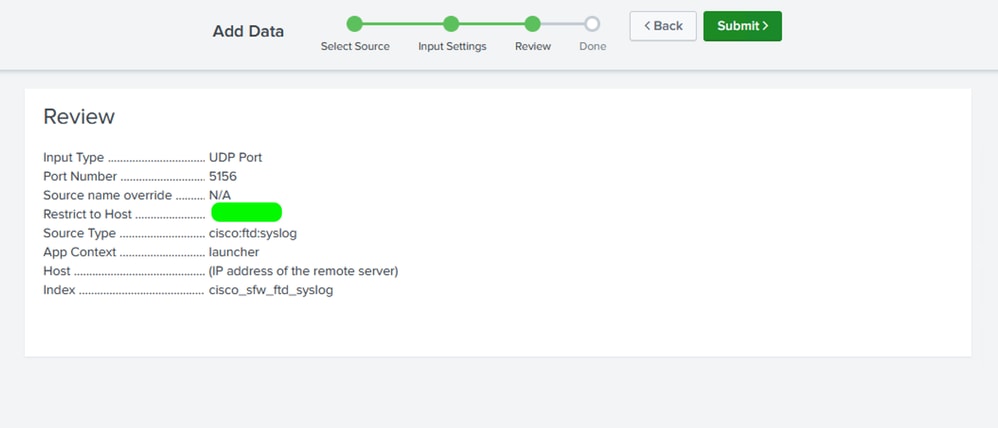 Review Data Input Settings
Execute SPL Queries and Create Dashboards
Step 1. Navigate to the Search and Reporting App on Splunk.
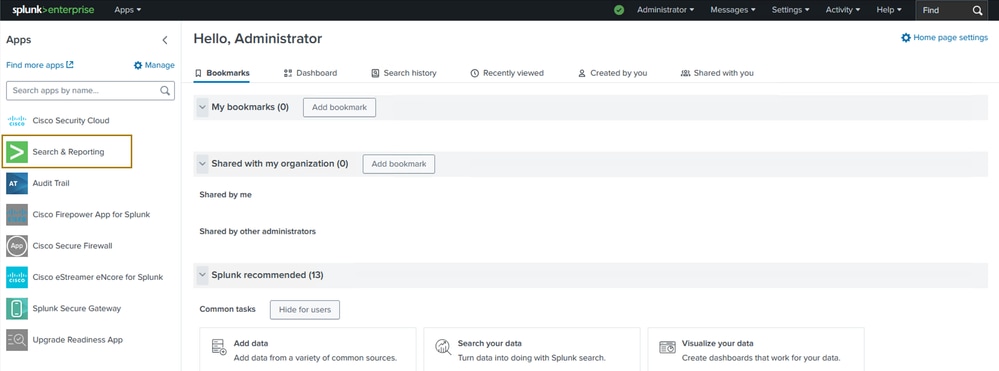 Navigate to the Search and Reporting App
Step 2. Formulate and execute a SPL query according to the data that you want to visualize. You will be able to see each log completely (in the verbose mode) under the Events tab, the count of connections per group-policy in the Statistics tab and visualize this data using these statistics under the Visualization tab.
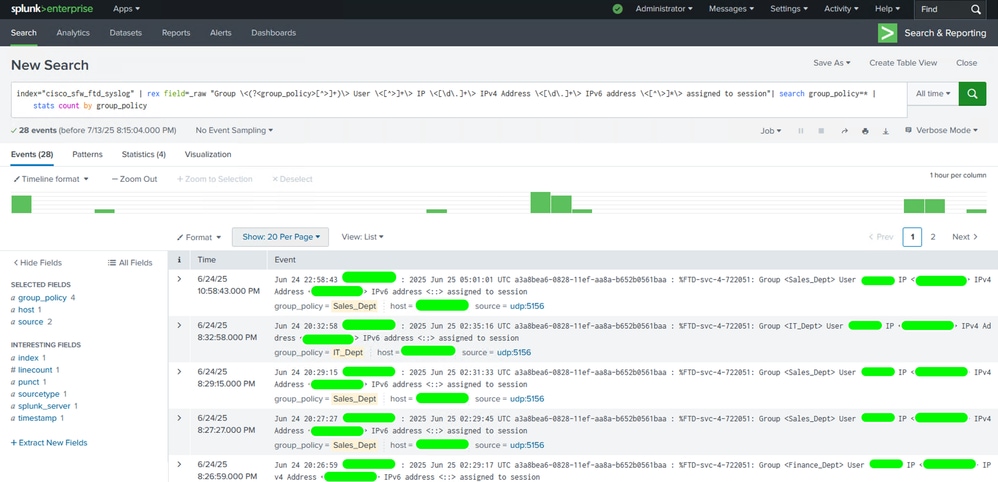 Search for Events using SPL Queries
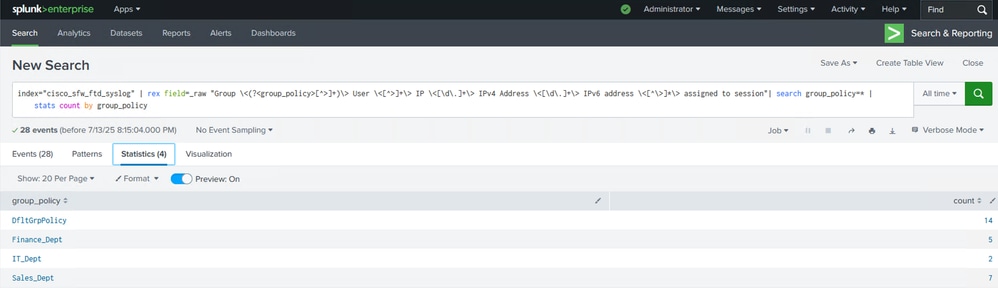 Check the Statistics Tab
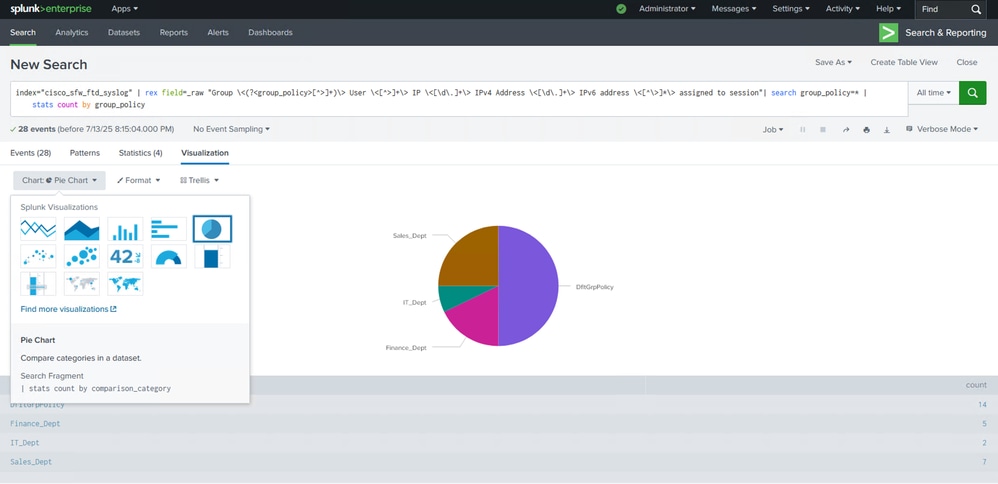 Visualization Tab Will Show the Graph/Chart
Note: In this example, the query is fetching logs for successful remote-access VPN connections across different group-policies. A pie-chart has been used in order to visualize the number and percentage of successful connections per group-policy. Based on your requirments and preferences, you can choose to use a different type of visualization such as a bar graph as well.
Step 3. Click Save As and choose New or Existing dashboard depending whether you already have a dashboard to which you want to add this panel or you want to create a new one. This examples showcases the latter.
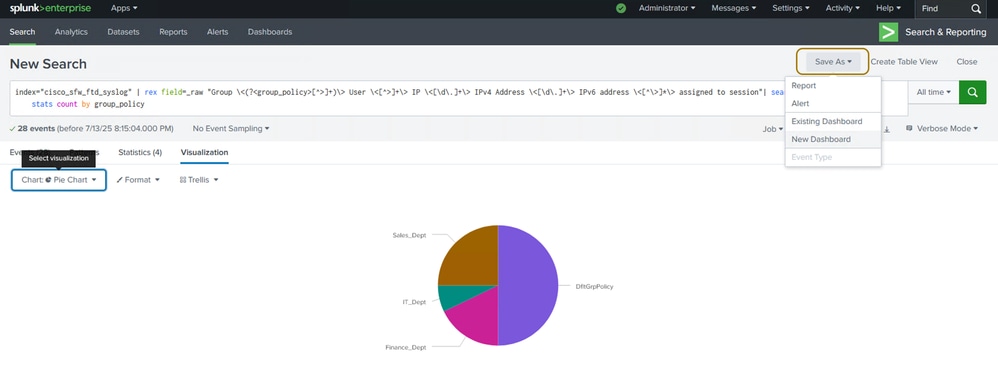 Save the Panel to a Dashboard
Step 4. Give a title to the dashboard you are creating and provide a title for the panel which will contain the pie-chart.
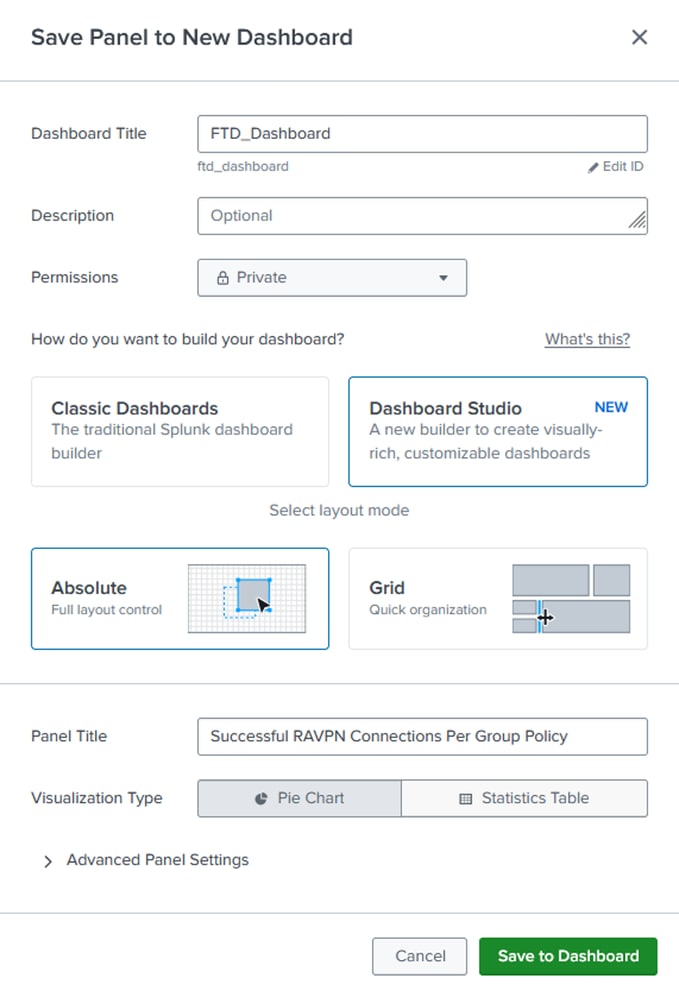 Settings for the New Dashboard
Note: You can set the permissions to Private or Shared in App based on whether only you are supposed to view the dashboard or other users with access to the Splunk instance are allowed too. Furthermore, depending on whether or not you want granular control over panel settings and layout of the dashboard, choose the Classic or Dashboard Studio mode to build your dashboard.
Step 5 (Optional). Execute and save more SPL queries as panels to this dashboard as per your requirement using the earlier mentioned steps.
Step 6. Navigate to the Dashboard tab in order to search and choose the dashboard that you have created. Click it to view, edit, or rearrange its panels.
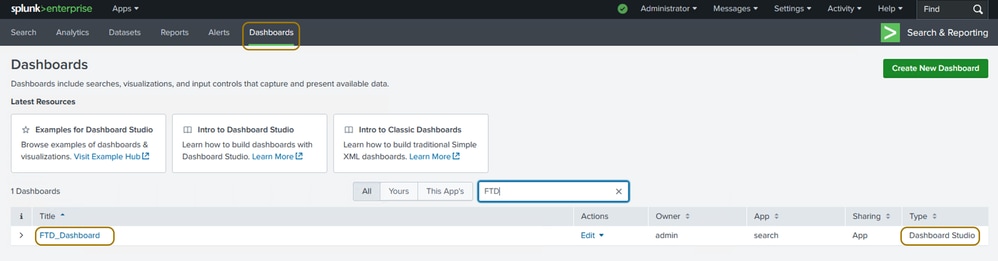 How to View the Dashboard
Configure Alerts Based on SPL Queries
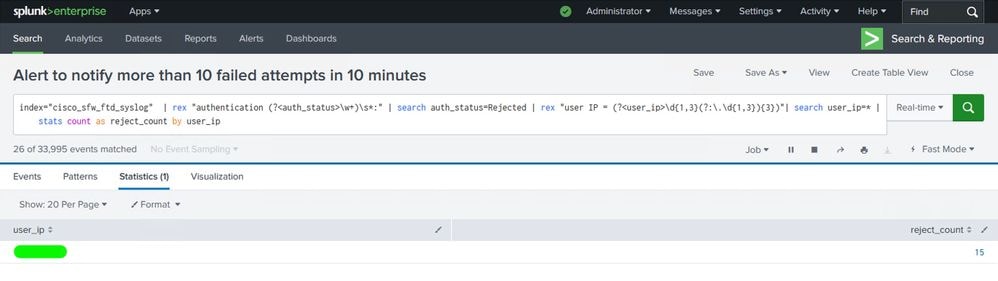
Step 1. Navigate to the Search and Reporting App to construct and run your SPL query in order to verify that it is fetching the correct logs which will be used to trigger the alert.
 Run SPL Queries for Creating Respective Alerts
Note: In this example, the query is used to fetch failed authentication logs for remote-access VPN to trigger alerts when the number of failed attempts exceed a certain threshold within a certain amount of time.
Step 3. Click Save As and choose Alert.
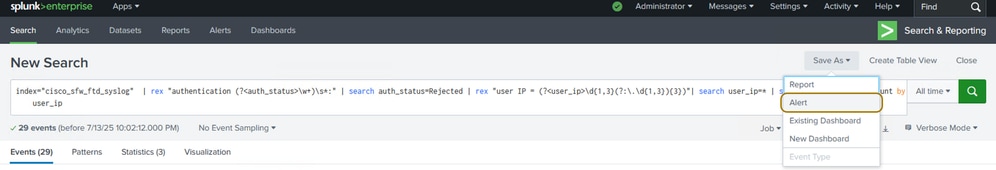 Save the Alert
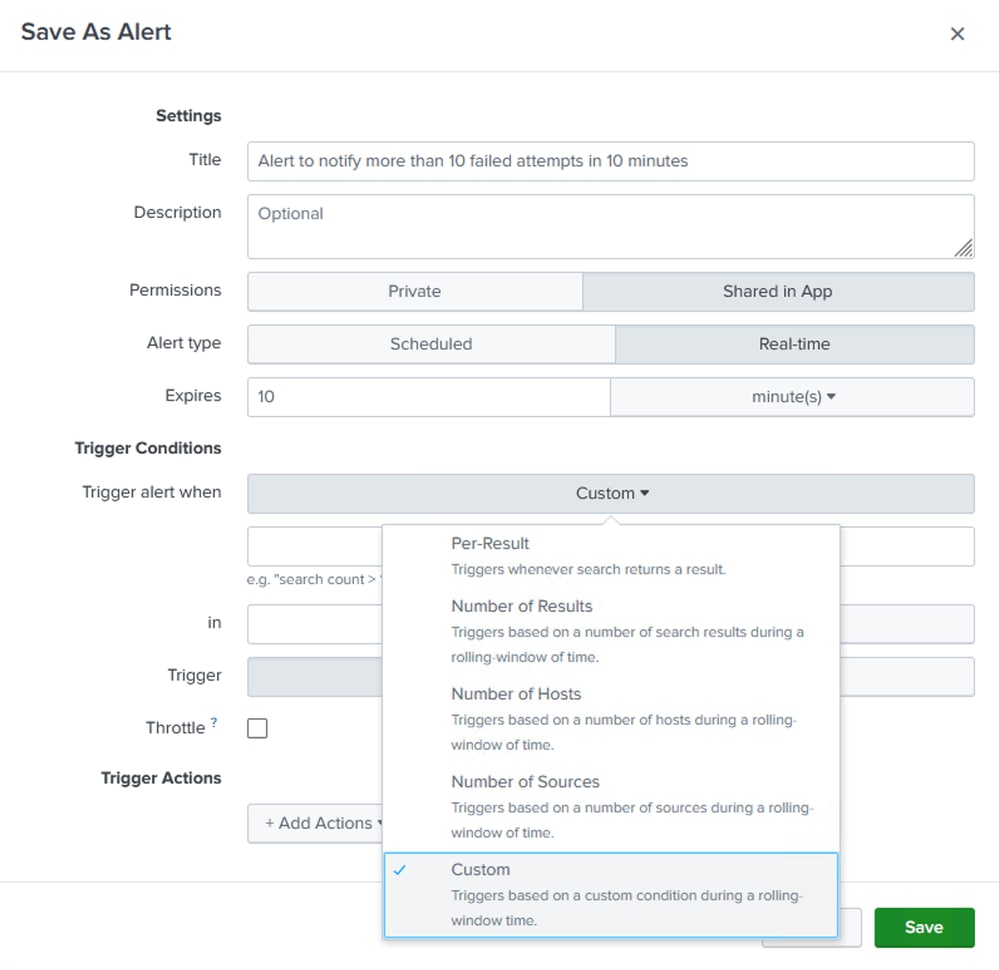
Step 4. Give a Title to name the Alert. Fill in all the other details and paramters required to configure the alert and click Save. The settings used for this alert have been mentioned here.
Permissions: Shared in App.
Alert Type: Real-time (allows failed user authentications in the last 10 minutes can be tracked continuously).
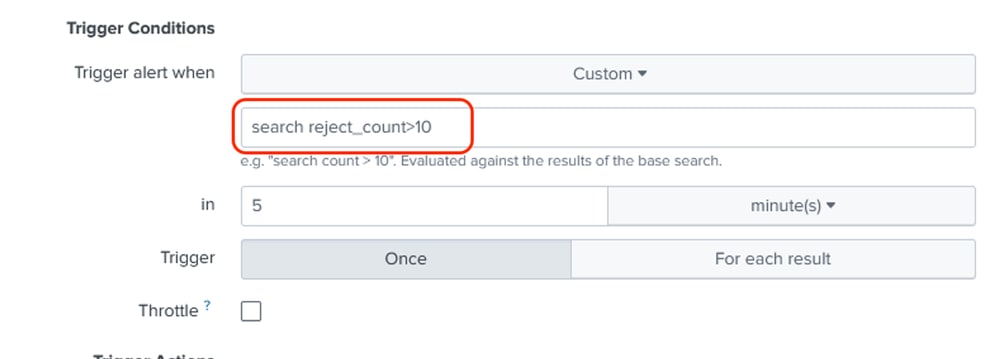
Trigger Conditions: A custom condition is used to search if the reject_count counter from the SPL query has exceeded 10 in the last 5 minutes for any IP address.
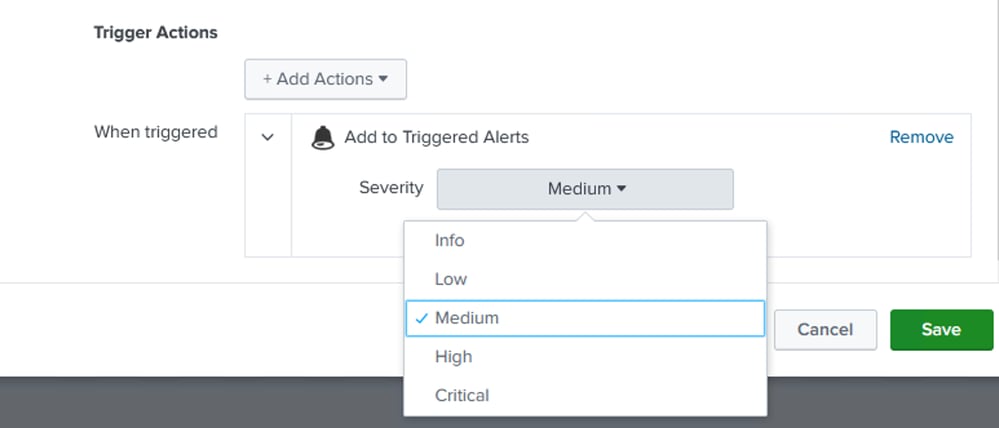
Trigger Actions: Set a trigger action such as Add to Triggered Alerts, Send email, etc. and set the alert severity as per your requirement.
 Additional Settings for Alert Creation
 Additional Settings for Alert Creation
 Additional Settings for Alert Creation
Note: If you want to trigger the alerts for each result, you will have to define the throttling settings accordingly as well.
Verify
Once you have created the dasboards and alerts, you can verify the configurations, data flow, dashboards and real-time alerts using the instructions provided in this section.
View Logs
You can use the search app in order to confirm if the logs sent by the firewall are received and visble to the splunk search head. This can be verified by checking the latest logs indexed (search index = "cisco_sfw_ftd_syslog") and the time stamp associated with it.
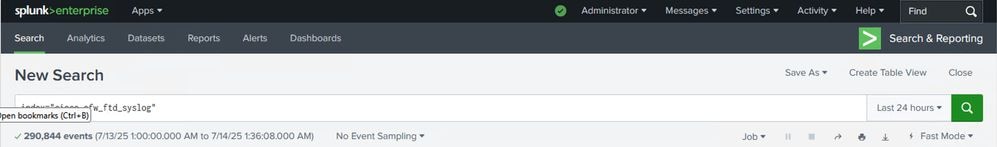 Check and View Logs
 Check and View Logs
View the Real-time Dashboards
You can navitage to the custom dashboard which you have created and see the change on each of the panels as new data and logs are generated from the FTD.
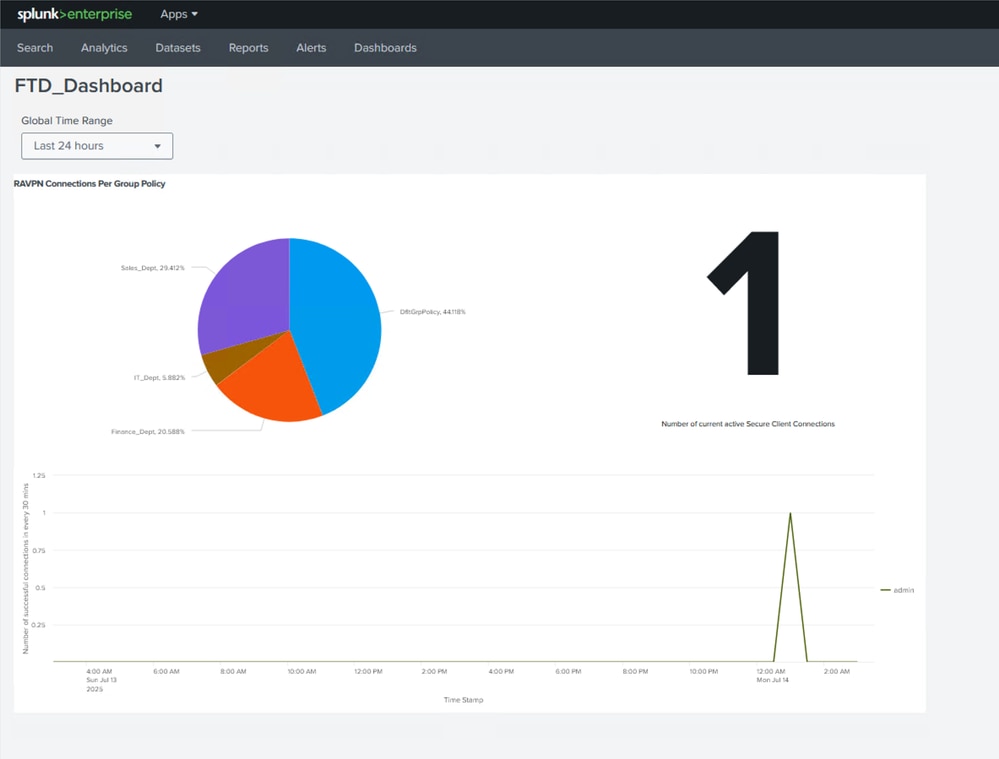 View Dashboards
Check if Any Alerts Have Been Triggered
In order to verify the information about the alerts you can navigate to the section searches, reports, and alerts to see the recent alert information. Click View Recent in order to check further about the jobs and searches.
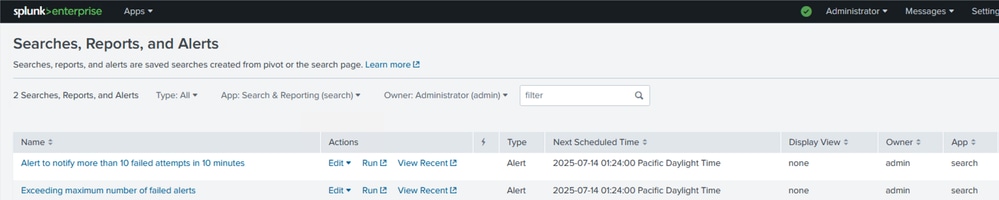 Check and View Alerts
 Check and View Alerts
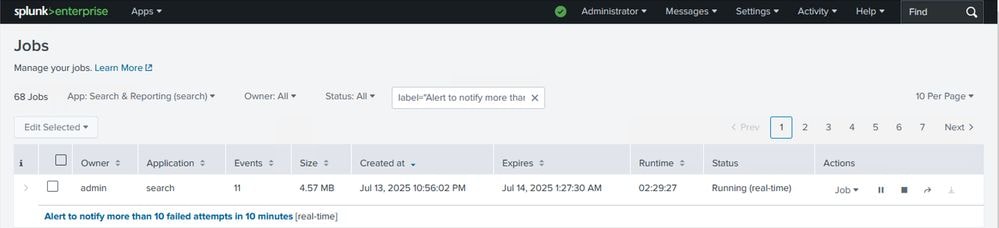
 Check Statistics for Triggered Alert
 Feedback